INTEGRATION OF GOCI AND AHI YONSEI AEROSOL OPTICAL DEPTH PRODUCTS DURING THE 2016 KORUS-AQ AND 2018 EMERGE CAMPAIGNS
←
→
Page content transcription
If your browser does not render page correctly, please read the page content below
Atmos. Meas. Tech., 14, 4575–4592, 2021
https://doi.org/10.5194/amt-14-4575-2021
© Author(s) 2021. This work is distributed under
the Creative Commons Attribution 4.0 License.

Integration of GOCI and AHI Yonsei aerosol optical depth products
during the 2016 KORUS-AQ and 2018 EMeRGe campaigns
Hyunkwang Lim1 , Sujung Go1,a,b , Jhoon Kim1,2 , Myungje Choi1,a,b , Seoyoung Lee1 , Chang-Keun Song3 , and
Yasuko Kasai4
1 Department  of Atmospheric Sciences, Yonsei University, Seoul 03722, Republic of Korea
2 ParticulateMatter Research Institute, Samsung Advanced Institute of Technology, Suwon 16678, Republic of Korea
3 School of Urban and Environmental Engineering, Ulsan National Institute of Science and Technology,

Ulsan 44919, Republic of Korea
4 National Institute of Information and Communications Technology, Tokyo 184-8759, Japan
a current address: Joint Center for Earth Systems Technology, University of Maryland,

Baltimore County, Baltimore, MD 21250, USA
b current address: NASA Goddard Space Flight Center, Greenbelt, MD 20771, USA

Correspondence: Jhoon Kim (jkim2@yonsei.ac.kr)

Received: 20 August 2020 – Discussion started: 17 September 2020
Revised: 19 April 2021 – Accepted: 20 April 2021 – Published: 21 June 2021

Abstract. The Yonsei Aerosol Retrieval (YAER) algorithm            mean AOD bias values used for MLE fusion are correct, the
for the Geostationary Ocean Color Imager (GOCI) retrieves          MLE fused products show better accuracy, but the ensemble-
aerosol optical properties only over dark surfaces, so it is im-   mean products can still be useful as MLE.
portant to mask pixels with bright surfaces. The Advanced
Himawari Imager (AHI) is equipped with three shortwave-
infrared and nine infrared channels, which is advantageous
for bright-pixel masking. In addition, multiple visible and        1   Introduction
near-infrared channels provide a great advantage in aerosol
property retrieval from the AHI and GOCI. By applying              Aerosols are generated by human activities and natural pro-
the YAER algorithm to 10 min AHI or 1 h GOCI data at               cesses on local to global scales, and they have a lifetime of
6 km × 6 km resolution, diurnal variations and aerosol trans-      several to tens of days. Aerosols affect Earth’s radiative en-
port can be observed, which has not previously been possi-         ergy balance by scattering and absorption (e.g., Cho et al.,
ble from low-Earth-orbit satellites. This study attempted to       2003). High aerosol loadings are persistent in Northeast Asia,
estimate the optimal aerosol optical depth (AOD) for East          including diverse aerosol types from various sources. Inter-
Asia by data fusion, taking into account satellite retrieval un-   actions among aerosols, clouds, and radiation in the atmo-
certainty. The data fusion involved two steps: (1) analysis        sphere cause significant uncertainties in climate-model cal-
of error characteristics of each retrieved result with respect     culations (IPCC, 2013). Datasets produced by satellites have
to the ground-based Aerosol Robotic Network (AERONET),             been widely used to reduce such uncertainties (Saide et al.,
as well as bias correction based on normalized difference          2014; Pang et al., 2018), but the systems must be accurately
vegetation indexes, and (2) compilation of the fused prod-         calibrated, verified, and consistent. Satellite data have been
uct using ensemble-mean and maximum-likelihood estima-             used extensively to retrieve aerosol optical properties (AOPs)
tion (MLE) methods. Fused results show a better statistics in      over broad areas, with several algorithms having been de-
terms of fraction within the expected error, correlation coeffi-   veloped. Satellites in low Earth orbit (LEO), including Sun-
cient, root-mean-square error (RMSE), and median bias error        synchronous orbit (SSO), cover the entire Earth over one to
than the retrieved result for each product. If the RMSE and        several days, depending on instrument and orbit characteris-
                                                                   tics. Most aerosol retrieval algorithms have been developed

Published by Copernicus Publications on behalf of the European Geosciences Union.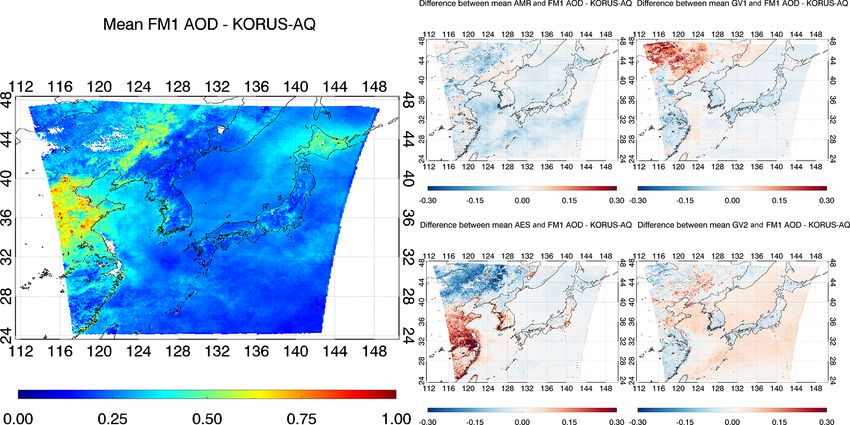
4576                                    H. Lim et al.: Integration of GOCI and AHI Yonsei aerosol optical depth products

for LEO satellites (Kim et al., 2007; Lyapustin et al., 2011a,     stationary Operational Environmental Satellite (GOES) se-
b; Lee et al., 2012; Fukuda et al., 2013; Hsu et al., 2013; Levy   ries in the USA (Knapp et al., 2005), Meteosat series in Eu-
et al., 2013; Garay et al., 2017, 2020). LEO instruments cur-      rope (Bernard et al., 2011), Himawari series in Japan (Yoon
rently on board satellites include the Moderate Resolution         et al., 2007; Kim et al., 2008; Lim et al., 2018; Kikuchi et al.,
Imaging Spectrometer (MODIS), Visible Infrared Imaging             2018; Yoshida et al., 2018; Gupta et al., 2019), and the Geo-
Radiometer Suite (VIIRS), Multi-angle Imaging SpectroRa-           stationary Korea Multi-Purpose Satellite (GEO-KOMPSAT,
diometer (MISR), and Cloud and Aerosol Imager (CAI) (Re-           GK) series in South Korea (Kim et al., 2014, 2016; Choi
mer et al., 2005; Lyapustin et al., 2011a, b, 2018; Fukuda et      et al., 2016, 2018; Kim et al., 2020). However, previously
al., 2013; Hsu et al., 2013; Levy et al., 2013; Garay et al.,      launched geostationary meteorological satellites had only a
2017, 2020; Jackson et al., 2013; Lee et al., 2017).               single, broadband VIS channel, with which it is difficult to
   Representative algorithms developed for MODIS data in-          retrieve AOPs other than aerosol optical depth (AOD) (Wang
clude the Dark-Target (DT; Remer et al., 2005; Levy et al.,        et al., 2003; Knapp et al., 2005; Kim et al., 2008, 2014, 2016;
2013), Deep Blue (DB; Hsu et al., 2013; Sayer et al., 2014),       Bernard et al., 2011). However, the Geostationary Ocean
and Multi-Angle Implementation of Atmospheric Correction           Color Imager (GOCI) on board the GK-1 satellite – also
(MAIAC; Lyapustin et al., 2011a, b) systems, which are also        known as the Communication, Ocean, and Meteorological
applied for the succeeding VIIRS (Sayer et al., 2018). In the      Satellite (COMS) – has six VIS and two near-infrared (NIR)
DT algorithm, the 2.1 µm channel is used to estimate land-         channels, which is advantageous for retrieving AOPs (Lee et
surface reflectance in the visible (VIS) region using empir-       al., 2010; Choi et al., 2016, 2018; Kim et al., 2017). Next-
ical equations based on the normalized difference vegeta-          generation meteorological GEO satellite instruments – in-
tion index (NDVI). The DT algorithm has improved surface-          cluding the Advanced Himawari Imager (AHI), Advanced
reflectance modeling through consideration of the fractional       Baseline Imager (ABI), and Advanced Meteorological Im-
area of urbanization (Gupta et al., 2016). Ocean-surface re-       ager (AMI) – have three to four VIS and NIR channels,
flectance is estimated using the Cox and Munk method (Cox          which enable aerosol property retrieval with high accuracy
and Munk, 1954), and AOPs over land and ocean are pro-             (Lim et al., 2016, 2018; Kikuchi et al., 2018; Yoshida et al.,
vided at spatial resolutions of 10 km×10 km and 3 km×3 km          2018; Gupta et al., 2019). Kikuchi et al. (2018) and Yoshida
(Remer et al., 2013), respectively. The DB algorithm has an        et al. (2018) performed aerosol retrievals using the MRM
advantage over the DT algorithm in allowing aerosol data re-       and corrected reflectance using empirical equations. Gupta et
trieval over bright surfaces. By using a shorter-wavelength        al. (2019) extended the MODIS DT algorithm to GEO satel-
channel, accuracy is improved over bright surfaces such as         lites and estimated visible surface reflectance using short-
urban and desert areas, where surface reflectance was previ-       wave IR (SWIR) reflectance. Lim et al. (2018) retrieved the
ously estimated by the minimum-reflectance method (MRM;            AOPs using both MRM and estimated surface reflectance
Herman and Celarier, 1997; Koelemeijer et al., 2003; Hsu           from SWIR data (ESR) and presented the two merged prod-
et al., 2004). Furthermore, with the improvement to Collec-        ucts: an L2-AOD merged product and a reprocessed AOD
tion 6.1, land-surface reflectance can be estimated similarly      produced by merging MRM and ESR surface reflectances.
to the DT method over densely vegetated regions (Sayer et          The MRM gives better accuracy over brighter surfaces such
al., 2019). In the case of VIIRS DB, aerosol retrieval over        as urban areas, while the ESR method gives better accuracy
the ocean is also applied by the Satellite Ocean Aerosol Re-       over areas of dense vegetation (Lim et al., 2018). However,
trieval (SOAR) algorithm (Sayer et al., 2018). In the MODIS        there is a critical surface reflectance at which aerosol signals
MAIAC system, surface reflectance is estimated by consider-        disappear, depending on the single-scattering albedo (Kim et
ing various images based on time-series analysis, with multi-      al., 2016). Over the ocean, both the MRM and ESR methods
angle observations based on up to 16 d data, and by applying       give high accuracy, but ESR results are robust with the Cox
the bidirectional reflectance distribution function (BRDF).        and Munk model.
Ocean-surface reflectance is determined using a Cox and               The MRM requires more computational time than the ESR
Munk BRDF model similar to DT and VIIRS DB (Lya-                   method to estimate surface reflectance, as it requires data for
pustin et al., 2011a, b, 2018). The MISR observes Earth            the past 30 d, and Lambertian equivalent reflectance (LER)
at nine different angles, providing a high degree of free-         needs to be calculated using a radiative transfer model. The
dom for signals; consequently, retrievals yield estimates of       ESR method estimates surface reflectance from the observed
aerosol type and shape. As with the MAIAC, multiple ob-            top-of-atmosphere (TOA) reflectance at 1.6 µm wavelength
servations are used, with the estimation of land-surface re-       using empirical equations including the NDVI. The advan-
flectance involving bidirectional reflectance factors. Zhang       tage of MRM is that stable surface-reflectance values can be
et al. (2016) developed an aerosol retrieval algorithm that al-    obtained regardless of surface type. However, due to the in-
lows aerosol data retrieval over bright land surfaces using        fluence of background aerosol optical depth (BAOD), surface
surface-reflectance ratios from the VIIRS.                         reflectance tends to be overestimated, with satellite-derived
   Aerosol retrieval algorithms for geosynchronous Earth or-       AOD data thus being underestimated (Kim et al., 2014).
bit (GEO) satellites have been developed, including the Geo-       On the other hand, the ESR method uses TOA reflectance

Atmos. Meas. Tech., 14, 4575–4592, 2021                                             https://doi.org/10.5194/amt-14-4575-2021
H. Lim et al.: Integration of GOCI and AHI Yonsei aerosol optical depth products                                                 4577

at 1.6 µm wavelength to detect surface signals, which is            filling pixels that are difficult to retrieve due to clouds, albeit
less sensitive to fine particles and BAOD. However, when            with somewhat reduced accuracy. Gap-filled AOD using the
aerosols such as yellow dust with coarse particles are trans-       BME method and satellite-derived AOD discontinuity arise
ported from the Taklamakan and Gobi deserts, the BAOD ef-           from insufficient temporal sampling being available with the
fect also applies to the ESR method. The ESR method is also         use of LEO satellites, resulting in a low fusion synergy. Pre-
more likely to be affected by snow surfaces than the MRM,           vious studies mentioned above include data fusion based on
as snow reduces reflectivity around the 1.6 µm wavelength           kriging, reproduction of spectral AOD, and the BME method.
(Negi and Kokhanovsky, 2011). The ESR method also has               Most of them focus on gap filling and rebuild AOD in areas
the disadvantage of giving noisy results over bright surfaces       not observed by MISR, MODIS, SeaWiFS, and so on (Wang
such as desert. However, its fast surface-reflectance estima-       et al., 2013; Tang et al., 2016). However in this study, we fo-
tion enables near-real-time retrieval based on the AHI Yonsei       cused on optimized AOD products with improved accuracy
Aerosol Retrieval (YAER) algorithm.                                 at the retrieved pixels by ensemble-mean and MLE fusion.
   Algorithms developed to date for LEO and GEO satellites          We compared these two products, one very simple one and
have both advantages and disadvantages, depending on algo-          the other with more elaborated processes. As previous AOD
rithm characteristics. Therefore, the MODIS team provides           fusion studies improved the retrieved results mainly based
combined DT and DB AOD products (Levy et al., 2013;                 on MLE or NDVI-based fusion studies (Bilal et al., 2017;
Sayer et al., 2014). In addition, several studies of the fusion     Levy et al., 2013; Wei et al., 2019; Go et al., 2020), we tried
of L2 products have been conducted (Levy et al., 2013; Sayer        to further improve them with an efficient approach to save
et al., 2014; Wei et al., 2019), with Bilal et al. (2017) obtain-   computation time considering the nature of satellite data file
ing reliable results from merged DT and DB products, as in-         size and users’ near-real-time demand for data assimilation.
dicated by the NDVI in East Asia, and also robust products              In this study, the GEO satellite dataset was used to resolve
by simply averaging DT and DB without consideration of the          the temporal sampling issue for data fusion, while maintain-
NDVI.                                                               ing the spatiotemporal resolution retrieved from GEO satel-
   AOP data fusion in East Asia may also be achieved using          lites. We also attempted to estimate fused AOD products at
aerosol products of AMI, GOCI-2, and the Geostationary En-          550 nm with higher accuracy in East Asia. The ensemble-
vironment Monitoring Spectrometer (GEMS) on board the               mean and MLE methods were applied. Section 2 describes
GK-2A and GK-2B satellites launched by South Korea in               the two algorithms used in this study for AHI and GOCI.
2018 and 2020, respectively, with accuracy over bright sur-         Section 3 mentions methods of fusion and systematic bias
faces being improved by the GEMS aerosol product. It is             correction, and Sect. 4 performs validation of the fused prod-
also possible to obtain accurate aerosol loading height and         ucts with the Aerosol Robotic Network (AERONET) instru-
AOPs, such as single-scattering albedo and fine-mode frac-          ments during two field campaigns: the Korea–United States
tion, which have been difficult to obtain by fusion of L2 data      Air Quality Study (KORUS-AQ) and the Effect of Megac-
and/or surface-reflectance data. If the trace-gas dataset re-       ities on the Transport and Transformation of Pollutants on
trieved from GEMS is used, it is possible to improve the            Regional and Global Scales Study (EMeRGe).
aerosol type, with the retrieval of high-quality AOD data (Go
et al., 2020).
   Several studies have considered AOD data fusion, for             2     Descriptions of AHI, GOCI, and the YAER
which methods can be broadly classified into two types.                   algorithm
First, the fusion of more than one AOD product may involve
optimal interpolation (Xue et al., 2012), linear or second-         2.1    AHI aerosol algorithm
order polynomial functions (Mélin et al., 2007), arithmetic or
weighted means (Gupta et al., 2008), or maximum-likelihood          The Himawari-8 and Himawari-9 satellites were launched
estimates (MLEs) (Nirala, 2008; Xu et al., 2015; Xie et al.,        by the Japanese Meteorological Agency (JMA) on 7 Octo-
2018). Second, in the absence of satellite-derived AOD prod-        ber 2014 and 2 November 2016, respectively. The AHI on
ucts for the day of fusion, the geostatistical fusion method,       board these satellites has 16 channels covering wavelengths
universal kriging method (Chatterjee et al., 2010; Li et al.,       of 0.47–13.3 µm and performs full-disk and Japan-area ob-
2014), geostatistical inverse modeling (Wang et al., 2013), or      servations every 10 and 2.5 min, respectively, from GEO at
spatial statistical data fusion (Nguyen et al., 2012) may be ap-    140.7◦ E longitude (Bessho et al., 2016). Visible and NIR
plied. These have the advantage that AOD can be estimated           observations are also performed at high spatial resolutions
by integrating the spatial autocorrelation of AOD data even         of 0.5–1.0 km, with SWIR to IR at 2 km, which have advan-
for pixels missing from the AOD products, although there            tages in aerosol property retrieval and cloud masking.
is a disadvantage in not considering temporal correlations.            Lim et al. (2018) developed the AHI YAER algorithm and
The Bayesian maximum entropy (BME) method, taking into              provided two retrieval results with 6 km × 6 km resolution
account temporal autocorrelation, has also been developed           based on MRM and ESR using SWIR data. Aerosol prop-
(Tang et al., 2016). BME methodology can estimate gap-              erty retrieval using VIS channels requires accurate surface re-

https://doi.org/10.5194/amt-14-4575-2021                                               Atmos. Meas. Tech., 14, 4575–4592, 2021
4578                                    H. Lim et al.: Integration of GOCI and AHI Yonsei aerosol optical depth products

flectance, for which MRM and ESR are useful, with the main         3     Data fusion methods
difference between the two lying in the surface-reflectance
estimation method.                                                 Satellite-derived AODs have different error characteristics
   The MRM applies the minimum-reflectance technique               depending on NDVI, scattering angle, and so on (Choi et al.,
over both land and ocean (Lim et al., 2018), with sur-             2016, 2018; Lim et al., 2018). Over oceans, ESR AODs are
face reflectance being estimated by finding the minimum re-        more accurate than MRM AODs. However, the accuracy of
flectance in each pixel over the past 30 d window, giving          GOCI AODs was dependent on the NDVI values, which rep-
the LER (Kim et al., 2016; Lim et al., 2018). This method          resent surface condition in terms of vegetation. V1 has a neg-
takes the bidirectional characteristics of surface reflectance     ative bias, and V2 has a mostly a positive bias (Choi et al.,
into consideration by obtaining surface reflectance at each        2018). In this study, we developed optimal AOD products at
observation time over the 30 d search window. However, the         550 nm in East Asia by fusing four individual retrievals, i.e.,
method assumes that there is more than one clear day dur-          two AHI aerosol products from the MRM and ESR methods
ing the search window and that surface reflectance does not        and the two GOCI products: V1 and V2.
change; otherwise, it is affected by clouds and/or the BAOD
(Kim et al., 2014, 2021).                                          3.1    Spatiotemporal matching
   According to the ESR method, land-surface reflectance
in the VIS region is constructed from the TOA reflectance          The AHI and GOCI have different spatial pixel locations and
at 1.6 µm wavelength, based on the NDVI for SWIR and               temporal resolutions, so it is necessary to match their spa-
the fraction of urbanization and cropland (Levy et al.,            tiotemporal resolutions before data fusion. GOCI and AHI
2013; Gupta et al., 2016; Zhong et al., 2016; Lim et al.,          AODs have the same spatial resolution of 6 km×6 km, but the
2018). Ocean-surface reflectance is estimated from the Cox         two satellites are located at 128.2 and 140.7◦ E, respectively,
and Munk BRDF model (Cox and Munk, 1954). Chloro-                  at the Equator. Spatial pixel matching is therefore required.
phyll a concentrations are considered in addition to chloro-       However, satellite-derived AOD represents total-column ex-
phyll a concentration data (https://www.eorc.jaxa.jp/ptree/        tinction, so AOD retrieved by the two sensors is not sig-
userguide.html, last access: 27 May 2021) from the Japan           nificantly affected by satellite position. To merge the differ-
Aerospace Exploration Agency (JAXA) (Murakami, 2016)               ent satellite spatial pixel coverages, the GOCI pixel was re-
and interpolated for the 10 min AHI intervals. For unre-           gridded to match AHI pixels for full-disk observation, with
trieved pixels, the less contaminated chlorophyll a concen-        up to four GOCI AOD pixels being used, with average values
tration value of 0.02 mg m−3 is used. Details of the method-       considered representative of pixel values. If more than half
ology can be found in Lim et al. (2018).                           of the AHI AOD pixels did not exist out of the maximum six
                                                                   AHI data per hour, it is regarded as cloud-contaminated pix-
2.2    GOCI aerosol algorithm                                      els, and an additional cloud removal process is performed.
                                                                   This process applies to both the MRM and ESR method, to
GOCI is an ocean color imager in GEO launched on board             remove the AHI’s additional cloud-contaminated pixels in
COMS in 2010 and observes the East Asia region at an               products of both GOCI V1 and V2, which have a disadvan-
hourly interval with 500 m × 500 m resolution (Choi et al.,        tage in cloud masking due to their lack of IR channels. When
2012). It has eight bands in the VIS and NIR regions, which        three or more pixels were available for generating AHI data
is advantageous for aerosol retrieval. Two versions of GOCI        at 1 h intervals, hourly AOD values were estimated as the
Yonsei aerosol algorithms have been developed, referred to         medians of pixel values.
as V1 and V2 (Lee et al., 2010; Choi et al., 2016, 2018). In
the case of V1, surface reflectance is estimated by the MRM        3.2    Ensemble-mean method
using LER for the past 30 d over land and the Cox and Munk
BRDF model over oceans. In V2, ocean-surface reflectance           Here, AMR represents AHI MRM AOD, AES represents
is estimated by the same method, but land-surface reflectance      AHI ESR AOD, GV1 represents GOCI V1 AOD, and GV2
is improved by using an accumulated long-term database. To         represents GOCI V2 AOD. We performed data fusion us-
minimize the impact of BAOD (the weakness of the MRM),             ing AMR, AES, GV1, and GV2 data within 1 h intervals
a monthly surface-reflectance database was constructed us-         for which additional cloud masking was performed. The en-
ing all of the LERs over the past 5 years, but it cannot reflect   semble mean is the mean of the ensemble member over a
unexpected changes in surface conditions. However, a well-         specific time. The ensemble members are AMR, AES, GV1,
established climatological database allows aerosol property        and GV2 based on two satellite instruments and two differ-
retrieval in near-real time with reasonable accuracy.              ent surface-estimation methodologies. Table 1 provides the
                                                                   satellite-derived AOD used for ensemble-mean and MLE fu-
                                                                   sion.
                                                                      Fusion was performed only when a pixel of an ensemble
                                                                   member was used for all fusions. Fusion 1 (F1) included the

Atmos. Meas. Tech., 14, 4575–4592, 2021                                             https://doi.org/10.5194/amt-14-4575-2021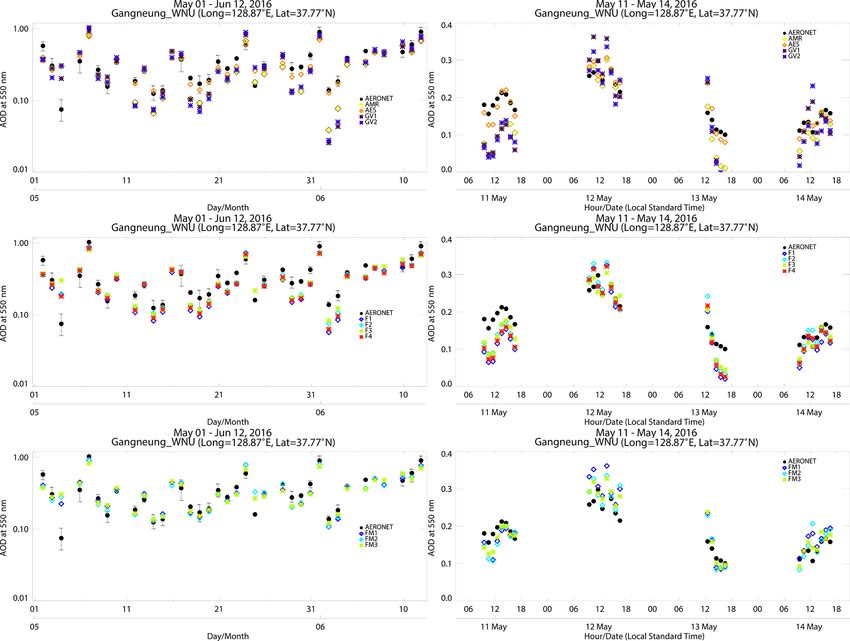
H. Lim et al.: Integration of GOCI and AHI Yonsei aerosol optical depth products                                                     4579

Table 1. Satellite dataset used for the fusion products. Four entries F1–F4 and three entries FM1–FM3 represent ensemble-mean fusion and
MLE fusion products.

      AOD type      F1                     F2               F3               F4                 FM1           FM2            FM3
      AES           o                      o                o                o                  o             o              o
      AMR           o                                       o                o                  o                            o
      GV1           o                                                                           o
      GV2           o                      o                                 o                  o             o
      Remark        All available          For NRTa         AHI only for     Without GV1                     MLE productsb
                    products                                wider area       to check miss-
                                                                             ing effect         Same as F1    Same as F2     Same as F3

  a NRT: near-real time. b Maximum-likelihood estimation.

two AHI products of AMR and AES, as well as two GOCI                       RMSE and bias correction value for each satellite product
products of GV1 and GV2. Fusion 2 (F2) involved the calcu-                 (details in Sect. 3.4) required for MLE fusion were calcu-
lation of the YAER algorithm by the fusion of AES and GV2,                 lated through comparison with AERONET from April 2018
both of which have the advantage of producing data in near-                to March 2019 excluding the EMeRGe period. The number
real time. Fusion 3 (F3) merged AMR and AES to estimate                    of AERONET sites used for validation and error estimation
AOD over a wide area. Fusion 4 (F4) involved a comparison                  in this study was 35 during the KORUS-AQ campaign and 22
with F1 to determine how accuracy varied with a decreasing                 during the EMeRGe campaign for AHI and GOCI products.
number of ensemble members, as summarized in Table 1.                         Satellite observation can cover wide areas, but the ground
                                                                           observation instrument cannot cover all satellite-observed
3.3    MLE method                                                          areas. Therefore, a RMSE model was constructed for
                                                                           AOD, time, and NDVI through comparative validation with
Similarly, FM1, FM2, and FM3 are the result of MLE fu-                     AERONET observation as shown in Fig. 1. For MLE over
sion, corresponding to F1, F2, and F3 as in ensemble mean,                 wide areas without ground measurements, the calculated
respectively (see Table 1).                                                RMSE from AOD, time, and NDVI bins was applied for
   The MLE method provides a means of weighting and av-                    every satellite pixel. We excluded points where AOD dif-
eraging based on errors evaluated with AERONET ground-                     ferences with respect to AERONET data (dAOD) were > 2
based measurements (Nirala, 2008; Xu et al., 2015; Xie et                  standard deviations (SD) to remove outliers and to consider
al., 2018).                                                                only the more stable RMSE values. According to Fig. 1, if
   This method employs the following equations:                            the AOD is less than 0.5, RMSE is about 0.1 with respect to
          XN           −2
                     Ri,k                                                  all NDVI bins, but if the AOD is greater than 0.5, the over-
τiMLE =        k=1 P N
                              τ ,
                          −2 i,k
                                                                   (1)     all RMSE value becomes large. All products excluding AES
                     k=1 Ri,k                                              show large variations for high NDVI and high AOD bins
                                                                           as shown as the red square in Fig. 1, especially for 02:00
         s
             PM
               i=1 (si,k   − gi )2                                         and 05:00 UTC in two GOCI products and 00:00 UTC in the
Ri,k =                               ,                             (2)
                     M                                                     AMR product. This is because the two GOCI products and
                                                                           AMR are relatively less accurate for densely vegetated areas,
where τiMLE represents the fused AOD; τi,k represents the
                                                                           along with sampling issues.
mean AOD at grid point i from the satellite-derived AOD
product k, where k is the index for different satellite-derived
AOD products for fusion; Ri,k represents the root-mean-                    3.4    Bias correction
square error (RMSE) at grid point i for the satellite-derived
AOD product k; N is the number of all AOD data; gi rep-                    AOD follows a lognormal distribution (Sayer and Knobel-
resents the mean of ground-based AOD at grid point i from                  spiesse, 2019), but dAOD for each satellite product follow a
AERONET (collocated temporal mean); si,k represents the                    Gaussian distribution. The quantile–quantile (Q–Q) plot is a
mean of satellite-derived AOD products (k) at grid points of               graphical statistical technique that compares two probability
AERONET (collocated spatial mean); and M is the number                     distributions with each other. The x axis represents the quan-
of pairs of si,k and gi .                                                  tile value of the directly calculated sample, and the y axis
   For RMSE estimation, bias correction, validation, and er-               represents the Z score. Here, the Z score is a dimension-
ror estimation (details in Sect. 5), AERONET Version 3                     less value that makes a statistically Gaussian distribution and
Level 2.0 aerosol products were used for ground truth (Giles               shows where each sample is located on the standard devia-
et al., 2019; Smirnov et al., 2000; Holben et al., 2001). The              tion. That is, a Z score of 1 and 2 represents 1 and 2 SD, re-

https://doi.org/10.5194/amt-14-4575-2021                                                      Atmos. Meas. Tech., 14, 4575–4592, 2021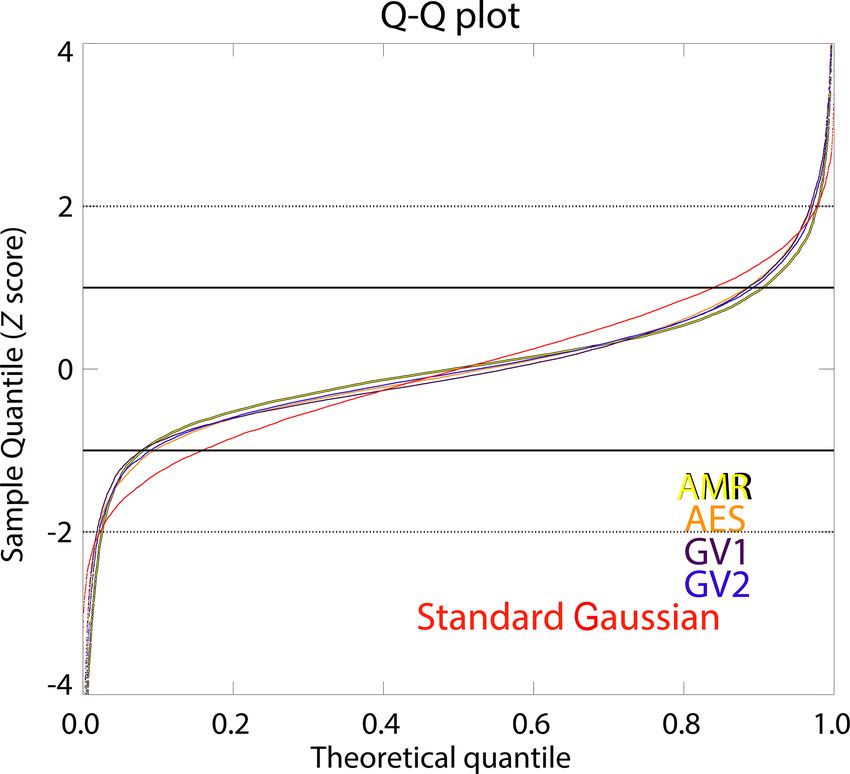
4580                                       H. Lim et al.: Integration of GOCI and AHI Yonsei aerosol optical depth products

Figure 1. RMSE according to NDVI (color), observation time, and satellite AODs (squares and diamonds represent RMSE for AOD greater
than 0.5 and less than or equal to 0.5, respectively) during April 2018 to March 2019 excluding the EMeRGe campaign. Colors represent
different NDVI bins.

                                                                       Gaussian values. Also, when the theoretical quantile is less
                                                                       than 0.5, the opposite results are shown. Thus, the sample
                                                                       quantiles are more skewed at both sides than the theoretical
                                                                       quantile, but the respective satellite product is assumed to
                                                                       follow the Gaussian distribution.
                                                                          The bias center for each satellite product was calculated
                                                                       differently for time and NDVI bins through Gaussian fitting
                                                                       in Fig. 3 of the dAOD divided by SD (except for 2 SD and
                                                                       higher), and it was subtracted from the respective product
                                                                       for correction. Data beyond 2 SD of dAOD were excluded to
                                                                       prevent a change in bias trends due to AOD errors caused by
                                                                       cloud shadows and cloud contamination. This process was
                                                                       performed before applying the MLE method, which allows
                                                                       compensation for systematic bias, which is difficult to obtain
                                                                       directly in MLE.

                                                                       3.5   Evaluation of aerosol products during two field
                                                                             campaigns
Figure 2. Q–Q plot for the difference between AERONET AOD
and AMR (yellow), AES (orange), GV1 (purple), and GV2 (dark
                                                                       The performance of the respective satellite product and fused
blue) AOD. The black solid line and dotted line represent 1 and 2σ ,   products was analyzed in two field campaigns: the KORUS-
respectively.                                                          AQ of 1 May 2016 to 12 June 2016 (https://www-air.larc.
                                                                       nasa.gov/missions/korus-aq/, last access: 27 May 2021) and
                                                                       the EMeRGe of 12 March 2018 to 8 April 2018 (https://
                                                                       www.halo.dlr.de/science/missions/emerge/emerge.html, last
spectively. In addition, if the Q–Q plot shows a linear shape,         access: 27 May 2021). KORUS-AQ was an international
the sample is regarded as following a Gaussian distribution.           multi-organization mission to observe air quality across the
   Figure 2 shows dAOD divided by SD analyzed for                      Korean Peninsula and surrounding waters, led by the US Na-
each satellite product for the period from April 2018 to               tional Aeronautics and Space Administration (NASA) and
March 2019, excluding the EMeRGe campaign, which shows                 the Korean National Institute of Environmental Research
a similar pattern to the standard Gaussian distribution. How-          (NIER) (Crawford et al., 2021). EMeRGe aimed to investi-
ever, if the theoretical quantile values are greater than 0.5,         gate experimentally the patterns of atmospheric transport and
then the sample quantile values are smaller than the standard          transformation of pollution plumes originating from Eurasia,

Atmos. Meas. Tech., 14, 4575–4592, 2021                                                 https://doi.org/10.5194/amt-14-4575-2021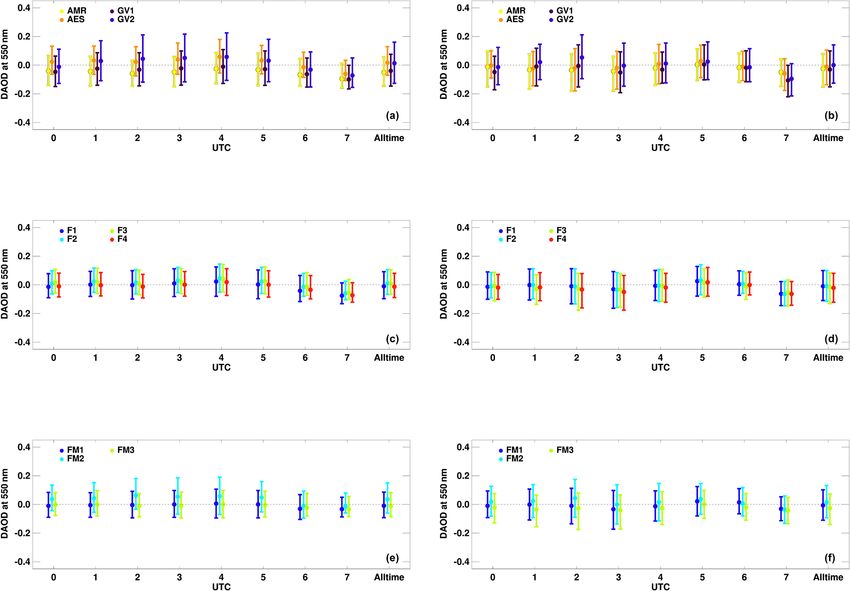
H. Lim et al.: Integration of GOCI and AHI Yonsei aerosol optical depth products 4581
Figure 3. Systematic bias-correction values for NDVI groups and temporal bins for each satellite product from Gaussian fitting analysis used
in MLE fusion. Colors represent different NDVI bins.
tropical and subtropical Asian megacities, and other major 4 Results
population centers. GEO satellite data played an important
role in these campaigns, for example in data assimilation Figure 4a shows the average AOD of FM1 (MLE method
for chemical transport models and tracking aerosol plumes with all products) during the KORUS-AQ period, and
(Saide et al., 2014, 2010; Pang et al., 2018). Fig. 4b–e show the respective difference of the average AOD
In this study, we used satellite-derived GOCI and AHI of AMR, AES, GV1, and GV2 with respect to FM1. FM1
AODs, with a spatial resolution of 6 km × 6 km and temporal was selected as the representative fused product as FM1 used
resolutions of 1 h and 10 min, respectively. Spatiotemporal all four satellite-derived products for fusion with bias correc-
correlation between satellite-derived AOD and AERONET tion. The result of the comparison with the respective satellite
AOD involved data averaged over all satellite pixels within product (Fig. 4b–e) shows different features. AMR shows a
a 25 km radius of the AERONET site and AERONET AOD negative bias over the ocean but shows similar results to FM1
averaged over ±30 min from the satellite observation time. over land, while AES shows a different tendency in northern
As validation metrics, Pearson’s correlation coefficient, the and southern China. GV1 tends to show the opposite pat-
median bias error (MBE), the fraction (percent) within the tern to AES, and GV2 shows a positive bias over the ocean
expected error of MODIS DT (EE), and the Global Climate and results in a similar pattern to FM1 over the land. In the
Observing System requirement for AOD (GCOS; GCOS, west of the Korean Peninsula, AES AOD has a positive off-
2011) were applied. The accuracy requirement of GCOS for set compared to FM1. Although the AES algorithm consid-
satellite-derived AOD at 550 nm is 10 % or 0.03, whichever ers the fraction of urbanization, there is still a tendency to
is larger. The EE provided by the MODIS DT algorithm (EE have positive AOD offsets. The main reason why AES results
as ±0.05 ± 0.15× AOD; Levy et al., 2010) was used for con- show different patterns is the different estimation process of
sistent comparison with previous studies. the land surface reflectance from that of other products.
Table 2 shows the validation metrics of the respective On the other hand, in GV1 the AOD over the Manchurian
product during the two field campaigns. The collocation region has a positive offset compared to FM1. This is because
points for validation with AERONET of two AHI and two the aerosol signal is small over bright surface, making it dif-
GOCI products were not significantly different. Percent EE ficult to retrieve aerosol properties. These features tend to be
(% EE) and percent GCOS (% GCOS) of AES and AMR alleviated in GV2, where the surface reflectance and cloud
showed better accuracy than GV1 and GV2 during the KO- removal process were improved.
RUS and the EMeRGe periods. In terms of MBE, GV2 is Figure 5 shows the same result as Fig. 4 except for
0.008 and −0.001, which shows during the KORUS-AQ the EMeRGe period. The AMR and AES AODs appeared
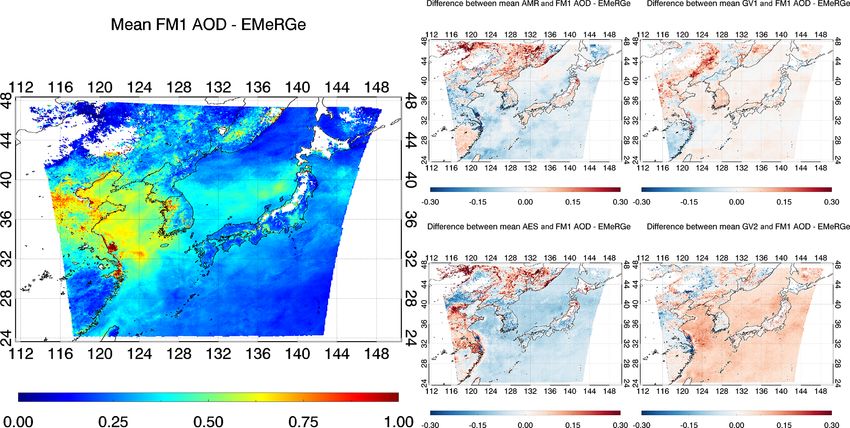
and the EMeRGe periods close to zero. Additionally, fur- high in northern China, which is thought to be the snow-
ther analyses of the respective satellite product are carried contaminated pixels. The EMeRGe period was in March–
out along with fused products in Sect. 5. April, when northern China is more covered by snow com-
pared to the KORUS-AQ period in May–June. On the other
hand, for GV1 and GV2 the effect of overestimation with
https://doi.org/10.5194/amt-14-4575-2021 Atmos. Meas. Tech., 14, 4575–4592, 2021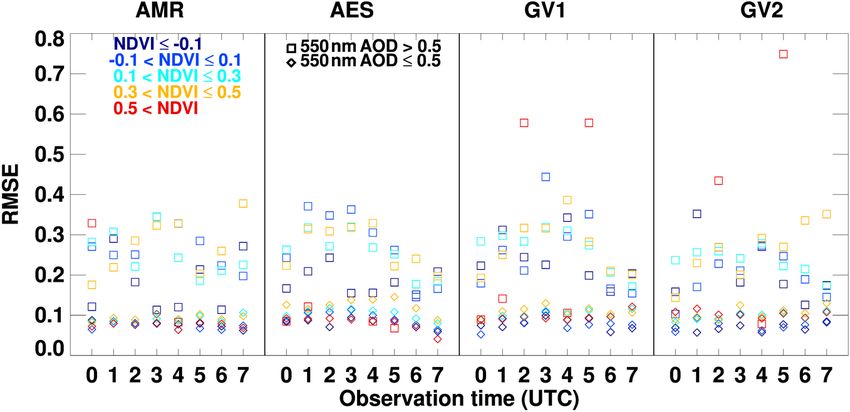
4582                                     H. Lim et al.: Integration of GOCI and AHI Yonsei aerosol optical depth products

Table 2. Validation statistics of the respective satellite product during the KORUS-AQ and the EMeRGe campaign.

                                            KORUS-AQ                                              EMeRGe
            Product type   % EE     % GCOS      RMSE        MBE           N     % EE    % GCOS     RMSE      MBE       N
            AES             63.5        43.6     0.145     0.029    5069         65.2      46.3     0.176   −0.011   1884
            AMR             60.6        39.4     0.150    −0.054    5069         69.4      52.4     0.162   −0.028   1884
            GV1             52.2        34.7     0.153    −0.045    4843         63.4      42.7     0.162   −0.035   1760
            GV2             50.3        33.8     0.176     0.008    4924         61.5      41.8     0.164   −0.001   1863

Figure 4. The average AOD of (a) FM1 (AMR, AES, GV1, and GV2) during the KORUS-AQ. The difference of mean (b) AMR, (c) AES,
(d) GV1, and (e) GV2 AODs with respect to mean representative (FM1) AOD. Figures generated with Interactive Data Language (IDL)
version 8.8.0.

snow-contaminated pixels is relatively small, as their snow           5       Validation, comparison, and error estimation against
masking is performed well. However, for the KORUS-AQ                          AERONET
period, it seems that the GV1’s overestimation of AOD in
northern China still remains. Since this analysis (Figs. 4            5.1      Validation for fused AOD products with
and 5) is for the fusion between the three MRM results and                     AERONET
one ESR result, the average field difference is naturally the
largest in AES which uses the ESR method.                             The spatiotemporal matching method between fused AOD
   For the characteristics of the average AOD for the two             and AERONET was performed as mentioned above in
campaign periods, high AODs during the KORUS-AQ pe-                   Sect. 3.5, and the statistics indices used for verification are
riod were found in eastern China and Hokkaido as wildfires            also the same. Validation indices of fused products with
from Russia were transported to Hokkaido (Lee et al., 2019).          AERONET AOD during the two campaign periods are sum-
Meanwhile, during the EMeRGe period, high AOD is shown                marized in Table 3. During the KORUS-AQ, fused AODs
over the Yellow Sea as aerosols were transported from China           have better accuracy than the respective satellite product in
to the Korean Peninsula through the west coast, contrary to           terms of % EE and % GCOS. The % EE and % GCOS of
the KORUS-AQ period. Overall, the average AODs for the                AES, which showed the best accuracy among the respec-
EMeRGe are less smooth than those of the KORUS-AQ pe-                 tive products, are 63.5 % and 43.6 %, respectively, which are
riod. This is because the EMeRGe period was shorter than              poorer than the worst accuracy of the fused AOD. All RMSE
the KORUS-AQ period, and the retrieval accuracy was lower             has been improved except for FM2. The RMSE of FM2 is
due to the bright surface.                                            higher than the RMSE of the respective satellite product by

Atmos. Meas. Tech., 14, 4575–4592, 2021                                                  https://doi.org/10.5194/amt-14-4575-2021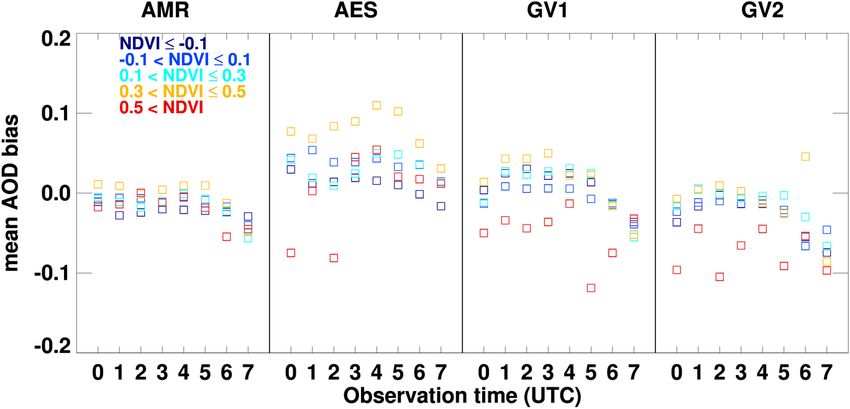
H. Lim et al.: Integration of GOCI and AHI Yonsei aerosol optical depth products 4583
Figure 5. Same as Fig. 4 but for the EMeRGe campaign.
0.001. Although all MBEs show different patterns, the devi- each satellite product, with AMR and GV1 being negative
ation of the fused products tends to be smaller. GV2 and F2 and AES and GV2 being positive. The errors are close to
show MBE of 0.008, close to zero. zero for both the ensemble-mean and MLE products except
Next, % EE for the EMeRGe period exceeded 60.0, with for FM2 as a result of the fusion process.
AMR having the best accuracy of 69.4. Likewise, % GCOS When the NDVI is small, the mean AOD bias for GV2
was also the highest, with 52.4, which showed better accu- dAOD is close to zero, but when the NDVI is large, the mean
racy than the fused product. In terms of MBE, GV2 was the AOD bias is negative as shown in Fig. 3. The bias correc-
best, with −0.001. The fused products did not have the best tion effect of GV2 shows a small effect for small NDVI bins
statistical values, but they show overall better statistical val- and a large effect for large NDVI bins. In fact, the collocated
ues. dAODs of FM2 are close to zero when the NDVI bins are
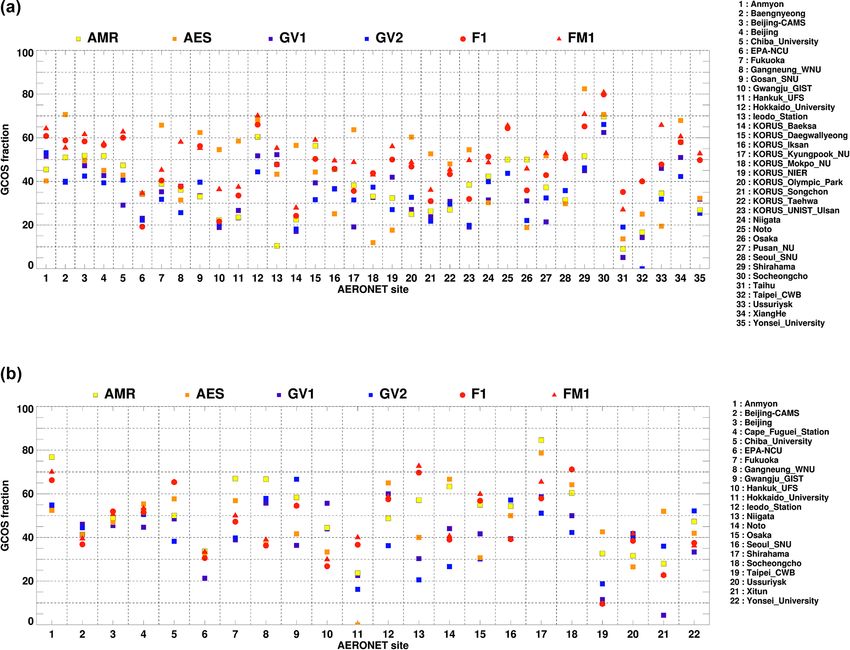
Figure 6 shows the % GCOS for the respective satellite greater than 0.4 (in Fig. 7a).
product and fused products at each validation site during each During the EMeRGe campaign (right column, Fig. 7), the
campaign. In Fig. 6a, for the KORUS period, F1 and FM1 two AHI and two GOCI products show negative biases, and
show the highest % GCOS at 20 sites out of 35. Other than even the ensemble-mean results have negative biases. The en-
the fused result, AES shows the highest % GCOS at 13 sites, semble mean does not include any bias correction, meaning
which are mostly dense vegetation area and coastal sites. On that the error characteristics of each original satellite prod-
the other hand, during the EMeRGe period the % GCOS of uct are intact. The MLE products display improved biases in
fused products was highest at 7 sites out of 22, while the terms of NDVI, which are close to zero because the bias was
respective satellite product showed similar proportions at the corrected for in the MLE process.
rest of the sites. During the EMeRGe period, the collocated dAOD values
at NDVI around 0.1 have a negative value for all satellite-
5.2 Error estimation derived products (especially AHI products), and GV1 has a
negative value for bins where NDVI is greater than 0.2. The
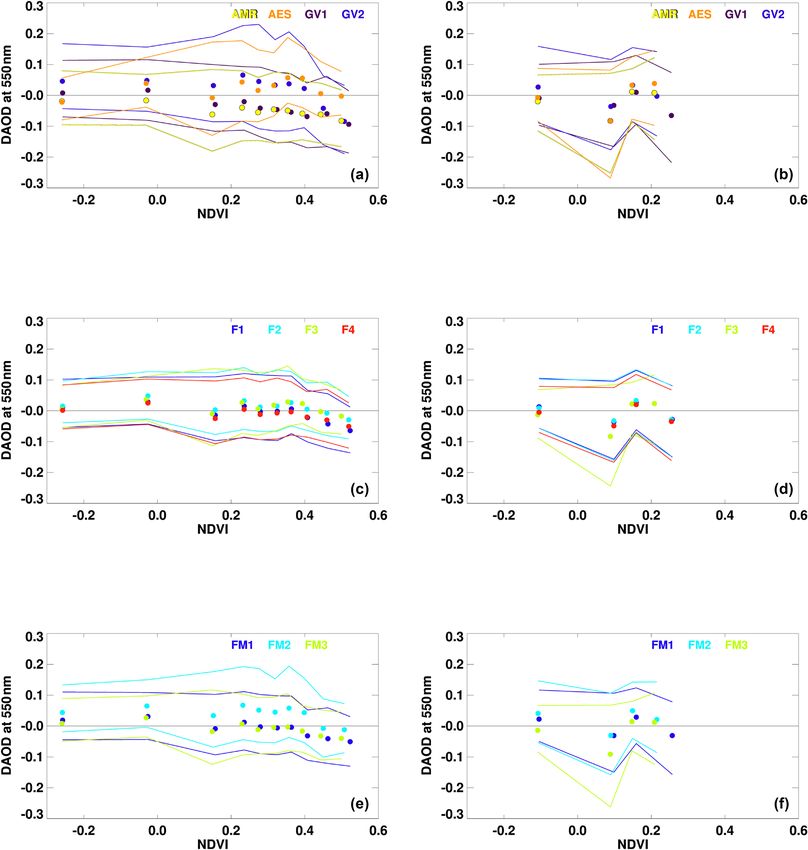
Differences between satellite products and dAOD values fused products tend to have error close to zero except for F3
were analyzed in terms of NDVI and observation times and FM3. In terms of F3, the collocated dAOD value around
(Fig. 7). Figure 7a and b show the respective satellite product, 0.1 of the NDVI bin has negative values for both AMR and
Fig. 7c and d the ensemble-mean product, and Fig. 7e and AES, so the collocated dAOD of F3 remain negative. The
f the MLE fusion results, with each filled circle represent- mean AOD bias values for FM3, AMR, and AES (in Fig. 3)
ing the mean of 500 and 400 collocated data points sorted are close to zero for NDVI at around 0.1, so the bias cor-
in terms of NDVI for the KORUS-AQ and the EMeRGe rection effect is small. This can be explained by the fact
campaigns, respectively. Figure 7a shows different biases for
https://doi.org/10.5194/amt-14-4575-2021 Atmos. Meas. Tech., 14, 4575–4592, 20214584 H. Lim et al.: Integration of GOCI and AHI Yonsei aerosol optical depth products
Table 3. Validation statistics of the ensemble-mean fusion (F1–F4) and MLE fusion (FM1–FM4) AOD during two field campaigns (left:
KORUS-AQ; right: EMeRGe).
KORUS-AQ EMeRGe
Fusion method Product type % EE % GCOS RMSE MBE N % EE % GCOS RMSE MBE N
F1 67.8 47.2 0.134 −0.014 4806 66.8 45.4 0.149 −0.012 1754
F2 72.3 52.7 0.129 0.008 4843 66.9 45.5 0.150 −0.012 1760
Ensemble mean
F3 72.1 51.1 0.133 0.012 5069 63.2 44.5 0.175 −0.019 1884
F4 73.3 51.6 0.128 −0.015 4843 66.4 44.8 0.153 −0.024 1760
FM1 72.6 52.4 0.130 −0.012 4806 69.1 47.6 0.147 −0.008 1754
MLE FM2 65.5 46.1 0.146 0.034 4924 67.3 46.5 0.152 0.014 1863
FM3 75.2 54.5 0.129 −0.09 5069 62.4 41.8 0.177 −0.027 1884
Figure 6. Comparison of the GCOS fraction for the respective satellite (AMR, AES, GV1, and GV2), ensemble-mean fusion (F1), and MLE
fusion (FM1) during the (a) KORUS-AQ and (b) EMeRGe campaign. Colors represent different aerosol products.
that the collocated dAOD for NDVI at around 0.2 during the EMeRGe campaign, with filled circles representing median
EMeRGe period is closer to zero in FM3 than in F3. values and the error bar being ±1 SD. As in the KORUS-AQ
The median bias of the AOD products over the observa- campaign, the AMR shows a generally negative bias, as in
tion time was analyzed as shown in Fig. 8, where the left the all-time results, and a negative bias also exists in each
column represents the KORUS-AQ and the right column the time zone. In the AES, GV1, and GV2 case, positive and
Atmos. Meas. Tech., 14, 4575–4592, 2021 https://doi.org/10.5194/amt-14-4575-2021H. Lim et al.: Integration of GOCI and AHI Yonsei aerosol optical depth products 4585
Figure 7. Difference between the (a, b) respective satellite, (c, d) ensemble mean, and (e, f) MLE and AERONET AOD in terms of NDVI
during the KORUS-AQ (a, c, e) and the EMeRGe (b, d, f) campaigns. Each point and solid line represents the median and 1σ (16th and
84th percentile) of 500 (for the KORUS-AQ) and 400 (for the EMeRGe) collocated data points in terms of NDVI values, respectively. Colors
represent different aerosol products.
negative biases appear differently according to time zones. The error analysis indicates that the results after fusion
The ±1 SD of the respective satellite product is larger at lo- are more accurate than the results obtained using individual
cal noon and smaller at 00:00 and 07:00 UTC when the solar satellite products, and fused products’ accuracy was slightly
zenith angle is large. Fused products as shown in Fig. 8c–f better during KORUS-AQ than EMeRGe because more data
have a smaller ±1 SD, and the collocated dAOD over the ob- points were considered. Also, the surface was relatively
servation time are also close to zero. Meanwhile, FM2 shows dark during the KORUS-AQ period; thus retrieval errors for
the same tendency of overestimation for the same reason as aerosol are reduced compared to the EMeRGe period.
in the previous Fig. 7a.
For the EMeRGe period, the collocated dAOD values of 5.3 Time-series analysis of daily mean and hourly
the respective product appear closer to zero than KORUS- AODs
AQ. Similarly, the collocated dAOD of the fused products
also show values close to zero.
The Gangneung–Wonju National University site
(Gangneung-WNU; 37.77◦ N, 128.87◦ E) lies on the
https://doi.org/10.5194/amt-14-4575-2021 Atmos. Meas. Tech., 14, 4575–4592, 20214586 H. Lim et al.: Integration of GOCI and AHI Yonsei aerosol optical depth products
Figure 8. Same as Fig. 7 but for the observation time in UTC.
eastern side of the Korean Peninsula, and it is one of the resenting fused AOD, show similar patterns overall, but the
regions with low aerosol loadings. The AOD frequency daily mean AODs on 11 May show different patterns. Here,
distribution generally follows a lognormal distribution, and ensemble-mean products (F1–4) are less accurate than an in-
it is important to evaluate accuracy for low AOD values. dividual AES product, while MLE products (FM1–3) exhibit
Therefore, we evaluated whether the fused products were similar diurnal variation to daily mean AERONET AOD. To
improved at low AODs. A daily mean time-series and further analyze this, the daily mean AOD is shown in Fig. 9b,
diurnal variation comparison of different satellite AOD d, f instead of the hourly AOD for 11–14 May.
products against AERONET (on a logarithmic scale) are As in the previous daily mean AOD results, Fig. 9b
shown in Fig. 9 for the Gangneung-WNU site without shows the hourly AES AOD variations are close to hourly
high-AOD events, where most point AERONET AODs at AERONET, while AMR, GV1, and GV2 tend to underes-
550 nm were < 1 during the KORUS-AQ campaign. Daily timate. Similarly, as shown in Fig. 9d, hourly AOD varia-
mean time-series data from the AERONET, ensemble-mean, tion of the ensemble-mean products shows overall underesti-
and MLE products are shown in Fig. 9a, c, e, where black mation for 11 May. All ensemble-mean products use AES
filled circles and black error bars represent AERONET AOD as an ensemble member but do not sufficiently compen-
and ±1 SD of 1 d average AERONET AOD, respectively. sate for the negative biases held by AMR, GV1, and GV2.
Satellite-derived AODs represented in different colors show Meanwhile, MLE fused products show similar patterns to the
similar variabilities. hourly AOD variation of AERONET, such as AES outputs.
The respective satellite products generally show a simi- This can be explained in two ways: the effect of consider-
lar daily mean AOD distribution to AERONET AOD. AMR, ing the weighted function based on pixel-level uncertainty
GV1, and GV2 using the MRM technique show similar pat- (RMSE in this study) and the bias correction effects. Fig-
terns, and AES using SWIR for surface-reflectance estima- ure 1 shows similar RMSE values for all observation times
tion shows different patterns. The daily mean AOD of AES when AOD ≤ 0.5. The Gangneung-WNU site is one of the
is closer to AERONET. On the other hand, Fig. 9c and e, rep- densely vegetated areas, but if the AOD is less than or equal
Atmos. Meas. Tech., 14, 4575–4592, 2021 https://doi.org/10.5194/amt-14-4575-2021H. Lim et al.: Integration of GOCI and AHI Yonsei aerosol optical depth products 4587 Figure 9. Time series of the daily average AODs at the Gangneung-WNU site during the KORUS-AQ campaign from the (a) respective satellite, (c) ensemble mean, and (e) MLE fusion. The black-filled circles represent AERONET AOD, and the error bars represent 1 SD of daily AERONET AODs. The diurnal variation in AODs from 11 to 14 May 2016 is shown in panels (b), (d), (f), where panel (b) is the respective satellite, panel (d) is fused, and panel (f) is MLE products. to 0.5, there is little sensitivity of RMSE according to NDVI surface reflectance estimated by the MRM is affected by bins. That is, regardless of the NDVI, each satellite-specific BAOD, resulting in a negative bias in AOD. On the other weighting function used for the MLE fusion has a similar hand, the AES uses TOA reflectance at 1.6 µm wavelength value for all satellite-derived products. The difference be- to estimate surface reflectance and is therefore less affected tween the ensemble-mean and the MLE fused products is by BAOD, and it shows higher AOD than AMR and the two due to the bias correction considered in the MLE fusion. For GOCI AODs. Furthermore, AOD retrieval over vegetated ar- example, FM3 states that AMR has a large negative bias in eas is more accurate with the ESR method. This result is con- the afternoon and AES has a negative bias in the morning. sistent with previous studies of aerosol retrieval in the VIS re- With the bias correction of AES and AMR respectively in gion (Levy et al., 2013; Gupta et al., 2019; Hsu et al., 2019). the morning and afternoon, FM3 is calibrated in a direction to compensate the underestimated AOD. The effect of bias 5.4 Accuracy evaluation for AHI products of the correction and MLE fusion agreement varies depending on outside of GOCI domain the NDVI and AOD loading for each pixel. In the 11 May case, if no bias correction is performed, the MLE fusion out- In this section, the AMR, AES, F3, and FM3 products were put shows a very similar value to F3. evaluated at 34 sites within the region of 0–50◦ N and 70– The MLE products were implemented so as to improve 150◦ E except for the GOCI domain as shown in Figs. 4 and 5 accuracy for the low-AOD region more critically than in the (24–50◦ N, 112–148◦ E). The evaluation results are summa- high-AOD region by systematic bias correction. In general rized in Table 4 in terms of N, R, RMSE, MBE, and GCOS https://doi.org/10.5194/amt-14-4575-2021 Atmos. Meas. Tech., 14, 4575–4592, 2021
4588                                    H. Lim et al.: Integration of GOCI and AHI Yonsei aerosol optical depth products

Table 4. Accuracy evaluation of outside of GOCI area of AMR, AES, F3, and FM3 AODs.

    Without GOCI     KORUS-AQ       KORUS-AQ        KORUS-AQ      KORUS-AQ      EMeRGe       EMeRGe     EMeRGe       EMeRGe
    domain               AMR             AES              F3           FM3        AMR           AES         F3          FM3
    N                       1959            1958           1958          1958       2610        2610        2610        2610
    R                      0.699           0.658          0.713         0.707      0.794       0.826       0.829       0.821
    RMSE                   0.238           0.305          0.225         0.223      0.278       0.233       0.269       0.279
    MBE                   −0.098           0.130          0.041         0.015     −0.135      −0.055      −0.145      −0.158
    GCOS                    25.6             25.6          27.3          26.5        26.8       34.1        29.0        27.5

fraction. The RMSE and mean AOD bias values within the             certainty further improved the accuracy of MLE products.
GOCI domain were used in the MLE fusion in this section            For optimized AOD products in East Asia, NDVI and time-
(see Figs. 1 and 3). Table 4 shows the % GCOS and RMSE             dependent errors have been reduced. The ensemble-mean
values with poorer accuracy than the validation results for the    and MLE fusion results show consistent results with better
GOCI coverage as listed in Table 4. In addition, MBE during        accuracy.
the KORUS-AQ and the EMeRGe period was −0.098 and                     By comparing F1 and F4, we can see the accuracy changes
−0.135 for AMR and 0.130 and −0.055 for AES, respec-               depending on the number of members used in the ensem-
tively, which show very poor accuracy. This can be explained       ble mean. During the KORUS-AQ period, poor accuracy of
by the cloud contamination issue at sites near the Equator,        each member for ensemble averaging made it difficult to find
including Thailand. In addition, AMR cannot collect enough         true features. The accuracy of F4 was higher than that of
clear pixels for the estimation of LER, which can cause er-        F1, which shows the effect of GV1’s large bias during the
rors. Furthermore, MRM does not work well over desert ar-          KORUS-AQ period. On the other hand, for the EMeRGe pe-
eas. On the other hand, AES has issues with poor accuracy          riod, the difference between F1 and F4 appears small because
over bright pixels such as desert and snow-contaminated ar-        the respective ensemble member’s accuracy was better. Both
eas. Second, there are many areas where the coastline is com-      near-real-time products, F2 and FM2, show good accuracy,
plex, as in Hong Kong, and the surface elevation is uneven, as     similar to other fused products. Interestingly, the accuracy
in Himalayas. However, there is a bias of −0.055 during the        of F1 was worse than that of F2, but the accuracy of FM1
EMeRGe period for AES, but the % GCOS was the highest,             was better than that of FM2. The reason for this appears to
at 34.1, which is considered significant. F3 and FM3 show          be that the long-term RMSE (in Fig. 1) and mean AOD bias
similar patterns for the KORUS-AQ and the EMeRGe pe-               value (in Fig. 3) was a better representation for the EMeRGe
riod. The accuracy of F3 is better than that of FM3, because       than for the KORUS-AQ period. To minimize such errors,
the previously mentioned issue for the bias correction has         overall results can be improved by binning the RMSE and
worked incorrectly, as the RMSE and bias correction values         mean AOD bias value for the bias correction with respect to
used were from the data in the untrained area.                     month and season in addition to NDVI and time. Naturally,
                                                                   if we directly use the RMSE and mean AOD center value of
                                                                   each campaign, the accuracy can be improved.
6   Summary and conclusion                                            In terms of % GCOS range, satellite-derived and fused
                                                                   products were 33 %–43 % and 46 %–54 %, respectively, dur-
Various aerosol algorithms have been developed for two dif-        ing the KORUS-AQ, indicating that the fused products have
ferent GEO satellites, AHI and GOCI. Retrieved AOD data            a better or similar statistical score along with other valida-
have advantages and disadvantages, depending on the con-           tion scores such as RMSE and MBE. However, the % GCOS
cept of the algorithm and surface-reflectance estimations.         during the EMeRGe period shows better accuracy for AMR
In this study, four aerosol products (GV1, GV2, AMR, and           products, with 52.4 %, than for fused products, with a max-
AES) were used to construct ensemble-mean and MLE prod-            imum of 47.6 %. In terms of other validation indices, how-
ucts. For the ensemble mean, this study presented fusion           ever, such as RMSE and MBE, the fused product results rep-
products taking advantage of overlap region, accuracy, and         resent a better validation score than the AMR. For the low-
near-real-time processing. For MLE products, bias correc-          aerosol-loading case where RMSE is small and similar across
tions for different observation times and surface type were        different products, a bias correction effect was also analyzed
performed considering pixel-level errors, and the synergy          at the Gangneung-WNU site by comparing F3 and FM3.
of fusion between GEO satellites was successfully demon-              As a summary, to increase the accuracy of the fused prod-
strated.                                                           ucts, it is required to have either high accuracy of the respec-
   Validation with AERONET confirmed that averaging en-            tive satellite product or consistent error characteristics with
semble members improved most of the statistical metrics            respect to different parameters, such as time and NDVI. If ei-
for ensemble products, and consideration of pixel-level un-

Atmos. Meas. Tech., 14, 4575–4592, 2021                                               https://doi.org/10.5194/amt-14-4575-2021
H. Lim et al.: Integration of GOCI and AHI Yonsei aerosol optical depth products 4589
ther each satellite-derived AOD is accurate or large numbers Financial support. This research was supported by the Korea Min-
of ensemble members are available to compensate for the re- istry of Environment (MOE) through the “Public Technology Pro-
spective error, the ensemble mean shall be the better fusion gram based on Environmental Policy” (grant no. 2017000160001).
technique. If the error characteristic is not random and can be This work was also supported by a grant from the National Institute
expressed as a specific function, the fused product’s accuracy of Environment Research (NIER), funded by the MOE of the Re-
public of Korea (grant no. NIER-2021-01-02-071). This work was
through the MLE fusion will be increased.
also supported by a grant from the NIER, funded by the MOE of the
The method applied in this study could be used for AOD Republic of Korea (grant no. NIER-2021-04-02-056). This research
fusion of GEO data, such as AMI on board GK-2A and was also supported by the FRIEND (Fine Particle Research Initia-
GOCI-2 and GEMS on board GK-2B. Furthermore, it is pos- tive in East Asia Considering National Differences) Project through
sible to retrieve AOPs other than AOD using multi-angle and the National Research Foundation of Korea (NRF), funded by the
multi-channel (UV, VIS, and IR) observations with GK-2A Ministry of Science and ICT (grant no. 2020M3G1A1114615).
and GK-2B.
Review statement. This paper was edited by Manabu Shiraiwa and
Code and data availability. The aerosol product data from AHI reviewed by two anonymous referees.
and GOCI are available on request from the corresponding author,
Jhoon Kim (jkim2@yonsei.ac.kr).
References
Author contributions. HL, SG, and JK designed the experiment.
Bernard, E., Moulin, C., Ramon, D., Jolivet, D., Riedi, J., and Nico-
HL and SG carried out the data processing. MC, SL, and YK pro-
las, J.-M.: Description and validation of an AOT product over
vided support for satellite data. HL wrote the manuscript, with con-
land at the 0.6 µm channel of the SEVIRI sensor onboard MSG,
tributions from all co-authors. JK reviewed and edited the article.
Atmos. Meas. Tech., 4, 2543–2565, https://doi.org/10.5194/amt-
JK and CKS provided support and supervision. All authors analyzed
4-2543-2011, 2011.
the measurement data and prepared the article.
Bessho, K., Date, K., Hayashi, M., Ikeda, A., Imai, T., Inoue, H.,
Kumagai, Y., Miyakawa, T., Murata, H., Ohno, T., Okuyama,
A., Oyama, R., Sasaki, Y., Shimazu, Y., Shimoji, K., Sumida, Y.,
Competing interests. The authors declare that they have no conflict Suzuki, M., Taniguchi, H., Tsuchiyama, H., Uesawa, D., Yokota,
of interest. H., and Yoshida, R.: An Introduction to Himawari-8/9 – Japan’s
New-Generation Geostationary Meteorological Satellites, J. Me-
teorol. Soc. Japan Ser. II, 94, 151–183, 2016.
Special issue statement. This article is part of the special issue “Ef- Bilal, M., Nichol, J. E., and Wang, L.: New customized methods
fect of Megacities on the Transport and Transformation of Pollu- for improvement of the MODIS C6 Dark Target and Deep Blue
tants at Regional and Global Scales (EMeRGe) (ACP/AMT inter- merged aerosol product, Remote Sens. Environ., 197, 115–124,
journal SI)”. It is not associated with a conference. 2017.
Chatterjee, A., Michalak, A. M., Kahn, R. A., Paradise, S. R.,
Braverman, A. J., and Miller, C. E.: A geostatistical data fusion
Acknowledgements. We thank all principal investigators and their technique for merging remote sensing and ground-based obser-
staff for establishing and maintaining the AERONET sites used vations of aerosol optical thickness, J. Geophys. Res., 115, D20,
in this investigation. This subject is supported by the Korea Min- https://doi.org/10.1029/2009JD013765, 2010.
istry of Environment (MOE) through the “Public Technology Pro- Cho, H. K., Jeong, M. J., Kim, J., and Kim, Y. J.: De-
gram based on Environmental Policy (2017000160001)”. This work pendence of diffuse photosynthetically active solar irradi-
was also supported by a grant from the National Institute of En- ance on total optical depth, J. Geophys. Res., 108, 4267,
vironment Research (NIER), funded by the MOE of the Repub- https://doi.org/10.1029/2002JD002175, 2003.
lic of Korea (NIER-2021-01-02-071). This work was also sup- Choi, J.-K., Park, Y. J., Ahn, J. H., Lim, H.-S., Eom, J., and
ported by a grant from the NIER, funded by the MOE of the Re- Ryu, J.-H.: GOCI, the world’s first geostationary ocean color
public of Korea (NIER-2021-04-02-056). This research was also observation satellite, for the monitoring of temporal variability
supported by the FRIEND (Fine Particle Research Initiative in in coastal water turbidity, J. Geophys. Res.-Oceans, 117, C9,
East Asia Considering National Differences) Project through the https://doi.org/10.1029/2012JC008046, 2012.
National Research Foundation of Korea (NRF), funded by the Choi, M., Kim, J., Lee, J., Kim, M., Park, Y.-J., Jeong, U., Kim, W.,
Ministry of Science and ICT (grant no.: 2020M3G1A1114615). Hong, H., Holben, B., Eck, T. F., Song, C. H., Lim, J.-H., and
We thank all members of the KORUS-AQ science team for Song, C.-K.: GOCI Yonsei Aerosol Retrieval (YAER) algorithm
their contributions to the field study and the data processing and validation during the DRAGON-NE Asia 2012 campaign,
(https://doi.org/10.5067/Suborbital/KORUSAQ/DATA01). Atmos. Meas. Tech., 9, 1377–1398, https://doi.org/10.5194/amt-
9-1377-2016, 2016.
Choi, M., Kim, J., Lee, J., Kim, M., Park, Y.-J., Holben, B., Eck, T.
F., Li, Z., and Song, C. H.: GOCI Yonsei aerosol retrieval version
2 products: an improved algorithm and error analysis with uncer-
https://doi.org/10.5194/amt-14-4575-2021 Atmos. Meas. Tech., 14, 4575–4592, 2021You can also read