Key habitat features facilitate the presence of Barred Owls in developed landscapes
←
→
Page content transcription
If your browser does not render page correctly, please read the page content below
VOLUME 14, ISSUE 2, ARTICLE 12
Clement, M. A., K. Barrett, and R. F. Baldwin. 2019. Key habitat features facilitate the presence of Barred Owls in developed landscapes. Avian
Conservation and Ecology 14(2):12. https://doi.org/10.5751/ACE-01427-140212
Copyright © 2019 by the author(s). Published here under license by the Resilience Alliance.

Research Paper

Key habitat features facilitate the presence of Barred Owls in
developed landscapes
Marion A. Clement 1, Kyle Barrett 1 and Robert F. Baldwin 1
1
  Department of Forestry and Environmental Conservation, Clemson University, Clemson, South Carolina, USA

ABSTRACT. As urbanization continues to transform landscapes, it is imperative to find ways to conserve biodiversity within fragmented
habitats. Forest interior dwelling birds are particularly vulnerable to development pressures because they require large tracts of forest
to support their life cycles. Although Barred Owls (Strix varia) are frequently described as an obligate mature forest species, they have
been found in urbanized landscapes. To determine if certain habitat characteristics, such as mature trees, facilitate the presence of
Barred Owls in developed regions, we modeled Barred Owl occupancy probability along a development gradient in the Piedmont region
of the southeastern United States. We surveyed for owls by broadcasting conspecific calls to solicit response and by passively recording
at survey sites using autonomous recording units. Detection/nondetection data were collected during the breeding season and analyzed
within an occupancy framework to investigate patterns of habitat association in our region, while allowing for imperfect detection of
owls. Average tree height was the best predictor of Barred Owl occupancy across a development gradient, regardless of forest coverage.
We did not find Barred Owl occupancy to decline with increasing impervious surface density. Our research implies that developed
landscapes containing mature urban trees can support breeding populations of Barred Owls.

Des caractéristiques clés d'habitat facilitent la présence de Chouettes rayées dans les paysages
urbanisés
RÉSUMÉ. L'urbanisation transformant en continu les paysages, il est impératif de trouver des façons de conserver la biodiversité dans
les milieux fragmentés. Les oiseaux qui fréquentent l'intérieur des forêts sont particulièrement vulnérables à l'étalement urbain parce
qu'ils ont besoin de grands parterres forestiers durant leur cycle annuel. Bien que les Chouettes rayées (Strix varia) soient souvent
décrites comme des espèces de forêts matures strictes, elles ont pourtant aussi été trouvées dans des paysages urbanisés. Afin de déterminer
si certaines caractéristiques de l'habitat, tels que les arbres matures, facilitaient la présence de chouettes dans les régions urbanisées,
nous avons modélisé la probabilité d'occurrence de cette espèce le long d'un gradient d'urbanisation dans la région du Piedmont dans
le sud-est des États-Unis. Nous avons inventorié les chouettes en diffusant des enregistrements de chants de conspécifiques afin de
susciter une réponse, et passivement, en enregistrant au moyen d'enregistreurs automatisés à des sites d'inventaire. Les données de
détection/non-détection ont été récoltées durant la saison de nidification et analysées dans le contexte d'un modèle d'occurrence pour
investiguer les tendances dans l'association espèce-habitat dans la région, tout en tenant compte de la détection incomplète des chouettes.
La hauteur moyenne des arbres s'est avérée la variable la meilleure pour prédire la présence des Chouettes rayées le long d'un gradient
d'urbanisation, peu importe le couvert forestier. Nous n'avons pas observé de diminutions dans la présence des chouettes avec
l'augmentation de la densité de superficie imperméable. Notre étude indique que les paysages urbanisés qui comportent des arbres
matures peuvent accueillir des populations nicheuses de Chouettes rayées.
Key Words: Barred Owl; habitat selection; occupancy modeling; Strix varia; urbanization; urban wildlife

INTRODUCTION                                                                prey (Bosakowski and Smith 1997). However, a number of studies
As urbanization continues to transform landscapes, habitat                  suggest that some raptors can thrive in urban settings, particularly
fragmentation has become a priority concern in wildlife                     predators of small mammals and birds commonly associated with
conservation. The ecological implications of urbanization extend            development (Estes and Mannan 2003, Chace and Walsh 2006,
beyond urban cores. Urbanization drives land conversion at the              Rullman and Marzluff 2014, Millsap 2018).
periphery of cities (Brown et al. 2005), reduces forest patch size          The Barred Owl (Strix varia) is described as requiring contiguous
(Medley et al. 1995), contaminates water resources (Arnold and              mature forest (Johnsgard 2002, Livezey 2007) and has been used
Gibbons 1996, Wang et al. 2001), and results in decreased habitat           as an indicator species for forest health (McLaren et al. 1998, Hess
and species richness (McKinney 2002). Fragmentation in the                  and King 2002, U.S. Department of Agriculture 2004). As the
forest mosaic has been shown to reduce avian diversity,                     Barred Owl exhibits high interannual territorial fidelity (as
particularly in forest interior birds (Kluza et al. 2000, Hepinstall        reviewed in Johnsgard 2002), territories must meet the species’
et al. 2008). Raptors can be sensitive to habitat fragmentation             requirements throughout its life cycle. Barred Owl habitat
because they require large patches of habitat containing diverse            requirements include dense overstory canopy for thermoregulation

Address of Correspondent: Marion A Clement, Department of Forestry and Environmental Conservation, Clemson University, 261 Lehotsky Hall,
Clemson, South Carolina 29634 , USA, mcleme2@clemson.edu

Avian Conservation and Ecology 14(2): 12
                                                                                                        http://www.ace-eco.org/vol14/iss2/art12/

and daytime protection from mobbing, large trees with natural             Barred Owl habitat in developed areas. These towns are in close
cavities for nesting, and an open understory that provides                proximity to a large forested tract, the Clemson Experimental
unobstructed flight paths and exposed prey (Nicholls and Warner           Forest (CEF), which includes 7082 ha of forest. A portion of the
1972, Haney 1997, Livezey 2007). Although Barred Owls use both            CEF is harvested annually and planted with loblolly pine (Pinus
upland and lowland habitats, evidence exists that aquatic features        taeda), but the majority is recovering hardwood (oak-hickory
such as riparian areas offer abundant prey and nest cavities              stands) and native pine forest, used primarily for education and
(Livezey 2007, Wiens et al. 2014). Many of the habitat                    recreation. The CEF is the largest contiguous block of forest
requirements for Barred Owls are typical of contiguous mature             within 20 km; the remaining landscape matrix is composed of
forest; thus the species is most often found far from development.        agriculture, smaller forest blocks, and residential development.
In two comparative studies, Barred Owls were shown to avoid               Our study region is estimated to have undergone a 22.5%
human activity more than buteo hawks, Great Horned Owls                   population increase since 2010 (U.S. Census Bureau, http://www.
(Bubo virgianus), and Eastern Screech Owls (Otus asio;                    census.gov/quickfacts/clemsoncitysouthcarolina); this context
Bosakowski and Smith 1997) and had stronger negative                      offered a range of development densities and neighborhood ages
associations with forest fragmentation than Great Horned Owls             that could be leveraged to assess Barred Owl presence across a
(B. virgianus) and Northern Saw-whet Owls (Aegolius acadicus;             range of urban habitat structures.
Grossman et al. 2008).
Despite extensive accounts in the literature that Barred Owls             Table 1. Continuous site variables used in occupancy models of
prefer contiguous mature forest, several studies have described           Barred Owl (Strix varia) habitat associations in the Piedmont of
this species occupying cities in the United States such as Charlotte,     South Carolina. All variables were measured within 400 m radius
North Carolina (Harrold 2003), and Cincinnati, Ohio (Dykstra              buffers centered on the survey points. Cover variables were
et al. 2012); suburbs within Seattle, Washington (Rullman and             converted to percentages by dividing the summary value by the
Marzluff 2014); and the greater Vancouver region in Canada                buffer area (∼0.5 km²). Buffer area represents the average territory
(Hindmarch and Elliott 2015). In Charlotte, studies of prey items,        size for male Barred Owls in our region (Clement, Barrett, and
fledging survival, and dispersal rates demonstrate that wooded            Baldwin, unpublished data). DNR, Department of Natural
suburban landscapes are supporting a local population of Barred           Resources; LiDAR, light detection and ranging.
Owls (Harrold 2003, Mason 2004, Cauble 2008). The birds in this
population have higher reproductive success than their forested           Variables    Units Description                 Data Source
counterparts (Mason 2004), which may be attributable in part to           DECID          %    Deciduous forest cover;    Supervised classification
dietary subsidies of birds and small mammals attracted to bird                                owls may select for it.    of aerial imagery
feeders (Cauble 2008). The concept that Barred Owls select for            CONIF          %    Coniferous forest cover;   Supervised classification
both mature contiguous forest and wooded suburbs seems                                        owls may avoid it.         of aerial imagery
paradoxical. Researchers have speculated that older wooded                TREE           m    Average tree height;       2011 LiDAR and
                                                                          HEIGHT              owls may select for it.    supervised classification
suburbs share similar habitat structure as mature forest, such as                                                        forest
open understory and large street trees (Harrold 2003, Bierregaard         IMPERV         %    Impervious surface         Supervised classification
2018; Fig. 1). Despite these similarities, it is evident that these two                       cover; owls may avoid      of aerial imagery
types of habitat also provide very different resources to owls, such                          it.
as prey species available and unique foraging opportunities such          WETLAND        %    Wetland cover; owls        National Wetland
as bird feeders and koi ponds (Harrold 2003, Cauble 2008).                                    may select for it.         Inventory
                                                                          STREAM         m/   Stream density (total      South Carolina DNR
We used an occupancy framework (Mackenzie et al. 2002) to                               km²   length in buffer); owls    hydrography
investigate the habitat associations of Barred Owls along a                                   may select for it.
development gradient in the Piedmont region of the southeastern
United States. We hypothesized that factors related to habitat, as
well as the amount of human development, would influence                  Sampling sites
Barred Owl occupancy across our surveyed landscape. Habitat               Prior to generating survey points, we constrained the potential
variables included types of forest cover, tree height, and aquatic        survey area to ensure survey efficiency and safety of personnel.
features, and development was assessed from percent impervious            First, we applied a minimum threshold of 40% canopy cover by
surface (Table 1).                                                        raster cell (30-m resolution) across our study area using the
                                                                          National Land Cover Dataset (NLCD) 2011 U.S. Forest Service
METHODS                                                                   Tree Canopy data set (Homer et al. 2015). This threshold was
                                                                          intended to remove unsuitable habitat for owls such as open water,
Study area                                                                parking lots, and farmland. To specify this threshold, we extracted
We conducted surveys along an urban-wildland gradient within              minimum NLCD canopy cover from 18 telemetry locations from
a 300 km² portion of the Piedmont ecoregion of South Carolina             an urban Barred Owl dispersal study in Charlotte, North
(Fig. 2). Development in the region is driven by proximity to the         Carolina, USA (Mason 2004). We justified applying data from
regional cities of Greenville and Anderson, South Carolina, as            Mason (2004) to this study because Charlotte is 190 km from our
well as the large greater metropolitan areas of Charlotte, North          study region and is also located in the Piedmont province. We
Carolina, and Atlanta, Georgia. Several small towns (population           further limited our survey area by constraining it to Clemson
size range 3000-13,000) in Anderson, Oconee, and Pickens                  University property or public property within 40 m of paved or
Counties were used as the focal area for sampling prospective             forest roads.
Avian Conservation and Ecology 14(2): 12
http://www.ace-eco.org/vol14/iss2/art12/
Fig. 1. Potential habitat characteristics important to Barred Owls (Strix varia) shared by mature
forests and suburban environments. Illustration by Marion Clement.
Within our study area, we used the Human Modification for generalized random tessellation stratified sampling method
North America data set (HM-T; modified from Theobald 2013; (Stevens and Olsen 2004) to generate 14 sites within each HM-T
https://www.databasin.org) to define the development gradient class (n = 70). Using random sampling, we further constrained
(Fig. 2). This data set combines numerous anthropogenic sites to be a minimum of 800 m apart, while ensuring we retained
ecological stressors, such as development, agriculture, and energy a minimum of 35% of developed sites with HM-T > 0.40. We
production, into a single index that accounts for both their considered 800 m between survey sites to be sufficient to sample
intensity and footprint while minimizing bias associated with different pairs of owls because preliminary GPS data from 12
nonindependence of variables (Theobald 2013). The HM-T males we tagged in spring 2019 suggests Barred Owl home ranges
accounts for neighboring spatial and landscape attributes; it is a in our study region are an average of 0.5 km² (> 300 locations per
continuous index on a scale from 0 to 1 from complete forest cover individual; Clement, Barrett, and Baldwin, unpublished data).
to highly urbanized (230-m resolution). We categorized the HM- Barred Owl territories in the Southeast are much smaller than in
T index into 5 equal bins of 0.20 increments for sampling design the northern and western United States (Odom and Mennill 2010,
purposes. Bierregaard 2018), and owl territories in developed landscapes
are substantially smaller than territories in rural areas
To generate survey points, we overlaid a 40-m point grid within
(Bierregaard 2018). Using the minimum distance and HM-T
our study area and attributed an HM-T class to each point. We
threshold described previously, we removed 22 sites and retained
used the R package “spsurvey” (Kincaid and Olsen 2016) and theAvian Conservation and Ecology 14(2): 12
http://www.ace-eco.org/vol14/iss2/art12/
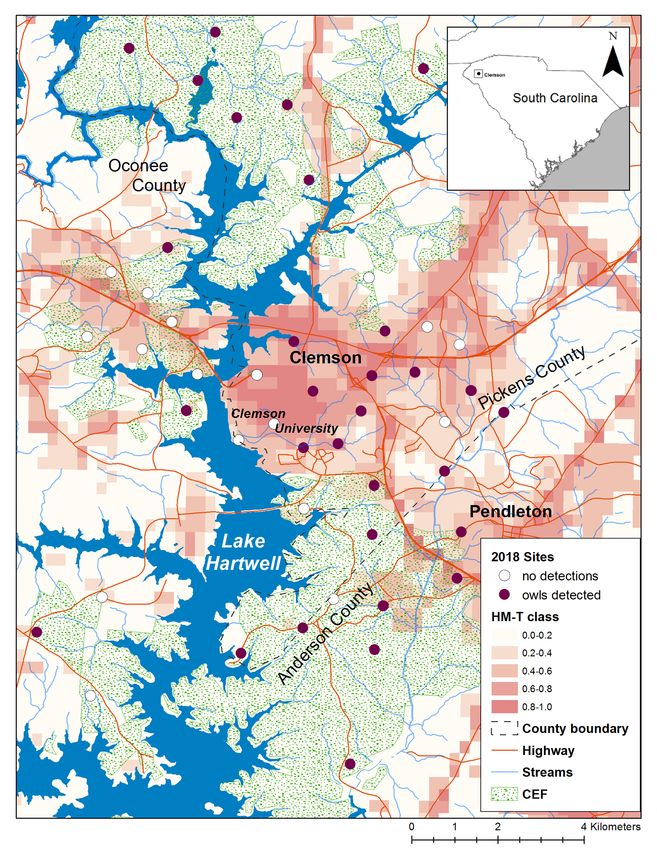
Fig. 2. We surveyed 48 sites in spring 2018 for Barred Owls (Strix varia) in the Clemson, South
Carolina, area. Sites were distributed along a development gradient defined by the Human
Modification for North America model (HM-T; Theobald 2013). The Clemson Experimental
Forest (CEF) contained most of the densely forested sites.
48 sites (Fig. 2). Because of the rural nature of the study region, breeding male Barred Owl in our region (∼0.5 km²; Clement,
the final distribution of sites was slightly skewed toward low Barrett, and Baldwin, unpublished data). This optimized the
development; 58% of sites had an HM-T ≤ 0.40, and rural sites likelihood of estimating habitat characteristics directly associated
were more dispersed than urban sites. The CEF contained most with the owl’s home range. This strategy has been used by other
of the sites that were either densely forested or had low Barred Owl habitat association studies (Mazur et al. 1997,
development. Dykstra et al. 2012). A sampling unit is hereafter referred to as a
“buffer.”
We used a 400 m radius buffer centered on the survey points as a
sampling unit because it represents the average territory of aAvian Conservation and Ecology 14(2): 12
http://www.ace-eco.org/vol14/iss2/art12/
Owl surveys date to avoid missed detections because of acoustic masking.
We collected detection data at survey sites using both audio lure Deployment order was determined randomly without
(callback) and autonomous recording units (ARUs) from 17 replacement.
January to 9 April 2018. Callback surveys have been successful We surveyed all 48 sites with callbacks 3 times. We only surveyed
in detecting Barred Owls (McGarigal and Fraser 1985, Mosher 46 sites with ARUs because logistical constraints prevented us
et al. 1990, Kissling et al. 2010). ARUs have proved to be an from deploying the ARU at 2 sites. We manually searched
effective method to detect elusive owls generally (Rognan et al. recordings for owl calls using SongScope 4.1.5a, a free
2012) and Barred Owls specifically (Shonfield et al. 2018). We spectrogram visualization software (Wildlife Acoustics Inc.).
started surveys during the courtship period for Barred Owls in Recordings were analyzed by 9 trained interns, using a
our region (Bierregaard, personal communication) to maximize randomized assignment order. Each of the 3 nightly ARU
our likelihood of detection, because raptors are known to be more recordings per site were assessed by different listeners to ensure
responsive to callbacks during courtship, incubation, and when that the individual’s ability did not bias the entire portion of the
offspring are young (Bosakowski 1987, Kissling et al. 2010). We encounter history. We spent at least 1 h visually scanning each
surveyed each site using both survey methods during separate 11.5-h recording for owl calls. All Barred Owl detections and any
sampling occasions. Survey methods did not overlap to ensure unidentified calls were verified by the lead author (M. A.
independence between callback and ARU detections. As Barred Clement); M. A. Clement and a trained technician also performed
Owls maintain territories interannually (as reviewed in Johnsgard random accuracy checks and did not find additional calls. Only
2002), all detections were assumed to be resident, territorial recordings with territorial vocalizations were considered to be
breeding pairs. occupied; this includes variations on the 2-phrased “who-cooks-
Callbacks consisted of 15-min of Barred Owl vocalizations, for-you” and ascending hoots (McGarigal and Fraser 1985,
altering between 2-phrased hoots and ascending hoots (as Odom and Mennill 2010). Single hoots were not retained because
described in Mazur and James 2000); calls were spaced these are presumed to serve as contact calls rather than territorial
approximately 10 s apart. The broadcast was played at 100 dB display (Odom and Mennill 2010). In addition, single hoots can
measured 1 m from the speaker and incorporated 2 silent listening easily be confused with barking dogs in urban settings, especially
periods (∼1.5 min) and one at the end lasting 3 min. We selected if faint or distant. We did not use automated acoustic recognition
the duration of the audio lure to optimize Barred Owl detection because existing Barred Owl recognizers have low precision
(McGarigal and Fraser 1985), and we selected broadcast sound (Shonfield et al. 2018) and human interpreters have higher
intensity so that sound would not travel past the minimum spacing probability of detection than recognizers for many species (Venier
between sites (∼750 m; Mosher et al. 1990). Callback surveys et al. 2017).
began 1 h past sunset and ended around 0300 EST. To minimize
travel effort and cost, we structured callback survey order using Habitat characteristics
cluster sampling: Surveys began with a random site and continued We selected habitat metrics likely to influence Barred Owl
in the same cardinal direction from the initial site. We surveyed occupancy based on review of the literature (Table 1). We used
each site using callbacks on 3 separate occasions. After ArcGIS 10.3.1 (Environmental Systems Research Institute Inc.,
completing a first round of surveys at all 48 sites, we generated a Redlands, California, USA) and a variety of publicly available
new random order to follow for the subsequent round. This spatial data sets to estimate these metrics for each 400-m buffer.
sampling method optimized survey efficiency while reducing any We used data from the 2018 National Wetland Inventory (U.S.
bias related to time of year. It took 30-37 d to complete a single Department of the Interior, Fish and Wildlife Service 2018) to
round of surveys. We recorded survey variables such as ambient calculate wetland area, excluding open water and large lakes such
noise and temperature for each site visit (Table 1) to account for as Lake Hartwell. We calculated stream density by extracting total
changes in detection probability. Although we also recorded stream length within each buffer using South Carolina’s
variables such as rain and wind, we did not conduct callback Department of Natural Resources (SC DNR) hydrography layer
surveys if we felt weather conditions considerably impeded (http://www.dnr.sc.gov/GIS/gisdownload.html). To build fine-
surveyor detection probability. Callbacks were conducted by 2 to scale landcover classes, we obtained 0.3-m resolution aerial
5 experienced surveyors. imagery from 3 counties in our study region: Anderson (2017),
Oconee (2015), and Pickens county (2016). We used ArcGIS’s
We conducted passive acoustic surveys with ARUs using SM2+ Support Vector Machine (SVM) classifier tool to do a supervised
Song Meters (Wildlife Acoustics Inc., Maynard, Massachusetts, classification on the aerial imagery. SVM classification can handle
USA) to increase our detection probability. We found little small training samples and is more accurate than maximized
information specific to Barred Owls in the literature to guide our likelihood classification in heterogenous urban landscapes (van
sampling program, so we programmed each ARU to record der Linden et al. 2007, Mountrakis et al. 2011). We extracted 3
continuously for 11.5 h starting at 1900 EST. We set ARUs to habitat variables, i.e., deciduous forest, coniferous forest, and
record at a sampling rate of 8 kHz in the wav format, with the impervious surface, and classified all other features as “other.”
gain settings left to factory default (+ 0.0 dB). We tested ARUs We resampled the output of the classification to 3-m resolution
prior to deployment to ensure units and their individual paired using majority resampling to smooth out graininess. We created
microphones were functioning properly. We deployed a single and evaluated 400 accuracy points on this classification and found
ARU at each site to record for 3 consecutive nights and considered our classification to be 90% accurate (kappa index of agreement).
3 nights as a single survey occasion. ARUs were secured to a tree To obtain results comparable beyond our study region, we
at chest height. If a period of heavy rain occurred during the time converted all land cover variables to densities by dividing length
of the recording, we recorded an extra day and discarded the rain or total area values by the area of buffers (∼0.5 km²).Avian Conservation and Ecology 14(2): 12
http://www.ace-eco.org/vol14/iss2/art12/
We estimated average tree height within buffers using airborne (Burnham and Anderson 2002) to compare eight models (Table
light detection and ranging (LiDAR) data from the 2011 SC DNR 4). We suspected riparian corridors would be more important to
Tricounty data set (National Oceanic and Atmospheric owls as urbanization increased, so we included a context-specific
Administration Digital Coast 2011). This data set had an average “riparian” model that featured an interaction between impervious
point density of 2.5 points/m² and was collected between 8 and surface cover and stream density. We included a “conventional”
13 March 2011. We used the LAStools software suite (Isenburg model that combined habitat characteristics commonly
2007) to process LiDAR point cloud data. We classified ground associated with Barred Owl habitat in the literature: mature trees
points using lasground_new, computed elevation using lasheight, and wetlands (Bosakowski and Smith 1997, Johnsgard 2002). To
and extracted tree canopy points using lasclassify with vegetation assess association with forest type and cover, we evaluated a
height threshold > 2 m. We created 2 separate raster data sets with “forest” model that included area of deciduous trees and
a spatial resolution of 2 m² for tree elevation and ground elevation coniferous trees as two separate covariates. We hypothesized
and then subtracted tree elevation from ground elevation to obtain Barred Owl occupancy would be greater in deciduous forest than
tree height. To account for rapid land-use change that occurred in coniferous forest because they are more likely to nest in
in our region since 2011, we used a combined layer of deciduous deciduous trees (as reviewed in Livezey 2007). We added an
and coniferous forest extracted from our SVM classification to “aquatic” model to investigate whether occupancy probability
remove forested areas that were cleared after the 2011 imagery was primarily driven by wetlands and streams. We suspected tree
was generated. height and degree of urbanization would strongly influence
occupancy probability, so we included “mature trees” (tree height)
Occupancy analysis and “urban” (impervious surface) as univariate models.
To investigate habitat associations of Barred Owls along a
development gradient, we used occupancy modeling (Mackenzie
Table 2. Detection variables collected during callback surveys for
et al. 2002) to account for imperfect detection and repeated
Barred Owls (Strix varia). All variables were collected on-site at
observations. Using R version 3.5.0 (R Core Team 2018) within
the time of survey except for ILLUMI and PASTSSET, which
R Studio (RStudio Team 2016), we used single-season occupancy
were calculated postsurvey using http://www.timeanddate.com.
models with the package “unmarked” (Fiske and Chandler 2011).
We assumed that a single-season approach would be appropriate
Variables Description Collection Method
for Barred Owls because they are known to maintain established
territories year-round (as reviewed in Johnsgard 2002). For each TEMP Temperature may influence Celsius (range: −4° to 19°)
owl activity.
site, we kept the 3 callback observations as unique sampling
PRECIP Precipitation may reduce Presence or absence
occasions but compiled the 3-night recordings of ARUs into a owl activity and surveyor
single sampling occasion. Sites that had missing ARU recordings detection.
(n = 2) were kept in our data set as “NA,” because occupancy NOISE Ambient noise may reduce Estimate, low or high
modeling allows for missing sampling occasions. acoustic detection.
CLOUD Cloud cover may reduce Estimate, percent cover
We screened for collinearity of site variables using both Pearson’s visual detection.
correlation matrices at threshold |r| = 0.70 and the variance ILLUMI Moonlight illumination may (Lunar altitude > 0) × %
inflation factor at the vif = 0.30 threshold. Because of the increase owl activity and crescent;
fragmented and variable nature of our region, we did not find surveyor detection. 0 = no moon
significant collinearity between any variables (max |r| < 0.51; TIME Time of survey may Time at start of survey
influence activity of owls
Appendix 1). We scaled and centered all continuous variables to and surveyor detection.
mean = 0 and variance = 1 prior to analysis. DATE Day of year; seasonality Julian calendar
may influence activity and
We used a two-step ad hoc approach (MacKenzie et al. 2006) to
surveyor detection.
select which detection covariates to include in the occupancy WIND Wind may decrease both Beaufort scale, high (≥ 2) or
models. We first estimated the effect of detection parameters by visual and acoustic low (< 2)
holding occupancy constant and then incorporated significant detection.
detection covariates in the full occupancy models. As a EFFORT Number of surveyors may High: 3-4 surveyors
preliminary step, we ranked univariate models of callback influence surveyor Low: 2 surveyors
detection covariates separately from ARU data (Table 2) because detection.
PASTSSET Time past sunset may Decimal hours
callback covariates were time specific and ARU data spanned 3
influence owl activity.
nights. Date was the only parameter with substantial support in
the preliminary assessment of callback-detection covariates
(AICcWt = 0.86, evidence ratio 19.3 between models “date” and Prior to running our analyses, we examined if our global model
second-ranked “noise”), so we incorporated date along with a adequately fit our data using parametric bootstrapping (Burnham
survey “method” covariate that represented either callback or and Anderson 2002, MacKenzie and Bailey 2004). This step
ARU as categorical variables for analysis with the full data set ensures that candidate models adequately describe the observed
(Table 3). In a second step, we incorporated the top-ranked data (MacKenzie et al. 2006). We used the R package
detection models for combined callbacks and ARU data in the “AICcmodavg” (Mazerolle 2017) to compute the goodness-of-fit
occupancy models of the full data set. test for single-season occupancy models based on Pearson’s chi-
square on 1000 iterations. We assumed adequate model fit and
To examine Barred Owl habitat associations along a development did not add an overdispersion parameter (ĉ) because our p value
gradient, we used a multiple working hypotheses frameworkAvian Conservation and Ecology 14(2): 12
http://www.ace-eco.org/vol14/iss2/art12/
Table 3. AICc model-ranked results for all models evaluating detection probability covariates associated with Barred Owl (Strix varia)
surveys across a development gradient in the Piedmont of South Carolina. The interactive model (DATE × METHOD) was the best
model and was incorporated in the occupancy models. AICc, AICc score; AICcWt, Akaike weight; Cumm.Wt, cummulative Akaike
weight from maximum to minimum; ΔAICc, difference between the model’s AICc and the AICc of the best-fitting model in the model
set; K, number of parameters; LogLik, log likelihood.
Hypothesis Model K AICc ΔAICc AICcWt LogLik Cumm.Wt
Interactive DATE × METHOD 5 208.24 0.00 0.50 −98.40 0.50
Date DATE 3 209.86 1.62 0.22 −101.66 0.73
Null --- 2 211.28 3.04 0.11 −101.17 0.84
Additive DATE + METHOD 4 211.33 3.09 0.11 −103.53 0.95
Method METHOD 3 212.76 4.52 0.05 −103.11 1.00
was > 0.05 (p = 0.088) and the ĉ was close to 1. We used an
information theoretic approach and the Akaike information Fig. 3. Detection probability of Barred Owls (Strix varia) varies
criterion adjusted for small sample size (AICc) to compare relative with the interaction of DATE and METHOD, i.e., callback or
support among our competing models using log likelihoods autonomous recording unit (ARU). Survey methods began in
(Burnham and Anderson 2002). We interpreted models with early January and ended in early April 2018. ARUs were more
substantial empirical support (ΔAICc < 2; Burnham and effective earlier in the breeding season, and callbacks became
Anderson 2002), and we considered parameters to be informative more effective as the breeding season progressed. ARU surveys
if the 85% confidence intervals did not include 0 (Arnold 2010). are a compilation of 3 consecutive nights of 11.5-h recordings;
callback surveys are 15-min observation periods while using
RESULTS conspecific broadcast. Shaded areas are 85% confidence
We conducted 144 callback surveys (3 visits × 48 sites) and intervals.
scanned 138 nightly 11.5-h audio recordings (3 recordings × 46
sites). Using the combined ARU and callback methods, we
detected Barred Owls at 27 of the 48 surveyed sites (56%). Of
these 27 occupied sites, 13 (48%) were sites with an HM-T value
above 0.40 (Fig. 2). For comparative purposes, the average HM-
T is 0.38 for the United States and 0.20 for our study region. We
detected Barred Owls at 22 sites using callback surveys and at 14
sites using ARUs. Only 11 sites had detections from both callback
and ARUs.
The detection-only model with the most support included an
interaction between method, i.e., ARU or survey, and date (Table
3); thus the interaction of these covariates was included in the
occupancy models. Average detection probability associated with
ARUs throughout the sampling season was 0.49 (standard error
[SE] ± 0.10), and the average detection probability using callback
surveys was 0.39 (SE ± 0.06). Callbacks became an increasingly
effective survey method as the breeding season progressed, and
ARUs were more effective earlier in the season (Fig. 3).
The conventional model and the tree height model were the only
occupancy models among our candidate set that had substantial
support (AICc cumulative weight = 0.70). In the conventional DISCUSSION
model, both tree height and wetland area had positive effects on Although Barred Owls are almost exclusively described as
the probability of Barred Owl occupancy (Fig. 4). Tree height was inhabiting contiguous mature forest, our research demonstrates
a more informative parameter (β = 0.70, SE ± 0.40, 85% that Barred Owls can occupy developed areas provided certain
confidence interval [CI] = 0.12, 1.28) for Barred Owl occupancy habitat requirements are met. A number of past studies have
probability than wetland area (β = 1.31, SE ± 1.14, 85% CI [−0.33, implied that Barred Owls avoid development (Bosakowski and
2.95]), as the confidence intervals of wetland area overlapped 0. Smith 1997, Grossman et al. 2008), yet Barred Owl occupancy
However, the addition of the wetland parameter to tree height in did not decrease with impervious surface in our study region.
the “conventional” model improved model fit (Table 4). No other Nearly half of the sites with owl detections were considerably
model, including the “urban” and the “forest” models, were developed (48% had HM-T > 0.40). Across the development
substantially supported by our data. gradient, we found average tree height was the best estimator of
Barred Owl occupancy probability, which suggests that habitat
structure is critical to Barred Owl presence in developedAvian Conservation and Ecology 14(2): 12
http://www.ace-eco.org/vol14/iss2/art12/
Table 4. AICc model-ranked results for occupancy models evaluating various site covariates associated with Barred Owl (Strix varia)
habitat use across a development gradient in the Piedmont of South Carolina. We considered models with ΔAICc < 2 to have substantial
support (Burnham and Anderson 2002). The interaction of detection covariates DATE and METHOD was included in all models.
AICc, AICc score; AICcWt, Akaike weight; Cumm.Wt, cummulative Akaike weight from maximum to minimum; ΔAICc, difference
between the model’s AICc and the AICc of the best-fitting model in the model set; K, number of parameters; LogLik, log likelihood.
Hypothesis Model K AICc ΔAICc AICcWt LogLik Cumm.Wt
Conventional WETLAND + TREE HEIGHT 7 205.51 0.00 0.46 −94.36 0.46
Mature trees TREE HEIGHT 6 206.77 1.26 0.24 −96.36 0.70
Null --- 5 208.24 2.73 0.12 −98.40 0.82
Aquatic STREAM + WETLAND 7 208.93 3.42 0.08 −96.07 0.90
Urban IMPERV 6 209.26 3.75 0.07 −97.60 0.97
Forest DECID + CONIF 7 212.47 6.96 0.01 −97.84 0.99
Riparian IMPERV × STREAM 8 213.20 7.69 0.01 −96.76 1.00
Global WETLAND + TREE HEIGHT + IMPERV 11 216.05 10.53 0.00 −93.36 1.00
+ STREAM + DECID + CONIF
comparison to other raptors, Barred Owls frequently nest near
Fig. 4. Barred Owl (Strix varia) probability of occupancy water (Livezey 2007, Wiens et al. 2014). Large trees at the
increases with tree height and wetland cover in the Piedmont of periphery of wetlands could provide Barred Owls additional
South Carolina. Wetland cover is categorized for the purpose of nesting opportunities because moist soils can accelerate tree
plotting as high (values above upper quantile, > 1.91%) and low growth and reduce frequency of fire. Wetlands may also provide
(values below lower quantile, < 0.55%). In the analysis, wetland abundant foraging opportunities, particularly during the anuran
cover was a continuous variable. Occupancy was predicted from breeding season. Barred owls will readily take aquatic prey and
the best-supported conventional model. Shaded areas are 85% have been known to hunt frogs, fish, and aquatic invertebrates
confidence intervals. (Hamer et al. 2001, Livezey 2007, Cauble 2008). Barred Owl
association with wetlands may depend on landscape context
because urban wetlands are often impaired and as a result contain
lower species richness and abundance of potential prey (Findlay
and Houlahan 1997, Knutson et al. 1999). This aspect should be
further explored with additional movement studies in a variety of
urban landscapes.
Average detection probability of Barred Owls using callbacks and
ARU survey methods were similar to studies that reported this
parameter (Bailey et al. 2009, Kissling et al. 2010, Shonfield and
Bayne 2017). ARUs had higher average detection probability than
callbacks across the survey season; however, ARU samples as
defined in this study compiled recordings from three consecutive
nights at each site. When modeling detection probability, we
observed an interaction between the effect of date and survey
method. As the season progressed, detection probability increased
for callbacks, whereas it decreased for ARUs (Fig. 3). As ARUs
passively record without use of a lure, detection probability
should represent the natural vocalization patterns for this species.
Owl vocalizations peak just prior to egg laying (as reviewed in
Johnsgard 2002), suggesting that more frequent ARU detections
landscapes. Large mature trees are more likely to provide suitable should occur earlier in the breeding season. Our ARU surveys
nest cavities, and nest availability is frequently described as a were completed prior to major leaf out; therefore, sound
limiting factor for Barred Owls (as reviewed in Johnsgard 2002). attenuation from leaves was unlikely to have an effect on detection
Because neither deciduous nor coniferous forest area was a probability. In contrast, callbacks became increasingly effective
parameter featured in the top-ranking models, tree maturity as the breeding season progressed. Kissling et al. (2010) found a
appears to be a better predictor of Barred Owl occupancy than similar positive effect of date on detection probability for
total forest coverage in our study region. This indicates that callbacks during the breeding season. Although natural calling
individual or small patches of large trees can meet the habitat behavior decreases as the season progresses, territorial responses
requirements of Barred Owls. to conspecific calls may increase when breeding pairs are
defending active nests or fledglings.
We found a weak positive effect of wetland density on Barred Owl
occupancy probability. In a literature review of 144 habitat Although we designed our study to minimize sources of bias, there
studies, Livezey (2007) found mixed results concerning the are limitations that may have influenced our findings. As survey
association of Barred Owls with aquatic features; yet in sites were obtained from random spatial selection rather thanAvian Conservation and Ecology 14(2): 12
http://www.ace-eco.org/vol14/iss2/art12/
from known cores of owl territories, such as a nest site, we cannot Examining Barred Owl occupancy of urban landscapes may give
assume that owls consistently remained within the 400 m radius experts insight on the best strategies to plan for development with
buffer during the survey window. Hence, occupancy results at this higher urban habitat quality supporting greater biota diversity.
scale are best described as probability of “use” rather than Notably, Barred Owls are a highly charismatic and visible species
occupancy, a recommendation by MacKenzie et al. (2006) that across our study region. Expanding public exposure and
several comparable studies have employed (Kissling et al. 2010, interaction with this species could prove to be an important basis
Shonfield and Bayne 2017). Future research that evaluates fine- for a conservation education strategy focused on appreciation of
scale owl movements using GPS telemetry will provide a more urban biodiversity (Nilon 2011).
robust evaluation of the influence of the predictors considered in
our coarse-scale occupancy analysis.
Responses to this article can be read online at:
Although our study demonstrates that Barred Owls occupy http://www.ace-eco.org/issues/responses.php/1427
certain areas in developed landscapes, we cannot infer that these
areas are advantageous habitats or ecological traps (Schlaepfer et
al. 2002). Mason (2004) suggests Barred Owls in downtown
Charlotte, North Carolina, USA, produce more chicks compared Acknowledgments:
with Barred Owls in nearby forested habitats. Differential
This project was funded and supported by the Margaret H. Lloyd-
productivity may result, in part, because suburban environments
SmartState Endowment for Urban Ecology and Restoration and
can produce higher biomass of potential prey for raptors than
the Clemson Creative Inquiry Program. We are indebted to the
native habitats (Chace and Walsh 2006). As dietary generalists,
student technicians, A. Michaeli, A. Carter, and interns A. Arthur,
Barred Owls feed on abundant rodent and avian prey in suburban
K. Brown, E. Jordan, J. Kiel, I. Pacheco, S. Parham, and K. Peters
environments (Cauble 2008, Hindmarch and Elliott 2015). In
for their assistance surveying and analyzing recordings. In
addition, the open understory of suburban landscapes can
particular, we thank Paul Leonard and Claire Stuyck for initiating
provide ideal open foraging habitat, free of flight obstruction,
this project, Rob Bierregaard and Brian Ritter for their guidance,
much like the open understory of a mature forest (Harrold 2003;
and graduate committee members Patrick Jodice and Catherine
Fig. 1). Despite these advantages, developed settings pose many
Jachowski for lending their expertise to the project.
hazards for Barred Owls. Apex predators are exposed to increased
bioaccumulation of toxic substances and pesticides from human
activity (Sheffield 1997, Newsome et al. 2010, Henny et al. 2011).
In British Columbia, a study found that rat consumption exposed LITERATURE CITED
Barred Owls to anticoagulant rodenticides (Hindmarch and Arnold, C. L., Jr., and C. J. Gibbons. 1996. Impervious surface
Elliott 2015), sometimes at levels causing direct mortality. Barred coverage: the emergence of a key environmental indicator. Journal
Owls, like many other birds of prey, are also frequent victims of of American Planning Association 62(2):243-258. https://doi.
vehicle collisions. Recent data from the Carolina Raptor Center org/10.1080/01944369608975688
(Charlotte, North Carolina, USA) suggests that Barred Owls are Arnold, T. W. 2010. Uninformative parameters and model
some of the most frequent birds of prey to be brought in from selection using Akaike’s information criterion. Journal of Wildlife
vehicle strikes (Gagné et al. 2015). Demographic studies are Management 74(6):1175-1178. https://doi.org/10.2193/2009-367
needed to determine if the benefits of developed areas outweigh
the costs for Barred Owls. Bailey, L. L., J. A. Reid, E. D. Forsman, and J. D. Nichols. 2009.
Modeling co-occurrence of Northern Spotted and Barred Owls:
Our research highlights the ability of Barred Owls to occupy areas accounting for detection probability differences. Biological
that have been developed for residential or commercial use, Conservation 142:2983-2989. https://doi.org/10.1016/j.biocon.2009.07.028
particularly in southeastern wooded suburbs (Bierregaard 2018).
This finding contrasts historical descriptions of Barred Owl Beninde, J., M. Veith, and A. Hochkirch. 2015. Biodiversity in
habitat associations in widely cited literature reviews (Johnsgard cities needs space: a meta-analysis of factors determining intra-
2002, Livezey 2007). The plasticity of Barred Owls may have urban biodiversity variation. Ecology Letters 18(6):581-592.
contributed to their rapid invasion into the range of Spotted Owls https://doi.org/10.1111/ele.12427
(Strix occidentalis) in the western United States, via corridors of Bierregaard, R. O. 2018. Barred Owls: a nocturnal generalist
reforested regions accompanying settlement across the Great thrives in wooded, suburban habitats. Pages 138-151 in C. W. Boal
Plains (Livezey 2009). Results of our study build on other research and C. R. Dykstra, editors. Urban raptors: ecology ad conservation
investigating how certain raptor species can respond positively to of birds of prey in cities. Island, Washington, D.C., USA. https://
urban landscapes (Rullman and Marzluff 2014, Millsap 2018, doi.org/10.5822/978-1-61091-841-1_10
White et al. 2018). In a meta-analysis of biodiversity variation of
cities across the world, Beninde et al. (2015) found that urban bird Bosakowski, T. 1987. Census of Barred Owls and Spotted Owls.
richness in cities was best predicted by tree structure and tree Pages 307-308 in Biology and Conservation of Northern Forest
cover. Our study indicates that mature urban canopy may be Owls Symposium (Winnipeg, Manitoba, Canada, 1987). U.S.
critical to sustain Barred Owls in urban areas. As a tertiary and Forest Service, Rocky Mountain Forest and Range Experiment
secondary consumer, Barred Owls may serve the function of an Station, Fort Collins, CO, USA.
umbrella species; the management and protection of Barred Owls Bosakowski, T., and D. G. Smith. 1997. Distribution and species
could indirectly protect other wildlife sensitive to anthropogenic richness of a forest raptor community in relation to urbanization.
change (Lambeck 1997, Rubino 2001, Hess and King 2002). Journal of Raptor Research 31(1):26-33.Avian Conservation and Ecology 14(2): 12
http://www.ace-eco.org/vol14/iss2/art12/
Brown, D. G., K. M. Johnson, T. R. Loveland, and D. M. 2009. Ecotoxicology 20(4):682-697. https://doi.org/10.1007/
Theobald. 2005. Rural land-use trends in the conterminous s10646-011-0608-2
United States, 1950–2000. Ecological Applications 15
Hepinstall, J. A., M. Alberti, and J. M. Marzluff. 2008. Predicting
(6):1851-1863. https://doi.org/10.1890/03-5220
land cover change and avian community responses in rapidly
Burnham, K. P., and D. R. Anderson. 2002. Model selection and urbanizing environments. Landscape Ecology 23(10):1257-1276.
multimodel inference: a practical information-theoretic approach. https://doi.org/10.1007/s10980-008-9296-6
Second edition. Springer-Verlag, New York, New York, USA.
Hess, G. R., and T. J. King. 2002. Planning open spaces for
Cauble, L. C. 2008. The diets of rural and suburban Barred Owls wildlife: I. Selecting focal species using a Delphi survey approach.
(Strix varia) in Mecklenburg County, North Carolina. Thesis. Landscape and Urban Planning 58(1):25-40. https://doi.
University of North Carolina, Charlotte, North Carolina, USA. org/10.1016/S0169-2046(01)00230-4
Chace, J. F., and J. J. Walsh. 2006. Urban effects on native Hindmarch, S., and J. E. Elliott. 2015. When owls go to town: the
avifauna: a review. Landscape and Urban Planning 74:46-69. diet of urban Barred Owls. Journal of Raptor Research 49
https://doi.org/10.1016/j.landurbplan.2004.08.007 (1):66-74. https://doi.org/10.3356/jrr-14-00012.1
Dykstra, C. R., M. M. Simon, F. B. Daniel, and J. L. Hays. 2012. Homer, C., J. Dewitz, L. Yang, S. Jin, P. Danielson, G. Xian, J.
Habitats of suburban Barred Owls (Strix varia) and Red- Coulston, N. Herold, J. Wickham, and K. Megown. 2015.
Shouldered Hawks (Buteo lineatus) in southwestern Ohio. Journal Completion of the 2011 National Land Cover Database for the
of Raptor Research 46(2):190-200. https://doi.org/10.3356/ conterminous United States – representing a decade of land cover
JRR-11-05.1 change information. Photogrammetric Engineering and Remote
Sensing 81(5):345-354.
Estes, W. A., and R. W. Mannan. 2003. Feeding behavior of
Cooper’s Hawks at urban and rural nests in southeastern Arizona. Isenburg, M. 2007. LAStools: efficient LiDAR processing software
Condor 105:107-116. https://doi.org/10.1650/0010-5422(2003) (version 171030, academic). rapidlasso GmbH, Gilching,
105[107:FBOCHA]2.0.CO;2 Germany. [online] URL: http://rapidlasso.com/LAStools
Findlay, C. S., and J. Houlahan. 1997. Anthropogenic correlates Johnsgard, P. A. 2002. North American owls : biology and natural
of species richness in southeastern Ontario wetlands. history. Second edition. Smithsonian Institution, Washington, D.
Conservation Biology 11(4):1000-1009. https://doi.org/10.1046/ C., USA.
j.1523-1739.1997.96144.x
Kincaid, T. M., and A. R. Olsen. 2016. spsurvey: spatial survey
Fiske, I. J., and R. B. Chandler. 2011. unmarked: an R package design and analysis. R package version 3.3. R Foundation for
for fitting hierarchical models of wildlife occurrence and Statistical Computing, Vienna, Austria.
abundance. Journal of Statistical Software 43(10):1-23. https://
Kissling, M. L., S. B. Lewis, and G. Pendleton. 2010. Factors
doi.org/10.18637/jss.v043.i10
influencing the detectability of forest owls in southeastern Alaska.
Gagné, S. A., J. L. Bates, and R. O. Bierregaard. 2015. The effects Condor 112(3):539-548. https://doi.org/10.1525/cond.2010.090217
of road and landscape characteristics on the likelihood of a
Kluza, D. A., C. R. Griffin, and R. M. Degraaf. 2000. Housing
Barred Owl (Strix varia)-vehicle collision. Urban Ecosystems 18
developments in rural New England: effects on forest birds.
(3):1007-1020. https://doi.org/10.1007/s11252-015-0465-5
Animal Conservation 3(1):15-26. https://doi.org/10.1111/j.1469-1795.2000.
Grossman, S. R., S. J. Hannon, and A. Sánchez-Azofeifa. 2008. tb00083.x
Responses of Great Horned Owls (Bubo virginianus), Barred Owls
Knutson, M. G., J. R. Sauer, D. A. Olsen, M. J. Mossman, L. M.
(Strix varia), and Northern Saw-whet Owls (Aegolius acadicus)
Hemesath, and M. J. Lannoo. 1999. Effects of landscape
to forest cover and configuration in an agricultural landscape in
composition and wetland fragmentation on frog and toad
Alberta, Canada. Canadian Journal of Zoology 86:1165-1172.
abundance and species richness in Iowa and Wisconsin, U.S.A.
https://doi.org/10.1139/Z08-095
Conservation Biology 13(6):1437-1446. https://doi.org/10.1046/
Hamer, T. E., D. L. Hays, C. M. Senger, and E. D. Forsman. 2001. j.1523-1739.1999.98445.x
Diets of Northern Barred Owls and Northern Spotted Owls in
Lambeck, R. J. 1997. Focal species: a multi-species umbrella for
an area of sympatry. Journal of Raptor Research 35(3):221-227.
nature conservation. Conservation Biology 11(4):849-856. https://
Haney, C. J. 1997. Spatial incidence of Barred Owl (Strix varia) doi.org/10.1046/j.1523-1739.1997.96319.x
reproduction in old-growth forest of the Appalacian Plateau.
Livezey, K. B. 2007. Barred Owl habitat and prey: a review and
Journal of Raptor Research 31(3):241-252.
synthesis of the literature. Journal of Raptor Research 41
Harrold, E. S. 2003. Barred Owl (Strix varia) nesting ecology in (3):177-201. https://doi.org/10.3356/0892-1016(2007)41[177:BOHAPA]
the southern Piedmont of North Carolina. Thesis. University of 2.0.CO;2
North Carolina, Charlotte, North Carolina, USA.
Livezey, K. B. 2009. Range expansion of Barred Owls, part II:
Henny, C. J., R. A. Grove, J. L. Kaiser, B. L. Johnson, C. V. Furl, facilitating ecological changes. American Midland Naturalist 161
and R. J. Letcher. 2011. Wastewater dilution index partially (2):323-349. https://doi.org/10.1674/0003-0031-161.2.323
explains observed polybrominated diphenyl ether flame retardant
MacKenzie, D. I., and L. L. Bailey. 2004. Assessing the fit of site-
concentrations in Osprey eggs from Columbia River Basin, 2008–
occupancy models. Journal of Agricultural, Biological, andAvian Conservation and Ecology 14(2): 12
http://www.ace-eco.org/vol14/iss2/art12/
Environmental Statistics 9(3):300-318. https://doi. USA. [online] URL: https://coast.noaa.gov/htdata/lidar1_z/
org/10.1198/108571104X3361 geoid12b/data/4982
Mackenzie, D. I., J. D. Nichols, G. B. Lachman, S. Droege, J. A. Newsome, S. D., J.-S. Park, B. W. Henry, A. Holden, M. L. Fogel,
Royel, and C. A. Langtimm. 2002. Estimating site occupancy rates J. Linthicum, V. Chu, and K. Hooper. 2010. Polybrominated
when detection probabilities are less than one. Ecology 83 diphenyl ether (PBDE) levels in Peregrine Falcon (Falco
(8):2248-2255. https://doi.org/10.1890/0012-9658(2002)083[2248: peregrinus) eggs from California correlate with diet and human
ESORWD]2.0.CO;2 population density. Environmental Science and Technology 44
(13):5248-5255. https://doi.org/10.1021/es100658e
MacKenzie, D. I., J. D. Nichols, and N. G. Yoccoz. 2006.
Occupancy estimation and modeling: inferring patterns and Nicholls, T. H., and D. W. Warner. 1972. Barred Owl habitat use
dynamics of species occurrence. Academic, Burlington, as determined by radiotelemetry. Journal of Wildlife Management
Massachusetts, USA. 36(2):213-224.
Mason, J. S. 2004. The reproductive sucess, survival, and natal Nilon, C. H. 2011. Urban biodiversity and the importance of
dispersal of Barred Owls (Strix Varia) in rural versus urban management and conservation. Landscape and Ecological
habitats in and around Charlotte, North Carolina. Dissertation. Engineering 7(1):45-52. https://doi.org/10.1007/s11355-010-0146-8
University of North Carolina, Charlotte, North Carolina, USA.
Odom, K. J., and D. J. Mennill. 2010. A quantitative description
Mazerolle, M. J. 2017. AICcmodavg: model selection and of the vocalizations and vocal activity of the Barred Owl. Condor
multimodel inference based on (Q)AIC(c). R package version 112(3):549-560. https://doi.org/10.1525/cond.2010.090163
2.1-1. R Foundation for Statistical Computing, Vienna, Austria.
R Core Team. 2018. R: a language and environment for statistical
Mazur, K. M., and P. C. James. 2000. Barred Owl (Strix varia). computing. R Foundation for Statistical Computing, Vienna,
In A.F. Poole and F. B. Gill, editors. The birds of North America. Austria.
Cornell Lab of Ornithology, Ithaca, New York, New York, USA.
Rognan, C. B., J. M. Szewczack, and M. L. Morrison. 2012.
https://doi.org/10.2173/bna.508
Autonomous recording of Great Gray Owls in the Sierra Nevada.
Mazur, K. M., P. C. James, M. J. Fitzsimmons, G. Langen, and Northwestern Naturalist 93(2):138-144. https://doi.org/10.1898/
R. H. M. Espie. 1997. Habitat associations of the Barred Owl in nwn11-02.1
the boreal forest of Saskatchewan, Canada. Journal of Raptor
RStudio Team. 2016. RStudio: integrated development for R.
Research 31(3):253-259.
RStudio Inc., Boston, Massachusetts, USA.
McGarigal, K., and J. D. Fraser. 1985. Barred Owl responses to
Rubino, M. J. 2001. Identifying Barred Owl habitat in the North
recorded vocalizations. Condor 87(4):552-553. https://doi.
Carolina piedmont: using GIS in focal species conservation
org/10.2307/1367961
planning. Thesis. North Carolina State University, Charlotte,
McKinney, M. L. 2002. Urbanization, biodiversity, and North Carolina, USA.
conservation. BioScience 52(10):883-890. https://doi.org/10.1641/0006-3568
Rullman, S., and J. M. Marzluff. 2014. Raptor presence along an
(2002)052[0883:UBAC]2.0.CO;2
urban–wildland gradient: influences of prey abundance and land
McLaren, M. A., I. D. Thompson, and J. A. Baker. 1998. Selection cover. Journal of Raptor Research 48(3):257-272. https://doi.
of vertebrate wildlife indicators for monitoring sustainable forest org/10.3356/JRR-13-32.1
management in Ontario. Forestry Chronicle 74(2):241-248.
Schlaepfer, M. A., M. C. Runge, and P. W. Sherman. 2002.
https://doi.org/10.5558/tfc74241-2
Ecological and evolutionary traps. Trends in Ecology and
Medley, K. E., M. J. McDonnell, and S. T. A. Pickett. 1995. Forest- Evolution 17(10):474-480. https://doi.org/10.1016/S0169-5347
landscape structure along an urban-to-rural gradient. (02)02580-6
Professional Geographer 47(2):159-168.
Sheffield, S. R. 1997. Owls as biomonitors of environmental
Millsap, B. A. 2018. Demography and metapopulation dynamics contamination. Pages 383-398 in Biology and conservation of owls
of an urban Cooper’s Hawk subpopulation. Condor 120(1):63-80. of the Northern Hemisphere: Second International Owl Symposium
https://doi.org/10.1650/CONDOR-17-124.1 (Winnipeg, Manitoba, Canada, 1997). U.S. Forest Service, North
Central Forest Experiment Station, St. Paul, Minnesota, USA.
Mosher, J. A., M. R. Fuller, and M. Kopeny. 1990. Surveying
woodland raptors by broadcast of conspecific vocalizations. Shonfield, J., and E. M. Bayne. 2017. The effect of industrial noise
Journal of Field Ornithology 61(4):453-461. on owl occupancy in the boreal forest at multiple spatial scales.
Avian Conservation and Ecology 12(2):13. https://doi.org/10.5751/
Mountrakis, G., J. Im, and C. Ogole. 2011. Support vector
ACE-01042-120213
machines in remote sensing: a review. ISPRS Journal of
Photogrammetry and Remote Sensing 66:247-259. https://doi. Shonfield, J., S. Heemskerk, and E. M. Bayne. 2018. Utility of
org/10.1016/j.isprsjprs.2010.11.001 automated species recognition for acoustic monitoring of owls.
Journal of Raptor Research 52(1):42-55. https://doi.org/10.3356/
National Oceanic and Atmospheric Administration (NOAA)
JRR-17-52.1
Digital Coast. 2011. Data Access Viewer: 2011 South Carolina
DNR Lidar: Tricounty (Anderson, Oconee, Pickens). NOAA Stevens, D. L., Jr., and A. R. Olsen. 2004. Spatially balanced
Office for Coastal Management, Charleston, South Carolina, sampling of natural resources. Journal of the American Statistical
Association 99:262-278. https://doi.org/10.1198/016214504000000250You can also read