First constraints on the AGN X-ray luminosity function at z 6 from an eROSITA-detected quasar
←
→
Page content transcription
If your browser does not render page correctly, please read the page content below
Astronomy & Astrophysics manuscript no. aanda                                                                                          ©ESO 2021
                                               January 15, 2021

                                                    First constraints on the AGN X-ray luminosity function at z ∼ 6
                                                                   from an eROSITA-detected quasar
                                                 J. Wolf ?1, 2 , K. Nandra1 , M. Salvato1 , T. Liu1 , J. Buchner1 , M. Brusa3, 4 , D. N. Hoang5 , V. Moss6, 7 , R. Arcodia1 ,
                                                  M. Brüggen5 , J. Comparat1 , F. de Gasperin5 , A. Georgakakis8 , A. Hotan9 , G. Lamer10 , A. Merloni1 , A. Rau1 ,
                                                               H. J. A. Rottgering11 , T. W. Shimwell12, 11 , T. Urrutia10 , M. Whiting6 , and W. L. Williams12

                                                       1
                                                           Max-Planck-Institut für extraterrestrische Physik, Gießenbachstraße 1, 85748 Garching, Germany
                                                       2
                                                           Exzellenzcluster ORIGINS, Boltzmannstr. 2, D-85748 Garching, Germany
                                                       3
                                                           Dipartimento di Fisica e Astronomia dell’Università degli Studi di Bologna, via P. Gobetti 93/2, 40129 Bologna, Italy
                                                       4
                                                           INAF/OAS, Osservatorio di Astrofisica e Scienza dello Spazio di Bologna, via P. Gobetti 93/3, 40129 Bologna, Italy
arXiv:2101.05585v1 [astro-ph.GA] 14 Jan 2021

                                                       5
                                                           Hamburger Sternwarte, University of Hamburg, Gojenbergsweg 112, 21029 Hamburg, Germany
                                                       6
                                                           ATNF, CSIRO Astronomy and Space Science, PO Box 76, Epping, New South Wales 1710, Australia
                                                       7
                                                           Sydney Institute for Astronomy, School of Physics A28, University of Sydney, Sydney, NSW 2006, Australia
                                                       8
                                                           Institute for Astronomy and Astrophysics, National Observatory of Athens, V. Paulou and I. Metaxa, 11532, Greece
                                                       9
                                                           ATNF, CSIRO Astronomy and Space Science, PO Box 1130, Bentley, WA 6102, Australia
                                                      10
                                                           Leibniz-Institut für Astrophysik Potsdam, An der Sternwarte 16, 14482 Potsdam, Germany
                                                      11
                                                           Leiden Observatory, Leiden University, PO Box 9513, 2300 RA Leiden, The Netherlands
                                                      12
                                                           ASTRON, the Netherlands Institute for Radio Astronomy, Postbus 2, 7990 AA, Dwingeloo, The Netherlands

                                                     Received October 20, 2020; accepted XX

                                                                                                                   ABSTRACT

                                                     Context. High-redshift quasars signpost the early accretion history of the Universe. The penetrating nature of X-rays enables a less
                                                     absorption-biased census of the population of these luminous and persistent sources compared to optical/near-infrared(NIR) colour
                                                     selection. The ongoing SRG/eROSITA X-ray all-sky survey offers a unique opportunity to uncover the bright end of the high-z quasar
                                                     population and probe new regions of colour parameter space.
                                                     Aims. We searched for high-z quasars within the X-ray source population detected in the contiguous ∼ 140 deg2 field observed by
                                                     eROSITA during the performance verification phase. With the purpose of demonstrating the unique survey science capabilities of
                                                     eROSITA, this field was observed at the depth of the final all-sky survey. The blind X-ray selection of high-redshift sources in a large
                                                     contiguous, near-uniform survey with a well-understood selection function can be directly translated into constraints on the X-ray
                                                     luminosity function (XLF), which encodes the luminosity-dependent evolution of accretion through cosmic time.
                                                     Methods. We collected the available spectroscopic information in the eFEDS field, including the sample of all currently known
                                                     optically selected z > 5.5 quasars and cross-matched secure Legacy DR8 counterparts of eROSITA-detected X-ray point-like sources
                                                     with this spectroscopic sample.
                                                     Results. We report the X-ray detection of eFEDSU J083644.0+005459, an eROSITA source securely matched to the well-known
                                                     quasar SDSS J083643.85+005453.3 (z=5.81). The soft X-ray flux of the source derived from eROSITA is consistent with previous
                                                     Chandra observations. The detection of SDSS J083643.85+005453.3 allows us to place the first constraints on the XLF at z > 5.5
                                                     based on a secure spectroscopic redshift. Compared to extrapolations from lower-redshift observations, this favours a relatively flat
                                                     slope for the XLF at z ∼ 6 beyond L∗ , the knee in the luminosity function. In addition, we report the detection of the quasar with
                                                     LOFAR at 145 MHz and ASKAP at 888 MHz. The reported flux densities confirm a spectral flattening at lower frequencies in the
                                                     emission of the radio core, indicating that SDSS J083643.85+005453.3 could be a (sub-) gigahertz peaked spectrum source. The
                                                     inferred spectral shape and the parsec-scale radio morphology of SDSS J083643.85+005453.3 indicate that it is in an early stage of
                                                     its evolution into a large-scale radio source or confined in a dense environment. We find no indications for a strong jet contribution to
                                                     the X-ray emission of the quasar, which is therefore likely to be linked to accretion processes.
                                                     Conclusions. Our results indicate that the population of X-ray luminous AGNs at high redshift may be larger than previously thought.
                                                     From our XLF constraints, we make the conservative prediction that eROSITA will detect ∼ 90 X-ray luminous AGNs at redshifts
                                                     5.7 < z < 6.4 in the full-sky survey (De+RU). While subject to different jet physics, both high-redshift quasars detected by eROSITA
                                                     so far are radio-loud; a hint at the great potential of combined X-ray and radio surveys for the search of luminous high-redshift quasars.
                                                     Key words. quasars: individual – Galaxies: high-redshift – X-rays: galaxies

                                               1. Introduction                                                             throughout cosmic time. The detection of quasars at z > 5.5 in
                                                                                                                           the past two decades is an intriguing development, because their
                                               Active galactic nuclei (AGNs) are the brightest persistent bea-             associated black hole masses challenge our understanding of the
                                               cons in the universe and sign-post the population of accret-                formation and initial growth of SMBHs. Testing black hole seed
                                               ing super-massive black holes (SMBHs) and their evolution                   models requires a complete census of high-redshift AGNs en-
                                                                                                                           coded in well-constrained luminosity functions. In this redshift
                                                ?
                                                    jwolf@mpe.mpg.de

                                                                                                                                                                       Article number, page 1 of 16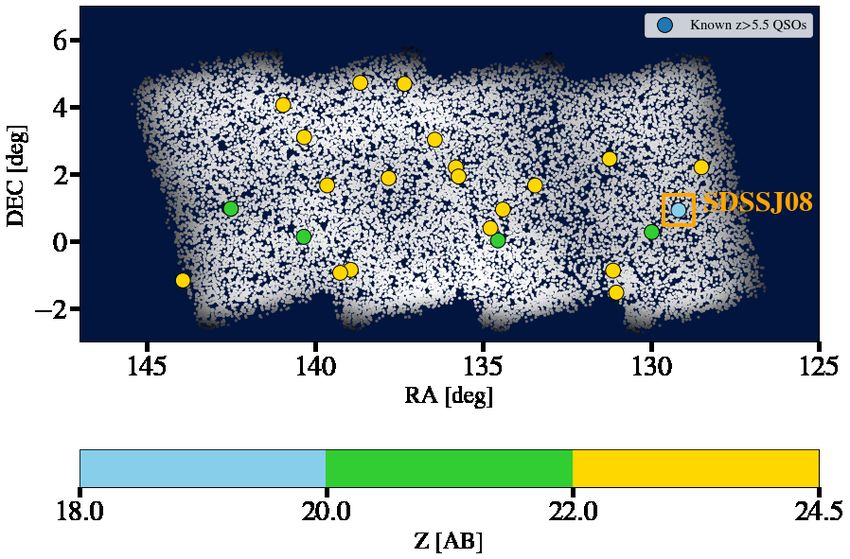
A&A proofs: manuscript no. aanda

regime, X-rays in the soft band (0.2 − 2.3 keV for eROSITA)
probe the restframe hard X-ray emission of the distant sources
(∼ 1.3 − 15 keV at z > 5.5). The soft X-ray selection of AGNs
therefore suffers less from absorption biases. However, so far,
optical and infrared dropout-selected AGNs at z > 5.5 (e.g Fan
et al. 2001; Willott et al. 2009; Venemans et al. 2013; Reed
et al. 2015; Bañados et al. 2016; Matsuoka et al. 2016; Wang
et al. 2017; Bañados et al. 2018) significantly outnumber X-
ray selected ones because of the lack of sufficiently wide and
deep X-ray surveys backed up by homogeneous ancillary multi-
wavelength data. Currently, about 345 sources have been dis-
covered in dedicated optical/near-infrared(NIR) surveys. Chan-
dra and XMM-Newton pointed observations of known quasars in
the range z = 5.7 − 7.54 have led to the detection of an X-ray sig-
nal for only approximately 30 of these objects (e.g. Brandt et al.
2002; Nanni et al. 2017; Vito et al. 2019; Pons et al. 2020). How-
ever, such X-ray follow-up samples suffer from the selection bi-       Fig. 1: Detected point-like sources in eFEDS colour-coded ac-
ases of the optical selection because of tight colour–magnitude        cording to their spatial density (brighter is denser). The visible
constraints and absorption.                                            difference in source density is due to the non-uniform exposure
                                                                       of the eFEDS field (Brunner et al. in prep). Known z>5.5 QSOs
    For the study of accretion history, absorption biases can be       in the footprint are shown as circles and are colour-coded accord-
avoided by constructing the X-ray luminosity function (XLF,            ing to their z-band magnitude. The detected quasar is marked by
Hasinger et al. 2005; Ueda et al. 2014; Vito et al. 2014; Miyaji       an orange square.
et al. 2015; Aird et al. 2015; Georgakakis et al. 2015; Buchner
et al. 2015; Khorunzhev et al. 2018; Ananna et al. 2019) from
a purely X-ray-selected sample. However, only three X-ray-             contiguous survey constrains models of the space density of X-
selected AGNs have been identified at z > 5 so far (in the Chan-       ray-emitting AGNs.
dra Deep Fields, COSMOS and XMM-XXL Barger et al. 2003;                    The optical counterpart determination procedure for eFEDS
Marchesi et al. 2016; Menzel et al. 2016) with the most distant        sources is outlined in Section 2. The identified quasar and the
being at z=5.3. These surveys suffer from the small cosmologi-         extraction and reduction of the eROSITA spectral data are pre-
cal volume they probe. The full-sky survey currently being car-        sented in Section 3. In Section 4, we investigate the multi-
ried out with the extended ROentgen Survey with an Imaging             wavelength properties of eFEDSU J083644.0+005459/SDSSJ08
Telescope Array (eROSITA) on board the Spectrum-Roentgen-              using ancillary data. The new radio data from LOFAR and
Gamma (SRG) mission (Predehl et al. 2020) will allow us to             ASKAP are presented in Section 5. In Section 6, we derive con-
overcome these limitations and probe the bright end of the XLF         straints on the X-ray AGN space density at high redshift from
at high redshifts with a limiting flux of ∼ 10−15 erg s−1 cm−2 . For   the detection of SDSSJ08. We discuss the origin of the X-ray
comparison, the second ROSAT all-sky survey catalogue (2RXS            emission in Section 7. After comparing the detection to expected
Boller et al. 2016) reached a depth of ∼ 10−13 erg s−1 cm−2 . In-      source counts from optical surveys, we conclude by making
deed, as early as the early months of the first eROSITA all-sky        a prediction for the expected number of z>5.7 quasars which
survey, Medvedev et al. (2020a,b) reported the detection of the        will be found in eRASS:8. We assume a flat ΛCDM cosmology
X-ray ultra-luminous source SRGE J142952.1+544716, which               (Planck Collaboration et al. 2020): Ωm = 0.31, ΩΛ = 0.69 and
is matched to the z=6.18 quasar CFHQS J142952+544717                   H0 = 68 km s−1 Mpc−1 . Unless stated otherwise, uncertainties
(henceforth CFHQJ14).                                                  are given at the 68% confidence level.
    In the present work, we exploit the contiguous area of
∼ 140 deg2 observed by eROSITA during the calibration and              2. Optical counterparts to eFEDS sources
performance verification phase with the purpose of demon-
strating the science capabilities of the all-sky survey after 4        The eFEDS survey was carried out by eROSITA between 3 and 7
years (eRASS:8, ∼ 2.3 ks): the eROSITA Final Equatorial                November 2019 to a nominal depth of approximately 2.3 ks, cor-
Depth Survey (eFEDS). We report here the blind detection               responding to a flux limit of F0.5−2 keV ∼ 10−14 erg s−1 cm−2 . The
of a high-redshift X-ray source (eFEDSU J083644.0+005459),             source detection is performed in the 0.2-2.3 keV band using a
that we could identify as the well-known quasar SDSS                   sliding box algorithm from the eROSITA Science Analysis Soft-
J083643.85+005453.3 (z=5.81, Fan et al. 2001, henceforth               ware System (eSASS). The catalogue is presented in Brunner et
SDSSJ08). This quasar was initially discovered by i-band               al. (in preparation). In Fig. 1, the footprint of the survey is pre-
dropout selection in the main Sloan Digital Sky Survey (SDSS).         sented. The resulting eFEDS source catalogue contains 27910
CFHQJ14 and SDSSJ08 are the highest-redshift X-ray-selected            sources from which 27369 are classified as point-like.
AGNs known to date. Taking advantage of the synergy between                 The field is embedded in the footprint of the Legacy Sur-
the eROSITA detection and new radio data from the LOw-                 vey DR8 (LS8) survey, which provides photometry in the g, r,
Frequency Array (LOFAR; van Haarlem et al. 2013) and the               and z bands and in mid-infrared wavebands via forced photom-
Australian Square Kilometre Array Pathfinder (ASKAP, John-             etry at the optical positions on Wide-field Infrared Survey Ex-
ston et al. 2008, Hotan et al. submitted) Survey With ASKAP of         plorer (WISE) images (unWISE data release, Wright et al. 2010;
GAMA-09 + X-Ray (SWAG-X, Moss et al. in prep) programme,               Schlafly et al. 2019). With close-to uniform 5σ depths g ∼ 24.0,
we investigate the origin of the X-ray emission from SDSSJ08           r ∼ 23.4, and z ∼ 22.5 (AB magnitudes), LS8 ensures the de-
and find further evidence for a confined jetted radio structure.       termination of secure counterparts for eFEDS sources to a high
We consequently discuss how the detection of the quasar in a           level of completeness.
Article number, page 2 of 16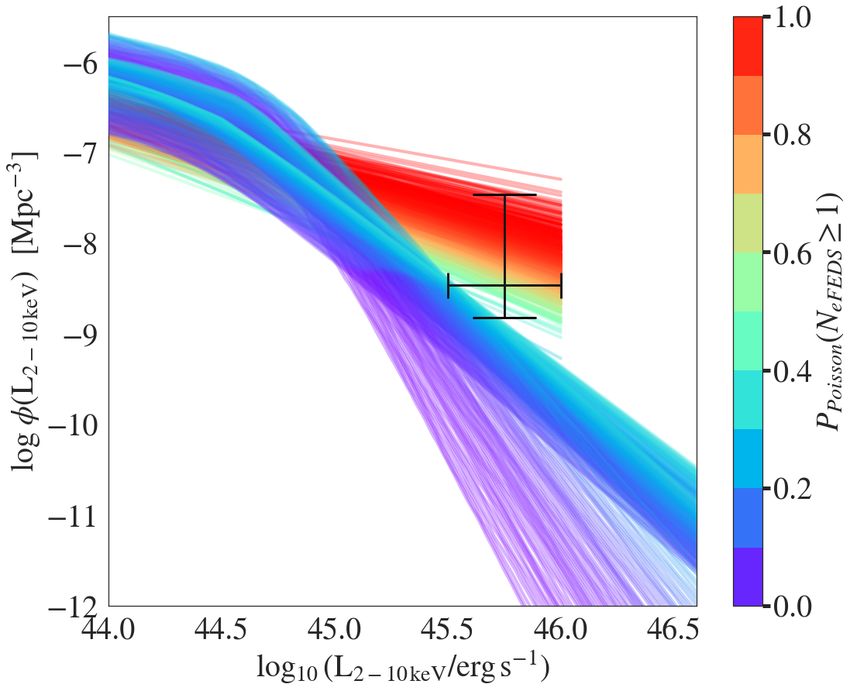
Wolf et al.: eROSITA high-z quasar

     The eFEDS point-like sources were cross-matched to LS8           eFEDS ID                     -       eFEDSU J083644.0+005459
optical counterparts in a two-method approach, which will be de-      RAeFEDS                   [deg]      129.1834
tailed further in Salvato et al. (in prep.). All LS8 sources within   DECeFEDS                  [deg]      0.9164
3000 of an X-ray source are considered as potential counterparts.     σRADEC,eFEDS             [arcsec]    4.1
There are an average of approximately 20 LS8 sources within           DETLIKE                      -       11.00
this radius for each X-ray source at the depth of eFEDS.              Counts (0.2-2.3 keV)         -       14.4 ± 5.0
     A careful treatment of astrometry and additional photomet-       LS8 objID/brickID            -       926/336644
ric information is needed to associate each source with its cor-      Sep.X/LS8                [arcsec]    6.3
rect optical counterpart. The counterpart identification was per-     QSO ID                       -       SDSS J083643.85+005453.3
formed using the Bayesian cross-matching algorithm NWAY1              QSO Redshift                 -       5.81
(Salvato et al. 2018). In addition to the positional offset and       Sep.QSO/LS8              [arcsec]     5.5 quasars in the
                                                                      analysis software BXA (Buchner et al. 2014), which connects the
eFEDS footprint. which were all discovered in dedicated opti-
                                                                      X-ray spectral fitting tool XSPEC (v12.11, Arnaud 1996) to the
cal searches (Fan et al. 2001; Venemans et al. 2015; Matsuoka
                                                                      nested sampling algorithm MultiNest (Feroz et al. 2009). The fit
et al. 2018a,b, 2019). In Fig. 1, we have colour-coded these
                                                                      was performed in the 0.3 - 8.0 keV energy range. A simple red-
sources according to their z-band magnitude, which clearly re-
                                                                      shifted power-law model only accounting for Galactic absorp-
veals a decrease in space-density with increasing optical bright-
                                                                      tion was chosen to fit the extracted spectrum: tbabs*zpowerlw.
ness. SDSSJ08 is by far the brightest of all z>5.5 quasars in
                                                                      In addition we used a background model, which was trained on
the field. It has previously been observed in X-rays in a follow-
                                                                      eFEDS AGN spectra using a principal component analysis and
up program of high-redshift Sloan quasars (Brandt et al. 2002).
                                                                      scaled to the source and background extraction sizes following
The measured flux is higher than the average soft flux limit
                                                                      Simmonds et al. (2018, see their appendix A). The correspond-
of eROSITA in the field (∼ 8 × 10⁻¹⁵ erg cm−2 s−1 ). This high-
                                                                      ing Galactic absorbing column density is taken from HI4PI Col-
redshift quasar is also the only radio-loud one in the list.
                                                                      laboration et al. (2016): NH = 4.8 × 1020 cm−2 . The power law
    In the eFEDS catalogue, eFEDSU J083644.0+005459 has               is shifted to the spectroscopic redshift of the quasar. The low
14.4±5.0 source model counts. These model counts are obtained         photon counting statistics limit our ability to accurately retrieve
by fitting the point-spread function (PSF) to a count rate image      X-ray spectral parameters. Nevertheless, we allow the photon in-
(the ratio of the spatial count distribution and on-axis exposure     dex Γ, the normalisation of the power law, and the normalisation
time corrected for vignetting). Background and exposure maps          of the background model to vary freely in the fit in order to re-
are used in the fitting procedure. The corrected exposure time for    trieve realistic error bars on the measured X-ray fluxes. The best
the source is ML_EXP = 1179 s.                                        fit was determined with the C-statistic (Cash 1979). We assumed
                                                                      a flat uniform prior for the photon index, restricting the range to
1
    https://github.com/JohannesBuchner/nway                           Γ = 1 − 3. The resulting posterior parameter distributions are
2                                                                                                                            +0.49
    https://github.com/ruizca/astromatch                              shown in Fig. 4. We obtain a photon index of 2.20−0.60       . While
                                                                                                              Article number, page 3 of 16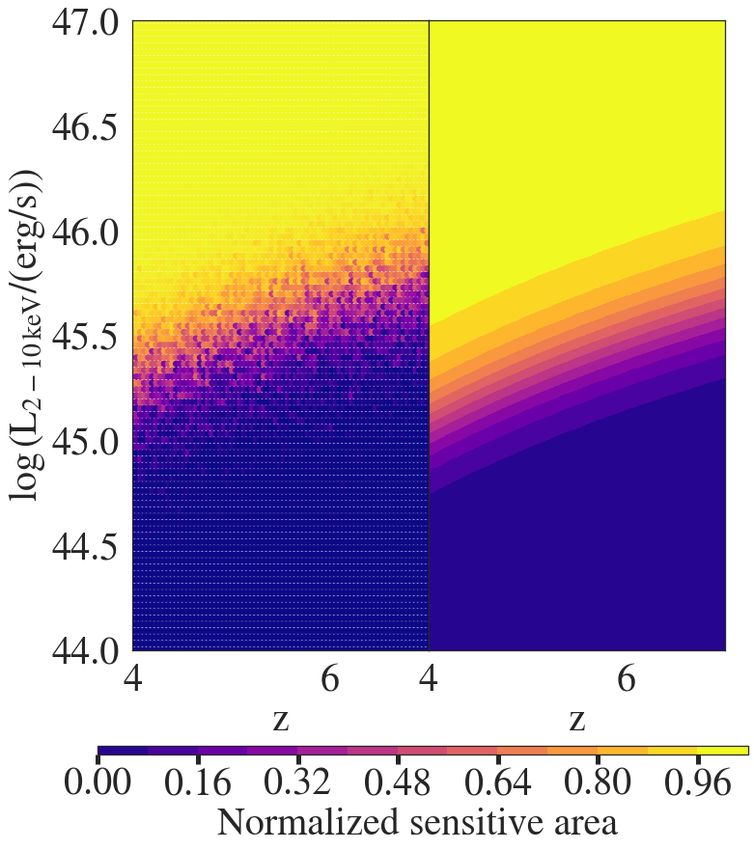
A&A proofs: manuscript no. aanda

Fig. 2: (Left) 70 image of the eROSITA events centred at the optical position of SDSSJ08 (full band 0.2-10 keV). The circle has a
radius of 30”. The square shows the size of the field shown in Fig. 8. (Right) G, I, and Y 60” x 60” HSC (PDR2) image centred at
the coordinates of the SDSSJ08 associated eFEDS source. The orange cross shows the optical position of the quasar. The eROSITA
contours are derived from the eFEDS image smoothed with a Gaussian kernel. The black dot in the lower left corner shows the
eROSITA FWHM of the eROSITA PSF in survey mode (12”).

Γ is not well constrained, it tends to typical values of X-ray-
detected, radio-quiet quasars in this redshift regime. From their
joint spectral analysis of X-ray-detected z > 6 quasars, Vito et al.
(2019) derived an average photon index of Γ = 2.20+0.22
                                                     −0.20 , a value
consistent with earlier results by Nanni et al. (2017) who per-
formed the same exercise for a z > 5.7 quasar sample.
    We compute the soft band flux and intrinsic luminosity from
the fitted model. The errors are propagated with XSPEC using
the posterior samples. The resulting soft-band flux-corrected for
Galactic absorption, intrinsic 2 − 10 keV luminosity, monochro-
matic luminosity at 2 keV, as well as the photon index and the
two-point spectral X-ray to optical spectral index (see Section
3.3) are displayed in Table 2.
    SDSSJ08 has an X-ray detection from a Chandra follow-
up observation in 2002 (Brandt et al. 2002). Using a frozen
power-law model with Γ = 2 and Galactic absorption NH =
4.4 × 1020 cm−2 (Stark et al. 1992) these authors obtained a
soft-band flux of F0.5−2.0 keV = 1.05 × 10⁻¹⁴ erg cm−2 s−1 . The
broad-band Chandra image taken at the optical position of the
quasar reveals a single point-like source, which is strong evi-
dence against any contamination in eROSITA from X-ray emis-
sion from any other source within a radius of 30”. Re-analysing
the Chandra data with a slightly lower photon index (Γ = 1.9),         Fig. 3: Posterior marginal distributions of Γ, normalisation of
Nanni et al. (2017) derived the rest-frame intrinsic luminosity        the power law (zpl), and normalisation of the PCA background
L2.0−10.0kev = 4.2+1.0       45     −1
                   −1.4 × 10 erg s . With respect to the com-          model (bkg). The photon index remains poorly constrained but
plete sample of X-ray detected z>5.7 quasars (Nanni et al. 2017;       is consistent with typical X-ray spectral slopes of the radio quiet
Vito et al. 2019; Pons et al. 2020), this makes SDSSJ08 one            quasar population.
of the four most X-ray luminous high-redshift quasars known
to date, together with CFHQJ14 (Willott et al. 2010; Medvedev
et al. 2020a), SDSS J010013.02+280225.8 (Wu et al. 2015; Ai            SDSSJ08 are consistent with those reported by Brandt et al.
et al. 2016), and PSO J030947.49+271757.31, the blazar dis-            (2002) and Nanni et al. (2017). For a direct comparison with
covered by Belladitta et al. (2020). This can be seen in Fig.          the results of Brandt et al. (2002), we have also computed the
5, where we present the redshift–luminosity plane for X-ray-           unabsorbed flux in the 0.5-2 keV band, fixing Γ = 2 and using
detected z > 5.7 quasars. The luminosity and flux derived for          the Galactic absorption quoted in Stark et al. (1992). We obtain
Article number, page 4 of 16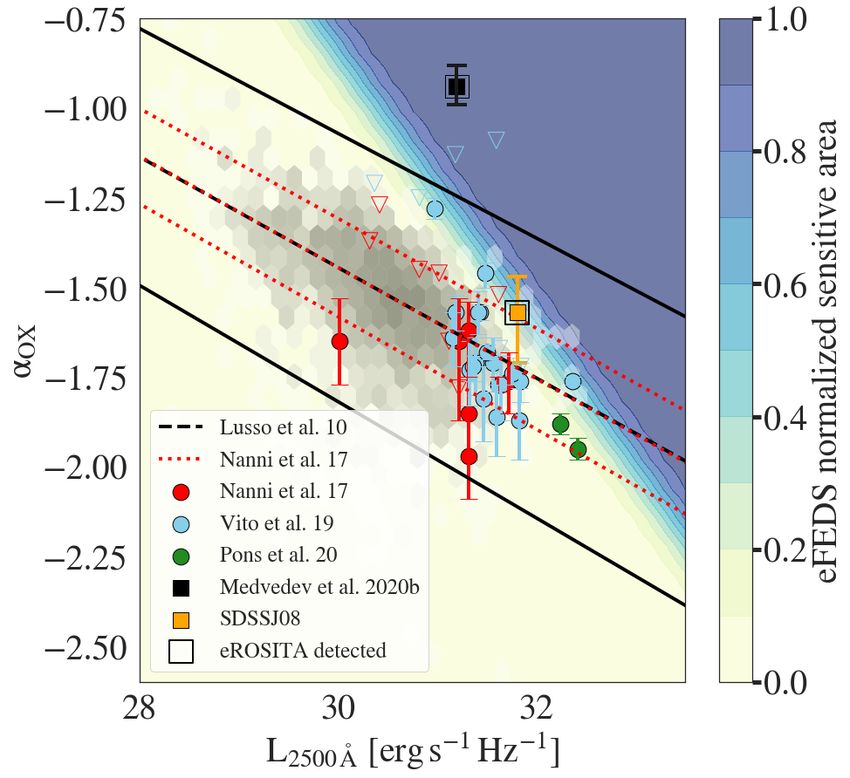
Wolf et al.: eROSITA high-z quasar

Fig. 4: X-ray spectrum for eFEDSU J083644.0+005459. The ob-          Fig. 5: Intrinsic hard X-ray luminosity as a function of redshift
served count rates are shown in black. The fit was performed         for X-ray detected z > 5.7 quasars. SDSSJ08 lies at the X-ray
in the range 0.3 - 8.0 keV. The fitted source model (blue) and       luminous end of the sample. The luminosity of SDSSJ08 is com-
combined source and background model (red) are also presented.       puted from the eROSITA data. The quasar lies at the X-ray lumi-
The residuals are shown in the lower panel.                          nous end of the sample. eROSITA detected sources are marked
                                                                     by an empty square. In the case of overlapping sources in the
                                                                     sample of Nanni et al. (2017) and Vito et al. (2019), only the
      X-ray property                 Units         Value             data points from the latter are shown.
      1
          F0.5−2 keV     [10−14 erg cm−2 s−1 ]    9.9+3.7
                                                     −3.2
                                                                     bution of the L2−10 keV rest-frame luminosity and the associated
      2
          L2−10 keV          [1045 erg s−1 ]      4.7+2.2
                                                     −1.6            photon index Γ for each solution:
      3
          Lν              [1027 erg s−1 Hz−1 ]    7.0+6.0
                                                     −3.9
      4
          αOX                          -         −1.57+0.10                      L2−10 keV
                                                      −0.13          L2 keV = R ν10 keV         ν1−Γ .                                 (2)
                                                                                        ν 1−Γ dν 2 keV
      5
          Γ                            -         2.20+0.49
                                                     −0.60                     ν 2 keV

                                                                         L2500 Å was extrapolated from the UV absolute magnitude
Table 2: Derived X-ray properties. 1 Soft X-ray flux corrected
                                                                     M1450 Å listed by Jiang et al. (2016). An optical spectral slope
for Galactic absorption. 2 X-ray 2-10 keV rest-frame luminosity.
3                                                                    of α = −0.3 was assumed (e.g. Vito et al. 2019), corresponding
  Monochromatic rest-frame luminosity at 2 keV. 4 : The X-ray to
                                                                     to a correction M2500 Å ≈ M1450 Å − 0.18. The value of the X-ray
optical spectral slope. 5 : Photon index.
                                                                     to optical slope for SDSSJ08 is given in Table 2. For the same
                                                                     quasar, Nanni et al. (2017) measured αOX = −1.61+0.03  −0.06 , consis-
                   +0.42
F0.5−2 keV = (1.01−0.34  ) × 10−14 erg cm−2 s−1 , a value which is   tent with our estimated −1.57+0.10
                                                                                                      −0.13 . There is a well-established
consistent with the previous Chandra results. We therefore find      anti-correlation between αOX and L2500 Å for z < 5 AGNs, also
no evidence for X-ray variability in SDSSJ08 over a timescale        investigated directly in the L2 keV − L2500 Å plane (e.g. Avni &
of ∼ 20 years.                                                       Tananbaum 1986; Strateva et al. 2005; Just et al. 2007; Lusso
                                                                     et al. 2010). Performing a linear regression in the αOX − L2500 Å
                                                                     plane, Nanni et al. (2017) argue that their sample of 29 X-ray-
3.3. X-ray loudness                                                  detected z > 5.7 quasars followed the anti-correlation well. From
                                                                     their sample of z > 6 radio-quiet quasars, Vito et al. (2019) find
The non-linear relation between X-ray and optical emission of        no significant evolution of this trend with redshift.
quasars has been studied via the αOX parameter (Tananbaum                The eFEDS quasar shows a typical ‘X-ray loudness’ with re-
et al. 1979), the optical to X-ray spectral index. This quantity     spect to the αOX -luminosity relation. For CFHQJ14, Medvedev
measures the relative strength of UV continuum and coronal X-        et al. (2020a) reported a significant deviation from the rela-
ray emission in the active core:                                     tion, arguing that this flattening of the spectral slope could be
                                                                     caused by an excess X-ray emission, possibly related to the
                               !                                     inverse Compton scattering of cosmic microwave background
                       L2 keV
αOX = 0.384 × log10              ,                             (1)   photons off the jet (iC-CMB, Tavecchio et al. 2000; Celotti et al.
                       L2500 Å                                       2001). Despite being radio-loud (Bañados et al. 2015), SDSSJ08
                                                                     does not display such an X-ray excess. We show how the two
where L2 keV and L2500 Å are the rest-frame monochromatic lumi-      eROSITA-detected z > 5.7 quasars are distributed with respect
nosities at 2 keV and 2500 Å. We computed the 2 keV monochro-        to this relation in Fig. 6. The αOX − L2500Å relation derived by
matic luminosity and its uncertainties from the posterior distri-    Lusso et al. (2010) on a sample of XMM-COSMOS AGNs is
                                                                                                              Article number, page 5 of 16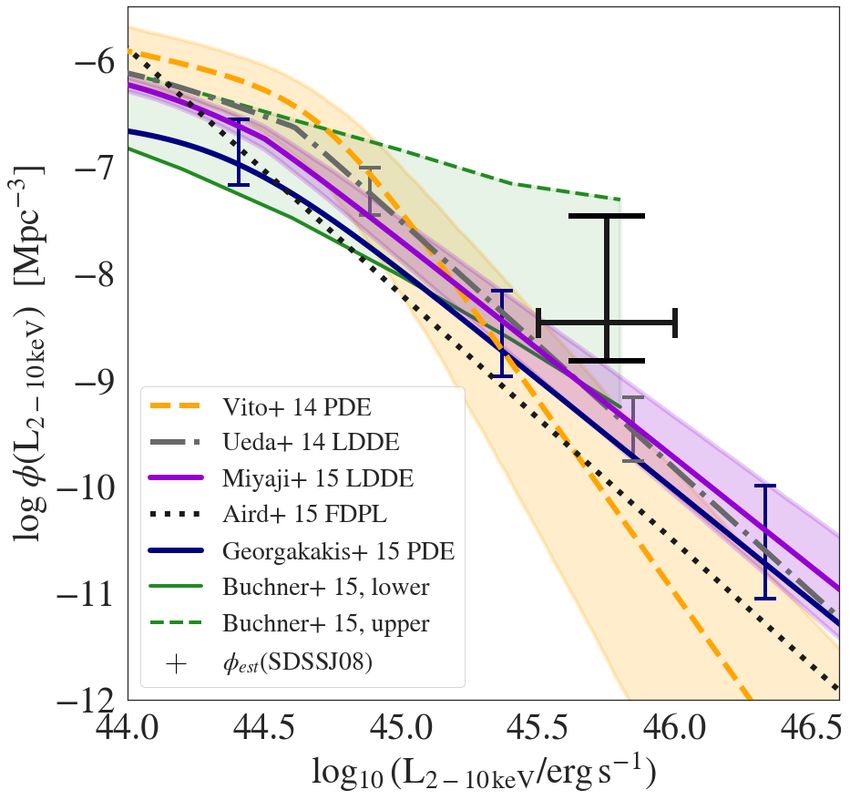
A&A proofs: manuscript no. aanda

                                                                                   Frequency      Flux density
                                                                      Telescope                                     Survey/Ref.
                                                                                   [GHz]          [mJy]
                                                                      GMRT         0.150          < 6.1 (3σ)        1
                                                                                                                      TGSS-ADR1
                                                                                                                    2
                                                                      VLA          1.4            1.11 ± 0.15         FIRST
                                                                                                                    3
                                                                      VLA          1.4            2.1                 NVSS,
                                                                                                                    Petric et al. (2003)
                                                                      VLA          1.4            1.75 ± 0.04       Petric et al. (2003)
                                                                      VLA          1.4            1.96 ± 0.31       Frey et al. (2005)
                                                                      EVN          1.6            1.1               Frey et al. (2003)
                                                                      VLA          5              0.580 ± 0.057     Petric et al. (2003)
                                                                      VLA          5              0.43 ± 0.06       Frey et al. (2005)
                                                                      EVN          5              0.34              Frey et al. (2005)
                                                                      MAMBO        250            < 2.9 (3σ)        Petric et al. (2003)

                                                                      Table 3: Archival radio observations of SDSSJ08. 1 :Intema et al.
                                                                      (2017), Coppejans et al. (2017); 2 : Becker et al. (1995),White
                                                                      et al. (1997); 3 : Due to the low resolution of NVSS (4500 ), the re-
                                                                      ported flux density of 2.5±0.5 in Condon et al. (1998) is contami-
                                                                      nated by a source located 1000 to the south of SDSSJ08. We sub-
Fig. 6: X-ray-to-optical slope anti-correlates with the UV            tracted the contribution of the contaminated source (0.44 mJy;
monochromatic luminosity at 2500 Å. SDSSJ08 (orange circle)           Petric et al. 2003) from the reported value.
is consistent with the best-fitting relation of Lusso et al. (2010,
dashed line) and Nanni et al. (2017, red dotted line). The z > 5.7
X-ray-detected sources from Nanni et al. (2017, restricted to         spectral slope is indicative of the presence of substantial amounts
z < 6 and ignoring SDSSJ08), Vito et al. (2019) and Pons              of dust in the environment of SDSSJ08.
et al. (2020) are shown. The empty triangles denote upper limits
from undetected sources (same colour code as detected sources).
The grey density scale shows a sample of 2685 XMM-Newton-             4.2. Spectral energy distribution
detected z < 5 SDSS quasars (Lusso & Risaliti 2016). The con-         SDSSJ08 has been covered by a number of imaging surveys over
tours show the eFEDS normalised, sensitive area derived from          the entire spectral energy distribution (SED)3 . In addition, we
synthetic power-law spectra at z = 6 with Γ = 2 and Galactic          carried out simultaneous g0 , r0 , i0 , z0 , J, H, and Ks -band pho-
absorption. We note that CFHQJ14 (black point) tends towards          tometry of SDSSJ08 with the Gamma-Ray Burst Optical/Near-
flatter αOX values than X-ray-detected quasars at similar UV lu-      Infrared Detector (GROND, Greiner et al. 2008) at the MPG
minosities. Its αOX was computed from the luminosity reported         2.2 m telescope at the ESO La Silla observatory. The resulting
in Medvedev et al. (2020b).                                           SED is presented in Fig. 7. We fitted the composites of radio-
                                                                      loud and radio-quiet quasars by Shang et al. (2011) with the pho-
                                                                      tometric code LePhare (Arnouts et al. 1999; Ilbert et al. 2006).
shown, as is the one obtained by Nanni et al. (2017) on their         This figure can be directly compared to the SED of CFHQJ14
sample of z > 5.7 quasars.                                            presented by Medvedev et al. (2020a). For the fit, the redshift
                                                                      was fixed to its spectroscopic value. We note that SDSSJ08 does
                                                                      not display the X-ray excess typically observed in radio-loud
                                                                      quasars (Wilkes & Elvis 1987; Shastri et al. 1993; Reeves et al.
4. Archival multi-wavelength properties
                                                                      1997) and is more consistent with the radio-quiet template in the
4.1. Optical selection and spectroscopy:                              radio and X-ray part of the SED. The overall radio output is well
                                                                      below that of the radio-loud template. We summarise all avail-
SDSSJ08 was initially discovered through i-dropout selection          able archival radio data for SDSSJ08 in the following section.
and consecutive spectroscopic confirmation in ∼ 1550 deg2 of
the SDSS main survey (Fan et al. 2001). It is part of a sample of
52 z > 5.4 quasars that were found by exploiting imaging data         4.3. Archival radio properties
in the SDSS main survey (Jiang et al. 2016). The i − z > 2.2          All the radio fluxes measurements and upper limits associated to
dropout criterion selects z > 5.8 quasars, because the neutral        SDSSJ08 are reported in Table 3. Coppejans et al. (2017) ascribe
hydrogen absorption bluewards of the Lyα line is shifted in the       the tension between some of the 1.4 GHz flux-density measure-
i-band. A redshift of z = 5.81 was measured by Kurk et al. (2009)     ments to resolution effects (e.g. NVSS has a resolution of 4500 )
using VLT/ISAAC NIR observations. Fan et al. (2001) report a          but could not entirely exclude variability. Assembling all avail-
strong and broad Lyα and NV complex with an equivalent width          able radio data on this quasar, these latter authors estimated the
of ∼ 70 Å. The quasar is extremely luminous with an absolute          radio spectral slope of αr = −0.89 ± 0.29. In this work, sources
AB magnitude M1450Å = −27.86 (Jiang et al. 2016). Its black
                                                                      3
hole mass of (2.7 ± 0.6) × 109 M , was derived from the width            Gaia (Gaia Collaboration et al. 2018), Pan-STARRS1 (Chambers
                                                                      et al. 2016), HSC SSP, LS8. It has also been detected in NIR and mid-
of the broad MgII λ2800Å line (Kurk et al. 2009). Stern et al.
                                                                      infrared (MIR) surveys: United Kingdom Infrared Telescope (UKIRT)
(2003) observed SDSSJ08 with the FLAMINGOS multi-object,              Infrared Deep Sky Survey (UKIDSS, Lawrence et al. 2007), Visible
NIR spectrograph at the 8 m Gemini-South Observatory and re-          and Infrared Survey Telescope (VISTA) Kilo-degree Infrared Galaxy
ported an optical power-law index of α = 1.55 (measured over          Survey (VIKING Kuijken et al. 2019), and WISE (AllWISE data re-
the rest-frame wavelength range λ = 1480 − 2510 Å). This red          lease, Wright et al. 2010; Cutri et al. 2013)

Article number, page 6 of 16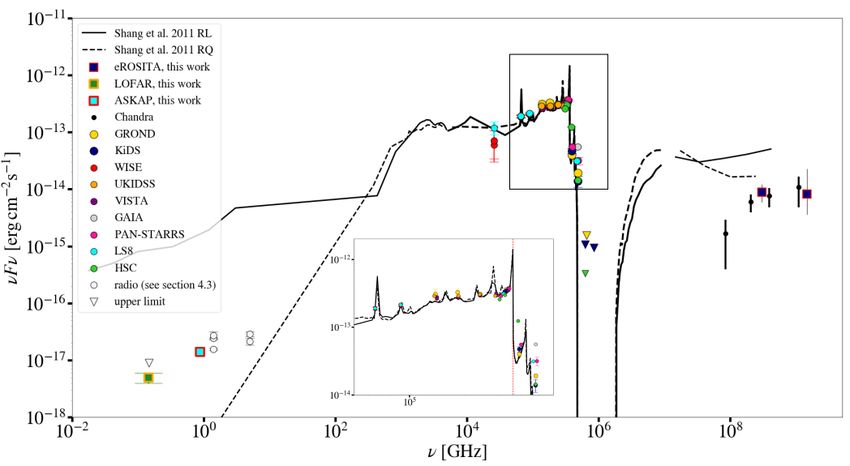
Wolf et al.: eROSITA high-z quasar

Fig. 7: SED of SDSSJ08 constructed using archival multi-wavelength data, together with the new eROSITA (observed broad band
fluxes in 0.5-2 keV and 2-10 keV), LOFAR 145 MHz, and ASKAP 888 MHz measurements. The markers show photometric points
from various optical, X-ray, and radio surveys. Triangles denote upper limits. Composite SEDs from Shang et al. (2011) for radio-
loud and radio-quiet quasars are fitted to the SED at z = 5.81 and corrected for absorption by the intergalactic medium (Madau &
Rees 2000). SDSSJ08 does not present an X-ray excess typically observed in radio-loud quasars.

with α < −0.5 were classified as steep-spectrum sources. Coppe-         5.1. LOFAR 145 MHz observations
jans et al. (2017) further note that their computed radio spectrum
slope for SDSSJ08 would predict a flux density of ∼ 12.0 mJy            The eFEDS field was observed with LOFAR in the 120–168 fre-
at 148 MHz, but Coppejans et al. (2016) argue that most steep-          quency band (Project: LC13_029) between February and May
spectrum high-redshift quasars must have turnovers in their syn-        of 2020. The LOFAR data were processed with the data reduc-
chrotron spectra effectively making them MHz-peaked or GHz-             tion pipelines (PREFACTOR4 ; van Weeren et al. 2016; Williams
peaked sources. The Giant Metrewave Radio Telescope (GMRT)              et al. 2016; de Gasperin et al. 2019 and ddf-pipeline5 ; (Tasse
150 MHz All-sky Radio Survey (TGSS-ADR1; Intema et al.                  2014a,b; Smirnov & Tasse 2015; Tasse et al. 2018) that were de-
2017) does not detect SDSSJ08. Using the TGSS-ADR1 data,                veloped by the LOFAR Surveys Key Science Projects (Shimwell
Coppejans et al. (2017) derived an upper limit of 6.1 mJy on            et al. 2017, 2019). Direction-independent (bandpass, instrumen-
the flux density of the source. If variability and resolution effects   tal delays) and direction-dependent (ionospheric, beam) effects
can be excluded, these latter authors conclude that this lower          were corrected for in the calibration. The flux scale of the LO-
flux density could indicate a spectral turnover below 150 MHz in        FAR final image in the region of interest (i.e. 1.5 degree square
the observed frame (∼ 1 GHz rest-frame). Using high-resolution          region centred on SDSSJ08) was found to be consistent within
imaging of SDSSJ08 from the European Very Long Baseline In-             ∼ 15 percent with the flux scale of the TGSS-ADR1 150 MHz
terferometry (VLBI) Network at 5 GHz and simultaneous VLA               data (Intema et al. 2017). In this paper, we use a conservative
observation, Frey et al. (2005) were able to demonstrate the com-       uncertainty of 20 percent for the flux scale of the LOFAR data.
pactness of the source down to an accuracy of 2 mas, thereby            For details of the data reduction, we refer to Ghirardini et al.
showing that the radio emission is concentrated within the cen-         (submitted) and Hoang et al. (in prep.).
tral 40 pc of the AGN.                                                      In Fig. 8 we report the detection of SDSSJ08 with LOFAR
                                                                        at 145 MHz. The emission peak is detected up to 14σ, where
                                                                        σ = 200 µJy/beam. The flux density of SDSSJ08 at 145 MHz
                                                                        is 3.35 ± 0.7 mJy. In addition, our LOFAR image confirms the
5. Confirmation of a sub-GHz spectral flattening                        presence of a second fainter radio source with a flux density of
   with LOFAR and ASKAP                                                 1.62±0.32 mJy to the south of SDSSJ08 (i.e. with an angular sep-
                                                                        aration of ∼ 1000 ). This source was found with high-frequency
Within 6 months of the eROSITA observations, the entire                 (1.4 and 5 GHz) observations and is associated to a lower red-
eFEDS field was observed with LOFAR 145 MHz and ASKAP                   shift galaxy (Petric et al. 2003; Frey et al. 2005). Combining our
888 MHz with dedicated programs. In the sections below, we de-
scribe the observations and report the detection of SDSSJ08 in          4
                                                                            https://github.com/lofar-astron/prefactor
                                                                        5
the sub-GHz radio bands.                                                    https://github.com/mhardcastle/ddf-pipeline

                                                                                                               Article number, page 7 of 16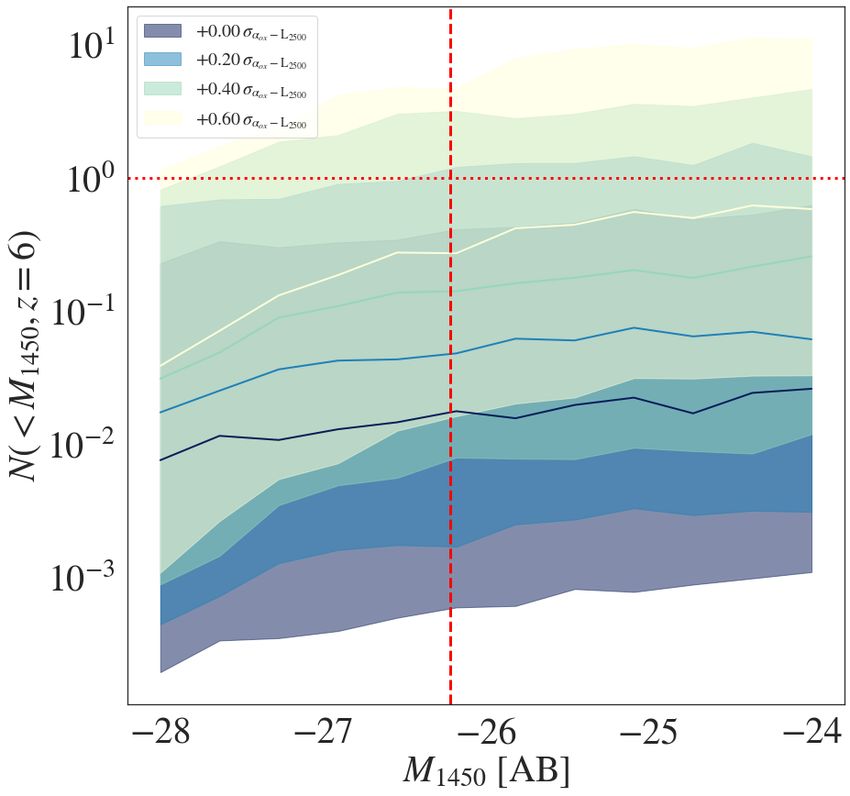
A&A proofs: manuscript no. aanda

measurement with the 1.4 GHz flux density (0.44 mJy) reported          swer questions relative to the turnover frequency, future obser-
in Petric et al. (2003), we find that the spectrum of the source has   vations at low frequencies, for example with LOFAR Low Band
a spectral slope of −0.57.                                             Antennas operating at 10–80 MHz, will be necessary. It is worth
                                                                       mentioning that the hypothesis of variability due to adiabatic ex-
                                                                       pansion could also already be tested with contemporaneous flux
5.2. ASKAP SWAG-X 888 MHz observations                                 measurements at 1.4 GHz.
eFEDS was also observed by the ASKAP telescope as part of
the SWAG-X Observatory Project (Moss et al. in prep) almost
simultaneously with the eROSITA observations. In this paper,
we characterise SDSSJ08 based on the continuum-only SWAG-
X data observed at 888 MHz in October 2019. This dataset com-
prises six ASKAP tiles for complete coverage of the eFEDS re-
gion, with 8 hr integration per tile. Each tile was processed us-
ing ASKAPsoft with standard continuum settings (Whiting et
al., in prep), including bandpass calibration, flagging, and self-
calibration. Imaging was carried out using multi-scale, multi-
frequency synthesis, resulting in average sensitivities across the
full field of ∼50 µJy beam−1 . Sources and fluxes were extracted
using Selavy (Whiting & Humphreys 2012). The resolution of
the image containing SDSSJ08 is 13.3 × 12.1 arcsec, and at this
resolution the two components seen with LOFAR are confused.
The source extraction done as part of the pipeline processing fit-
ted a single extended Gaussian component. A subsequent fit was
performed that forced the size of the Gaussian components to be
that of the PSF, and two components were fitted. These are spa-
tially coincident with the components seen in LOFAR, and have
fluxes of 1.575 ± 0.008 mJy (SDSSJ08) and 0.926 ± 0.027 mJy.

5.3. Low-frequency spectral flattening                                 Fig. 8: LOFAR 145 MHz contours on top of the HSC z-band image
                                                                       (right). The contour levels are [1, 2, 4] × 3σ, where σ = 200 µJy/beam.
In Fig. 9 we present the radio spectrum of SDSSJ08 combin-             The beam size of 600 × 600 is shown in the bottom left corner. The field
ing the measurements from new and ancillary data. The spectral         corresponds to the square in Fig. 2.
slope becomes slightly flatter at lower frequencies, being −0.30±
0.13 from 145 MHz to 1.4 GHz, compared to −1.02 ± 0.16 from
1.4 GHz to 5 GHz. The SED confirms the spectral flattening
at sub-GHz frequencies and hints at the peaked nature of the
                                                                       6. AGN space density at z ∼ 6
spectrum. However, no conclusion as to whether or not there is
a spectral turnover at sub-GHz frequencies can be drawn from           The X-ray-selected AGNs with the highest and second-highest
these data.                                                            redshift to date are CFHQJ14 and SDSSJ08 detected by
     An alternative picture arises when considering the discrep-       eROSITA. By ‘X-ray-selected’, we mean the blind, serendipi-
ancy between the high signal-to-noise ratio 1.4 GHz measure-           tous detection of a source in a contiguous survey (in contrast to
ments of Petric et al. (2003) and Frey et al. (2005) with the          count extraction at known quasar coordinates). The extremely
reported 888 MHz ASKAP flux density, which may be indica-              low expected space density of luminous X-ray sources at high
tive of flux variability at ∼ 1 GHz. Indeed, spectral variability      redshifts requires wide surveys to reach within the epoch of re-
has been observed for most steep spectrum sources (e.g. Orienti        ionisation. In the Chandra Deep Fields, COSMOS and XMM-
et al. 2007; Mingaliev et al. 2012). The expansion of a young          XXL, only three X-ray-selected quasars have been identified
radio source can produce spectral variations that are observable       at z > 5 (Barger et al. 2003; Marchesi et al. 2016; Menzel
over the course of a decade (for a review see Section 2.2. in Ori-     et al. 2016), the highest redshift being z = 5.3 (Capak et al.
enti 2016). Such variability behaviour was observed by Orienti         2011). The absence of z > 5.5 X-ray-selected quasars can arise
& Dallacasa (2008) in the GHz-peaked source RXJ1459 + 3337.            from technical difficulties such as the definition of appropriate
By compiling VLA observations over a period of 17 years, these         source-extraction parameters (i.e. adapted to the detection of
latter authors report a shift of the turnover frequency towards        faint sources). However, a dominant factor is the probed cosmo-
lower frequencies, which they show to be well-explained by             logical volume which must be large enough to sample sources
the adiabatic expansion of a homogeneous component. The ex-            beyond the knee of the XLF at higher redshifts.
pansion of this component results in a decrease of the source              The evolution of AGNs selected in X-ray surveys has been
opacity, which effectively shifts the turnover frequency. If we        extensively studied up to z = 5 (e.g. Hasinger et al. 2005; Ueda
consider the contemporaneous ASKAP 888 MHz and LOFAR                   et al. 2014; Miyaji et al. 2015; Buchner et al. 2015; Georgakakis
145 MHz flux measurements (2019) separately from the Frey              et al. 2015; Aird et al. 2015; Ananna et al. 2019). Vito et al.
et al. (2005) VLA 1.4 GHz and 5 GHz observations (2003) for            (2018) investigated the AGN space density in the CDF-N and
example, we obtain spectral slopes: α145−888 MHz = −0.42 and           CDF-S up to z = 6, focusing on the log (L2−10 keV /(erg/s)) < 44
α1.4−5 GHz = −1.02. This significant flattening observed between       regime, and particularly addressing the question of the evolution
two observations separated by roughly 16 years could also be           of the slope at the low-luminosity end. The highest spectroscop-
explained in the adiabatic expansion scenario. However, to an-         ically confirmed redshift in their sample is z = 5.186 (Vignali
Article number, page 8 of 16
Wolf et al.: eROSITA high-z quasar
where A(log LX , z) is the effective area of the survey sen-
sitive to LX at redshift z, and dV/dz is the differential comov-
ing volume. The exact treatment of the eFEDS sensitivity is
presented in Appendix A. The statistical uncertainty on φest is
given by the Poisson error on N (e.g. Gehrels 1986) normalised
by the comoving sensitive volume. We compute φest in the bin
∆z = 5.7 − 6.4 and ∆log (LX /(erg/s)) = 45.5 − 46, which con-
tains SDSSJ08. The chosen redshift range corresponds to the se-
lection function of bright SDSS quasars (Jiang et al. 2016) and
arises from colour-selection criteria. The resulting binned XLF
point is shown in Fig. 10.
The XLF can be parametrised as a double power law:
K
φm = , (5)
(LX /L∗ )γ1 + (LX /L∗ )γ2
where K is the normalisation, γ1 and γ2 the slopes of the power-
law components, and L∗ the break luminosity. This double power
law is modified by a redshift evolution-term which can either be
applied to the normalisation or the break luminosity (or both).
Fig. 9: Radio spectrum of SDSSJ08. The coloured markers present ra- We extrapolated fitted parametric models of the XLF from
dio measurements from the literature. The empty triangle shows the various authors to redshift z = 6.05 (i.e. the central redshift
TGSS-ADR1 upper limit which is not used for spectral fitting. At fre-
of ∆z), in order to compare φest with the expected number den-
quencies above ∼ 1 GHz, the spectrum appears steep. The LOFAR 145
MHz (green and orange point) and the ASKAP 888 MHz (cyan and sity from studies at lower redshift. For the comparison with our
red point) flux densities reported in this work confirm a flattening of the binned estimate, we have chosen to extrapolate XLFs which
spectrum at frequencies below ∼ 1 GHz. The red and blue lines show the were measured up to z < 5 by Ueda et al. (2014, U14), Vito et al.
best-fitting spectra with the indices of −0.30 ± 0.13 and −1.02 ± 0.16 in (2014, V14), Buchner et al. (2015, B15), Miyaji et al. (2015,
the frequency ranges below and above 1.4 GHz, respectively. The best- M15), Aird et al. (2015, A15), and Georgakakis et al. (2015,
fitting line for all data points with an index of −0.62 ± 0.12 is shown G15). In these works, the XLF was measured from samples of
with the grey dashed line. soft-X-ray-selected AGNs found in Chandra6 , XMM-Newton7 ,
SWIFT/BAT, MAXI, ASCA, and ROSAT data. The best-fitting
model from each of these works is retained here.
et al. 2002). The detection of eFEDSU J083644.0+005459 in V14 and G15 reported that a pure density evolution (PDE)
a contiguous and flux-limited survey of near-homogeneous ex- best fits their data. This model assumes an evolutionary term,
posure allows us to impose constraints on the space density of parametrised as a multiplicative factor to the normalisation
X-ray-selected AGNs at z ∼ 6 based on secure spectroscopic K. U14 assumed a luminosity-dependent density evolution
data. (LDDE). Based on previous observations of a decline in the co-
In the following section, we derive a binned estimate of the moving number of log (L2−10 keV /(erg/s)) > 44 AGNs at higher
XLF in the range 5.7 < z < 6.4. In a complementary step, we redshifts (Brusa et al. 2009; Civano et al. 2011; Hiroi et al. 2012),
compute number estimates from extrapolated fits to the XLF two cut-off redshifts were introduced in the parametrisation of
from the literature and verify whether they are consistent with the evolutionary term. M15 also used LDDE, accounting for the
the detection of eFEDSU J083644.0+005459. probability distribution of photometric redshifts in addition to
absorption effects. A15 introduced a flexible double power law
6.1. Binned estimate of the XLF (FDPL) as parametrisation of the XLF. This allows any parame-
ter in Eq. 5 to evolve with redshift. This redshift dependence is
In population studies, the XLF traces the space density evolution modelled by polynomials of log (1 + z). The extrapolations are
of AGNs as a function of redshift and luminosity, while account- presented in Fig. 10. For U14, V14, M15, and G15, uncertain-
ing for the effect of obscuration; it must be constructed from a ties are derived by sampling from the 1σ confidence intervals
purely X-ray-selected sample. of the parameters entering the models fitted by these authors.
The XLF φ expresses the number N of objects per unit co- We note that we are not accounting for the correlation between
moving volume V and X-ray luminosity LX : the parameters, which may result in an over-estimation of the
computed uncertainties. In B15, the XLF is measured in a non-
parametric approach based on the Bayesian spectral analysis of
d2 N dΦ individual sources and a smoothness prior connecting bins of
φ= = (z, log LX ). (3)
dV d log LX d logLX the XLF. The associated interval presented in Fig. 10 is obtained
from a tabulated version of the non-parametric XLF, allowing
Following Page & Carrera (2000), under the assumption that intrinsic absorption to vary over log NH = 21 − 26. This func-
the XLF changes little in a given bin of redshift and luminos- tion was initially derived in the z = 4 − 7 range within which it
ity (∆z, ∆LX ) one can estimate the XLF from the number N of is constant. We have re-scaled it to the cosmological volume in
detected sources in this bin as: the range z = 5.7 − 6.4. The hard luminosity cut-off displayed in
Fig. 10 is due to the luminosity range on which B15 evaluated
N 6
φest = R R , (4) CDF-S, CDF-N, AEGIS, ECDF-S,C-COSMOS
A(log LX , z) dV
dz d z d logLX
7
XMM-XXL, XMM-COSMOS, SXDS
Article number, page 9 of 16A&A proofs: manuscript no. aanda
nominal 50−th 84.1−th
XLF N̄eFEDS method NeFEDS NeFEDS
V14 0.0 sampled 0 0
U14 0.2 sampled 0 1
M15 0.4 sampled 0 1
G15 0.2 sampled 0 1
B15 lower 0.2 nominal 0 1
B15 upper 15.9 nominal 15 19
A15 0.0 nominal 0 0
nominal
Table 4: Source count predictions. N̄eFEDS are expected source
counts in eFEDS obtained from the integration of various nomi-
nal best-fitting XLF models. We also list the 50th and 84.1th per-
centiles of the distributions of expected Poisson counts in eFEDS
(accounting for the XLF fit uncertainties). The investigated inter-
vals are z = 5.7 − 6.4 and log (L2−10 keV /(erg/s)) = 45.5 − 50. The
method indicates whether the 1σ uncertainties on the XLF pa-
rameters were accounted for (sampled) or if the nominal model
was used (nominal) for the derivation of the percentiles of the
count distributions.
Fig. 10: Parametric models of the XLF extrapolated to z = 6.05.
The coloured error bars and shaded areas correspond to 1σ un-
certainties on the nominal models of the same colour. The non-
parametric XLF from B15 re-scaled to the comoving volume in With these bounds we effectively probe whether or not the ex-
the range z = 5.7 − 6.4 is also shown in green. The binned esti- trapolated XLFs are consistent with at least one detection of a
mate of the AGN space density as derived from the detection of quasar, which is at least as X-ray luminous as SDSSJ08, in the
SDSSJ08 is shown by the black error-bars. redshift range covered by the SDSS selection in eFEDS (given
its area and sensitivity). We first perform the integration on the
nominal models of U14, V14, M15, B15, A15, and G15. For
the XLF. The model by A15 shown in Fig. 10 corresponds to the B15, we use the upper and lower bounds of the non-parametric
best fit to the unobscured sample (20 < log NH < 22) from this XLF, because these delimit the 90% credible interval between
work. their constant-slope model (upper bound) and constant-value
The error bars of φest appear only marginally consistent with model (lower bound). The uncertainties of the expected num-
the extrapolations of the functions of V14, U14, M15, and G15, ber of AGN counts from U14, V14, M15, and G15 are derived
while tending noticeably to higher space densities. The function from the 1 σ errors of the parameters of the XLFs. Sampling
by B15 shows the best agreement with our data. φest is not cor- from these, we generate 5000 counts with Eq. 6. For each inte-
rected for redshift-completeness. The 30% spectroscopic com- gration result N̄, we draw a random integer from a Poisson dis-
pleteness of eFEDS makes this single detection a lower limit tribution with rate λ = N̄. Similarly, we perform 5000 Poisson
on the number of bright high-redshift quasars in the field. The draws using the expected counts from the B15 lower and upper
1σ Poisson uncertainty on φest indicates that expected number bounds and the nominal A15 model. The generated count distri-
counts for z ∼ 6 X-ray-selected AGNs based on the integra- butions are well approximated by the log-normal distribution as
tion of current XLF models (for eROSITA expected counts, see can be verified using quantile-quantile plots (Waller & Turnbull
Kolodzig et al. 2013) may in fact represent quite a conservative 1992). The resulting count distributions are shown in Fig. 11.
estimate of the true number of luminous, high-redshift AGNs They are compared to the lower limit imposed by the detection
that eROSITA will detect. of SDSSJ08 in eFEDS. The expected counts from the nominal
as well as the 50th and 84.1th percentiles of the Poisson count
distributions are presented in Table 4.
6.2. Comparison to eFEDS expected number counts Except for the higher bound of the XLF of B15, the nominal
We can compare the single detection in eFEDS to the number parametric XLFs investigated in this paper all predict less than
of counts expected from extrapolated parametric XLFs (for the one count in the probed redshift–luminosity bin. Accounting for
same type of object, in the same field). The expected number of the parameter uncertainties, the count expectations computed
detected AGNs in a survey for an XLF model φm with parameters from the extrapolated XLFs from M15, G15, and U14 are con-
θ can be written as: sistent with the detection of SDSSJ08 at the 84.1th percentile.
The PDE model by V14 is rejected at the 88th percentile. This
Z Z indicates that a shallower slope on the XLF beyond the break
dV luminosity is favoured at z ∼ 6. This result is best illustrated in
N= A(log LX , z) φm (θ) d z d logLX . (6)
dz Fig. 12, in which we show samples drawn from the 1σ uncertain-
ties on the XLF models from B15, M15, G15, V14, and U14. For
To account for the area sensitive to a luminosity LX at each of these functions, expected counts were computed with Eq.
a redshift z, we used the model presented in Appendix A. 6 over the ranges z = 5.7−6.4 and L2−10 keV /(erg/s)) = 45.5−46.
We compute N in the bin z = 5.7 − 6.4 and allow lumi- We colour-code the sampled XLFs according to the Poisson
nosities log (L2−10 keV /(erg/s)) = 45.5 − 50. The lower bound probability of detecting at least one source in this bin in eFEDS:
log (L2−10 keV /(erg/s)) = 45.5 is roughly the 1σ lower edge of 1 − PPoisson (0, k pred ), where k pred is the expected value obtained
the confidence interval calculated for SDSSJ08 in Section 3.2. from Eq. 6. It clearly appears that a milder decrease in AGN
Article number, page 10 of 16Wolf et al.: eROSITA high-z quasar
ity. Extrapolating from the results in Section 6, we predict the
number of z > 5.7 quasars that will be detected by eROSITA in
the full-sky survey. The resulting constraints on the XLF can pro-
vide important information on the accretion power in the early
Universe.
Here, we first discuss the physical nature of SDSSJ08 as in-
ferred from our results, and thereafter the implications for AGN
demographics and in particular the eROSITA all-sky survey.
7.1. The radio core of SDSSJ08
Fig. 11: Frequency of expected eFEDS AGN source counts. The
black bar is the lower limit imposed by the detection of eFEDSU Bañados et al. (2015) classified SDSSJ08 as radio loud (R =
J083644.0+005459. 11.9 ± 0.3), although close to the threshold of the definition
by Kellermann et al. (1989): R = f5 GHz /f4400Å > 10. To
date, nine radio-loud z > 5.5 quasars have been discovered
(e.g. Bañados et al. 2015; Coppejans et al. 2016), of which
only three have been detected in X-rays: SDSSJ08, CFHQJ14
(Medvedev et al. 2020a,b) and PSO J030947.49+271757.3 (Bel-
laditta et al. 2020). CFHQJ14 is also classified as a steep-
spectrum radio source (Coppejans et al. 2017), while PSO
J030947.49+271757.3 has a flat radio spectrum, typically ob-
served in blazars. Besides its spectral shape, CFHQJ14 is also
similar to SDSSJ08 in terms of morphology. Indeed, Frey et al.
(2011) showed with VLBI images that its radio core is confined
to scalesA&A proofs: manuscript no. aanda
7.2. Origin of the X-ray emission presence of spectroscopically confirmed high-redshift quasars;
the main motivation was the availability of a large array of com-
For SDSSJ08, our tentative estimation of the photon index plementary multi-wavelength surveys. A second observation is
yielded 2.20+0.49
−0.60 . Medvedev et al. (2020b) performed a 20ks that SDSSJ08 was initially discovered in the main single-epoch
XMM-Newton DDT follow-up observation of CFHQJ14. Their imaging survey and not in deeper fields such as overlap regions
absorbed power-law fit to CFHQJ14 yielded Γ = 2.5 ± 0.2. and SDSS Stripe 82. Therefore, eFEDS is not biased towards a
The source PSO J030947.49+271757.3 was observed with higher density of bright SDSS z ∼ 6 quasars.
SWIFT/XRT and its spectral analysis returned Γ = 1.6±0.6, con- The colour and magnitude incompleteness of high-redshift
sistent with typical blazar photon indices. While the uncertainty quasar surveys are encoded in well-defined selection functions
on Γ is too large to unambiguously demonstrate the absence (or (e.g. Fan et al. 2001; Jiang et al. 2016). These selection biases
presence) of an additional X-ray component in the spectrum of are accounted for in the QLF fit. In Fig. 6, we show contours
SDSSJ08 due to a potential jet contribution, the posterior distri- of the eFEDS normalised sensitive area. The sensitive area is
bution of the photon index clearly tends towards higher values, a function of the net count rate (e.g. Georgakakis et al. 2008).
typical for radio loud quasars at these redshifts (Vito et al. 2019). Its dependency on αOX , i.e. L2 keV , was computed by simulating
In summary, the eROSITA detected quasars SDSSJ08 and X-ray spectra with a redshifted power law as baseline model:
CFHQJ14 are both X-ray luminous and have steep radio spectra. clumin*tbabs*zpowerlw. The convolutional model clumin en-
They differ in two aspects: abled us to generate spectra for configurations of L2−10 keV and
(a) Their photon indices: CFHQJ14 has a well-constrained, z. We fixed Γ = 2, z = 6 and assumed a Galactic absorp-
steep Γ, while SDSSJ08 tends to a slightly flatter value, con- tion of NH = 3 × 1020 cm−2 . By converting the broad-band
sistent with the population of X-ray-detected, radio-quiet z>6 restframe luminosities L2−10 keV to the monochromatic L2 keV we
quasars presented in Vito et al. (2019). were able to derive the eFEDS sensitivity for a grid of αOX and
(b) The relative strengths of their optical and X-ray emis- M1450 Å using Eq. 1 (a similar procedure was applied in Ap-
sions: Unlike CFHQJ14, SDSSJ08 does not show any significant pendix A). eROSITA is sensitive to z ∼ 6 quasars which have
X-ray excess luminosity with respect to the bulk of the AGN an αOX (L2500 Å ) within 1σ of the αox − L2500 Å relation of Lusso
population (Fig. 6). et al. (2010) beyond M1450 Å < −24.
These observations lead us to believe that the X-ray output We can obtain the expected number of sources beyond a cer-
of SDSSJ08 is dominated by classical accretion processes and is tain UV luminosity threshold at a given redshift by computing:
not boosted by the relativistic bulk motion of a jet (e.g. Siemigi-
nowska et al. 2008). Its radio core bears the typical spectral sig- Z ∆z Z M1450
nature of confined jets, which nevertheless do not appear to con- dV(z)
tribute strongly to the overall X-ray output of the quasar. With its N(< M1450 , z + ∆z) = φUV (M, z) Ω dM dz, (7)
z −∞ dz
mass of ∼ 3×10⁹ M , SDSSJ08 lies at the high end of the z > 5.8
quasar mass distribution (e.g. Figure 7 in Onoue et al. 2019). where φUV is the quasar UV luminosity function, Ω is the
Estimating the bolometric luminosity of SDSSJ08 from M1450 Å solid angle subtended by the survey, and dV(z) dz is the differential
(Runnoe et al. 2012), we find that it accretes at ∼ 0.1 LEdd . In comoving volume (e.g. Manti et al. 2017). From the best-fitting
summary, the emergent picture for SDSSJ08 is that of a rela- double power-law model for the UV luminosity function derived
tively massive and moderately accreting black hole powering a by Kulkarni et al. (2019), which was fitted on a sample including
young and expanding radio core. the high-redshift SDSS quasars of Jiang et al. (2016), we find
+13.19
Investigating the properties of a large sample of radio-loud that we expect 0.79−0.76 sources at M1450Å < −26.22 (i.e. the
quasars, Zhu et al. (2020) showed that steep-spectrum radio absolute magnitude of the faintest high-redshift quasar from the
quasars follow a similar αOX − L2500 Å relation to that of radio main survey) and z ∈ [5.7, 6.4] in an eFEDS-sized field. These
quiet quasars, indicating that the X-ray emission of these sources calculations account for the 1σ uncertainties on the best-fitting
originates from the corona. Parametrising the corona–jet rela- parameters of the broken power law. We note that, at z ∼ 6, the
tion and performing model fitting, these latter authors find no scatter on the fit parameters is large. From the same calculation
evidence for a significant jet contribution to the X-ray output of using the best-fitting nominal double power-law model of Jiang
steep spectrum quasars. Our findings for SDSSJ08 fit well within et al. (2016) we obtain approximately one expected source count
this picture. The coronal origin of the X-ray emission confirms in eFEDS. In order to compute the number of bright quasars that
that by deriving constraints on the XLF from the detection of we expect to detect with eROSITA in eFEDS, we assume a fixed
SDSSJ08, we are truly tracing black hole accretion at high red- αox − L2500Å (Lusso et al. 2010) and positive offsets therefrom
shifts. (in fractions of its 1σ uncertainty). Fixing αox (L2500Å ), we can
derive the eFEDS sensitivity as a function of M1450Å and account
7.3. z ∼ 6 quasar demographics from optical surveys for it in the integration of Eq. 7. A spectral slope of α ∼ −0.3 was
assumed to convert L2500Å to M1450Å . The cumulative expected
With an absolute UV magnitude of M1450 Å = −27.86, SDSSJ08 integrated counts at z = 6 in eFEDS for the UV QLF fitted by
is the brightest SDSS z > 5.7 quasar found to date (Jiang et al. Kulkarni et al. (2019) are shown in Fig. 13. The αox − L2500Å
2016). As such, it belongs to a class of extremely rare objects, relation from Lusso et al. (2010) has been assumed. At M1450Å <
given the steep decline of the quasar luminosity function (QLF) −26.22, we can expect to detect one source assuming at least a
beyond the break luminosity (e.g. Shen et al. 2020). The com- +0.2σ deviation from the Lusso et al. (2010) αox − L2500Å scaling
plete sample of 5.7 < z < 6.4 quasars found in 11240 deg2 of relation.
the SDSS main survey Jiang et al. (2016) contains 29 extremely The detection of SDSSJ08 is therefore consistent with the
bright sources (M1450 Å < −26.22). We investigate here if the de- findings of optical surveys and does not require a significant de-
tection of SDSSJ08 is consistent with the space density of bright viation from the αox − L2500 relation. We note that Vito et al.
quasars inferred from optical surveys. We first note that the (2019) found no significant evolution of αOX with redshift. A
choice of the location of the eFEDS field was not driven by the larger sample of X-ray-selected quasars will be needed to further
Article number, page 12 of 16You can also read