Energy Transition Factbook - Prepared for the 12th Clean Energy Ministerial 31 May - 6 June 2021
←
→
Page content transcription
If your browser does not render page correctly, please read the page content below
Energy Transition
     Factbook
      Prepared for the 12th Clean Energy Ministerial
      31 May – 6 June 2021

0   31 May – 6 June 2021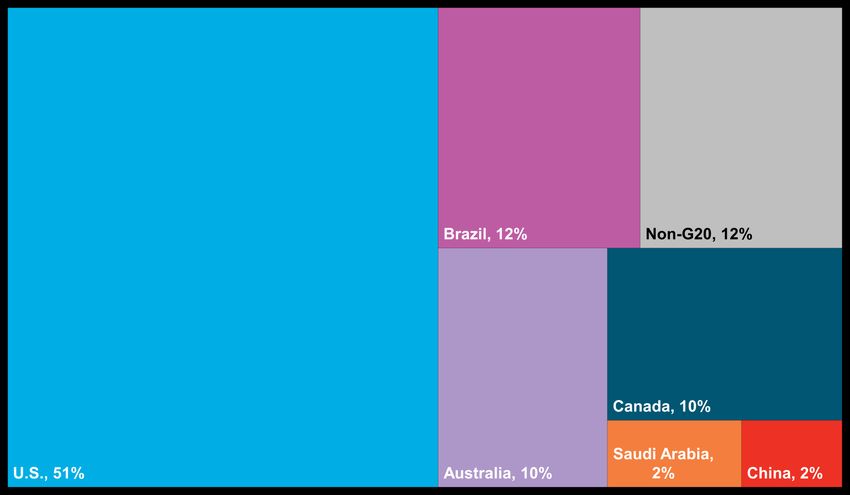
Cover letter
    Your Excellencies:
    The Clean Energy Ministerial has a critical role to play in driving the transition to clean energy, and we’re glad to share this factbook with you on the latest and most promising
    changes in the energy sector.
    At Bloomberg L.P. and Bloomberg Philanthropies, we often say, “If you can’t measure it, you can’t manage it.” Data informs every decision we make – and drawing on detailed and
    accurate data is particularly important with an issue as complex as climate change, which has implications for countries and businesses in every part of the world. Taking on climate
    change and driving down emissions will require action from every sector, but the energy sector has the potential to make especially meaningful progress. And data is key to charting
    the path forward.
    This factbook identifies some key trends that can help to accelerate the global transition to clean energy. For example: Wind, solar, and other low-carbon technologies have gotten far
    more efficient and far less expensive over the last decade. Today, two-thirds of the global population now live in places where wind or solar are the cheapest options for new power –
    representing 71% of global GDP and 85% of global power generation. This dramatic shift is good news for our health and our planet, and it foreshadows even more progress ahead.
    In addition to highlighting important technological developments, this factbook shares the progress being made toward major policy commitments that support the fight against climate
    change. A growing number of nations and companies have committed to reaching net-zero emissions, and more than half of global emissions are now covered by some form of net-
    zero target by 2050 or 2060. Reaching these targets will require seismic changes in the energy sector – and the faster we act now, the better off we will be.
    Climate change is an enormous challenge, and obstacles to clean energy remain. But we hope this factbook will help policymakers and other leaders accelerate the transition to a
    100 percent clean energy economy. It could not be more important.
    Thank you for your work, and all the best,

Michael R. Bloomberg

Founder, Bloomberg L.P.
Founder, Bloomberg Philanthropies
UN Secretary-General’s Special Envoy for Climate Ambition and Solutions

1         31 May – 6 June 2021
Introduction: Energy Transition in 2020 3
Power sector: renewables, integration, storage, grids 8
Transport: electrification, heavy-duty transport 22
Industry: Decarbonizing hard-to-abate sectors, hydrogen 30
Finance: Asset investment, green bonds, ESG 50
2 31 May – 6 June 2021More than half of all global emissions
are now covered by a form of net-zero target
January 2020 May 2021
34% with at least a net-zero discussion 66% with at least a net-zero discussion At the beginning of 2020, one-third of
global emissions were covered by
some form of net-zero target
Most of that total was only ‘under discussion’ –
9% having been raised by governments as a policy
2%3% target.
8%
Legislated 7% By May 2021, more than half of global
33% emissions were covered
In legislative
Not only did more governments increase their
process
commitments, a number also firmed their
66% 21% commitments from under discussion, to in
Government
stated position legislative process or legislated.
32%
China, the EU, Japan and South
Under
discussion Korea are all part of the ‘net-zero club’
However, these bold ambitions are still lacking in
No target 18% policy specifics in many cases.
The U.S. is re-establishing itself in
climate negotiations
However, a significant level of concrete policy
support will be required – and soon – in order to
achieve any net-zero pledge.
Source: BloombergNEF. Note: “Under discussion” stage occurs when governments have begun concrete official discussions to implement a target.
3 31 May – 6 June 2021Global power sector emissions peaked in 2018
Total emissions by sector
14,000 MtCO2e Power sector emissions peaked in 2018
Decarbonization of the world’s power fleet,
through renewables as well as a shift from coal to
Power
12,000 gas, means that emissions from power generation
peaked in 2018.
Covid-19 accelerated power emissions’
10,000 trend, but did not change it
Emissions fell sharply in 2020, but are expected
to decline by 2% per year until 2050.
8,000
Transport Power sector emissions will decline
significantly as a percentage of total
6,000 emissions.
Industry Power emissions are the largest sector of
emissions from fuel combustion, at 42% today. By
2050, they are likely to be 27% of total emissions
4,000 from fuel combustion.
Buildings
2,000
0
2000 05 2010 15 2020
Source: BloombergNEF New Energy Outlook 2020
4 31 May – 6 June 2021Corporate renewable power purchase agreements
grew 18% in 2020 despite the pandemic
Global corporate renewable power purchase agreements
Cumulative Corporate renewable power purchases
25 2010-20 increased 18% in 2020
23.7
The growth comes despite Covid-19 interrupting
2.9 APAC 9.3GW corporate functions, and plummeting revenues in
some sectors.
20.1
20 The U.S. was the largest market,
though less dominant than in years past
7.2 EMEA 16GW U.S. companies announced 11.9 gigawatts of
corporate PPAs, down from 14.1GW in 2019 and
15 the first year-on-year decline since 2016.
13.6
The Asia Pacific region and Europe
both set annual records for PPA
10 volumes
Asian corporate PPA volumes more than doubled,
and European volumes nearly tripled.
6.2 13.6 AMER 51.6GW
4.7
Amazon was the most active company
5 4.1 The company signed 35 PPAs totaling 5.1GW of
capacity. Semiconductor manufacturer TSMC, oil
2.3
supermajor Total SE, U.S. telecoms company
1.0 Verizon, and Facebook rounded out the top five in
0.1 0.3 0.3
0 capacity signed.
2010 11 12 13 14 15 16 17 18 19 20
Source: BloombergNEF link
5 31 May – 6 June 2021Financial markets are making significant
climate- and carbon-related commitments
Supporting companies
2,000
$12.6 trillion
1,679 TCFD supporting company market cap
1,500 $150 trillion
TCFD supporting financial institution
assets under management
“
1,000
The UK will become the first country in the
world to make Task Force on Climate-related
500 Financial Disclosures (TCFD) aligned
disclosures fully mandatory across the
economy by 2025, going beyond the ‘comply
or explain’ approach.
102
0
Jun 17 Jan 18 Jan 19 Jan 20 November 9, 2020
Source: TCFD
6 31 May – 6 June 2021G20 Countries’ climate policies are not aligned with
the pledges of the Paris Agreement
2021 G20 policy scoreboard – results by sector
Power Fuel decarbonization Transport Buildings Industry Circular economy The world’s largest economies are far
from the right policy plans to meet the
Germany 73% Paris Agreement
France 71% BNEF’s G20 Zero-Carbon Policy Scoreboard
South Korea 65% evaluates the G20 countries’ decarbonization
U.K. 64% policies to measure which governments have
implemented regimes to realize the goals of the
Japan 63% Paris Agreement.
Italy 59%
Canada 52% Much of the progress in cutting the rate
China 51% of growth of CO2 to date has come in
U.S. 44% the power sector
However, most countries have done little
Australia 43%
elsewhere in the economy – and even within the
India 43% power sector, multiple pathways are needed.
Mexico 39%
The nations at the top have executed a
Brazil 37%
South Africa
higher number of robust, concrete
37%
Turkey 36%
measures
These countries have introduced policies to drive
Argentina 36% change on both the supply and demand side.
Indonesia 29% Their policy-making processes are relatively
Saudi Arabia 26% transparent and predictable, and their initiatives
Russia 22% are starting to have a measurable impact.
Source: BloombergNEF link. Note: maximum score is 100%.
7 31 May – 6 June 2021Introduction: Energy Transition in 2020 3
Power sector: renewables, integration, storage, grids 8
Transport: electrification, heavy-duty transport 22
Industry: Decarbonizing hard-to-abate sectors, hydrogen 30
Finance: Asset investment, green bonds, ESG 50
8 31 May – 6 June 2021Wind and solar generation costs have converged,
and compete with (or outcompete) fossil fuel generation
Global levelized cost of energy benchmarks
LCOE ($/MWh, 2019 real) The benchmark cost of electricity
generation from onshore wind and solar
$500 PV have converged
The cost for both is in the range of $40 per
megawatt-hour.
$400 Offshore wind costs remain higher than
362
PV, fixed axis
onshore wind or PV, but offshore wind
347 has operational advantages
$300 PV, tracking Offshore wind has much higher capacity factor
Battery storage than either onshore wind or photovoltaic
applications and is competitive with fossil fuel-
190 fired power in many markets.
Offshore wind
$200
The cost of storage using lithium-ion
batteries is on a steep downward
132
trajectory
$100 Current costs of $132 per megawatt-hour mean
111 79
Onshore wind 47 that the levelized cost of energy from lithium-ion
41 battery storage systems is competitive with many
39 peak-demand generators.
$0
2H 1H 2H 1H 2H 1H 2H 1H 2H 1H 2H 1H 2H 1H 2H 1H 2H 1H 2H 1H 2H 1H 2H
09 10 11 12 13 14 15 16 17 18 19 20
Source: BloombergNEF
9 31 May – 6 June 2021Power from battery storage systems
is now competitive with open-cycle gas turbines
Global benchmark utility-scale battery storage and open-cycle gas turbine levelized cost
LCOE ($/MWh, 2019 real) Four-hour duration battery storage
$900
today can compete on cost with gas-
803 Implied by historic gas and battery pack prices Project data
fired peaking power in some markets
$800 In markets where natural gas is imported, such as
Japan or Europe, both one-hour and four-hour
storage applications compete with the cost of gas-
$700
fired peaker plants.
$600 The levelized cost for battery storage in
the first half of 2020 is $132 per
$500 megawatt-hour
Battery storage
That cost is inclusive of the cost of charging
$400 (4 hours) Battery storage batteries before discharging.
321 (1 hour)
293
$300
Upfront costs are the largest
Japan determinant of the levelized cost of
Gas peaker
$200 storage
180
System financing costs, and the cost of charging
132 systems, are secondary considerations.
$100
U.S.
$0
2H 1H 2H 1H 2H 1H 2H 1H 2H 1H 2H 1H 2H 1H 2H 1H 2H
12 13 14 15 16 17 18 19 20
Source: BloombergNEF
10 31 May – 6 June 2021Wind and solar power are the lowest-cost
new source of power for 2/3 of the global population
Lowest-cost source of new bulk power generation by technology, 2H 2020
Two-thirds of the global population lives
where renewables are the cheapest new
power generation option
BloombergNEF estimates that two-thirds of the
global population lives in a country where either
onshore wind or utility-scale PV, if not both, is the
cheapest option for new bulk generation.
Renewables are the cheapest power
option for 71% of global GDP and 85%
of global power generation
It is now cheaper to build a new solar or wind farm
to meet rising electricity demand or replace a
retiring generator, than it is to build a new fossil
fuel-fired power plant.
Legend Power plant developers can make a
Onshore wind clear economic choice for renewables
Offshore wind On a cost basis, wind and solar is the best
Utility PV – fixed axis economic choice in markets where firm generation
Utility PV – tracking resources exist and demand is growing.
Natural Gas – CCGT
Coal
Not covered
Source: BloombergNEF
11 31 May – 6 June 2021G20 countries have awarded more than 350 gigawatts
of renewable capacity via auctions
G20 renewable energy auctions, awarded and announced
Renewable energy auctions are the
China 69 18 5 4 96 gigawatts
policy mechanism of choice for 14
India 53 14 25 95 members of the G20
Rest of EU 8 3 4 12 9 37 Auctions allow governments to better control their
spending and to competitive allocate capacity.
Brazil 6 19 31
Germany 5 9 3 5 22 Competitive allocation is a key attribute
Solar
of auctions
France 6 4 6 18
Onshore wind Where other support mechanisms such as feed-in
U.K. 10 11 tariffs award all projects that meet eligibility
Mexico Offshore wind criteria, auctions give countries control of both
6 8
winning bid conditions and capacity to be built.
South Africa 3 7 Biomass and waste
In many countries, auctions are the
Turkey 5 7 Small hydro primary route to market for utility-scale
Italy 3 6
Mixed auction projects
Russia 3 5 China and India, in particular, have successful
Announced auctions used auctions to attract developers and investors
Argentina 5
with a high level of competition and low prices.
Japan 4
Saudi Arabia 3
Canada 2
Australia 2
Source: BloombergNEF
12 31 May – 6 June 2021Lithium-ion battery costs fell 89% from 2010 to 2020
Lithium-ion battery price survey results (volume-weighted average)
Battery pack price (real 2020 $/kWh) Lithium-ion battery pack prices fell 89%
from 2010 to 2020
$1,191 BloombergNEF surveys battery buyers and
sellers to determine the volume-weighted average
price for lithium-ion battery packs, modules, and
cells.
$924 The lithium-ion battery learning rate is
18%
For every doubling of cumulative production, the
$726 fundamental cost of manufacturing lithium-ion
$668 storage batteries declines by 18%.
$592
BloombergNEF expects lithium-ion
storage battery costs to continue to fall
Changes to cell chemistry have been important
$384 drivers of price declines, new manufacturing
$295 techniques will become more important to
maintain downward pressure on prices. We
$221
$181 expect prices to be close to $100/kWh by 2023.
$157 $137 $125
2010 11 12 13 14 15 16 17 18 19 20 21e
Source: BloombergNEF
13 31 May – 6 June 2021UK power prices spiked to record levels in early 2021,
as plant outages, cold, and commodity prices hit
Half-hourly British imbalance price
£4,500 per megawatt-hour European power markets are
experiencing a period of unusually high
Prices reach new
£4,000
record in January 2021
volatility
Power prices have swung from record lows in
£3,500 March-June 2020, to record high prices in
January 2021. Daily price volatility has increased
as well.
£3,000
Commodity prices play a role
£2,500 The simultaneous increase in gas, coal and
Drop in carbon prices should lead to a proportional
wind output increase in power prices. However, power prices
£2,000 France nuclear “Beast from
have at times exceeded what could normally be
plant outages the East”
explained by the swing in commodity prices.
£1,500
Unseasonably high outages are the
£1,000 main reason for the U.K.’s record
prices.
£500 An unexpected outage in the interconnector to
The Netherlands removed one gigawatt of
capacity until at least early February.
£0
Covid-19 contributed to outages
-£500 Maintenance has been challenging, due to
2016 2017 2018 2019 2020 2021 reduced staffing and social distancing.
Source: Elexon, BloombergNEF.
Note: The ‘Beast from the East” was a spell of cold weather in February-March 2018, when European gas markets were very tight.
14 31 May – 6 June 2021Japan’s power price reached an all-time high
in January 2021
Japan system power prices
$1,500 per megawatt-hour
Japan’s wholesale power price hit an
all-time high in January 2021
Prices spiked to nearly $1,500 per megawatt-
hour, more than three times the previous record
$1,250 price in 2011.
A shortage of LNG led to the price spike
Spot liquefied natural gas prices also hit a record
$1,000 high price in January 2021 with demand in North
Asia very high due to cold weather and in Japan,
lower availability of nuclear power.
$750 The price spike highlights Japan’s
dependence on imported fuels
Japan’s power generators and fuels importers are
likely to ramp up spot LNG purchases when
$500 prices have declined.
$250
$0
08
2008 09 10 11 12 13 14 15 16 17 18 19 20
Source: Japan Electric Power Exchange
15 31 May – 6 June 2021Keeping the lights on is a lucrative business
for Australia battery systems
Australia battery revenue from frequency control and ancillary services
A$50 million Australia battery operators doubled
their annual revenue in 2020
Operators had A$83 million in revenue from
frequency control and ancillary services in 2020.
A$40 Climate change has increased the risk
of disruptive weather events
Risk of disruption has increased the value of grid
balancing via the services which batteries provide.
A$30 Half of 2020’s revenue came during
one windfall month
In February, the South Australia temporarily
Generation separated from the rest of the country’s grid,
A$20 meaning that demand for grid balancing
skyrocketed. Revenue for the state’s three large
Load batteries equaled 17-33% of their initial capital
costs.
A$10
A$0
Jan 18 Jul 18 Jan 19 Jul 19 Jan 20 Jul 20
Source: BloombergNEF
16 31 May – 6 June 2021Integrating renewable energy is an ongoing concern
in high-penetration markets like Chile
Average wind and solar hourly generation and daily average power price, Diego de Almagro
MW $/MWh Wind and solar generation has grown
from near-zero in 2013 to meeting 15%
2,500 $100
of Chile’s power demand in 2020
Chile’s wind and solar fleet generated well over
one terawatt-hour of power in 2020.
2,000 $80
Infrastructure upgrades have been
essential to integrating renewables
Chile has completed a number of major
1,500 $60 transmission upgrades, integrated its two main
power grids, and introduced a flexibility strategy
as well.
1,000 $40 These upgrades have dramatically
reduced curtailment, and kept power
prices from falling to zero
500 $20 Average curtailment in 2020 stayed below 2%,
and power prices stayed about $40 per
megawatt-hour even during peak generation.
0 $0
0 1 2 3 4 5 6 7 8 9 10 11 12 13 14 15 16 17 18 19 20 21 22 23
Solar Wind Avg Price March 2017
Avg Price March 2018 Avg Price March 2019 Avg Price March 2020
Source: CNE, Coordinador Electrico Nacional, BloombergNEF. Note: Node is Diego de Almagro.
17 31 May – 6 June 2021China’s electricity spot market trial
is leading to depressed midday power prices
Shandong province net load and real-time prices, Oct. 22, 2020
7575gigawatts 900 yuan per megawatt-hour
900 The electricity spot market in China’s
biggest solar province has depressed
midday prices
Shandong province is trialing a spot market,
60 720 which has resulted in morning and evening
Net load shoulder prices which are seven times higher than
midday, when solar generation peaks.
Officials have changed the regulated
45 540 time-of-use tariff as a result
Shandong has used small-scale spot trials to
inform tariff changes. Prices have been lowered
around noon, and increased after 2:30pm,
Real-time price benefiting a large group of commercial and
30 360 industrial consumers.
Liberalization is impacting China’s
market in various ways
15 180 Prices for 39% of China's power demand in 2019
were determined by various markets, rather than
government planning, with lower prices usually
the result. A majority of price deregulation is in
coal power, but renewables are also seeing
0 0 market exposure in at least 20 of 31 provinces.
0:00 3:00 6:00 9:00 12:00 15:00 18:00 21:00 0:00
Source: Shandong power exchange, news media
18 31 May – 6 June 2021As India’s renewable power generation expands,
coal plant utilization falls
India power generation India coal plant utilization
Fossil fuel-based power 1,500 terawatt-hours
1,500 80% Renewable power has been almost all
Nuclear
Renewable energy of India’s power generation growth
since 2018
Federal government plants Fossil fuel-fired power generation peaked in 2018,
1,250
and in 2020 has fallen back to about the same
70% level as in 2017.
The rise of renewables, and to a lesser
1,000
extent nuclear, has impacted coal plant
National average utilization
Coal plant utilization has fallen across the board,
750 60% with the national average now only 53%.
Declines in coal plant utilization hit
different owners in different ways
500 State government plants now have a utilization
Privately owned plants rate below 50%, while federal government plants
50% are still above 60% utilization.
State government plants
250
0 40%
2015 16 17 18 19 20e 2015 16 17 18 19 20e
Source: BloombergNEF
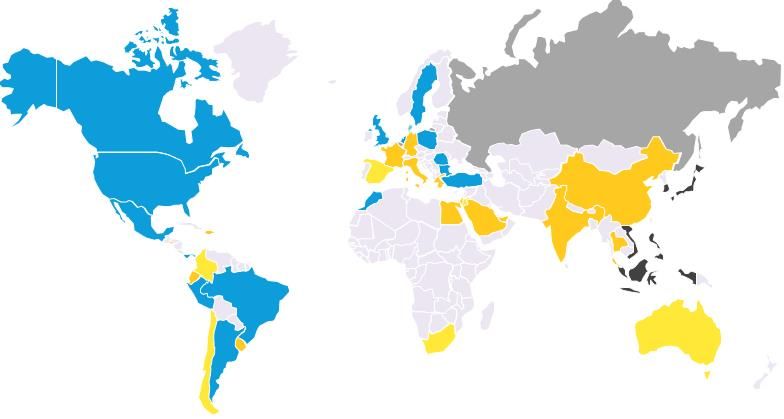
19 31 May – 6 June 2021Nuclear power development differs by country,
with some investing in new reactor designs
Country nuclear energy ambitions a decade after Fukushima
The nuclear industry is focused on
improving the safety of the existing fleet
Plant operators are pursuing reactor stress tests,
operational best practices, and passive designs
aimed at improving existing assets.
The industry is also investing in new
reactor designs
New entrant Canada, China, Russia, the U.S. and U.K. are all
investing in advanced reactor and small modular
Continuing to invest reactor designs.
Nuclear power can play a role in deep
On the fence
decarbonization
Stepping away Global interest in zero-carbon power generation
drives interest in advanced nuclear as countries
consider the role that this baseload source could
play in deep decarbonization scenarios.
Source: IAEA, BloombergNEF. Note: the U.S. is ‘stepping away’ from conventional nuclear power,
but ‘continuing to invest’ in advanced nuclear technologies
20 31 May – 6 June 2021Introduction: Energy Transition in 2020 3
Power sector: renewables, integration, storage, grids 8
Transport: electrification, heavy-duty transport 22
Industry: Decarbonizing hard-to-abate sectors, hydrogen 30
Finance: Asset investment, green bonds, ESG 50
21 31 May – 6 June 2021Passenger electric vehicle sales increased 48% in 2020
Global passenger electric vehicle sales % of total passenger vehicle sales
Global passenger electric vehicle sales
RoW 5% defied Covid-19, and auto industry
4.4 million
S.Korea and Japan
4.5%
trend, in 2020
North America Sales increased 48%, with growth in China and
the U.S. and a surge in buying in Europe
Europe 4%
European sales more than doubled
China year on year, with emissions policy the
3.1
main driver
3% Europe sales topped 1.3 million, more than
30,000 ahead of China in 2020.
2.1 North America sales rose slightly
1.9 U.S. sales declined rose from 322,000 in 2019 to
2% 326,000 in 2020.
Sales elsewhere rose as well, in
1.1 aggregate
1% Sales in Japan fell slightly, while sales in Korea
0.7
increased more than 50%, with the two countries
0.5 together purchasing 98,000 passenger EVs
0.3
0.2
0.04 0.1 0.1%
0%
2011 12 13 14 15 16 17 18 19 20 21e 2011 12 13 14 15 16 17 18 19 20
Source: BloombergNEF. Note: Includes plug-in hybrids
22 31 May – 6 June 2021There are more than 1 million public electric vehicle
charging connectors worldwide
Total number of public EV charging connectors installed
RoW There are now 1.35 million electric
1,352k vehicle charging connectors worldwide
Japan Electric utilities, oil and gas majors, governments
and pure-play charging network operators are all
U.S. investing heavily.
89
Europe The charging market remains
fragmented
China 927 352 An absence of network standards and physical
format standards mean that the market has yet
to consolidate, and is likely to remain fragmented
72 for another 3 to 5 years.
628
255
Viable business models are emerging
However, there are a number of critical
61 questions outstanding for network operators,
456 such as the optimal speed for charging, ideal
202 809 location of public chargers, and the approach to
317 48
billing customers.
149
185 516
131 94
73 96 300
70 214
141
49
12 13 14 15 16 17 18 19 20
Source: BloombergNEF
23 31 May – 6 June 2021Electric vehicle ranges continue to increase
Range of launched and upcoming BEV models by launch year
Range in kilometers Electric vehicle ranges have increased
700 markedly in a decade
Asia headquartered Prior to 2010, Tesla models had by far the longest
U.S. headquartered vehicle range, with Asian models a small fraction
600 Europe headquartered of Tesla range.
Launched Asian manufacturer ranges have more
500 Upcoming than doubled
2019 and 2020 Asian electric vehicle ranges
cluster around 300 kilometers, much closer to that
400 of U.S. models.
European model ranges are 300-400
300 kilometers
European models released in the past two years
will be similar to the low end of U.S. electric
200 vehicle ranges.
100
0
2006 2008 2010 2012 2014 2016 2018 2020 2022
model year
Source: BloombergNEF
24 31 May – 6 June 2021Electric vehicle sales tend to keep increasing steadily
after reaching 5% (with one exception)
EV share of new passenger vehicle sales after EVs hit 5% of new vehicle sales
80% of new passenger vehicle sales Once markets achieve an electric
vehicle new sales share of 5%, EV
70%
Norway sales usually take off
Countries that achieve 5% EV sales usually hit
10% within a year, or less, and 20% within two to
60% three years.
Norway now has an EV sales share of
Iceland
50% 70%
The U.K. will only surpass Seven years after achieving 5% sales, electric
5% EV sales share in 2021 vehicles are now more than two-thirds of
40% passenger vehicle sales
The Netherlands is the only auto
30% market in which EV sales share has not
Sweden
grown dramatically
20% Dutch EV tax incentives have phased in and out,
Netherlands and a subsidy introduced in July 2020 ran out
almost immediately. EV sales are still more than
10% 10% but have not risen as in other markets.
0%
0 1 2 3 4 5 6 77 years after
hitting 5% of sales
Source: BloombergNEF
25 31 May – 6 June 2021Seven Indian states or administrative areas
have municipal bus electrification targets
India municipal bus electrification targets
India has a number of municipal bus
electrification targets
The most aggressive, in terms of immediate
action, is Kerala, which targets 100%
Uttar Pradesh:
electrification by 2025.
1,000 e-buses by 2030
Targets differ in nature
Delhi: Targets include percentage of new sales, a
50% of new purchases percentage of fleet electrification per year, full
to be electric electrification target dates, and absolute targets
by certain years.
Madhya Pradesh:
Electric bus sales are likely to pick up
100% electrification
by 2028 next decade, based on economics
BloombergNEF expects the total cost of
ownership of electric buses to be lower than that
of internal combustion buses by 2030.
Karnakata: Andhra Pradesh:
1,000 e-buses by 2022 100% electrification
by 2029
Kerala Tamil Nadu:
100% electrification 5% of ICE fleet
by 2025 to be electrified annually
Source: State transport departments
26 31 May – 6 June 2021Electric vehicles have much lower lifecycle emissions
to comparable internal combustion engine models
Electric and internal combustion engine vehicle lifetime CO2 emissions
0 10 20 30 40 50 60 tons CO2 Battery electric vehicles have
substantially lower lifecycle emissions
BEV than peer internal combustion engine
U.K.
vehicles
ICE In countries with low electricity emissions, such as
France, the gap is almost ten-fold. In China, with
Germany
BEV its coal-heavy power fleet, the difference is much
less.
ICE EVs have higher lifecycle emissions
from manufacturing than ICE peers
BEV
France
Battery pack manufacture accounts for almost all
of the difference, with some variation by country.
ICE
The lower the power fleet emissions
BEV intensity, the bigger the lifecycle
U.S.
emissions gap
ICE The U.K. and France, with their substantially
decarbonized power fleets, have the greatest
lifecycle emissions advantage.
BEV
China
ICE
Vehicle manufacturing Battery pack manufacturing Use
Source: BloombergNEF
27 31 May – 6 June 2021A range of fuels are now viable for commercial vehicles
depending on weight, application, and annual miles
Current activity of alternative fuels, by commercial vehicle segment
Road freight underpins global trade
Weight Application
and has powered oil demand growth
Refuse, construction Drayage, distribution Freight over the past decade.
Heavy commercial vehicle Trucks consume almost one in every five barrels
>15 tons of oil.
City fuel restrictions, noise regulations
and stringent emission standards are
Distribution Distribution Freight, distribution
forcing truck makers to diversify
Medium commercial vehicle
powertrains
3.5 – 15 tons
Four energy sources – liquefied natural gas,
compressed natural gas, hydrogen, and
electricity – can power a range of weight and
distance applications.
Last-mile distribution Distribution Fuel
Light commercial vehicle LNG CNG Diesel technology will become moreIntroduction: Energy Transition in 2020 3
Power sector: renewables, integration, storage, grids 8
Transport: electrification, heavy-duty transport 22
Industry: Decarbonizing hard-to-abate sectors, hydrogen 30
Finance: Asset investment, green bonds, ESG 50
29 31 May – 6 June 2021Heat is essential for many industrial processes,
and industries meet their demand in many different ways
Share of energy supply for industrial process heat, 2018
Six sectors have significant demand for
Iron and steel Cement process heat
Iron and steel, cement, chemicals, aluminum and
non-ferrous metals, food and tobacco, and pulp
and paper all require heat for essential industrial
0% 25% 50% 75% 100% 0% 25% 50% 75% 100% processes.
Chemicals Aluminum Some industries already use significant
amounts of renewable energy for heat
Food and tobacco, and pulp and paper, already
use a relatively high proportion of renewable heat
sources such as biomass and biogas thanks to
0% 25% 50% 75% 100% 0% 25% 50% 75% 100%
the ready availability of organic waste at their
Food and tobacco Pulp and paper sites.
Other industries use mostly fossil fuels
Chemicals, cement and iron and steel use a
higher proportion of fossil fuels. These industries
0% 25% 50% 75% 100% 0% 25% 50% 75% 100% have high heat requirements and use fossil fuels
as feedstocks as well.
0% Coal Oil Gas Electricity Heat Renewables
Source: BloombergNEF, IEA
30 31 May – 6 June 2021Heat decarbonization potential varies significantly,
but can have big rewards in big sectors
Sector Current status (2016) Ease of heat decarbonization
Temperature Major fuel Efficiency Fuel New technology
gains switching or process
Iron and steel High Coal Hard Hard Medium
Big prizes
(but hard to achieve) Non-metallic minerals (cement)
High Coal Hard Medium Hard
Chemicals High Coal Medium Medium Hard
Medium prizes
(medium size/difficulty) Non-ferrous metals (aluminum) High Electricity Medium Easier Hard
Food and tobacco Low Gas Medium Easier Medium
Small prizes
(but easiest to achieve) Pulp and paper Low Renewables Medium Easier Easier
Source: BloombergNEF, IEA
31 31 May – 6 June 2021Industry has a number of specific
decarbonization challenges
Industrial energy consumption, type Industrial energy consumption, sector
Higher temperature needs Lower temperature needs Industry is a substantial share of energy
Argentina use and greenhouse gas emissions
Australia Industry is 29% of all global energy use, and
Brazil around a fifth of all greenhouse gas emissions.
Canada
China The majority of industrial energy
France consumption is used to produce
Germany process heat
India Process heat is the energy input of thermal
Indonesia manufacturing processes such as steam
Italy reformation of methane to produce ammonia, or
Japan smelting to produce steel.
Mexico
Russia Countries face different challenges in
Saudi Arabia decarbonizing industry
South Africa Those challenges range from scale (China is by
South Korea far the largest industrial energy consumer) to
Turkey particular heat demand (some countries have
U.K. mostly high-temperature heat demand, which
U.S. makes it harder to find lower- or zero-carbon
0 10 20 30 40 50 EJ 0% 20% 40% 60% 80% 100% substitutes).
Iron & steel Cement & lime Aluminum
Process heat Other Chemicals Mining Construction
Food & tobacco Paper & pulp Other
Source: Global CCS Institute, BloombergNEF
32 31 May – 6 June 2021The U.S. leads in operational carbon capture capacity
Share of global operational carbon capture capacity, by location, end-2020
Carbon capture, utilization, and storage
(CCUS) separates industrial carbon
dioxide emissions for use
The process separates, compresses, and
transports the gas for use in industrial processes,
drilling processes, or storage.
CCUS can contribute to the circular
economy
CO2 can be ‘upcycled’ into new products including
concrete, carbon nanotubes, chemicals or fuels. It
can also be used in the process of producing
hydrogen from natural gas.
The U.S. is the leader in CCUS
capacity
The U.S. has more than half of the global CCUS
capacity of 38 million metric tons per annum.
Current global CCUS capacity is equivalent to
only 0.1% of global emissions.
Source: Global CCS Institute, BloombergNEF
33 31 May – 6 June 2021CO2 utilization markets are too small and too cost-
sensitive to significantly offset capture costs
CO2 utilization markets and sensitivity to CO2 prices
CO2 cost (% of product price) Once carbon dioxide is captured, it can
be used
1000 Uses include making new materials and
1% Market penetration 100% chemicals, or adding to concrete to increase its
strength. These applications will purchase CO2,
Global offsetting some of the cost of capture.
Aggregates emissions
100 Creating new demand means new
applications, or price premiums
Buyers paying a price premium for lower-
Methanol, ethanol emissions products will need to do so despite no
Carbonates
10 added performance benefit.
Concrete is the current targeted
$100/t application for a reason
Concrete CO2 price Concrete demand is significant, and CO2 use
1 adds little, if any, cost to the final product.
$30/t
Polymers,
CNTs
0.1
0 1 10 100 1,000 10,000 100,000
Potential (MtCO2/yr)
Source: BloombergNEF
34 31 May – 6 June 2021Industrial carbon capture costs can fall within the
carbon price range once many plants have been built
Cost of avoiding CO2 emissions at scale (Nth-of-a-kind plants)
Avoidance Cost ($/tCO2, real 2019) Future carbon capture costs could be
$175 167 167 within range of today’s carbon prices
156 Iron, steel, chemicals, and coal-fired power could
$150 High concentration 145 all have viable carbon capture if economies of
CaO looping 132 scale are realized.
$125 Liquid absorption High-concentration and liquid
Membrane 99 103
97 100 absorption are mature capture
$100 94
84 105 technologies used today
Solid adsorption 81 96
75 90 94 CaO looping is early-stage, but the industry has
72 70
$75 high hopes for its success.
59 74
46 62 63 Capture costs are specific to each
$50 37 55 55 56 57 57
33 54 54 project
26 45
38 40 Capture costs depend highly on energy,
$25
consumable costs, and what fraction of emissions
27
18 19 are captured.
$0
Direct-air capture could provide
Air
Air
Coal power
Coal power
Coal power
Coal power
Coal power
Iron and steel
Ethanol, Ammonia
Iron and steel
Iron and steel
Iron and steel
Cement
Gas power
Cement
Gas power
Cement
Cement
Petroleum refining
Petroleum refining
negative emissions, but at a cost
It is the only technology with potentially negative
emissions, but it will remain expensive even with
much iteration.
Source: BloombergNEF. Note: Nth-of-a-kind is a cost estimate that includes the economies of scale achieved by building several identical projects. CaO is calcium oxide.
35 31 May – 6 June 2021Private industrial IoT, AI, analytics, and robotics
companies raised more than $13 billion in 2020
VCPE fundraising by startups selling industrial IoT, AI, analytics, robotics products
$2,000 $2,000
million There are thousands of startups
Chips IIoT platforms and apps building software, sensors, chips,
drones for industrial digitalization
Industrial robotics IIoT cybersecurity However, most are very small, raising seed or
Artificial intelligence $1,578 Series A.
$1,500 Industrial IoT and AI venture funding is
a small part of the global funding
landscape
Much more money is being spent by large
corporations in R&D, like by GE or Siemens or
$1,002
$920 $1,000 Schlumberger, than is being spent on startups.
$871
$812
$634 $636 $609 $611
$423 $500
$348
$96
$0
Jan 20 Feb Mar Apr May June July Aug Sep Oct Nov Dec
Source: BloombergNEF
36 31 May – 6 June 2021Industries are rapidly digitalizing
business operations
Digital industry projects and partnerships (count of activities)
150 Industrial companies have become
more reliant on remote monitoring and
cloud computing to continue operations
125 Covid-19 has meant cloud and data-related
projects and partnerships have been growing and
accounted for 25% of digitization activity in 2020.
100 4-quarter Analytics software-related digital
rolling average projects and partnerships account for
the largest proportion of activity
75 This includes technologies such as artificial
IoT hardware intelligence, digital twins and predictive
maintenance.
Automation
50
Connectivity
Cloud / Data
25
Communications
Analytics software
0
1 2 3 4 1 2 3 4 1 2 3 4 1 2 3 4
2017 2018 2019 2020
Source: BloombergNEF
37 31 May – 6 June 2021South Korea, Singapore, and Germany top the
national digitalization ranking
BloombergNEF 2020 country digital score and GDP per capita
$80,000 GDP per capita
BloombergNEF’s annual country
$80
digitalization ranking measures current
APAC Norway
and future potential for digitalization of
$70 Europe
Middle East, Africa U.S.A. industries and workforces
Americas Singapore The ranking uses a range of public and
$60 proprietary data sets to determine which country
Australia
Sweden has the strongest digital policies, industrial
$50 policies, innovation schemes, startup
Germany
communities, R&D hubs and education
U.A.E. environments.
France U.K.
$40 Israel
Japan South Korea, Singapore and Germany
Italy top BNEF’s 2020 national industrial
$30
S. Korea digitalization ranking
Saudi Arabia Since our last review in 2019, leading countries
$20 have used policy to formalize ties between
South Africa digitalization and overall economic growth
Chile
Russia China
$10 AI continues to attract the most policy
Thailand attention
India Covid-19, however, disrupted some countries’
$0 Brazil
High progress and ambitions
Low
Digitalization score
Source: BloombergNEF
38 31 May – 6 June 2021Governments have begun hydrogen commitments
National hydrogen strategies as of January 19, 2021
At the start of 2021, 13 countries have
national hydrogen strategies
The European Union also announced a hydrogen
roadmap, which requires member states without a
plan to formulate one.
A further 11 countries were preparing a
hydrogen strategy during the course of
last year
2021 could see even more such documents, not
least from India, the U.K. and Poland – which
13 Available released its draft on January 4, 2021.
If these strategies are significantly
11 In preparation
funded, they could make significant
14 Support for pilot and
demonstration projects
strides towards hydrogen’s commercial
viability
16 Initial policy discussions
Without sufficient funding, it will be difficult to
5 improve unit and project economics for hydrogen
No activity
production.
103 Not assessed
Source: World Energy Council, BloombergNEF. Note: Italy, Portugal and Spain’s strategies are currently in draft form.
39 31 May – 6 June 2021National targets for electrolyzer deployment
could drive electrolyzer costs below optimistic scenarios
Global electrolyzer capacity scenarios and EU hydrogen strategy target
GW The significance of the strategies
70 announced in 2020 cannot be
EU + Chile hydrogen understated
strategy targets By 2030, the EU calls for the deployment of
60 40GW of electrolyzers within its borders, Chile
calls for 25GW, while Australian developers hope
to build more than 8GW by 2030 despite lacking a
50 target.
Even meeting these targets halfway will
40
EU hydrogen significantly impact hydrogen costs
strategy target Even if less than a half of what the EU and Chile
promise ends up commissioned, the capex of
30 alkaline electrolyzers in Europe should fall from
Optimistic $1,200/kW in 2019 to $115/kW by 2030.
20
10
Conservative
0
2019 2022 2025 2030
Source: BloombergNEF. Note: EU hydrogen strategy target shows electrolyzer target for EU member
states only, excludes targets for trading partners. U.K. target includes hydrogen from fossil fuels + CCS.
40 31 May – 6 June 2021Funding to meet national hydrogen strategies
lags behind ambitions
2030 funding allocated to hydrogen versus electrolyzer targets
Funding allocated to hydrogen ($ billion, bars) 2030 electrolyzer target (GW, red markers) Germany and France have made the
largest funding commitments to
12 30
hydrogen
Combined, the two countries have allocated
nearly $20 billion in funding to hydrogen.
10 25
Other EU states plan to rely more
strongly on EU funding
8 20 Italy promises 5 billion euros ($6 billion) through
public resources, but it is unclear how much will
come from the national government versus EU
funds. Spain and Poland are likely to draw heavily
6 15
on EU support.
Chile plans to attract private investment
4 10 to fund its electrolyzer target
Its plan targets regulatory changes in order to
incentivize hydrogen production.
2 5
0 0
Germany France NL Italy U.K. Portugal Chile Spain
Source: BloombergNEF. Note: EU hydrogen strategy target shows electrolyzer target for EU member
states only, excludes targets for trading partners. U.K. target includes hydrogen from fossil fuels + CCS.
41 31 May – 6 June 2021Electrolyzer costs could fall below $100 per kilowatt
System capex projection of large-scale, Chinese-made alkaline electrolysis projects
2019$/kW Electrolyzers made by Chinese
250 manufacturers are already up to 83%
cheaper than western-made models
Reasons include cheaper raw materials and labor,
200 higher factory utilization rates and lower spending
200 on R&D and marketing.
181
Western electrolyzer costs will have to
163 converge with Chinese costs, one way
Conservative
or another
150 135 We expect western and Chinese costs to largely
150 converge by 2030. This could happen in two ways
– western manufacturers lowering their costs, or
128 Chinese manufacturers expanding to western
98
100 115 countries. We are starting to see signs of both.
Optimistic
Chinese electrolyzers can fall by
80 another 74% by 2030 if deployment
50 follows our optimistic trajectory
This is now highly likely given the targets set by
the European Union and Chile and the pipeline of
projects that have already been announced.
0
2019 2022 2025 2030 2040 2050
Source: BloombergNEF. Note: Assumes large-scale system sizes of 3MW in 2019, 10MW in 2022, 30MW in 2025, 100MW in 2030 and 400MW in 2050
42 31 May – 6 June 2021Renewable hydrogen is currently expensive,
but costs are coming down
Forecast global range of levelized cost of hydrogen production from large projects
Blue’ hydrogen from natural gas or coal
$/kg (real 2020) $/MMBtu
with carbon capture and storage (CCS)
12.0
12.0 89.3
89.3 is currently cheaper to produce than
‘green’ renewable H2, but projects are
Renewable H2 rare
10.0
10.0 74.4
74.4 This relationship should reverse by 2030, when
renewable H2 could be cheaper than H2 from
natural gas or coal with CCS in all countries
8.08.0 59.5
59.5 modeled, assuming alkaline electrolyzers are
used.
Currently, CCS adds $0.64/kg to the
6.06.0 44.6
44.6
cost of hydrogen from natural gas and
$1.14/kg to the cost of hydrogen from
4.04.0 ‘Blue’ H2 from coal 29.8
29.8
coal
with CCS These costs could fall to $0.53/kg for gas and
$0.85/kg for coal by 2050 if CCS technologies
mature.
2.02.0 14.9
14.9
‘Blue’ H2 from
natural gas with
CCS
0.00.0 0.0
0.0
2
2021 3 4
2030 5 6
2050
Source: BloombergNEF. Note: renewable hydrogen costs based on large projects with optimistic projections for capex. Natural gas prices range from $1.1-10.3/MMBtu, coal from $30-116/t.
43 31 May – 6 June 2021Renewable hydrogen could be less costly
than natural gas in many locations in 2050
Renewable H2 versus natural gas, 2050
$/MMBtu (real 2020) 15 countries could make renewable H2
12 at a cost lower than the local natural
gas price by 2050.
They are Brazil, Chile, Argentina, India, U.A.E.,
10 Australia, Sweden, Spain, Turkey, China, Italy,
Vietnam, Indonesia, Philippines and Thailand.
8 These locations are largely places with
higher-than-average expected gas
prices in 2050
6 The exceptions are Japan and South Korea –
which have high gas prices, and also high
renewable production costs – and Australia, which
4 has mid-range gas prices but comparatively
Renewable hydrogen cheaper renewable H2.
Natural gas Production costs for renewable H2 could
2
range from $4.10/MMBtu in Brazil to
$11.07/MMBtu in South Korea by 2050
0 Natural gas prices, in comparison, could be as
Argentina
China
Brazil
Peru
U.S.
Turkey
Canada
Vietnam
France
U.K.
Chile
Mexico
India
Sweden
Spain
Philippines
Malaysia
Japan
Poland
U.A.E.
Italy
Indonesia
Thailand
Germany
South Africa
Australia
Netherlands
South Korea
low as $3.92/MMBtu in the U.S. and as high as
$9.32/MMBtu in South Korea.
Source: BloombergNEF. Assumes our optimistic electrolyzer cost scenario. The LCOH2 range reflects a diversity of electrolyzer type, alkaline (low) to PEM (high). The electricity
powering the electrolyzer is either PV or onshore wind, whichever is cheaper. The natural gas prices include transportation costs, the H 2 costs do not.
44 31 May – 6 June 2021Up to 34% of global emissions could be abated
using hydrogen – 20% for less than $100/tCO2
Marginal abatement cost curve from using $1/kg hydrogen for emission reductions in 2050
Carbon price ($/tCO2) Hydrogen will need carbon pricing to
take off
180 Almost all industries BNEF has analyzed would
Space and water heating
require a carbon price for hydrogen to
160 outcompete the cheapest fossil fuel alternative
Shipping
Carbon prices may not need to be high
140 Methanol
for hydrogen to be competitive
Gas power generation Hydrogen at $1/kg ($7.44/MMBtu) could abate a
120
fifth of global emissions by 2050 with carbon
Glass prices less than $100/tCO2. We expect such
100 Aluminum carbon prices to emerge in the EU by 2030.
Ammonia How hydrogen competes against other
80
Cement zero-carbon alternatives will be key
60 Other technologies could outcompete hydrogen.
Steel
Zero-cost While we expect no carbon price may be needed
abatement Oil for hydrogen vehicles to outcompete internal
40
refining combustion engines, battery electric vehicles are
likely to be even cheaper, limiting the scope for
20 hydrogen adoption in road transport.
Cars Buses Trucks
0
0 1 2 3 4 5 6 7 8 9 10 11 12
GtCO2/year
Source: BloombergNEF. Note: sectoral emissions based on 2018 figures. Renewable hydrogen delivered at $1/kg to large users, $4/kg to road vehicles. Aluminum emissions for alumina production and aluminum
recycling. Cement emissions for process heat. Refinery emissions from hydrogen production. Road transport and heating emissions are for the segment that is unlikely to be met by electrification only, assumed to be 50%
of space and water heating, 25% of light-duty, 50% of medium-duty trucks, 30% of buses and 75% of heavy-duty trucks.
45 31 May – 6 June 2021Turbine manufacturers have begun work
on hydrogen-ready power generation technology
Cumulative announced capacity of H2-ready power projects by country and manufacturer
Capacity (GW) Capacity (GW) Hydrogen could be a key tool in
8.9 8.9 managing such variable renewable
U.K. (1.2GW) GE (2.2GW) energy
Netherlands (1.3GW) 8.0 8.0 Mitsubishi Power 8.0 8.0 Hydrogen can also compete with batteries, whose
U.S. (6.4GW) (6.6GW) costs rise quickly with longer-duration storage
applications.
6.8 6.8
Turbine manufacturers have already
6.0 6.0 produced units of up to 50MW that can
run on high blends of H2 at
petrochemical sites
The next challenge will be to demonstrate the
feasibility of larger-capacity turbine models.
Recent announcements suggest some
2.7 2.7 8.9GW of hydrogen-ready gas turbines
could be operating worldwide by 2028
Some of these projects could be commissioned
as early as 2021.
0.5 0.5 0.5 0.5
2021 22 23 24 25 26 27 28 2021 22 23 24 25 26 27 28
Source: BloombergNEF
46 31 May – 6 June 2021Seaborne H2 unlikely to be competitive with local H2,
but ammonia could be a seaborne alternative
Landed cost of H2 in Japan: seaborne imports from Chile versus onshore production, 2050
$/kg Imports Onshore production BloombergNEF research has identified
ammonia as the cheapest method of
3.10
moving hydrogen by ship, both today
3
and in the future
Ammonia’s natural advantage is that a market for
0.93 0.93 2.47 shipping it already exists, which means no new
Reconversi
on of technology needs to be developed.
2.17
ammonia to Other methods of hydrogen shipping,
2 0.87 hydrogen
0.55 0.55 0.55 would require substantial research and
1.60 Transport development to become feasible
to Japan These include liquid organic hydrogen carriers
(LOHC) and liquefied hydrogen (LH2).
0.87 0.87 0.87 Conversion
Ammonia’s main disadvantage is its
1 to ammonia
& storage toxicity
1.6 1.6
Shipping hydrogen using ammonia as a carrier
Renewable will require handling with extreme care.
0.75 0.75 0.75 hydrogen
production
0
Production Conversion Ammonia Delivered Conversion Delivered Green H2Green ammonia
(Chile PV) to ammonia transport ammonia back to H2 H2 to Japan production production
& storage to Japan to Japan (Japan) (Japan)
Source: BloombergNEF
47 31 May – 6 June 2021Long-distance pipeline hydrogen imports
could be as inexpensive as natural gas
Cost of production and long-distance hydrogen transport via high-capacity pipeline, 2050
$/kg-H2 $/MMBtu Pipelines could transport hydrogen a lot
cheaper than ships
5 37.2
Large and well-utilized hydrogen pipelines could
Transport transport hydrogen for costs that approach those
of piping natural gas
4 29.8 Renewable Large pipelines could enable long-
production
distance hydrogen supply chains to
3 22.3 Coal emerge
production If such pipelines are built, they could enable the
with CCS transport of hydrogen from regions with cheap
production costs to more expensive locations,
2 1.69 14.9 such as from northern Africa to Europe.
1.54 1.49 Gas
1.43
production
0.42 0.22 0.17 0.16 with CCS
Existing natural gas infrastructure could
1.00 0.88
1 0.16 7.4 be repurposed for hydrogen
0.12 Operators of gas pipelines facing the prospect of
1.27 1.32 1.32 1.27
0.84 0.76 a net-zero future are considering the prospects for
converting their pipelines to carry hydrogen.
0 0.0 Doing so could make hydrogen transport even
Turkmenistan Russia Russia to Texas to New Algeria to Iran to India cheaper.
to to Germany China York Spain (2,700km
China (4,000km (2,800km (2,700km (1,600km pipeline)
(8,700km pipeline) pipeline) pipeline) pipeline)
pipeline)
Source: BloombergNEF. Note: compression and storage costs included in transport. Assumes 6,600t/day pipeline.
48 31 May – 6 June 2021Introduction: Energy Transition in 2020 3
Power sector: renewables, integration, storage, grids 8
Transport: electrification, heavy-duty transport 22
Industry: Decarbonizing hard-to-abate sectors, hydrogen 30
Finance: Asset investment, green bonds, ESG 50
49 31 May – 6 June 2021Energy transition investment reached
a half a trillion dollars in 2020
Global energy transition investment
Global investment in the energy
$600 billion
$600 transition reached half a trillion dollars
CCS
in 2020
Hydrogen Energy transition investment includes renewable
Energy storage $501
$500 energy, electrified transport, electrified heat,
Electrified heat $459 energy storage, hydrogen, and carbon capture
Electrified transport $434 $441 and storage.
Renewable energy
$378 $400 Renewable energy investment has
been flat since 2015, at around $300
$330 billion per year
$290 $297 However, with equipment costs falling, the
$300
$263 amount of capacity built has increased more than
$235 $240 13 times since 2004
$182 $173
Electrification of transport and heat
$200
received almost $200 billion in 2020
$143 Electrified transport received $139 billion in 2020,
$109 and electrified heat $50 billion.
$100
$61
$33
$0
2004 05 06 07 08 09 10 11 12 13 14 15 16 17 18 19 20
Source: BloombergNEF
50 31 May – 6 June 2021Companies and institutions raised $732 billion of
sustainable debt in 2020
Sustainable debt issued by instrument type ($ billion nominal)
$800 Companies and governments raised
$732.1 $732 billion in sustainable debt in 2020
That is more than $160 billion above 2019’s
$700 Sustainability-linked issuance, an increase of 29% year on year.
bonds
As the market grows, it is expanding in
$600 scope
$565.5
Sustainability-linked Sustainable debt in the early part of the decade
loans was almost entirely activity-based green bonds,
$500
specific to assets or projects.
Green loans
Today, sustainable debt includes
$400
activity- and behavior-based
$309.3 instruments
Social bonds
$300 Behavior-based debt includes goals such as
$237.9 reductions in emissions intensity, reducing waste
from operations, and improving workforce
$200 Sustainability bonds diversity and safety.
$145.8
Social bonds had a record year, issuing
$85.1
$100 $64.5 almost $150 billion
Green bonds Sustainability bonds, green bonds, and
$26.6
sustainability-linked bonds also hit new records.
$0
2013 2014 2015 2016 2017 2018 2019 2020
Source: BloombergNEF
51 31 May – 6 June 2021Renewable energy and storage companies
raised a record $20 billion in public markets in 2020
Renewable energy and energy storage capital raising activity
2020 was a record year in public
markets for renewable energy and
$20.0
$20 billion storage companies
Convertible Companies raised $20 billion via initial public
offerings, secondary offerings, private
Secondary & PIPE
placements, and convertible issuances.
$15.9 IPO
IPOs were the least significant new
$15
source of funds; secondaries the most
significant
$11.2 Even without IPO funding, 2020’s secondary and
$10.2 $10.0 convertible funds raised would have made for a
$10 record year.
$8.7 $8.5
$7.8 $8.1 The biggest single deal was $2.8 billion
$7.5
$6.5 China’s Contemporary Amperex Technology
$6.2
$5.7 (CATL) raised $2.8 billion. The next largest deals
$4.5 were Plug Power ($846 million) and JA Solar
$5
($777 million).
$3.2
$2.7
$0.7
$0
2004 05 06 07 08 09 10 11 12 13 14 15 16 17 18 19 20
Source: BloombergNEF
52 31 May – 6 June 2021Green bonds outperformed global bonds in 2020
Global green bond and all bond performance, 2020
15% Green bonds outperformed the broader
Green bonds global bond market in 2020
12.74% The Bloomberg Barclays MSCI Global Green
Bond Index ended the year up 12.74%, while the
10% 10.03% Bloomberg Barclays Global Aggregate Credit
Total Return Index ended the year up 10.03%.
Green bonds declined less in the early
days of the Covid-19 pandemic than the
All bonds
5% broader bond market
Green bonds declined as steeply as the rest of
the bond market, but not to the same degree.
Green bonds decoupled from the rest of
0%
the bond market in August 2020
Annual performance was quite closely coupled in
mid-summer, with green bonds then pulling away
from the rest of the bond market.
-5%
-10%
Jan 20 Feb 20 Mar 20 Apr 20 May 20 Jun 20 Jul 20 Aug 20 Sep 20 Oct 20 Nov 20 Dec 20
Source: Bloomberg
53 31 May – 6 June 2021Government agencies, financials, and utilities have
issued the bulk of sustainable debt to date
Sustainable debt issued by issuer industry, global, 2012 to 2020
Government agencies, financial
Government $585.8 billion institutions, utilities, and energy
companies are the largest issuers of
Financials $454.1 sustainable debt
These four sectors have issued more than $1.6
Utilities $382.2 trillion in sustainable debt since 2012, with
government the first sector to issue a half-trillion
Energy $266.0 dollars cumulatively.
Other sectors are much smaller issuers
Industrials $114.6 to date
Consumer discretionary, materials, and consumer
Finance $80.2 staples firms have together issued around $160
billion in sustainable debt. U.S. municipals have
Consumer discretionary $68.0 issued more sustainable debt than materials
companies.
U.S. municipals $59.9
Materials $53.7
Consumer staples $39.2
Unknown $33.3
Source: BloombergNEF Sustainable Debt Data Hub link. Note: “Financials” includes banks, insurance, and real estate.
“Finance” includes select securitization, namely from the U.S. Federal National Mortgage Association (“Fannie Mae”). “U.S. Municipals” are local governments.
54 31 May – 6 June 2021You can also read