Initial Status Report of Deep-Dive Region: West Nusa Tenggara Province - 100% Renewables Cities and Regions Roadmap - ICLEI e-lib
←
→
Page content transcription
If your browser does not render page correctly, please read the page content below
100% Renewables Cities and Regions Roadmap

Initial Status Report of Deep-Dive Region:
West Nusa Tenggara Province

ICLEI Indonesia

 May 2020
Initial Status Report of Deep-Dive Region: West Nusa Tenggara Province

The material in this publication is copyrighted. Content from this discussion paper may be used for
non-commercial purposes, provided it is attributed to the source.

ICLEI - Local Government for Sustainability

Jakarta, Indonesia

May 2020

Author:

Muhammad Saladin Islami, ICLEI Indonesia; Emy Aditya, ICLEI Indonesia

Reviewer (in Alphabetical Order):

Ari Mochamad, ICLEI Indonesia; Jan-Albrecht Harrs, ICLEI World Secretariat; Laura Noriega, ICLEI World
Secretariat; Renz Cerillo, ICLEI Southeast Asia; Rohit Sen, ICLEI World Secretariat; Victorino E. Aquitania,
ICLEI Southeast Asia.

Design and Layout:

Dhyanayu L. Almitra, ICLEI Indonesia

Acknowledgement

This report was produced as part of the project 100% of Renewables Cities and Regions Roadmap, or
100%RE for short, implemented by ICLEI and funded by the International Climate Initiative (IKI). The
Federal Ministry for the Environment, Nature Conservation and Nuclear Safety (BMU) of Germany.

The authors would like to thank the stakeholders from West Nusa Tenggara for their feedback on the
drafts. All opinions expressed, as well as omissions and eventual errors are the responsibility of the
authors alone.

renewablesroadmap.iclei.org i Initial Status Report of Deep-Dive Region

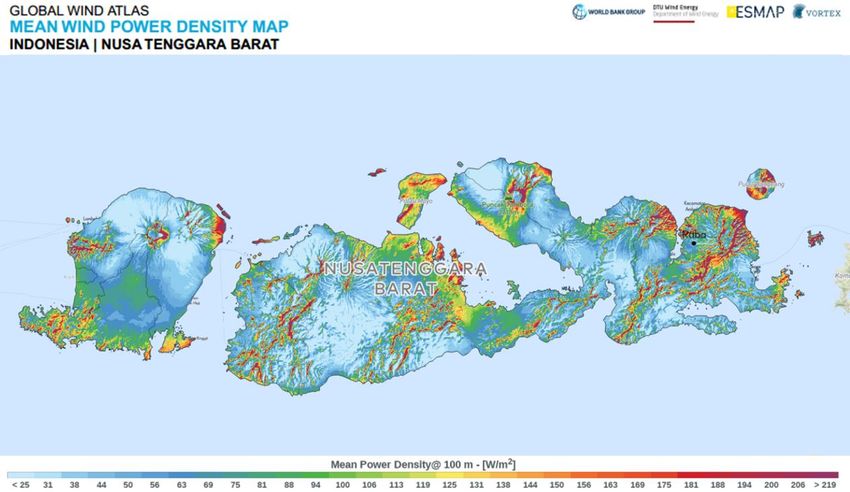
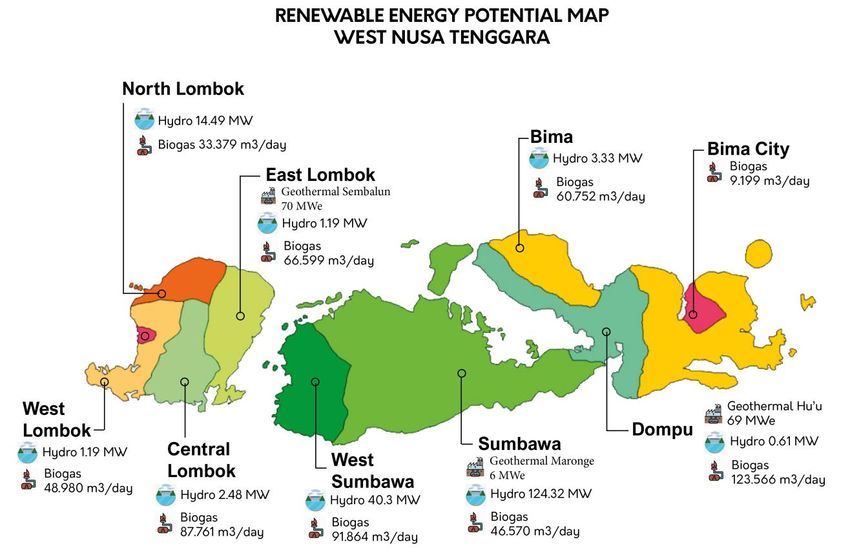
Executive Summary
 ICLEI has selected West Nusa Tenggara as the deep-dive region for the 100% Renewables
Cities and Regions Roadmap program. This Initial Status Report aims to learn the current renewable
energy status of the deep-dive regions/cities; to understand the legal frameworks for project cities and
regions; to identify the sources of funding and the processes for applying for financial support, and to
evaluate the limitations and opportunities towards a 100% renewable energy transition in the deep-dive
cities/region.

West Nusa Tenggara consists of two main islands, which are Lombok Island in the western part and
Sumbawa Island in the eastern part. Sumbawa Island makes up two-thirds of the region, yet the density
population in this area is quite low. The agriculture, forestry, and fisheries sectors have the highest
contribution to the Gross Regional Domestic Product, while the tourism sector and the mining, energy,
and electrical sectors have the highest investment realization in the region. In the last decade, West
Nusa Tenggara faces several environmental challenges, particularly the increasing amount of
municipal solid waste.

Both electricity generation and transportation sectors in West Nusa Tenggara are mostly powered by
fossil fuels. However, the region relies on the other region to fulfill its fossil fuel demand. Consequently,
energy security in the region is vulnerable. The electricity sector is provided by the Lombok grid system
and the Sumbawa-Bima grid system. PLN, a state-owned electricity company, has an exclusive power
for electricity transmission, distribution, and retailing in the area. In the electricity generation sector,
private entities have a small proportion of electricity provision in the area. Surprisingly, the greenhouse
gas emission in the region mainly comes from the agricultural sector, followed by the energy sector.

Energy governance in the region follows national and local frameworks. Energy Law No.30/2007 and
Electricity Law No. 30/2009 are the basis for the development of the National Energy Plan (RUEN) and
PLN’s electricity provision plan (RUPTL) document. Under the RUEN, the Provincial Government is
mandated to develop the Regional Energy Plan (RUED). West Nusa Tenggara enforces its RUED since
2019.

West Nusa Tenggara has abundant and diverse renewable energy potential. Solar radiation in the region
is among the highest in Indonesia. However, the wind speed in the region is much lower compared to
other countries in the Asia Pacific Region. The Sumbawa Regency has the highest hydropower potential
in the region. Ocean’s current energy and Ocean Thermal Energy Conversion (OTEC) in West Nusa
Tenggara is quite abundant too, yet there is no development of this kind of power plant in the region.
Interestingly, the region has remarkable bioenergy and waste energy potential. Despite its abundant
renewable energy potential, the installed capacity in the region is still low.

renewablesroadmap.iclei.org ii Initial Status Report of Deep-Dive Region
Stipulated in its local energy general plan (RUED), West Nusa Tenggara has commitments to increase
renewable energy share in the electricity generation. To achieve this, the local government develops a
matrix activity plan. Although the commitment is there, under PLN’s RUPTL 2019-2028 the number of
on-going and planned renewable energy plants in the region is still low.

The development of renewable energy projects in West Nusa Tenggara can be implemented through
three different business models: public-private partnership (PPP), IPP’s project under PLN’s regular
program, and small-scale electricity business in rural and isolated areas. The ownership of this
business can be purely a public asset, purely a private asset, or a combination of public and private
share. The financial access for renewable energy projects in West Nusa Tenggara can be obtained from
regional income (with limited allocation), from private entities, or by submitting a proposal through
several national financing schemes, such as through the Non-Government Budget Equity Financing
(PINA), IIGF for PPPs, Viability Gap Fund for PPP, or the Infrastructure Financing Fund. While access to
financing is not the only barrier to implementing renewables in the region, several opportunities are
available to enable RE projects development and deployment.

renewablesroadmap.iclei.org iii Initial Status Report of Deep-Dive Region
Table of Contents

Executive Summary ....................................................................................................................... i

List of Figures ............................................................................................................................ vii

List of Tables .............................................................................................................................. ix

List of Abbreviations .................................................................................................................... x

Chapter 1 Region Overview ........................................................................................................... 1

 1.1 Population ............................................................................................................................................ 2

 1.2 Geographical and Location.................................................................................................................. 3

 1.3 Economy ............................................................................................................................................... 4

 1.4 Current Environmental Challenges ..................................................................................................... 5

 1.4.1 Land-use Change .......................................................................................................................... 5

 1.4.2 Water Contamination .................................................................................................................... 5

 1.4.3 Solid Waste Management Issue .................................................................................................. 5

Chapter 2 Energy Profile of West Nusa Tenggara ........................................................................... 7

 2.1 Current Electricity/Energy Consumption ............................................................................................ 7

 2.1.1 Electricity Sector ........................................................................................................................... 7

 2.1.2 Heating and Cooling Sector ......................................................................................................... 8

 2.1.3 Transportation Sector................................................................................................................... 8

 2.2 Electricity/Energy mix for the Installed Generation Capacity ........................................................... 9

 2.2.1 National Level ................................................................................................................................ 9

 2.2.2 Electricity Generation in West Nusa Tenggara ........................................................................... 9

 2.3 Electrical/Energy Actors .................................................................................................................... 10

 2.3.1 Electricity Generation.................................................................................................................. 10

 2.3.2 Electricity Transmission, Distribution, and Retailing ................................................................ 10

 2.3.3 Non-Electricity Provider .............................................................................................................. 11

 2.4 Electrical Energy and Fuel Pricing ..................................................................................................... 12

 2.4.1 National Level .............................................................................................................................. 12

renewablesroadmap.iclei.org iv Initial Status Report of Deep-Dive Region
2.4.2 Local/Regional level ................................................................................................................... 13

 2.5 Greenhouse Gases (GHG) Emission Profiles and Trends............................................................... 14

Chapter 3 Renewable Energy-based Enabling Regulatory, Policy, and Legal Frameworks ............... 16

 3.1 National Level ..................................................................................................................................... 16

 3.1.1 Regulatory Framework ............................................................................................................... 16

 3.1.2 Key Policies and Strategies Applicable to the Renewable Energy Sector .............................. 17

 3.2 Local Framework ................................................................................................................................ 18

 3.2.1 West Nusa Tenggara Stakeholders ........................................................................................... 18

 3.2.2 West Nusa Tenggara Laws and Regulations ............................................................................ 19

Chapter 4 West Nusa Tenggara Renewable Energy Resource Potential ......................................... 21

 4.1 Renewable Energy Resource Potential of West Nusa Tenggara .................................................... 21

 4.1.1 Overview ...................................................................................................................................... 21

 4.1.2 Solar Energy................................................................................................................................. 21

 4.1.3 Wind Energy ................................................................................................................................. 21

 4.1.4 Hydro Energy ............................................................................................................................... 23

 4.1.5 Ocean-related Energy.................................................................................................................. 23

 4.1.6 Geothermal Energy ..................................................................................................................... 24

 4.1.7 Biomass, Biofuel, and Biogas Energy ........................................................................................ 24

 4.1.8 Waste Energy............................................................................................................................... 25

 4.2 Implemented Renewable Energy Projects in West Nusa Tenggara ............................................... 25

Chapter 5 Local Renewable Energy Targets and Commitments in West Nusa Tenggara ................. 26

 5.1 Power Plant Capacity Target ............................................................................................................. 26

 5.2 Fossil Fuel Reduction Target ............................................................................................................. 27

 5.3 Energy Consumption Scenario .......................................................................................................... 27

 5.4 Energy Development Activity Plan .................................................................................................... 27

Chapter 6 Local Renewable Energy Projects ................................................................................ 28

 6.1 On-going and Planned Energy Projects in West Nusa Tenggara ................................................... 28

 6.2 Business Model .................................................................................................................................. 28

renewablesroadmap.iclei.org v Initial Status Report of Deep-Dive Region
6.2.1 Public-Private Partnership (PPP) Projects ................................................................................ 29

 6.2.2 IPP Projects under PLN’s Regular PPA Program ..................................................................... 30

 6.2.3 Small-Scale Electricity Supply Business (UPTL) in the Least Developed Rural, Isolated,
 Border and Small Populated Island Area............................................................................................ 30

 6.3 Ownership Model ............................................................................................................................... 31

 6.3.1 PPP Ownership Model ................................................................................................................ 31

 6.3.2 IPP Ownerships under PLN’s Regular Program ....................................................................... 31

 6.3.3 Purely Public Asset ..................................................................................................................... 31

 6.4 Financial Structure ............................................................................................................................. 32

 6.4.1 Local Finance .............................................................................................................................. 32

 6.4.2 Private Sector Finance and Crowdfunding ............................................................................... 32

 6.4.3 National Finance ......................................................................................................................... 32

 6.5 Challenges and Opportunities ........................................................................................................... 34

Chapter 7 Conclusion and Recommendation ................................................................................ 36

Annex A Renewable Energy Power Plant in West Nusa Tenggara .................................................. xii

Annex B Matrix Activity Plan under West Nusa Tenggara’s Local Energy General Plan (RUED) ...... xiii

References ................................................................................................................................ xv

renewablesroadmap.iclei.org vi Initial Status Report of Deep-Dive Region
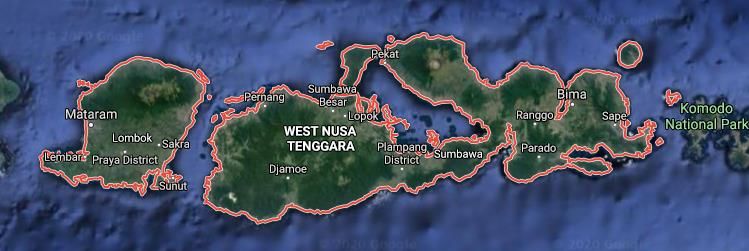
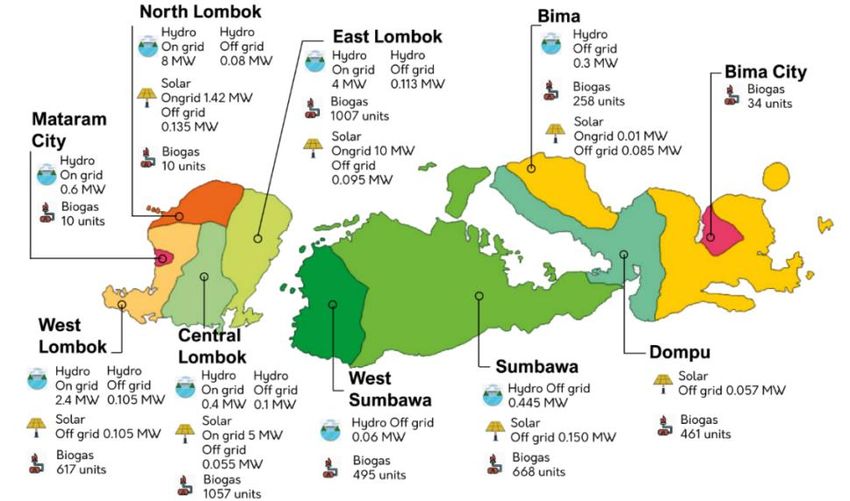
List of Figures

Figure 1 West Nusa Tenggara consists of two main islands. Source: Google Map 2020. ...................... 3
Figure 2 Existing solid waste management practice in the region. Source: Environmental and Forestry
 Agency of WNT 2019 [7]. .............................................................................................................. 6
Figure 3 Future solid waste management practice in the region. Source: Environmental and Forestry
 Agency of WNT 2019 [7]. .............................................................................................................. 6
Figure 4 Monthly electricity profile in West Nusa Tenggara. Source: BPS of WNT 2016,2017,2018, and
 2019 [8, 9, 10, 2] .............................................................................................................................. 8
Figure 5 Fuel consumption in West Nusa Tenggara in 2018. Source: Pertamina 2019 [17]. ................... 9
Figure 6 Electricity generation in West Nusa Tenggara in 2018. Source: Directorate General of
 Electricity 2019 [14] ........................................................................................................................ 9
Figure 7 Lombok grid system. Source: PLN 2019 [18] .............................................................................. 11
Figure 8 Sumbawa-Bima grid system. Source: PLN 2019 [18] ................................................................. 12
Figure 9 GHG emission profile in West Nusa Tenggara. Source: Directorate of GHG Emission Inventory
 [23] ................................................................................................................................................. 14
Figure 10 GHG emission profile in the energy sector of West Nusa Tenggara. Source: Directorate of
 GHG Emission Inventory [23] ....................................................................................................... 15
Figure 11 Energy organizational structure in Indonesia. Source: Personal Identification 2019 ............ 16
Figure 12 Energy legal framework in Indonesia. Source: Personal Identification 2019 ......................... 17
Figure 13 Energy organizational structure in West Nusa Tenggara. Source: Personal Identification
 2019 ............................................................................................................................................... 19
Figure 14 Energy legal framework in West Nusa Tenggara. Source: Personal Identification 2019 ...... 20
Figure 15 Photovoltaic power potential in West Nusa Tenggara. Source: Global Solar Atlas 2020 [32]
 ....................................................................................................................................................... 22
Figure 16 Mean wind power density map in West Nusa Tenggara. Source Global Wind Atlas 2020 [33].
 ....................................................................................................................................................... 22
Figure 17 Renewable energy potential in West Nusa Tenggara. Source: Personal Identification 2019
 based on RUED [31]. ..................................................................................................................... 23
Figure 18 Implemented renewable energy projects in West Nusa Tenggara. Source: Personal
 Identification 2019 based on RUED [31]. .................................................................................... 25
Figure 19 The projection of power generation capacity in West Nusa Tenggara. Source: RUED 2019
 [31]. ................................................................................................................................................ 26
Figure 20 The projection of renewable capacity in West Nusa Tenggara. Source: RUED 2019 [31]. .... 26
Figure 21 Simplified public-private partnership scheme. Source: Personal identification 2019. .......... 29

renewablesroadmap.iclei.org vii Initial Status Report of Deep-Dive Region
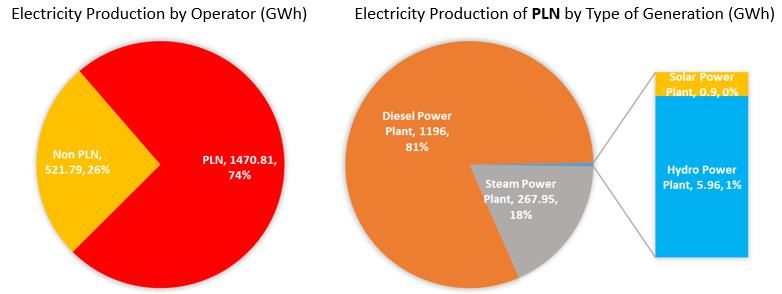
Figure 22 PINA Financial Scheme. Source: PINA 2020 [42] ...................................................................... 33
Figure 23 IIGF scheme workflow. Source: IIGF (2016) cited in PWC (2018) [24]. ................................... 34
Figure 24 RE implementation barriers in West Nusa Tenggara. ............................................................... 35
Figure 25 RE implementation opportunities in West Nusa Tenggara. ..................................................... 35

renewablesroadmap.iclei.org viii Initial Status Report of Deep-Dive Region
List of Tables

Table 1 General overview of West Nusa Tenggara. Source: BPS of WNT 2020 [1]. ................................. 1
Table 2 Total area and population by Regency/Municipality in West Nusa Tenggara 2019. Source: BPS
 of WNT 2020 [1]. ............................................................................................................................. 2
Table 3 The land usage and its area of the deep-dive cities/regions in 2017. Source: BPS of WNT 2017
 [3]. .................................................................................................................................................... 3
Table 4 Gross Regional Domestic Product at 2010 constant market prices by industry (billion rupiahs),
 2015–2019. Source: BPS of WNT 2020 [1]. ................................................................................ 4
Table 5 Domestic and foreign investment realization by economic sector from 2016 to 2018. Source:
 Investment Agency of WNT 2016, 2017, and 2018 [4, 5, 6]. ....................................................... 5
Table 6 Electricity consumption in West Nusa Tenggara by locations. Source: BPS of WNT
 2016,2017,2018, and 2019 [9, 10, 11, 2] ....................................................................................... 7
Table 7 Electricity consumption in West Nusa Tenggara by sector of customers. Source: Directorate
 General of Electricity 2016,2017,2018, and 2019 [12, 13, 14, 15] ............................................... 7
Table 8 Electricity generation in West Nusa Tenggara based on installed capacity in 2018. Source:
 Directorate General of Electricity 2019 [15] ............................................................................... 10
Table 9 Electricity transmission and distribution. Source: Directorate General of Electricity 2019 [15] 11
Table 10 Electricity Retail Tariff in Indonesia. Source: PLN 2020 [21] ..................................................... 12
Table 11 National stakeholders. Source: PWC 2018 [25] .......................................................................... 16
Table 12 Energy and electricity policies in Indonesia ................................................................................ 18
Table 13 Renewable energy potential in West Nusa Tenggara. Source: RUED 2019 [31] ...................... 21
Table 14 Bioenergy feedstock in West Nusa Tenggara. Source: RUED 2019 [31] .................................. 24
Table 15 Several actions under Activity Plan Matrix that align with 100%RE project. Source: RUED 2019
 [31]. ................................................................................................................................................ 27
Table 16 On-going and planned renewable generation projects. Source: RUPTL PLN 2019 [19]. ......... 28
Table 17 Renewable energy projects. Source: Personal communication with Energy Agency of WNT
 2019 ............................................................................................................................................... 28
Table 18 Comparison of three kinds of PPP schemes. Source: Indonesia Infrastructure Guarantee Fund
 (IIGF) 2017 [42]. ............................................................................................................................ 31
Table 19 Renewable Energy Power Plant. Source: Energy Agency 2019 [45] .......................................... xii
Table 20 Matrix Activity Plan. Source: RUED 2019 [31]. ............................................................................ xiii

renewablesroadmap.iclei.org ix Initial Status Report of Deep-Dive Region
List of Abbreviations

 ADB Asian Development Bank

 BAPPEDA Regional Development Planning Agency

 BAPPENAS National Development Planning Agency

 BOO Build-Own-Operate

 BOOT Build-Own-Operate-Transfer

 BPS Statistics Indonesia

 BUMN State-owned Enterprise

 BUMD Regional-owned Enterprise

 BUMDes Village Enterprise

 COD Commercial Operation Date

 DEN National Energy Council

 DESDM Regional Energy Agency

 DPR House of Representatives

 EBTKE New and Renewable Energy and Energy Conservation

 EE Energy Efficiency

 EPC Engineering, Procurement, and Construction

 ER Electrification Ratio

 FiT Feed-in-tariff

 GHG Greenhouse Gases

 GoI Government of Indonesia

 GR Government Regulation

 GRDP Gross Regional Domestic Product

 GWh Gigawatt-hours

 IPP Independent Power Producers

 KEN National Energy Policy

 kl Kiloliters

 kWh Kilowatt-hours

renewablesroadmap.iclei.org x Initial Status Report of Deep-Dive Region
LPG Liquefied Petroleum Gas

 MEMR Ministry of Energy and Mineral Resources

 MoF Ministry of Finance

 MoSOE Ministry of State-Owned Enterprises

 MoPW Ministry of Public Work

 MTOE Million Tons of Oil Equivalent

 MW Megawatts

 Pertamina National Oil Company

 PLN State-Owned Electricity Company

 PPA Power Purchase Agreement

 PPP Public-Private Partnership

 PR Presidential Regulation

 RE Renewable Energy

 RUED Regional Energy Plan

 RUEN National Energy Plan

 RUKD Regional Electricity Plan

 RUKN National Electricity Plan

 RUPTL PLN’s Electricity Provision Plan

 SPC Special Purpose Company

 sq.km Square Kilometers

 UPTL Small-scale Electricity Supply Business

 WNT West Nusa Tenggara

 WQI Water Quality Index

renewablesroadmap.iclei.org xi Initial Status Report of Deep-Dive Region
Chapter 1 Region Overview
 West Nusa Tenggara (WNT) Province has been chosen as the deep-dive region for 100% Renewables
Cities and Regions Roadmap, supported by the Ministry of Energy and Mineral Resources (MEMR) through its
Geothermal Directorate. The selection of the province as the deep-dive region is important to accelerate the
achievement of renewable energy (RE), energy efficiency (EE), and electrification ratio (ER) targets, and to
match the continuous energy demand in the future and the replication potential of the project to other
provinces. Mataram City and Sumbawa Regency have been selected as the deep-dive cities for 100%
Renewables Cities and Regions Roadmap.

The provision of this Initial Status Report serves as a starting point for planning the 100% Renewables Cities
and Regions Roadmap of West Nusa Tenggara. The objectives of this report are:

 • to learn the current RE status and projects of the deep-dive regions/cities;
 • to understand the legal frameworks for project cities and regions;
 • to identify the sources of funding and the process of applying for finance; and
 • to evaluate the limitations and opportunities towards a 100% RE in the deep-dive cities/region.

West Nusa Tenggara is one of 34 provinces in Indonesia. The following Table 1 presents the summaries of
the population, economy, energy status, and social indicators of West Nusa Tenggara .

Table 1 General overview of West Nusa Tenggara. Source: BPS of WNT 2020 [1].

 Sector Notes
 Geography
 Location The province has boundaries as follows: North – Java Sea; South – Indian
 Ocean; West – Bali Province; East – East Nusa Tenggara Province.
 Area The total area of the province reaches 20,124.48 sq.km in which Sumbawa
 Island makes up two-thirds of the province area.
 Climate/Weather Tropical climate; mean annual temperature of 27 oC and ranges between 21oC
 and 36oC. West Nusa Tenggara has relatively little rainfall compared to the
 western region of Indonesia.
 Population
 Inhabitant 5,070,385 inhabitants with 51.5% female and 48.5% male, or a sex ratio of
 94.36 in 2019.
 Population Density 252 people per sq.km
 Age Distribution 0-14 years (29.2%), 15-64 years (65.5%), 65+ years (5.3%)
 Number of Households 1,407,554 with a mean household size of 3.6
 Government
 Capital Mataram City
 Number of Cities/Regencies West Nusa Tenggara has 2 (two) municipalities and 8 (eight) regencies
 spreading over 2 (two) main islands. These include Mataram City, West
 Lombok, Central Lombok, East Lombok, and North Lombok at Lombok Island;

renewablesroadmap.iclei.org 1 Initial Status of Deep Dive Region
and Bima City, Sumbawa, Dompu, West Sumbawa, and Bima at Sumbawa
 Island.
 Economic
 Dependency Ratio 52.61%
 Resources Agriculture, Forestry, Fisheries, Mining
 Main Economic Activities/Industries Dominant primary sector economy: Food Crops Agriculture, Livestock,
 Fisheries, Tourism, Ore Mining, Food and Beverage Manufacturing, Tobacco
 Products Manufacturing, Wholesale and Retail Trade.
 Infrastructure Lombok International Airport, Sultan Kaharudin Airport Sumbawa, Sultan
 Salahudin Airport Bima, Bima Port, Badas Port, Lembar Port
 Education
 Number of Institutions 3,223 (Primary School), 958 (Junior High School), 333 (Senior High School),
 325 (Vocational High School)
 Enrolment 63,842 students (Primary School), 175,307 (Junior High School), 105,398
 (Senior High School), 80,032 students (Vocational High School)
 Tertiary Institution 1 Public Universities and 54 Private Universities
 Health
 Health Facilities 34 Hospitals, 76 Polyclinics, 169 Public Health Centers, 520 Subsidiaries of
 Public Health Center, 258 Pharmacies
 Prevalent Diseases Malaria, Tuberculosis, Leprosy, Diarrhea, Dengue Hemorrhagic Fever, AIDS
 Access to Energy
 Grid Electrification Rate 99.55% in 2019
 Electricity Consumption 1,778.8 GWh as at the year 2018
 Energy Sources The use of gas/LPG, kerosene, and firewood for cooking is prevalent in the
 Province at 58.20%, 18.97%, and 21.44% respectively.

1.1 Population
 The annual population growth rate in the province from 2018 to 2019 was approximately 1.13% [1].
Table 2 shows that Mataram City has the largest population density, at 7,940 people per sq.km, while Sumbawa
Regency has the lowest population density, at 69 people per sq.km in 2019 [1]. This population density
difference can have an impact on the energy profile and energy provision’s strategy in both deep-dive cities.

Table 2 Total area and population by Regency/Municipality in West Nusa Tenggara 2019. Source: BPS of WNT 2020 [1].

 Regency/Municipality Area % Population % Population Density
 (sq.km) (people) (people per sq.km)
 Lombok Island
 1. Mataram City 61.30 (0.30) 486,715 (9.60) 7,940
 2. West Lombok 1,053.87 (5.24) 694,985 (13.71) 659
 3. Central Lombok 1,169.58 (5.81) 947,488 (18.69) 810
 4. East Lombok 1,605.55 (7.98) 1,200,612 (23.68) 748
 5. North Lombok 809.53 (4.02) 220,412 (4.35) 272
 Sumbawa Island
 6. Bima City 222.25 (1.10) 173,031 (3.41) 779
 7. Sumbawa 6,643.98 (33.01) 457,671 (9.03) 69
 8. Dompu 2,320.00 (11.53) 252,288 (4.98) 109
 9. West Sumbawa 1,849.02 (9.19) 148,606 (2.93) 80
 10. Bima 4,389.40 (21.81) 488,577 (9.64) 111
 Total 20,124.48 (100) 5,070,385 (100) 252

renewablesroadmap.iclei.org 2 Initial Status of Deep Dive Region
1.2 Geographical and Location
 West Nusa Tenggara lies between 115o46’-119o5’ East longitude and 8o10’-9o5’ South latitude [1]. The
province consists of two main islands, which are Lombok Island in the western part and Sumbawa Island in
the eastern part (Figure 1). In addition to the main islands, the province has hundreds of small islands. Of the
421 islands that exist, only 39 of these are inhabited [2]. According to Table 2, Sumbawa Regency has the
largest area, at 6,643.98 sq.km, while Mataram City has the smallest area, at 61.30 sq.km [1, 2].

Figure 1 West Nusa Tenggara consists of two main islands. Source: Google Map 2020.

The land area in West Nusa Tenggara can be classified into several categories based on its utilization (Table
3). As shown in Table 3, both Mataram City and Sumbawa Regency had different land-use coverage in 2017
[3]. Settlement areas cover more than half of Mataram City. In contrast, less than a quarter of the land area in
the Sumbawa Regency was used for settlement. More than one-third of the regency area was a primary forest
in 2017 [3]. The difference in land utilization in Mataram City and the Sumbawa Regency can impose different
RE strategies in both places.

Table 3 The land usage and its area of the deep-dive cities/regions in 2017. Source: BPS of WNT 2017 [3].

 Land Usage WNT Province Mataram City Sumbawa Regency
 (sq.km) (sq.km) (sq.km)
 Agricultural and Forestry
 1. Rice Fields 2,801.25 19.27 613.46
 2. Dryland Cultivation 3,909.50 0.72 944.55
 3. Pastureland 233.50 35.38
 4. Primary Forest 7,166.44 2772.24
 5. Secondary Forest 1,276.81 869.41
 6. Temporary Unused Land 473.17 161.72
 7. Other 1066.65 4.04 252.93
 Non-Agricultural and Forestry 3197.20 37.27 994.29
 (Settlements)
 Total 20,124.48 61.30 6643.98

renewablesroadmap.iclei.org 3 Initial Status of Deep Dive Region
1.3 Economy
 The Gross Regional Domestic Product (GRDP) of West Nusa Tenggara in 2019 amounted to 132.67
trillion Rupiah, while in 2018 it was 123.97 trillion Rupiah [1]. Generally, the GRDP of West Nusa Tenggara had
a growth between 2016 and 2019. In 2019, agriculture, forestry, and fisheries sector dominated the economy
of the province followed by the wholesale and retail trade sector (Table 4). The contribution of the agricultural,
forestry, and fisheries sector in 2019 reached 22.89% [1].

Table 4 Gross Regional Domestic Product at 2010 constant market prices by industry (billion rupiahs), 2015–2019.
Source: BPS of WNT 2020 [1].

 Sector 2016 2017 2018 2019
 Agriculture, Forestry, and Fisheries 24,661.77 27,183.24 29,067.12 30,368.89
 Mining and Quarrying 26,231.97 24,108.62 17,317,57 17,995.65
 Manufacturing 4,511.47 4,918.19 5,111.38 5442.73
 Electricity and Gas 73.73 90.62 97.50 106.27
 Water Supply and Waste Management 98.35 105.62 101.75 105.46
 Construction 9,892.83 10,961.23 11,809.06 13,986.70
 Wholesale and Retail Trade 14,506.18 16,387.95 17,955.03 19,795.66
 Transportation and Storage 8,209.18 9,000.93 9,312.57 9,650.36
 Accommodation and Food Services 2,503.44 2,747.48 2,660.23 2,696.56
 Information and Communication 2,045.15 2,303.21 2,456.65 2,598.26
 Financial and Insurance 3,701.24 4,245.90 4,692.48 4,840.13
 Real Estate 3,498.44 3,793.67 4,099.76 4,363.71
 Business Activities 193.12 211.10 226.62 245.13
 Public Administration and Defense 6,991.65 7,437.80 7,818.22 8,174.65
 Education 5,152.31 5,680.64 6,122.06 6,700.49
 Human Health and Social Work 2,006.42 2,186.85 2,450.13 2,685.38
 Other Services 2,187.54 2,459.70 2,667.80 2,918.13
 Gross Domestic Product 116,464.76 123,822.77 123,965.94 132,674.15

Between 2016 and 2018, West Nusa Tenggara received a significant amount of funding (Table 5). The province
received a total of 9.9 trillion Rupiah in 2016 [4], 11.3 trillion Rupiah in 2017 [5], and 13.5 trillion Rupiah in 2018
[6]. While agricultural, forestry, and fisheries sector had the highest share of GRDP between 2016 and 2018,
the tourism sector and the mining, energy, and electrical sector were two sectors that had the highest
investment realization during that period.

In 2018, 7,089 billion Rupiah of domestic investment and 2,524 billion Rupiah of foreign investment was spent
on the mining, energy, and electricity sectors [6]. Additionally, 1,447 billion Rupiah of domestic investment and
597 billion Rupiah of foreign investment was allocated for the tourism sector in 2018 [6]. It indicates that both
sectors were emerging in West Nusa Tenggara. Additionally, Mandalika in Lombok Island has been chosen as
one of the Special Economic Zones in Indonesia focusing on tourism development. The Investment
Coordinating Board (BKPM) estimated that Mandalika can attract 28.63 trillion Rupiah of investment until 2025
[7]. Therefore, the 100% Renewables Cities and Regions Roadmap can be designed to accommodate the
energy needs in these sectors, such as the provision of renewable energy systems for ecotourism.

renewablesroadmap.iclei.org 4 Initial Status of Deep Dive Region
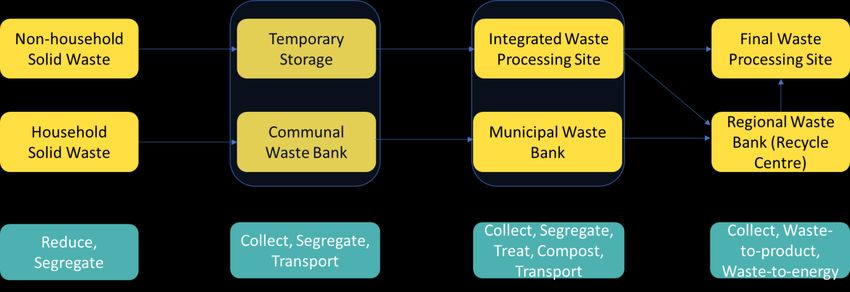
Table 5 Domestic and foreign investment realization by economic sector from 2016 to 2018.
Source: Investment Agency of WNT 2016, 2017, and 2018 [4, 5, 6].

 Domestic Investment Foreign Investment
 Sector
 2016 2017 2018 2016 2017 2018
 Agriculture 3 Billion 170 Billion
 Plantation 177 Billion
 Husbandry
 Fisheries 72 Billion 38 Billion 173 Billion 63 Billion 63 Billion
 Forestry
 Mining, Energy, 50 Billion 8,259 Billion 7,089 Billion 6,582 Billion 147 Billion 2,524 Billion
 and Electricity
 Manufacturing 11 Billion 125 Billion 155 Billion 4 Billion 13 Billion 38 Billion
 Tourism 284 Billion 1,447 Billion 2,110 Billion 1,434 Billion 596 Billion
 Transportation 36 Billion 774 Billion 0.1 Billion
 Service 1 Billion 245 Billion 394 Billion 606 Billion 510 Billion 144 Billion
 Trading 64 Billion 162 Billion 75 Billion 9 Billion 38 Billion 17 Billion
 Total 411 Billion 9,075 Billion 9,972 Billion 9,487 Billion 2,205 Billion 3,552 Billion

1.4 Current Environmental Challenges
 West Nusa Tenggara is facing several environmental issues. According to the Information on Regional
Environmental Management Performance Document published in 2019, there are three priority issues in the
province [8].

1.4.1 Land-use Change
 In the last decade, the government of West Nusa Tenggara promoted the corn plantation program in
the region. The presence of this program increased corn production dramatically from 786,864 tons in 2014
to 2,959,22 tons in 2018 [8]. However, the program has also led to the expansion of the crop areas into forests,
causing land degradation and damage to natural ecosystems. In 2018, the size of critical land in the province
was around 657 sq.km in which about 481 sq.km of the area was the forestry area [8].

1.4.2 Water Contamination
 The Water Quality Index (WQI) in West Nusa Tenggara was 53.50 in 2014 [8]. This number then
decreased significantly by approximately 40% to 31.34 in 2018 [8]. The monitoring result showed that two
rivers in the province, Rabajalu, and Padolo rivers, were heavily contaminated by domestic waste. It happened
due to the lack of awareness of the community in the surrounding areas.

1.4.3 Solid Waste Management Issue
 Figure 2 shows the existing solid waste management in the region. In 2018, only 20% of the total solid
waste generated in the region was treated (went to landfills) while the rest of the waste was untreated [8].
Therefore, in 2019, the government of West Nusa Tenggara launched the Zero Waste Program. This program
aims to reduce solid waste generation by 30% and to increase the proportion of treated waste, up to 70%, by

renewablesroadmap.iclei.org 5 Initial Status of Deep Dive Region
2023 [8]. To reach the objective, the government of West Nusa Tenggara proposes a new solid waste
management flowchart (Figure 3). Furthermore, they consider the development of the waste-to-energy plants
as one measure to achieve the target [8].

Figure 2 Existing solid waste management practice in the region.
Source: Environmental and Forestry Agency of WNT 2019 [8].

Figure 3 Future solid waste management practice in the region.
Source: Environmental and Forestry Agency of WNT 2019 [8].

renewablesroadmap.iclei.org 6 Initial Status of Deep Dive Region
Chapter 2 Energy Profile of West Nusa
Tenggara
2.1 Current Electricity/Energy Consumption
2.1.1 Electricity Sector
 The electricity sales in West Nusa Tenggara are performed by the state-owned electricity company
(PLN). Table 6 compares the electricity sales in the region from 2015 to 2018 in three different PLN branches
[9, 10, 11, 2]. According to the table, the Mataram branch had the highest demand comprising of almost three
quarters of electricity demand in West Nusa Tenggara. Additionally, electricity consumption in these three
branches always increased between 2015 and 2018.

Table 6 Electricity consumption in West Nusa Tenggara by locations.
Source: BPS of WNT 2016,2017,2018, and 2019 [9, 10, 11, 2]

 2015 2016 2017 2018
 Mataram 998.45 GWh 1,152.26 GWh 1,206.46 GWh 1,252.50 GWh
 Sumbawa 194.75 GWh 208.12 GWh 227.47 GWh 264.40 GWh
 Bima 209.09 GWh 230.95 GWh 243.62 GWh 259.91 GWh
 Total 1,402.29 GWh 1,591.33 GWh 1,677.54 GWh 1776.81 GWh

The electricity consumption based on consumer groups is shown in Error! Not a valid bookmark self-
reference. [12, 13, 14, 15]. The household sector is the top consumer, using approximately 63% of electricity
produced in the region. The electricity consumption in most categories always increased, except for that used
for public street lighting. There was a significant rise in electricity demand in the industrial sector from 85.52
gigawatt-hours (GWh) in 2017 [14] to 105.82 GWh in 2018 [15].

Table 7 Electricity consumption in West Nusa Tenggara by sector of customers.
Source: Directorate General of Electricity 2016,2017,2018, and 2019 [12, 13, 14, 15]

 Sector 2015 2016 2017 2018
 Household 919.76 GWh 1,026.96 GWh 1,074.58 GWh 1,129.51 GWh
 Industrial 68.93 GWh 77.17 GWh 85.52 GWh 105.82 GWh
 Commercial 280.67 GWh 331.30 GWh 352.40 GWh 367.90 GWh
 Social 46.67 GWh 56.92 GWh 62.53 GWh 69.02 GWh
 Government Office 29.45 GWh 37.96 GWh 49.02 GWh 45.93 GWh
 Public Street Lighting 56.82 GWh 61.01 GWh 53.49 GWh 58.63 GWh
 Total 1,402.29 GWh 1,591.33 GWh 1,677.54 GWh 1776.81 GWh

Figure 4 depicts the monthly electricity profile of the region from January to December for four years, between
2015 and 2018 [9, 10, 11, 2]. It can be seen from the figure that the electricity consumption always decreased
in February. Another interesting phenomenon is that electricity consumption in 2018 dropped in August and

renewablesroadmap.iclei.org 7 Initial Status of Deep Dive Region
September. It happened after a 6.4-magnitude earthquake struck the island of Lombok on 29 July 2018. It
indicates that natural disasters can disrupt the energy system in the region.

 161 162
 153 155 153 154
 151 149 150 147
 Electricity (GWh)

 143 146 143
 143 140 139
 136 137 135 136 135 136
 135 138 137 137
 134 132 133 134
 132 132
 129 130 129
 121 123
 119 117 117 116 118 119
 115 113 115 115
 104

 JANUARY FEBRUARY MARCH APRIL MAY JUNE JULY AUGUST SEPTEMBER OCTOBER NOVEMBER DECEMBER

 2015 2016 2017 2018

Figure 4 Monthly electricity profile in West Nusa Tenggara. Source: BPS of WNT 2016,2017,2018, and 2019 [9, 10, 11, 2]

2.1.2 Heating and Cooling Sector
 The percentages of households that utilize gas/LPG, kerosene, and firewood for cooking are at
58.20%, 18.97%, and 21.44%, respectively [1]. In 2017, 39,000 kiloliters (kl) of kerosene was consumed [16].
From April to October 2019, around 61,916 metric tons of LPG was used in the province [17]. The kerosene
and LPG consumption data are provided by Pertamina as the official distributor.

2.1.3 Transportation Sector
 The fuel consumption data is provided by Pertamina as the official distributor of fuels. West Nusa
Tenggara still relies on fossil fuels for its transportation sector. There are three types of fuels consumed in the
region in the transportation sector, namely RON 88 (Premium), RON 90 (Pertalite), and Diesel. RON 88 means
that 88% of the contents are octane while RON 90 means that 90% of the contents are octane. The higher the
octane number, the higher the oil ability to fight auto-ignition.

The consumption of fuel in the region is dominated by gasoline, particularly RON 88 (Premium) which is
subsidized by the government. While the subsidies for RON 88 are meant to financially support low to middle-
class citizens, the lack of government regulation means above-middle class citizens would also avail of this
subsidized fuel. In 2018, the consumption of RON 88 gasoline in the Sumbawa Regency and Mataram City was
41,304 kl and 40,712 kl, respectively [18]. Mataram City had lower consumption of RON 88 consumption than
the Sumbawa Regency, yet they had the highest consumption of RON 90 in the region in 2018, at 27,165 kl
[18]. Meanwhile, Sumbawa Regency had the highest consumption of diesel fuel at 28,143 kl in 2018 [18]. Diesel
is commonly used for trucks and heavy industry vehicles.

renewablesroadmap.iclei.org 8 Initial Status of Deep Dive Region
Gasoline (RON 88) Gasoline (RON 90) Diesel

 NORTH LOMBOK 10.370 2.025
 WEST SUMBAWA 11.144 6.283
 SUMBAWA 41.304 6.591 28.143
 EAST LOMBOK 59.375 11.736 25.005
 CENTRAL LOMBOK 57.576 11.653 22.091
 WEST LOMBOK 40.432 14.965 27.299
 DOMPU 27.259 1.746 15.285
 BIMA 26.805 1.871 11.347
 BIMA MUNICIPALITY 23.603 2.085 10.360
 MATARAM MUNICIPALITY 40.712 27.165 13.344

 KILOLITER

Figure 5 Fuel consumption in West Nusa Tenggara in 2018. Source: Pertamina 2019 [18].

2.2 Electricity/Energy mix for the Installed Generation Capacity
2.2.1 National Level
 The total installed capacity in Indonesia in 2018 is 64,924.80 megawatts (MW) [15]. Approximately
63% of this installed capacity is developed by PLN, which has the mandate to produce and supply electricity.
Independent Power Producers (IPP) own about 23% of the generation. Unfortunately, renewable energy
accounts for only 15.04% of Indonesia’s generation mix [15].

2.2.2 Electricity Generation in West Nusa Tenggara
 Total electricity generation in West Nusa Tenggara in 2018 was 1,992.6 GWh, where 74% of the
generation came from PLN [15]. There is no electricity import or export in the region. Diesel power plants
dominate the electricity generation of PLN followed by the steam power plants. Solar power plants and the
hydro ones have a lower share in the electricity generated by PLN (Figure 6).

Figure 6 Electricity generation in West Nusa Tenggara in 2018. Source: Directorate General of Electricity 2019 [15]

renewablesroadmap.iclei.org 9 Initial Status of Deep Dive Region
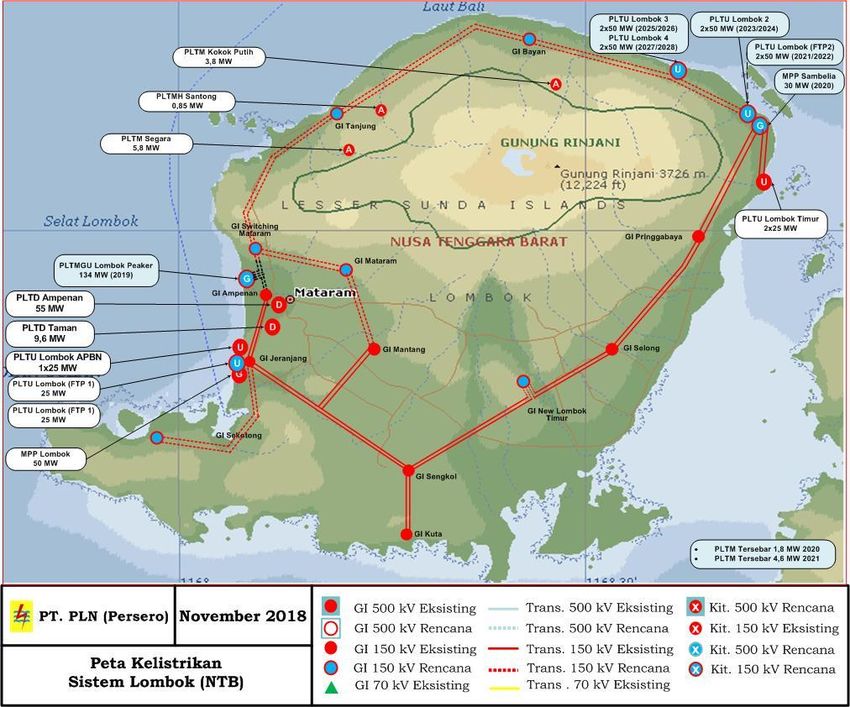
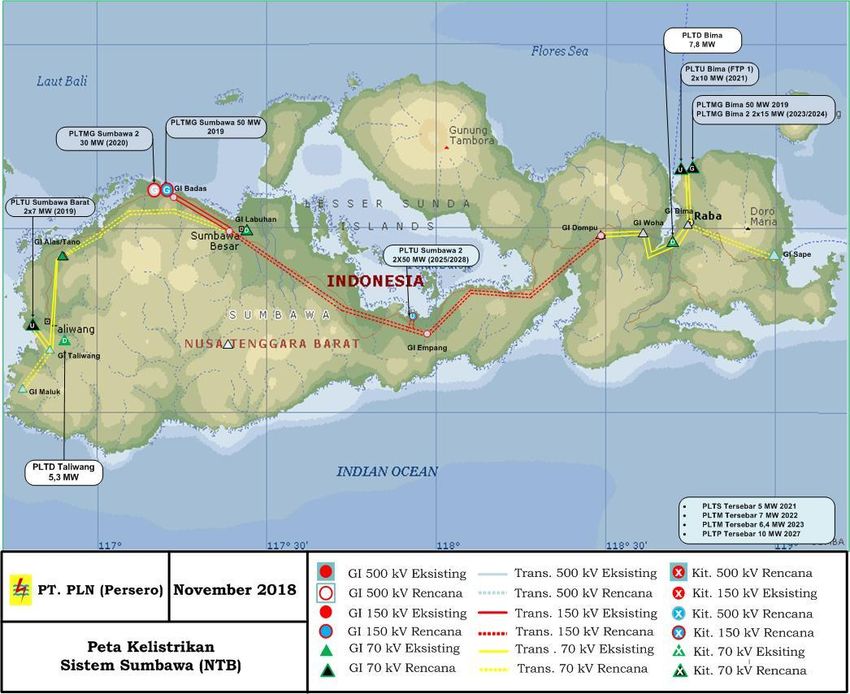
West Nusa Tenggara still relies on fossil fuels either for supplying the final energy demand or for generating
electricity. To generate electricity in 2018, PLN required 302,400 kl diesel fuel, 35,758 kl fuel oil, and 229,175
tons of coal [15]. Because there are no crude oil deposits and oil refineries in the province, they are depending
on imports from other regions. Consequently, it has a significant impact on the energy security of the province.

2.3 Electrical/Energy Actors
2.3.1 Electricity Generation
 The regional power grid in West Nusa Tenggara has an installed capacity of 612.48 MW as of 2018
[15], in which approximately 63% of this installed capacity is owned by PLN (Table 8). Diesel power plants
constitute 73.39% of PLN’s total installed capacity, at 283.62 MW of 386.44 MW [15]. The peak demand in
2018 was 226.17 MW in Lombok Island and 86.79 MW in Sumbawa Island.

In addition to PLN, three other groups develop power plants in the province. The Ministry of Energy Mineral
Resources (MEMR) had built a total of 1.96 MW communal hydro and solar energy by 2018 [15]. Additionally,
63 MW of power plant has been established by Independent Power Producers (IPP) in which 50 MW is diesel
power plants [15]. 161.08 MW of diesel power plants have been developed by Operating License Holders (IO)
[15]. Operating license holders are entities that have permits to develop power plants for personal usage.

Table 8 Electricity generation in West Nusa Tenggara based on installed capacity in 2018.
Source: Directorate General of Electricity 2019 [15]

 Installed Capacity (MW)
 Operator Steam Gas PP Diesel PP Mini Micro Solar PP Total
 PP Hydro PP Hydro PP
 PLN 50.00 50.00 283.62 1.50 0.50 0.82 386.44
 MEMR 0.44 1.52 1.96
 Non-PLN IO 161.08 161.08
 IPP 50.00 1.30 11.70 63.00
 Total 261.08 50.00 283.62 2.80 12.64 2.34 612.48
2.3.2 Electricity Transmission, Distribution, and Retailing
 PLN has exclusive powers over the transmission, distribution, and sales of electricity to the public in
the West Nusa Tenggara. The province has two grid systems, namely Lombok Grid System (Figure 7) for
Lombok Island and Sumbawa-Bima Grid System (Figure 8) for Sumbawa Island. Lombok Grid System is a 150-
kV network stretching from Mataram to East Lombok [19]. Sumbawa Grid System consists of a 70-kV network
stretching from Taliwang to Alas and a 20-kV network serving Sumbawa Besar [19]. Bima Grid System is a 70-
kV network serving Bima Municipality, Bima, and Dompu [19]. Several small and isolated systems are
distributed over small islands in the region. The power systems in Gili Trawangan, Gili Meno, and Gili Air have
been connected to the mainland Lombok Grid System through a 20-kV sea cable since 2012. The details of
the transmission and distribution system in the region are shown in Table 9.

renewablesroadmap.iclei.org 10 Initial Status of Deep Dive Region
Table 9 Electricity transmission and distribution. Source: Directorate General of Electricity 2019 [15]

 Type Network Length Transformer Capacity
 (Km-Circuit) (Units) (MVA)
 Transmission High Voltage 150 kV 405.02 19 700.00
 High Voltage 70 kV 138.67 6 150.00
 Distribution Medium Voltage (15 – 20 kV) 6,003.70 5,310 667.69
 Low Voltage (< 6 kV) 6,838.55 - -

 Figure 7 Lombok grid system. Source: PLN 2019 [19]

2.3.3 Non-Electricity Provider
 The distribution of petroleum-derived liquid, such as gasoline and diesel, and liquified petroleum gas
(LPG) is provided by Pertamina. The oil-fuel provision in West Nusa Tenggara Province is supplied from other
regions through three depots: Ampenan, Badas, and Bima depots [20]. Those depots are in charge to distribute
oil fuel (gasoline, kerosene, avtur) for three regions, including Lombok, Sumbawa, and Bima.

renewablesroadmap.iclei.org 11 Initial Status of Deep Dive Region
Figure 8 Sumbawa-Bima grid system. Source: PLN 2019 [19]

2.4 Electrical Energy and Fuel Pricing
2.4.1 National Level
2.4.1.1 Electricity Tariff
 The electricity retail tariff in Indonesia is regulated by the Ministry of Energy and Mineral resources
(MEMR) Regulation No. 28/2016 [21]. Table 10 shows the electricity retail tariff in Indonesia.

Table 10 Electricity Retail Tariff in Indonesia. Source: PLN 2020 [21]

 Code Customer Capacity Unit Tariff
 R-1/TR Small Household < 450 VA/900 VA IDR/kWh (0-30 kWh) 169/275
 IDR/kWh (30-60 kWh) 360/445
 IDR/kWh (60+ kWh) 495/495
 R-1/TR Small Household 900 VA-RTM IDR/kWh 1,352.00

renewablesroadmap.iclei.org 12 Initial Status of Deep Dive Region
R-1/TR Small Household 1300 VA/2200 VA IDR/kWh 1,467.28/1,467.28
 R-2/TR Medium Household 3500 VA – 5500 VA IDR/kWh 1,467.28
 R-3/TR Large Household >6600 VA IDR/kWh 1,467.28
 B-1/TR Small Business 900 VA IDR/kWh (0-108 kWh) 420
 IDR/kWh (108+ kWh) 465
 B-1/TR Small Business 1300 VA/2200-6600 VA IDR/kWh 966/1100
 B-2/TR Medium Business 6600 VA – 200 kVA IDR/kWh 1,467.28
 B-3/TM Large Business >200 kVA IDR/kWh (peak) K x 1,035.78
 IDR/kWh (off-peak) 1,035.78
 IDR/kVArh 1,114.74
 I-1/TR Small Industry 3,500 VA – 14 kVA IDR/kWh 1,112
 I-2/TR Small Industry 14 kVA – 200 kVA IDR/kWh (peak) K x 972
 IDR/kWh (off-peak) 972
 IDR/kVArh 1,057
 I-3/TM Medium Industry >200 kVA IDR/kWh (peak) K x 1,035.78
 IDR/kWh (off-peak) 1,035.78
 IDR/kVArh 1,114.74
 I-4/TT Large Industry >30000 kVA IDR/kWh 996.74
 IDR/kVArh 996.74
 P-1/TR Small Government Office 6600 VA – 200 kVA 1,467.28
 P-2/TM Large Government Office >200 kVA IDR/kWh (peak) K x 1,035.78
 IDR/kWh (off-peak) 1,035.78
 IDR/kVArh 1,114.74
 P-3/TR Street Lighting 1,467.28
 L/TR, TM, TT Special Service 1,644.52
 Peak Hour (18.00 – 22.00); Off-peak Hour (22.00 – 18.00); K is a constant between 1.4 and 2
2.4.1.2 Electricity Supply Cost
 The average generation cost (BPP) of electricity in Indonesia is 7.86 cents US$/kWh [22]. BPP is a
benchmark used to determine the tariff regimes for renewable electricity generation.

2.4.1.3 Fuel Cost
 The fuel cost in Indonesia is regulated by the Ministry of Energy and Mineral resources (MEMR) Decree
No. 187K/10/MEM/2019 [23]. Like in any other country, the prices of petroleum products in Indonesia are
subject to fluctuations. These prices are constantly updated by Pertamina over short periods and the prices
are varied depending on the location [23].

2.4.2 Local/Regional level
2.4.2.1 Electricity Tariff
 The electricity retail tariff in West Nusa Tenggara follows the national tariff as depicted in Table 10.
According to 2018 PLN Statistics, the average tariffs per consumer sector in West Nusa Tenggara were 374
rupiahs for residential sector, 1,152 rupiahs for industrial and commercial sectors, 647 rupiahs for social
sector, 1,186 rupiah for government offices, and 1,459 for streetlighting.

renewablesroadmap.iclei.org 13 Initial Status of Deep Dive Region
2.4.2.2 Electricity Supply Cost
 The average generation cost (BPP) of the province is among the highest in all of Indonesia. The region
does not have significant fossil fuel resources and a connection to any of the other major grids in Indonesia.
The combination of lack of fossil fuel resources, the dependency of diesel for power generation and low
economies of scale results in power prices in Lombok at 14.35 cents US$/kWh, while in Sumbawa the power
prices at 19.18 cents US$/kWh, which are considerably higher than the national average [22].

2.4.2.2 Fuel Cost
 The fuel cost in West Nusa Tenggara is 6,450 rupiah/liter for RON 88 (Premium), 7,650 rupiah/liter for
RON 90 (Pertalite), 9,400 rupiah/liter for diesel, and 11,550 rupiah/liter for kerosene [23].

2.5 Greenhouse Gases (GHG) Emission Profiles and Trends
 Figure 9 shows the emission profile in West Nusa Tenggara in all sectors while Figure 10 shows the
emissions in the energy sector [24]. The agricultural sector had the highest emission share from 2000 to 2014
(except in 2007) followed by the energy sector. In the energy sector itself, the main source of emission during
the period came from the transportation sector followed by the power generation sector.

 12.000.000

 10.000.000
 GHG Emission (CO2e)

 8.000.000

 6.000.000

 4.000.000

 2.000.000

 0
 2000 2001 2002 2003 2004 2005 2006 2007 2008 2009 2010 2011 2012 2013 2014

 IPPU Energy Land Agriculture Waste

Figure 9 GHG emission profile in West Nusa Tenggara. Source: Directorate of GHG Emission Inventory [24]

renewablesroadmap.iclei.org 14 Initial Status of Deep Dive Region
3.500.000

 3.000.000

 2.500.000
 GHG Emission (CO2e)

 2.000.000

 1.500.000

 1.000.000

 500.000

 0
 2000 2001 2002 2003 2004 2005 2006 2007 2008 2009 2010 2011 2012 2013 2014

 Household Transportation Industry Power

Figure 10 GHG emission profile in the energy sector of West Nusa Tenggara.
Source: Directorate of GHG Emission Inventory [24]

renewablesroadmap.iclei.org 15 Initial Status of Deep Dive Region
Chapter 3 Renewable Energy-based
Enabling Regulatory, Policy, and Legal
Frameworks
3.1 National Level
3.1.1 Regulatory Framework
 Energy organizational structure describes how energy policies are developed and implemented by
multilevel government bodies. Figure 11 illustrates the energy organizational structure diagram at the national
level concerning electricity and Table 11 depicts the key stakeholders at the national level.

 Figure 11 Energy organizational structure in Indonesia. Source: Personal Identification 2019

Table 11 National stakeholders. Source: PWC 2018 [25]

 Entity Role
 House of Representatives (DPR) Commission VII of the DPR is responsible for developing regulation in the areas of
 energy and environment. They are also responsible for the approval of energy-
 related legislation [25].

renewablesroadmap.iclei.org 16 Initial Status of Deep Dive Region
Ministry of Energy and Mineral Develops and implements Indonesia’s energy policy including the National
 Resources (MEMR) Electricity General Plan (RUKN). They are also responsible for endorsing PLN’s
 Electricity Provision Plan (RUPTL).
 National Energy Council (DEN) Has a key role in determining the energy direction through the provision of National
 Energy Policy (KEN) and National Energy Plan (RUEN).
 National Development Planning Responsible for planning the national development under prevailing laws and
 Agency (BAPPENAS) regulations [25]
 Ministry of Finance (MoF) Approves fiscal incentives that may be offered by the government.
 Indonesia Infrastructure Provides and administers guarantees for infrastructure projects under the PPP
 Guarantee Fund (IIGF) scheme.
 PT Sarana Multi Infrastructure Supports investors obtain domestic financing for the debt and equity funding of
 (PT SMI) and PT Indonesia infrastructure development.
 Infrastructure Finance (PT IIF)
 The State-owned Electricity Has exclusive authority over transmission, distribution, and retailing electricity. PLN
 Company (PLN) is supervised by the MEMR, Ministry of State-Owned Enterprises (MSOE), and
 Ministry of Finance (MoF)
 Indonesian Renewable Energy A forum focuses on the development of renewable energy in Indonesia consisting
 Society (METI) of the Heads of the Association of Geothermal, Hydro, Solar, Biofuel, Biomass,
 Biogas, Wind, Nuclear and Ocean Energy.

3.1.2 Key Policies and Strategies Applicable to the Renewable Energy Sector
Figure 12 illustrates the energy policy relation in Indonesia while Table 12 shows the explanation of each
policy.

 Law on Energy Law on Electricity
 No 30/ 2007 No 30/ 2009

 National Energy Policy Electricity Business
 (KEN) Provision
 Government Regulation Government Regulation
 No.79/2014 No.23/2014

 National Medium-Term National Energy Plan National Electricity Plan
 Development Plan (RUEN) (RUKN)
 (RPJMN) President Regulation MEMR Regulation
 No. 22/2017

 PLN’s Electricity
 Supply
 Regional Regional Business Plan
 Medium-Term Energy (RUPTL) Regional
 Development Plan MEMR Electricity Plan
 Plan (RPJMD) (RUED-P) Regulation (RUKD)
 Governor
 Regulation

Figure 12 Energy legal framework in Indonesia. Source: Personal Identification 2019

renewablesroadmap.iclei.org 17 Initial Status of Deep Dive Region
You can also read