Arizona Solar Energy and Economics Outlook - By George Frisvold, William P. Patton, and Stan Reynolds Prepared for Arizona Solar Energy and ...
←
→
Page content transcription
If your browser does not render page correctly, please read the page content below
Arizona Solar Energy and Economics Outlook
      By George Frisvold, William P. Patton, and Stan Reynolds

     Prepared for Arizona Solar Energy and Economics Summit
                         January 09, 2009

                                 1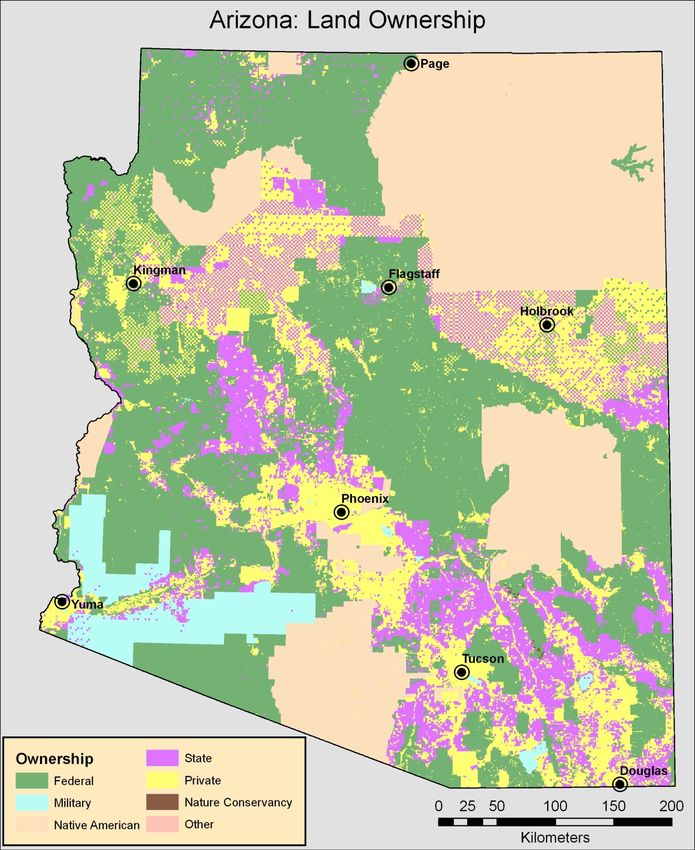
TABLE OF CONTENTS

EXECUTIVE SUMMARY

INTRODUCTION

PURPOSE OF THE STUDY

STATE OF SOLAR ENERGY DEVELOPMENT IN ARIZONA

PHYSICAL POTENTIAL FOR AZ TO BE A KEY PRODUCER OF SOLAR
ENERGY

POTENTIAL FOR SOLAR ENERGY DEPLOYMENT IN ARIZONA

RENEWABLE ELECTRICITY DEMAND FORECAST FOR ARIZONA

ECONOMICS OF SOLAR POWER IN ARIZONA

ECONOMIC IMPACT ON ARIZONA OF INCREASED SOLAR ENERGY
PRODUCTION

IMPACT OF LARGE SCALE SOLAR ENERGY DEVELOPMENT ON
SUSTAINABLE DEVELOPMENT IN ARIZONA

SUMMARY AND CONCLUSIONS

SOURCES

APPENDICES

Appendix 1 - Financial assumptions used in SAM model economic analysis of solar
technologies

Appendix 2 - Arizona Potential for Solar Energy Manufacturing

TABLES

Table 1 – AZ Renewable Electric Power Net Summer Energy Capacity (MW) by Source

Table 2 - AZ Renewable Electric Power Net Generation (Thousand MWh) by Source

Table 3 - Solar Power Levelized Cost of Energy (LCOE) by City
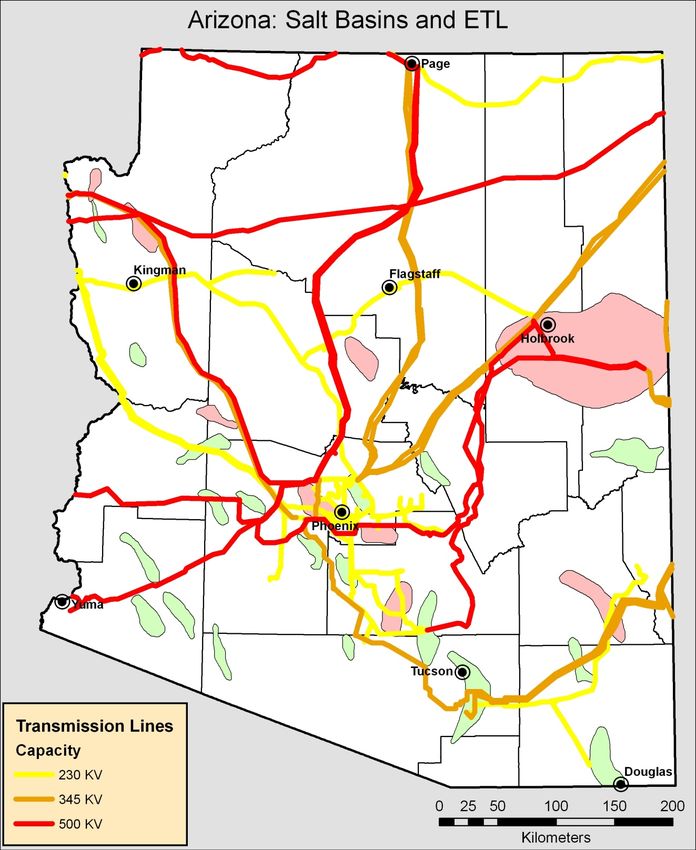
Table 4 - Arizona Renewable Energy Standard Requirements

Table 5- Arizona Renewable Energy Demand Forecast (Cumulative GWh)

Table 6 – Residential Solar Photovoltaic Characteristics

Table 7 – Commercial Solar Photovoltaic Characteristics

Table 8 – Utility Solar Photovoltaic Characteristics

Table 9 – Utility Concentrated Solar Photovoltaic Characteristics

Table 10 – Utility Solar Parabolic Trough Characteristics

Table 11 – Utility Solar Parabolic Dish Characteristics

Table 12 – Utility Solar Tower Characteristics

Table 13 –The Effect of Subsidies on LCOE by Solar Technology

Table 14 - Range of LCOE Estimates by Generation Technology (cents/kWh)

Table 15 – LCOE Projections for Selected Years by Solar Technology

Table 16 – Grid Connected Solar Technology Shares 2010 & 2030

Table 17 - Arizona Solar Power Generation

Table 18 - Arizona Solar Power Capacity

Table 19 - Arizona Solar Power Capital Investment

Table 20 - Arizona Solar Power Construction Employment

Table 21 - Arizona Solar Power Construction Wages

Table 22 - Arizona Solar Power Construction Value Added

Table 23 - Arizona Solar Power Direct O&M Employment

Table 24 - Arizona Solar Power O&M Wages

Table 25 - Arizona Solar Power Total O&M Value Added

Table 26 - Comparison of Water Consumption Intensity of Different Power Generation
Technologies
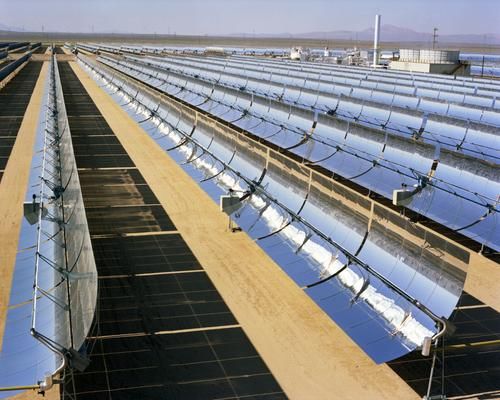
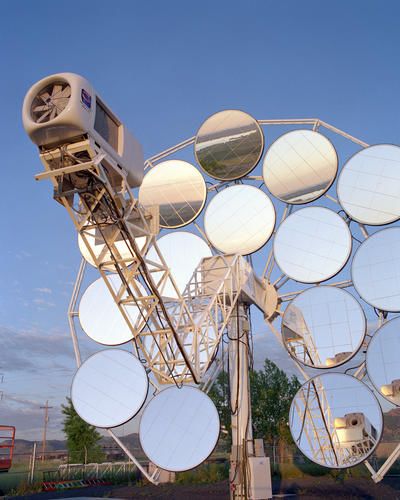
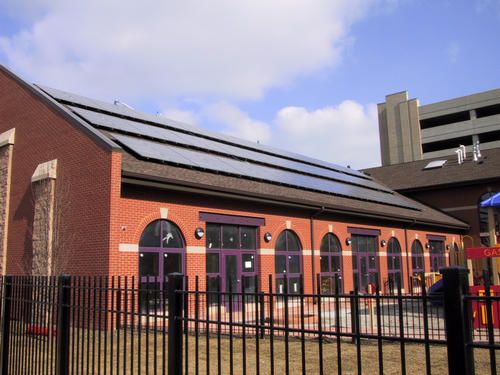
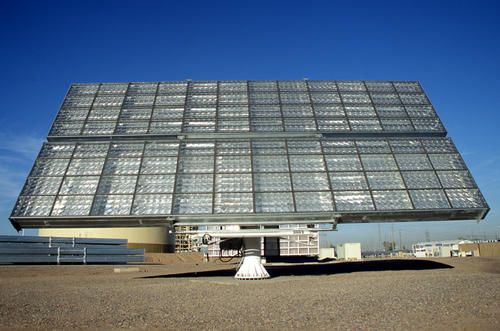
Table 27 - Projected Water Demand for Arizona Solar Energy Production

Table 28 - Projected Water Demand for Solar Energy Generation in Relation to Irrigation
Use

Table 29 – Water Consumption by Solar Technology

Table 30 - Arizona Solar Power Land Use

Table 31 - Life-Cycle Greenhouse Gas Emission Estimates for Selected Energy Power
Plants

Table A1.1 - Residential and Commercial Financial Assumptions

Table A1.2 - Utility Financial Assumptions

FIGURES

Figure 1 - United States Solar Resources by State (Watt-hr./inch2 per day)

PHOTOS

Photo 1 – Residential Silicon PV Application

Photo 2 – Thin Film PV Integrated into Roof Shingles

Photo 3 – Commercial Silicon PV Rooftop Application

Photo 4 – Utility Large Scale PV Generation System

Photo 5 – Experimental Concentrating Solar Photovoltaic Unit

Photo 6 – Utility Scale Solar Parabolic Trough System

Photo 7 – Solar Parabolic Dish Sterling Test System

Photo 8 – Solar Power Tower Test Facility

All photos are courtesy of National Renewable Energy Laboratory Photographic
Information Exchange

EXECUTIVE SUMMARY

This report examined the potential to develop solar power generation in Arizona and the
economic and sustainability implications of its deployment.

Arizona Solar Potential

The report found that there is a huge potential for solar power development in Arizona
due to its vast land availability, its intense solar radiation resources and the State’s goal of
accelerating renewable energy development through incentives and ACC mandated
Renewable Energy Standards (RES). The levelized cost of solar energy in Arizona is
much lower than it is in most other parts of the U.S. due to the abundant solar radiation
and sunny climate. The land and water resources in Arizona are sufficient to support the
amount of solar generation that would be required to meet the RES requirements for the
next twenty years.

Cost Competitiveness of Solar Power Units

The levelized cost of energy was calculated for several solar reference units including:
residential and commercial photovoltaic (PV) systems, and large scale PV and
concentrating PV systems. It was also calculated for large scale solar thermal units
including: solar parabolic troughs, solar parabolic dishes and central solar towers.

The report concluded that subsidies are still required to make solar power cost
competitive with conventional generation systems. However, future reductions in solar
equipment manufacturing costs and increases in solar system efficiencies will continue to
make solar power even more cost competitive in the future.

The competiveness of solar electricity could be greatly improved by future spikes in the
prices of fossil fuels used in generation since solar power has no fuels costs. In addition,
coal generation could be negatively affected by restrictions on greenhouse gas emissions
or taxes on emissions. This would make solar power even more competitive since it does
not emit significant levels of greenhouse gases. Solar electricity production revenue could
potentially be enhanced by selling carbon credit to other companies.

Economic Impact of Solar Power Development

The economic impact of solar power development in Arizona was estimated for both the
construction phase and the operation and maintenance phase of the solar generation life
cycle.

The economic impact of the solar power industry is driven by construction capital
investment and by O&M expenditures. These, in turn, are determined by the rate at which
solar capacity is added to the market and by the cumulative amount of operating solar
generation capacity.
Solar Power Generation Capacity

Annual solar power generation will steadily increase from 32,300 MWh in 2010 to
9,544,100 MWh in 2030. This amount of production will require the construction of
4,340 MW of cumulative solar generation capacity by 2030. From 2025 to 2030, all of
the incremental renewable energy requirements will be filled by solar power.

Capital Investment

Starting in 2010, the annual amount of capital investment will rise dramatically from $84
million in 2010 to a peak of $2.5 billion in 2025. By 2030 the annual rate of capital
investment drops to about $1.1 billion. In total, the construction of solar power plants to
meet the ACC RES requirements will cost around $22 billion in cumulative capital
expenditures by 2030.

Economic Impact of Construction

The massive level of solar power plant construction over the next 20 years generates the
lion’s share of solar power’s economic benefits in terms of employment, wages and value
added. The O&M phase of the solar generation process adds very little economic impact
in Arizona.

The annual amount of direct labor used on solar construction and installation projects will
increase from 565 jobs in 2010 to a peak 16,530 jobs in 2025. The total amount of jobs
created (including direct, indirect and induced jobs) increases from 1,068 to a maximum
of 32,082 over the same period.

The cumulative impact of direct construction employment amounts to 142,368 man-years
of direct employment by 2030. The cumulative total construction employment amounts to
277,759 man-years by 2030. Since these construction jobs only last a year and are not
permanent, the cumulative employment represents man-hours of effort over the twenty
year period, not total construction jobs at the end of the period.

The amount of wages generated by solar power construction and installation will be
significant. The total annual wages (direct, indirect and induced) will rise from $51
million in 2010 to a peak of $1,560 million in 2025. The cumulative value of wages over
the period 2010 to 2030 amounts to $13.5 billion.

The value added created by solar power construction and installation will also be
significant. The total annual value added (direct, indirect and induced) increases from $74
million in 2010 to a peak of $2,240 million in 2025. The cumulative amount of wages
from 2010 to 2030 amounts to $19.4 billion.

Economic Impact of O&M Activities
The amount of permanent jobs created from solar power O&M activities is insignificant
compared to those created in the construction process. The O&M direct jobs added each
year, rises from 2.5 in 2010 to a peak of 50 in 2025. Total employment (direct, indirect
and induced) added each year increases from 3 in 2010 to a peak of 87 in 2025.

Cumulative O&M employment will result in a total of 809 direct permanent jobs by
2030. The total number of cumulative permanent jobs will be 1,198 in 2030.

The total (direct, indirect, and induced) incremental annual wages generated by ongoing
solar O&M activity increases from $200,000 in 2010 to a peak of $8 million in 2025. The
cumulative wages from 2010 to 2030 amount to $65 million.

The total (direct, indirect, and induced) incremental value added generated by ongoing
solar O&M activity increases from $400,000 in 2010 to a peak of $6.6 million in 2025.
The cumulative wages from 2010 to 2030 amount to $128 million.

Sustainability of Solar Power

The amount of water used for solar power production is insignificant. Compared to
irrigation use, solar demand is less than 0.25 percent of agricultural applications, by
2030. It is only after 2015 that statewide solar water demand exceeds that of one average
water-using farm. By 2030, solar demand is projected to be equivalent to about 6
average water-using farms.
.
The amount of land needed by the solar power industry is readily available in Arizona. In
2030, the solar power industry would require 13,137 acres or 20.5 square miles of land to
produce the amount of electricity required to support the ACC RES.

Solar power production emits virtually zero greenhouse gases. Substitution of solar
electricity for fossil fuel generated electricity would beneficially lower the amount of
greenhouse gases released into the Arizona environment.

Conclusion

The expansion of solar electric production in the State of Arizona will create economic
and environmental benefits for the State of Arizona. The potential for expanded solar
power production is massive. The solar resource quantity and quality in Arizona is higher
than in most other regions in the U.S., makes it less expensive to produce electricity than
it is in other states. In addition, the land and water resources needed to support solar
electricity production are available in sufficient qualities. Large tracts of contiguous level
land are available from the Bureau of Land Management, Arizona State Land Trust and
Native American Reservations. Even though solar power is not a relatively large water
user, water is available in many of the prime areas for solar power production.

The construction of solar power plants will have a significant impact on the state’s
economy over the next twenty years in terms of employment wages and value added.

However, the operation of those generating plants once they are online will have very
little economic impact.

The expansion of solar power production will have a significant benefit on Arizona
sustainability. Increased solar production in Arizona will have a positive environmental
impact. It will lower the level greenhouse gas emissions. This will result in improved air
quality and help to mitigate the potential for climate change.

It will have minimal impact on water use and many of the preferred sites occur in areas of
the state that have sufficient water supplies. Although It requires a large amount of land
use, but there is enough land available to easily accommodate solar power land needs.

Development of Arizona’s solar energy resources will have a positive social impact, as
well. It will reduce impact of disruptions to the supply of conventional energy sources
and reduce the impact of significant increases in the cost of conventional fuels

In conclusion, development of solar energy resources will support the growth of the
Arizona population and economy on a more sustainable basis.
INTRODUCTION

In the wake of dramatic increases and volatility in the prices of fossil fuels and the
environmental necessity of reducing greenhouse gas emissions to slow the rate of global
climate change, there has been increasing interest in the role of renewable energy
technologies. Expanded production of energy from renewable sources has become a
public policy goal as a means of protecting the U.S. from unreliable and expensive
foreign energy sources and protecting the environment.

Based on these considerations, the federal government and states like Arizona are
actively promoting the expansion of renewable energy production through the use of
subsidies and renewable energy standards to push these technologies into the market. In
the case of solar energy, the combination of incentives, declining manufacturing costs
and increasing efficiencies over time is gradually making it more competitive with other
conventional and renewable energy systems.

                           PURPOSE OF THE STUDY

The purpose of this study is to analyze the potential for solar electric generation to
penetrate the energy market in Arizona over the next twenty years, and to examine the
economic and environmental impacts of increased use of solar power.

The study attempts to determine the size of investment needed to achieve the ACC
Renewable Energy Standard goals by 2025, as well as analyze the economic impact of
solar development on employment, wages and value added. The study also attempts to
determine the economic consequences of increased solar power production in terms of
land use, water use and the emission of greenhouse gases.

The overall goal of this study is to provide information about the solar energy market in
Arizona that can be used by policy makers to promote the development of a viable solar
energy industry.
STATE OF SOLAR ENERGY DEVELOPMENT IN ARIZONA

At the present time, the solar energy production industry is in its infant stage in the State
of Arizona. Despite the fact that Arizona and other southwestern U.S. states have
abundant solar energy resources, there has been little penetration of solar power into the
Arizona electric power generation market.

Several forces have encouraged the development of solar power in recent years. The
federal government retained the 30% ITC for solar energy projects, but removed the
maximum payment cap, encouraging the development of larger solar projects which had
previously had their tax credit limited by the payment cap. The Arizona Corporation
Commission’s Renewable Energy Standard goal of producing 15% of Arizona’s
electricity production using renewable energy by 2025 has put pressure on Arizona’s
regulated electric utilities to increase their utilization of electricity from renewable
sources, including solar. The instability of global energy supplies and prices have placed
growing emphasis on using renewable domestic energy sources as a way to mitigate the
effects of higher energy prices and reduce America’s dependence on unreliable foreign
energy sources.

Current Solar Market Penetration

The electric generation capacity for Arizona renewable energy sources is shown in Table
1 for the period 2002-2006.

As of 2006, the most significant renewable energy source was hydroelectric power with a
capacity of 2,720 MW or 10% of Arizona’s generation capacity. Arizona has made use of
its rivers and dams to tap its hydroelectric generation resources. However, most of the
high potential hydro power resources have been tapped, so there is limited room for its
further growth in the state.

Solar electric generation has the second largest capacity of the renewable energy
resources in Arizona. The state’s solar electric capacity has grown from 1 MW in 2002 to
9 MW in 2006. However it still trails hydro electric power by a significant amount and
constitutes less than 1% of the state’s total electric capacity.

The only other renewable energy sources that have penetrated into the Arizona electric
generation market are wood and wood waste, and municipal solid wastes and landfill gas.
These energy sources, combined, have less generation capacity than solar.

Wind energy has made virtually no entrance into the Arizona electric generation market.
According to a recent report by Black and Vetch, the wind resource in Arizona is
relatively limited and will probably be exhausted quickly once it enters the market.
Table 1 - Arizona Renewable Electric Power Net Summer Energy Capacity (MW)
by Source, 2002-2006.

Energy Source                           2002           2003           2004           2005           2006

Total Net Summer Electricity Capacity      19,442         23,510         24,303         24,904         26,608

Total Net Summer Renewable Capacity            2,707          2,718          2,722          2,736          2,736
  Geothermal                                       -              -              -              -              -
  Hydro                                        2,703          2,706          2,710          2,720          2,720
  Solar                                            1              7              8              9              9
  Wind                                             -              -              -              -              -
  Wood/Wood Waste                                  -              -              -              3              3
  MSW/Landfill Gas                                 4              4              4              4              4
  Other Biomass                                    -              -              -              -              -

Source: EIA. State Renewable Energy Profiles 2006, May 2008.

Renewable energy sources account for 6,846 GWh or 6.6% of the 104,303 GWh
generated by the Arizona electric generation industry. Hydroelectric generation
represents 99.2% of the renewable energy electric production. With the exception of solar
power with 13 GWh in 2006, the other renewable resources each produce less than 500
MWh.

Table 2 - Arizona Renewable Electric Power Net Generation (Thousand MWh) by
Source, 2002-2006.

Source                                   2002           2003           2004           2005           2006

Total Net Electricity Generation           94,132         94,396        104,564        101,479        104,393

Total Net Renewable Generation                 7,481          7,120          7,021          6,484          6,846
  Geothermal                                       -              -              -              -              -
  Hydro                                        7,427          7,705          6,973          6,410          6,793
  Solar                                            s              s              4             14             13
  Wind                                             -              -              -              -              -
  Wood/Wood Waste
  MSW/Landfill Gas
  Other Biomass

s – indicates less than .5 thousand MWh
Source: EIA. State Renewable Energy Profiles 2006, May 2008.

Physical Potential for Arizona to be a Key Producer of Solar Energy
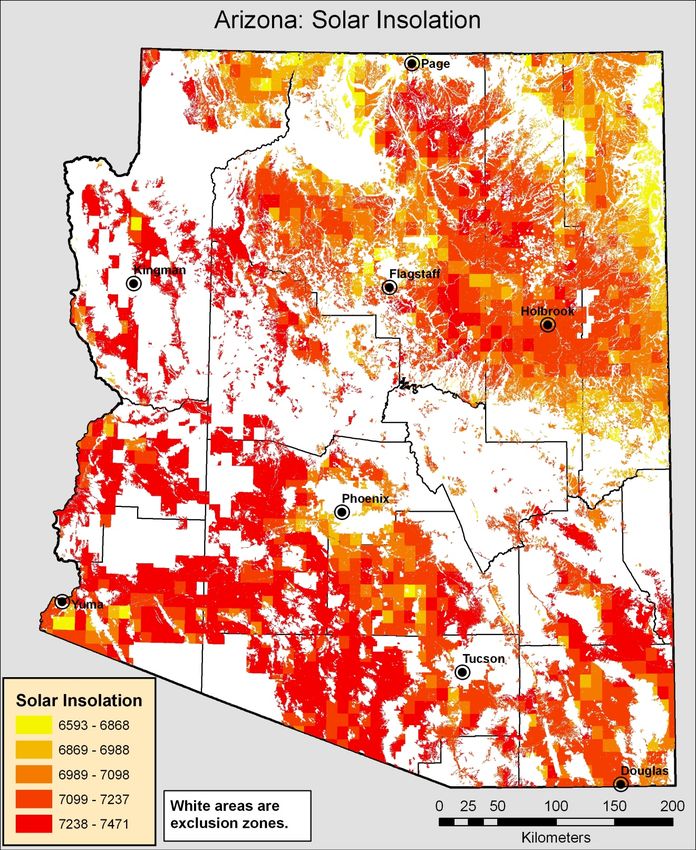
While solar electric capacity and production have made limited entry into the Arizona
electric market to date, the solar resource potential in the state is enormous. Arizona is
blessed with two critical resources that are essential to solar power production. These are
a high level of solar radiation per square inch and large amounts of contiguous, relatively
flat, undeveloped land.

The amount of daily solar radiation in various regions of the United States is shown in
Figure 1. The intensity of solar radiation is indicated by the by the colors on the map.
Purple and bluish colors denote regions with low levels of daily solar radiation. Green
and yellowish colors depict regions with relatively moderate levels of daily solar
radiation. The regions with the most intense levels of solar radiation are colored in
orange to reddish colors.

It is apparent from the map that the southwestern states have the highest levels of solar
radiation. The most intense solar radiation in the United States is located in southeastern
California and southern Nevada which average 7,000 to 7,500 W-hr/in.2 per day of solar
radiation. The remaining southwestern states have significant levels of daily solar
radiation. This includes portions of west Texas, the southern portions of Utah and
Colorado, and the majority of land area of New Mexico, and Arizona.
Figure 1 - United States Solar Resources by State (Watt-hr./inch2 per day)

The amount of solar radiation in a region is an important determinant of the cost of solar
electric energy economics. In general, cities with higher levels of solar radiation tend to
have lower levelized costs of energy. To illustrate this point, Table 3 shows the levelized
energy costs (LCOE) for selected U.S. cities that have different levels of solar radiation.
The LCOEs for the nine cities were estimated for a residential photovoltaic system and a
large utility scale parametric solar trough system.

To minimize the effects of state and local incentives on the cost of solar energy
production, the LCOEs for each city were estimated using the federal, state, local and
utility incentives and electric rates faced by customers in the Phoenix area served by
Arizona Public Service. The only factor that was varied was the level of solar radiation
and weather experienced in each city.

The results in Table 3 are dramatic. The subsidized LCOE for a residential PV system
ranges from a low of 17.1 (¢/kWh) in Albuquerque to a high of 33 (¢/kWh) in Fairbanks,
Alaska (see Table notes). The levelized cost of energy for a residential PV system in
Fairbanks is roughly double that in Albuquerque.
The results for a solar thermal system like a parabolic solar trough are even more
pronounced. The subsidized levelized energy cost for a solar trough range from a low of
14.3 (¢/kWh) in Las Vegas to a high of 64.0 (¢/kWh) in Fairbanks.

 Table 3 - Solar Power Levelized Cost of
 Energy (LCOE) by City ***
                                                            Utility
                               Residential                  Solar
                               Photovoltaic                Trough
                                  LCOE                      LCOE
       Location                  (¢/kWh)*                 (¢/kWh)**

 Albuquerque, NM                          17.1                    14.3
 Las Vegas, NV                            17.2                    13.4
 Phoenix, AZ                              17.6                    13.2
 Fort Worth, TX                           20.2                    20.0
 Miami, FL                                20.9                    25.3
 Minneapolis, MN                          22.6                    29.5
 New York, NY                             23.3                    37.4
 Seattle, WA                              28.4                    39.5
 Fairbanks, AK                            33.0                    64.9

* The residential PV system is a 3.8 kW unit with a $9,000 per kW installed cost and a $50/kW annual O&M cost. The PV unit
receives a 30% federal ITC and a 25% state ITC with a $1,000 maximum payment. It also receives a $3/Watt utility incentive.
** The utility solar trough system is a 100 MW unit with a $5,500 per kW installed cost and a $50/kW annual O&M cost. The PV unit
receives a 30% federal ITC and a 10% state ITC with a $25,000 maximum payment. It also receives a $1.5/Watt utility incentive.
*** The solar unit size, costs and subsidies in all locations are assumed to be identical to those in the APS service are in Phoenix.
Only the solar radiation is different for each of the cities,

The implication of this is that the southwest states, such as Arizona, have the best
potential to promote and develop solar electric power generation without having to resort
to extremely high subsidies. Since the economics of solar electricity production are much
better in Arizona and surrounding states than in other regions of the country, it is likely
that solar power production will develop here first, and then spread to other regions. If
solar power can’t make it in Arizona, Nevada, California and New Mexico, it won’t make
in other regions without heavy subsidies.

This means that the decisions made by the Arizona Corporation Commission and other
state and local government entities make over the next two decades, along with private
sector investment in renewable energy resource development will have profound
implications for the future of solar energy throughout the nation. If Arizona and other
southwestern states can develop a set of subsidies, land use policies, transmission access,
etc. that promote investment in solar energy technologies, it could result in economies of
scale in the production of solar energy equipment that reduce the cost of solar generation
and encourage its adoption in other regions of the country.
Solar electricity production requires large amounts of land in order to gather sufficient solar radiation to generate enough power to supply a significant amount of energy into the electric transmission grid. Large utility scale solar power plants can require as much as 5 acres per MW of peak capacity. The large land requirements of solar power generation make it difficult for many areas of the country to support a significant solar power generation industry. In order to site large scale solar electric generation units, it is necessary to have large, contiguous parcels of undeveloped land. Many of the large scale power plants also require level land. The cost or rental of the land must be reasonable, so the land must not have high valued competing uses. These land requirements are difficult to satisfy on a widespread basis in many parts of the country. However, in Arizona, there are large contiguous parcels of land available from federal, state and tribal lands (see “Arizona Land Ownership” map). Large contiguous parcels of U.S. Bureau of Land Management and State Land Trust lands are available in many parts of the state. Some of these parcels are relatively level and suitable for solar power production. Much of the land lies in remote desert areas with low land prices and few competing uses. The amount of suitable land is more than sufficient to supply Arizona’s electricity demand for decades to come. Solar energy will likely shoulder an increasing share of the state’s renewable energy production over time due to the state’s limited wind and biomass potential (Black &Veatch). Water use and availability should not be a major constraint for solar power production. Photovoltaic and parabolic dish systems require virtually no water. Solar troughs and towers require water to cool the equipment, but the water requirements are low relative to conventional generating plants or agricultural uses. A more important constraint to solar power development in Arizona is access to transmission grid. Many of the prime areas for solar power generation are in remote areas of the state that may not be close to existing electric transmission lines. As the industry matures, this will become less of a problem, particularly if solar production facilities cluster in certain parts of the state. Transmission capacity will grow to meet the load. The map titled “Arizona: Salt Basins and ETL” shows the location of large electric transmission lines and major salt basins around the state. The ability of to deliver electric power from its source to the electric grid is critical for the solar industry. Fortunately, major power lines pass near or through many of the areas with the highest solar radiation potential (see “Arizona Solar Insolation” map) The salt basins shown in the “Arizona: Salt Basin and ETL” map are important because they can be used for energy storage. This allows the energy from solar power system to be used at a different time than when it is created. This allows solar generation units to smooth their production profile or use the energy at a time when it is more valuable. This ability to store energy is appealing to utilities that purchase solar electricity since it make
electric power load more dispatchable.
POTENTIAL FOR SOLAR ENERGY DEPLOYMENT IN ARIZONA

   Solar electricity production is in its infant stage in Arizona at the present time. Although
   residential and commercial installed photovoltaic capacity is on the rise, it still remains a
   small share of the State’s total electric generation resource. Similarly, the State’s electric
   utilities are seeking ways to add capacity or purchase renewable energy sources to meet
   their obligations under the ACC renewable portfolio standard. Nevertheless, there are few
   existing large utility scale solar power generation units operating in the State.

   Independent power producers have expressed an interest in building solar power plants in
   Arizona and selling the electricity to regulated utilities to help them meet their mandated
   renewable energy requirements (SRP and utility cooperatives are voluntarily cooperating
   with renewable programs similar to the renewable portfolio standard even though they
   are not regulated by the ACC).

   The plans for building solar power plants in Arizona have been subject to revision as
   market conditions change. Construction plans are extremely sensitive to the existence and
   magnitude of federal, state and local subsidies for solar power production. The recent
   dramatic plunge in the price of oil and the tightening of the credit markets is causing
   some projects to be delayed or canceled.

   Arizona Benefits of Expanded Solar Energy Production

   The deployment of solar electric generating capacity will have a number of positive
   benefits for Arizona. Some of the benefits of increased solar generating deployment in
   Arizona are listed below.

   •   It would enhance national security by decreasing U.S. dependence on risky and
       unreliable foreign oil supply sources
   •   It would help to mitigate adverse climate change by reducing greenhouse gas
       emissions
   •   It could hedge against future price increases in oil, natural gas and nuclear generation
   •   It could hedge against the potential loss or limitation of coal-fired generation due to
       CO2 emission limitations or the expense of additional emissions remediation
       equipment
   •   It can help state utilities meet their ACC renewable energy portfolio standard
       requirements
   •   It allows utilities to add generating capacity incrementally as it is needed, rather than
       in large units like nuclear and coal base load generating stations
   •   Solar generation and manufacturing would add jobs and increase wages in the state.
   •   Solar generation and manufacturing would contribute higher tax revenues to Arizona
       governments at all levels
Obstacles to Solar Power Penetration in the Arizona Electricity Market
There are a number of obstacles to the penetration of solar electric generation into the
Arizona market. In the absence of financial incentives, solar power has a high cost
relative to conventional power sources. At the present time, it is difficult for solar power
to penetrate the State’s electric power market without significant subsidies.
It has intermittent power availability because, for the most part, solar power is available
only when the sun is shining. The electricity provided by solar power plants would be
more valuable to electric utilities if it could be dispatched into the transmission grid when
needed rather than when it is available.
In addition, large solar thermal and photovoltaic generation units require large amounts
of land the capture enough sunlight to power the plant. One of the problems in promoting
large scale solar power plants is that they require a massive amount of affordable,
contiguous, and relatively level land.
In general, the water usage by solar generating units is small relative to the amount used
by conventional power plants. However, large solar thermal plants require substantial
amounts of water to cool the equipment.
In recent years, the availability of solar photovoltaic equipment has sporadically been
affected by a shortage of silicon. This shortage resulted in higher prices for the silicon
crystals used to manufacture PV cells and limited the level of production.
Overcoming Obstacles to Solar Energy Market Penetration in Arizona
There are several technical and market trends that will contribute to overcoming the
obstacles to solar power penetration into the Arizona electric market. First, costs are
declining over time over time due to the following factors:
• Improvements in solar technology are leading to higher efficiencies, which reduce the
per unit cost of electricity from solar power units.
• The average cost of electricity from large scale photovoltaic units could be reduced
by cogenerating process heat, along with electricity (a side benefit of using the waste
heat is an improvement in photovoltaic conversion efficiency).
• Average costs for solar generating equipment will decline as the solar power market
expands and as the scale of production increases (manufacturing economies of scale).
• Standardization of small solar PV modules, mounting brackets and electrical
connections designed into new homes and commercial structures will lower the
installation costs of residential and small commercial solar energy applications.• The cost of owning and operating small scale residential and commercial solar power
units can be offset by net metering which allows residential home owners to sell
excess electricity directly to the utility.
The problem of intermittent solar power availability can be remedied by using storage
capacity to store solar energy for use at a higher valued time. Storage options include:
• Battery or chemical storage
• Compressed air energy storage (CAES) or pumped hydro storage
• Thermal storage
The availability of solar thermal and PV equipment will improve as these energy sources
penetrate the global market. Manufacturing capacity will grow to meet the demand for
solar power.RENEWABLE ELECTRICITY DEMAND
FORECAST FOR ARIZONA
Impact of Renewable Energy Portfolio on Energy Market in Arizona
Given the relatively high cost of solar and other renewable power, and the ambitious
renewable energy targets of the Arizona environmental portfolio standard, we predict that
the demand for renewable power will be driven almost entirely by the renewable energy
standard (RES) requirements over the next 20 years. These requirements are listed in
Table 4 below. The RES total requirement gradually increases until it reaches 15 percent
in 2025. By 2012, 30 percent of the renewable power is required to be from distributed
generation.
Table 4 - Arizona Renewable Energy Standard Requirements
Distributed Distributed
RES Total Share Share Non-Distributed
Year Requirement of RES of Total Share of Total
2010 2.50% 20.00% 0.50% 2.00%
2011 3.00% 25.00% 0.80% 2.30%
2012 3.50% 30.00% 1.10% 2.50%
2013 4.00% 30.00% 1.20% 2.80%
2014 4.50% 30.00% 1.40% 3.20%
2015 5.00% 30.00% 1.50% 3.50%
2016 6.00% 30.00% 1.80% 4.20%
2017 7.00% 30.00% 2.10% 4.90%
2018 8.00% 30.00% 2.40% 5.60%
2019 9.00% 30.00% 2.70% 6.30%
2020 10.00% 30.00% 3.00% 7.00%
2021 11.00% 30.00% 3.30% 7.70%
2022 12.00% 30.00% 3.60% 8.40%
2023 13.00% 30.00% 3.90% 9.10%
2024 14.00% 30.00% 4.20% 9.80%
2025 15.00% 30.00% 4.50% 10.50%
2026 15.00% 30.00% 4.50% 10.50%
2027 15.00% 30.00% 4.50% 10.50%
2028 15.00% 30.00% 4.50% 10.50%
2029 15.00% 30.00% 4.50% 10.50%
2030 15.00% 30.00% 4.50% 10.50%RES requirements apply to investor-owned utilities in Arizona; principally APS, TEP and
cooperatives. SRP and some other power producers are not subject to RES requirements.
However, SRP and other utilities have established their own renewable power goals, and
we expect some demand for renewable energy to come from SRP and these other utilities
that are not subject to the ACC RES requirements. The Table 5 below is based on
primarily on demand for renewable power in Arizona, as projected in the study by Black
& Veatch.
The column labeled Total Renewable Demand is the projected demand for non-
distributed renewable power over the next 20 years. There are opportunities for new
investment in renewable energy other than solar power (wind, bio-mass, etc.),
particularly in the near term. But solar power appears to be the most likely source for
meeting much of this renewable demand.
Table 5- Arizona Renewable Energy Demand Forecast (Cumulative GWh)*
Total Existing and Net New
Renewable Planned Development Projected Load
Year Demand Projects Required Subject to RES
2010 1,373 825 548 68,650
2011 1,597 825 773 69,435
2012 1,799 825 974 71,960
2013 2,126 825 1,302 75,929
2014 2,474 825 1,650 77,313
2015 2,844 825 2,019 81,257
2016 3,532 825 2,707 84,095
2017 4,265 825 3,440 87,041
2018 5,045 825 4,220 90,089
2019 5,874 825 5,049 93,238
2020 6,755 825 5,930 96,500
2021 7,691 825 6,866 99,883
2022 8,683 825 7,859 103,369
2023 9,736 825 8,912 106,989
2024 10,852 825 10,028 110,735
2025 12,034 825 11,210 114,610
2026 12,455 825 11,630 118,621
2027 12,891 825 12,066 122,773
2028 13,342 825 12,517 127,070
2029 13,809 825 12,984 131,517
2030 14,293 825 13,465 136,120
Table 5 extends Table 7-4 in Black and Veatch to the years 2026-2030. We assume 3.5
% annual growth in load subject to RES, and hence 3.5 % growth in total renewable
demand (since the RES minimum percentages remains constant after 2025).ECONOMICS OF SOLAR POWER IN ARIZONA
This section of the report discusses the methodology used to estimate and project the
Levelized Cost of Energy (LCOE) for several different solar electric generation
technologies that are either currently available or will be available in the market over the
next 30 years. The LCOE for each of the different solar technologies is driven by their
initial investment costs, annual O&M costs, capacity of the generating units, annual
electric production rates, efficiencies, solar radiation and climatic conditions, and
subsidies from federal, state and local governments, as well as local electric utilities.
These factors, along with a consistent set of financial and economic assumptions, are
input into several financial spreadsheets to estimate the LCOE for various representative
solar technologies and model the effects of changes in economic and technical conditions
over time.
There have been a number of studies in recent years that have examined the economics of
solar and renewable energy systems on the energy market in Arizona and other U.S.
western states. These studies include:
• Arizona Solar Electric Roadmap Study (Prepared by Navigant, 2007)
• Arizona Renewable Energy Assessment (Prepared by Black & Veatch, 2007)
• Powering Arizona (Prepared by Arizona State University, 2008)
• Clean and Diversified Energy Initiative (Western Governor’s Association, 2006)
It is often difficult for solar energy researchers to compare the economic results from
different studies on a consistent basis. These difficulties result from a variety of causes.
First, studies often present monetary information from different base years and use
different inflation assumptions in the forecast. Second, researchers use different
economic, financial and technical assumptions to generate their economic results. Finally,
they use different types of financial models to analyze complex and detailed technical
and financial relationships.
The process of analyzing the economics of solar energy could be simplified by following
a consistent methodology. First, define a set of reference solar generating units that will
be available in the market of the forecast period. These solar technologies should be
characterized on the basis of their costs and production profiles. Second, a consistent set
of economic and financial assumptions, including subsidies and tax treatment, should be
developed for use in the economic analysis. Third, an economic/financial model should
be used to evaluate the economic results for the solar power units. Finally, the model can
be run using different financial and technical assumptions to determine their effects on
LCOE and other economic metrics.Solar Reference Units for Economic Analysis The first stage of the economic analysis is to define a set of solar reference units that are likely to penetrate the electricity market in Arizona over the forecast horizon. Solar generating technologies tend to fall into two major categories, solar photovoltaic modules and solar thermal electric generating plants. Solar photovoltaic units convert energy from the sun directly into electric current. Solar thermal generating plants focus heat from the sun to produce steam to drive a generator or directly heat a motor (Sterling cycle) that rotates a generator. These technologies range in size from small residential roof top solar photovoltaic units to large utility scale solar thermal generating plants. The solar reference units fall into groups based on their intended application, size, and user group. Residential and commercial applications typically are used on-site and tend to be much smaller than industrial and utility applications. For the purposes of this study the user categories are residential, commercial and utility. The solar reference units for each class are listed below: Solar Reference Units Residential • Flat plate crystalline silicon photovoltaic Commercial • Flat plate crystalline silicon photovoltaic Utility Photovoltaic • Flat plate crystalline silicon photovoltaic • Thin film photovoltaic • Concentrated photovoltaic Utility Solar Thermal • Solar Parabolic Trough • Solar Parabolic Dish • Solar Tower Residential Photovoltaic Reference Units Residential users typically will install small rooftop photovoltaic (PV) equipment on-site. They either use the power directly or sell excess power back to the utility via a net metering arrangement. The PV equipment is usually installed on roof tops or other locations on the existing property so no additional land is necessary. Currently, a high proportion of the PV units are installed as retrofits on existing homes. The cost of installation will probably decrease in the future as PV units are increasingly designed into new home construction.
The most common type of photovoltaic equipment in use today is flat plate crystalline
silicon. It consists of an array of silicon PV cells mounted in a rigid frame. This
equipment is attached to the home to convert sunlight into electricity (see Photo 1).

                     Photo 1 – Residential Silicon PV Application

Thin film photovoltaics uses chemical deposits on a flexible thin film substrate to create
an electric current. Thin film PV can be used in most applications that can be performed
with traditional silicon PV cells. Thin film PV has some advantages over silicon PV cells.
First, it is flexible and can be molded around surfaces that are not flat and it can be built
into building materials. Second, it is deposited on a thin film substrate rather than printed
into silicon wafers. This makes it possible to gain cost savings in the manufacturing
process (see Photo 2).

                Photo 2 – Thin Film PV Integrated into Roof Shingles
The technical and cost assumptions for a residential solar PV reference unit are shown in Table 6. The financial assumptions for the residential PV system are reported in Appendix 1. Based on these assumptions the Levelized Cost of Energy for the residential PV unit is 17.6 cents per kWh. Table 6 – Residential Solar Photovoltaic Characteristics System Capacity (KW) 3.8 Annual Energy Output (KWh) 6,658 Capacity Factor (%) 20.0% System Life (years) 30 System Degradation (%/yr) 1% System Costs Capital Investment ($ per KW) $9,000 Annual O&M Cost ($ per KW) $50 O&M Escalation Rate 0 Economic Results Real LCOE (cents/kWh) 17.6 Commercial Photovoltaic Reference Units Commercial PV users also tend to install equipment on buildings and property on-site. They can also use the power directly or sell excess power back to the utility via a net metering arrangement. Since the PV equipment is typically installed on the existing property, no additional land is necessary. Commercial users can use silicon PV or thin film PV to produce electricity. However, commercial applications are larger than residential ones (see Photo 3).
Photo 3 – Commercial Silicon PV Rooftop Application

The technical and cost assumptions for a commercial solar PV reference unit are shown
in Table 7. The financial assumptions for the commercial PV system are reported in
Appendix 1. Based on these assumptions the Levelized Cost of Energy for the
commercial PV unit is 14.9 cents per kWh.

Table 7 – Commercial Solar Photovoltaic Characteristics

System                                 2010
Capacity (KW)                                 200

Annual Energy Output (kWh)                 332,88

Capacity Factor (%)                        19.0%

System Life (years)                            30

System Degradation (%/yr)                     0.01

System Costs
Capital Investment ($ per KW)              $7,000

Annual O&M Cost ($ per KW)                    $25

O&M Escalation Rate                             0

Economic Results
Real LCOE (cents/kWh)                         14.9
Utility Photovoltaic Reference Units

Utility photovoltaic generation units tend to be much larger than residential and
commercial units. These units are usually large enough to supply electricity for sell into
the electric transmission grid. They are built as self standing generation plants and the
electricity they produce is used off-site. These large solar PV plants can require large
capital investments and use significant amounts of land to capture the large quantity of
sunlight necessary to power the plant.

Utility PV plants can be operated by electric utility companies or by independent power
producers (IPP) that operate the plant and sell the power to utilities under an purchase
power agreement at contract electric rates. Utility PV generating plants currently tend to
use silicon photovoltaic modules to produce electricity, but on a much larger scale than
residential and commercial users (see Photo 4).

                 Photo 4 – Utility Large Scale PV Generation System

The technical and cost assumptions for a utility solar PV reference unit are shown in
Table 8. The financial assumptions for the utility PV system are reported in Appendix.
Based on these assumptions the Levelized Cost of Energy for the utility PV unit is 21
cents per kWh.
Table 8 – Utility Solar Photovoltaic Characteristics
System 2010
Capacity (MW) 5
Annual Energy Output (MWh) 10,074
Capacity Factor (%) 23.0%
System Life (years) 30
System Degradation (%/yr) 0.01
System Costs
Capital Investment ($ per MW) $6,000,000
Annual O&M Cost ($ per MW) $25,000
O&M Escalation Rate
Economic Results
Real LCOE (cents/kWh) 21.0
Concentrated photovoltaic (CPV) is another technology that could have promising
potential for generating electricity from the sun. EPRI explains that CPV uses lenses and
mirrors to focus more sunlight per unit of cell surface to produce more power. This
technology is useful in areas where land availability is limited, or where land prices and
rents are expensive(see Photo 5).
Photo 5 – Experimental Concentrating Solar Photovoltaic UnitThe technical and cost assumptions for a utility solar concentrated photovoltaic (CPV) reference unit are shown in Table 9. The financial assumptions for the utility CPV system are reported in Appendix 1. Based on these assumptions the Levelized Cost of Energy for the utility CPV unit is 19.1 cents per kWh. Table 9 – Utility Concentrated Solar Photovoltaic Characteristics System 2010 Capacity (MW) 15 Annual Energy Output (MWh) 30,222 Capacity Factor (%) 23.0% System Life (years) 30 System Degradation (%/yr) 0.01 System Costs Capital Investment ($ per MW) $5,000,000 Annual O&M Cost ($ per MW) $50,000 O&M Escalation Rate Economic Results Real LCOE (Cents/kWh) 19.1
Utility Solar Thermal Reference Units

Solar thermal power plants concentrate solar energy to produce high temperatures. In
solar parabolic trough and solar towers, this heat is then used to produce steam that spins
turbines that power electric generators and produce electricity. In solar parabolic dish
systems, the heat is focused on a small motor, such as a Sterling engine, that drives an
engine that turns a generator to produce electricity. One advantage of a large solar
thermal unit is that it is possible to store energy for use at a different time when it is
needed. The cost of thermal storage is lower than the cost of battery storage for
photovoltaic units.

The most common solar thermal system designs are the solar parabolic trough, the solar
parabolic dish, and the central solar tower. Each of these designs has its own set of
advantages and disadvantages that will be discussed in the paragraphs that follow.

Solar Parabolic Trough

The solar parabolic trough focuses sunlight on a long tube that contains a heat transfer
fluid that transfers heat into a heat exchanger. The heat from the heat exchanger is used to
produce steam to power and electric generator to produce electricity.

Parabolic troughs have been used by the electric power industry for decades. They can be
designed to move and track the sun to gain higher efficiencies. They can also be designed
to store thermal energy for a limited amount of time so that plant output can be more
stable and electric production can be better timed to meet the needs of the market (see
Photo 6).

                Photo 6 – Utility Scale Solar Parabolic Trough System
The technical and cost assumptions for a utility solar parabolic trough reference unit are shown in Table 10. The financial assumptions for the parabolic trough system are reported in Appendix 1. Based on these assumptions the Levelized Cost of Energy for the utility solar parabolic trough unit is 13.2 cents per kWh. Table 10 – Utility Solar Parabolic Trough Characteristics System 2010 Capacity (MW) 100 Annual Energy Output (kWh) 333,403 Capacity Factor (%) 38.1% System Life (years) 30 System Degradation (%/yr) 1% Storage (hr.) System Costs Capital Investment ($ per kW) $5,500,000 Annual O&M Cost ($ per kW) $50,000 O&M Escalation Rate Economic Results Real LCOE (cents/kWh) 13.2 Solar Parabolic Dish A solar parabolic dish system focuses sunlight onto an engine, such as a Sterling cycle engine. The heat from the sunlight expands gases in the engine which active pistons that are used to turn a generator to make electricity. The parabolic dish system is very flexible with regard to sizing. Each dish is a self contained unit. Dish units can be added as needed as electric demand grows. Dish units can also be designed to track the path of the sun and achieve optimal efficiency during the day (see Photo 7).
Photo 7 – Solar Parabolic Dish Sterling Test System

The technical and cost assumptions for a utility solar parabolic dish reference unit are
shown in Table 11. The financial assumptions for the parabolic dish system are reported
in Appendix 1. Based on these assumptions the Levelized Cost of Energy for the utility
parabolic dish unit is 19.6 cents per kWh.

Table 11 – Utility Solar Parabolic Dish Characteristics

System                                  2010
Capacity (MW)                                   15

Annual Energy Output (MWh)                  31,536

Capacity Factor (%)                         24.0%

System Life (years)                             30

System Degradation (%/yr)                      0.01

System Costs
Capital Investment ($ per MW)           $6,000,000

Annual O&M Cost ($ per MW)                 $15,000

O&M Escalation Rate

Economic Results
Real LCOE (cents/kWh)                         19.6

Solar Tower

A central solar tower system uses heliostats (mirrors) to focus sunlight on the tip of a
tower. The sunlight heats a heat transfer fluid and the heat is used to create steam to
power a generator and make electricity. The heliostats are programmed to track the sun
and increase performance efficiency. This technology is not currently in widespread
commercial use, but it will likely get a foothold in the market over time (see Photo 8).

                      Photo 8 – Solar Power Tower Test Facility

The technical and cost assumptions for a utility solar parabolic tower reference unit are
shown in Table 12. The financial assumptions for the parabolic tower system are reported
in Appendix 1. Based on these assumptions the Levelized Cost of Energy for the utility
parabolic tower unit is 12.6 cents per kWh.
Table 12 – Utility Solar Tower Characteristics System 2010 Capacity (MW) 100 Annual Energy Output (MWh) 315,360 Capacity Factor (%) 36% System Life (years) 30 System Degradation (%/yr) 0.01 Storage (hr.) 0 System Costs Capital Investment ($ per kW) 5,500,000 Annual O&M Cost ($ per kW) $70,000 O&M Escalation Rate Economic Results Real LCOE (cents/kWh) 12.6
SAM – Solar Advisor Model
The economic and financial results for each solar reference technology were calculated
using financial spreadsheets developed by Sandia National Laboratory and the National
Renewable Energy Laboratory (NREL) for use in the Solar Advisor Model (SAM
Version 2.0. This model is described in the Solar Advisor User Guide for Version 2.0.
The user guide and the SAM model are available at no cost on the NREL website. The
model and financial spreadsheets are available to the public.

The technical component of SAM models the energy production for each solar
technology. The energy production for a photovoltaic unit is based on the efficiency of
the PV module and the inverter. Similarly, the energy production for solar thermal units
is based on the efficiency of the solar equipment, heat transfer equipment and the
generator.

Energy production in a particular location is affected by the amount of solar radiation,
local weather patterns and climate factors. The climatic conditions in many U.S. cities are
contained in a library within the model that can be accessed through a dropdown menu.
The Arizona cities included in SAM are Phoenix, Tucson, Prescott and Flagstaff. Climate
factors for cities not contained in SAM can be uploaded into the model from other
sources.

The amount of annual electricity production is related to the size of the solar generating
unit by the capacity factor. The capacity factor is the ratio of the annual amount of energy
produced to the amount of energy that could potentially be produced if the solar plant
was run at full capacity every hour of the year (8760 hours X peak kW capacity). The
capacity factor for a solar generation unit is affected by the amount of solar radiation, the
number hours of sunlight and the efficiency of the solar unit. The higher the level of solar
radiation and unit efficiency, the higher the capacity factor for a solar generator.

SAM uses the technical characteristics of each solar technology, along with local climatic
conditions, to estimate annual, monthly, and hourly energy production profiles. SAM
contains a set of prepackaged standard solar configurations for residential and
commercial small scale solar photovoltaic systems, and larger utility scale photovoltaics,
concentrated photovoltaics and parabolic solar troughs.

SAM Financial Spreadsheets

SAM uses a set of financial spreadsheets to perform economic and financial analysis on
various solar energy production units. These spreadsheets were used in this study to
calculate the Levelized Cost of Energy (LCOE) for each of the solar reference units.

The SAM spreadsheets use financial inputs such as initial capital costs of the solar unit,
annual O&M costs, life of the equipment, inflation rate, annual energy production,
interest rates and terms on loans, depreciation schedules, tax rates, real and nominal
discount rates, etc.

Based on these financial and assumptions, the SAM financial spreadsheets calculate the
annual cash flow for the solar generation technologies. It also calculates summary
statistics for important economic measures. These measures include:

•   Capital costs
•   Levelized cost of energy (LCOE)
•   Internal rate of return (IRR)
•   Payback
•   Net present value (NPV)

The LCOE is a measure of cost per kWh necessary to pay for the amount of investment
in the solar unit plus the annual operating and maintenance cost. The LCOE is often used
as a basis to compare the cost of solar generation projects to that of conventional electric
generation projects. It is also used to assess the impact of federal, state and local
government subsidies, as well as subsidies offered by local utilities.

Economic and Financial Results

The economic and financial analysis was performed on each of the solar power reference
units discussed in a previous section of the report. The analysis was conducted using the
SAM financial spreadsheets.

There is climate information available for Phoenix, Tucson, Flagstaff, and Prescott.
However, the analysis in this study is done using a Phoenix location. Phoenix is chosen
on the basis of several criteria:
    1. Phoenix is the largest metropolitan area in Arizona
    2. Phoenix is the home of the two largest electric utilities in the State
    3. Climate and solar radiation in the other cities varies slightly from that in Phoenix,
        but not enough justify the additional time, effort and detail involved.

LCOE Results by Solar Technology

The levelized cost of energy (LCOE) for each of the solar referenece units is displayed in
Table 13. It shows the progressive effect on LCOE of adding additional incentives from
Federal and state governments and local utility sources.

 The first column of the Table shows the LCOE for each solar technology without any
subsidies. The LCOEs range from a low of 17.4 ¢/kWh for a solar tower to a high of 36.3
¢/kWh for a residential PV system. Without any subsidies, the cost of solar power would
be much higher than power from conventional generation sources.
Table 13 –The Effect of Subsidies on Levelized Cost of Energy (LCOE) by Solar
Technology*
Technology Without With 30% Plus AZ Plus APS
Incentives Federal State ITC Utility CBI
ITC (No (With Max)
Max)
Residential PV
LCOE (cents per kWh) 36.3 25.4 24.7 17.6
Payback Period (years) >30 >30 >30 23
Commercial PV
LCOE (cents per kWh) 23.9 16.6 16.3 14.2
Payback Period (years) >30 >30 >30 27.7
Utility Large Scale CPV
LCOE (cents per kWh) 26.6 19.8 19.1
Utility Solar Trough
LCOE (cents per kWh) 18.5 13.2 13.2
Utility Solar Dish
LCOE (cents per kWh) 28.3 19.6 19.6
Utility Solar Tower
LCOE (cents per kWh) 17.4 12.6 12.6
* The technical and cost assumptions for each solar technology are reported in Tables 6
to 12. The financial assumptions are reported in Appendix 1.
A federal investment tax credit (ITC) is available to individuals or organizations that
invest in solar power systems. The federal ITC offers a tax credit of 30% of the cost of
purchasing and installing a solar power system. This year, the federal government
removed the maximum credit levels required in previous years. This has had a significant
impact on the LCOE for solar power systems, particularly large power systems that
previously had their subsidy limited by the maximum constraint.
The second column of Table 13 shows the impact of the 30% federal ITC on the LCOE
of the different solar units. With no limit on the maximum ITC payment, the 30% federal
ITC results in a roughly 30% reduction in LCOEs for each of the solar technologies.
The third column of Table 13 shows the effect of adding the Arizona state ITC on LCOE.
The state ITC offers a 25% ITC to homeowners installing a solar PV unit on-site. The
amount of the ITC is limited to a maximum of $1,000. As a result of quickly hitting theYou can also read


