2018 Pollution Report to the Legislature - Pollution - Minnesota Pollution Control ...
←
→
Page content transcription
If your browser does not render page correctly, please read the page content below

Pollution

April 2018

2018 Pollution Report to the
Legislature
Legislative charge
Minn. Statutes § 116.011 Pollution Report
A goal of the Pollution Control Agency is to reduce the amount of pollution that is emitted in the state. By
April 1 of each even-numbered year, the Pollution Control Agency shall report the best estimate of the
agency of the total volume of water and air pollution that was emitted in the state in the previous two
calendar years for which data are available. The agency shall report its findings for both water and air
pollution:
(1) in gross amounts, including the percentage increase or decrease over the previously reported two
calendar years; and
(2) in a manner which will demonstrate the magnitude of the various sources of water and air pollution.
History:
1995 c 247 art 1 s 36; 2001 c 187 s 3; 2012 c 272 s 72
                                                               Estimated cost of              $11,228.00
Authors                                                        preparing this report (as
Patricia Engelking                                             required by Minn. Stat. §
Azra Kovacevic                                                 3.197)
                                                               Total staff time: 187 hrs.
Contributors/acknowledgements                                  Production/duplication         $110.00
                                                               Total                          $11,338.00
The report was prepared with assistance from
other staff in the MPCA’s Municipal, Industrial,             The MPCA is reducing printing and mailing costs
Operations, Watershed, and Environmental                     by using the Internet to distribute reports and
Analysis and Outcomes divisions. Special thanks              information to wider audience. Visit our
to Anne Claflin, Mark Ferrey, Theresa Gaffey,                website for more information.
Marco Graziani, Paul Hoff, Tanja Michels, Bruce
Monson, Barb Olafson, Kari Palmer, Rebecca                   MPCA reports are printed on 100% post-
Place, Casey Scott, and Summer Streets.                      consumer recycled content paper
                                                             manufactured without chlorine or chlorine
                                                             derivatives.

On the cover: Cars, trucks and other mobile sources continue to be a major source of air pollutant emissions,
including greenhouse gases, in urban areas across Minnesota. Deicing salt needed for safe traffic flow in Minnesota
winters is a cause of chloride-impaired streams, prompting advances in “smart salting” by state and local
government snowplow drivers.

Minnesota Pollution Control Agency
520 Lafayette Road North | Saint Paul, MN 55155-4194 |
651-296-6300 | 800-657-3864 | Or use your preferred relay service. | Info.pca@state.mn.us
This report is available in alternative formats upon request, and online at www.pca.state.mn.us.
Document number: lrp-ear-2sy18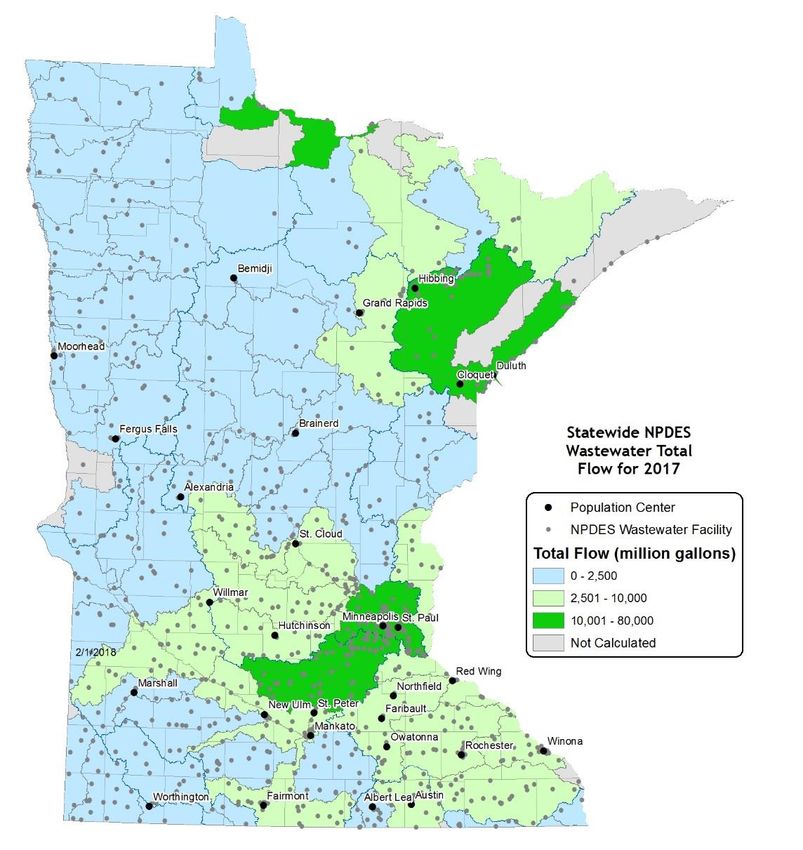
Contents
Executive summary ............................................................................................................................................................ 1
    Air emissions ................................................................................................................................................................... 1
    Water discharges............................................................................................................................................................ 4
Air pollutant emissions overview .................................................................................................................................... 7
    Criteria air pollutant emissions .................................................................................................................................... 8
    Air toxics ........................................................................................................................................................................11
    Greenhouse gases ........................................................................................................................................................12
    Mercury..........................................................................................................................................................................13
Water pollutant discharges overview...........................................................................................................................17
    Wastewater discharges ...............................................................................................................................................17
    Nonpoint source pollution ..........................................................................................................................................35
    Contaminants of emerging concern ..........................................................................................................................38

                                                                                            i
Executive summary
Every two years, the Minnesota Pollution Control Agency (MPCA) uses the most recent data available to
estimate the total amounts of pollution emitted into our air and discharged to our water resources. The
MPCA also estimates the percentage increase or decrease over the previous two calendar years, and the
relative contributions of the various sources of pollution.
This report also includes information on emissions of toxic air pollutants, greenhouse gas emissions,
nonpoint source water pollutants, and emerging contaminants of concern. While it is still not possible to
quantify the amounts of all of these pollutants released in the environment, the agency is working to
understand the effects of these pollutants on human health and the environment and to develop
strategies to reduce their presence in Minnesota’s air and water.

Air emissions
In this report, the MPCA details statewide emissions of pollutants to Minnesota’s air, including criteria
air pollutants (pollutants with national ambient air quality standards), greenhouse gases, and other air
toxics.
Emissions from larger facilities are available every year; however, emissions from other sources are only
available every three years. It is important to note that the 2014 data presented in this report are draft
and once finalized emissions become available they may differ significantly from current estimates.
Initial estimates are recalculated based on federal economic data and other factors influencing emission
sources.
Figure 1 provides estimated total statewide emissions of four major criteria air pollutants from 2002 to
2016. During this time, estimated emissions of these pollutants have been reduced by almost 50%.
While this report is focused on statewide total emissions, MPCA understands that some air pollutants
are emitted disproportionately in areas of concern.

2018 Pollution Report to the Legisla ture • April 2018                          Minnesota Pollution Control Agency

                                                         1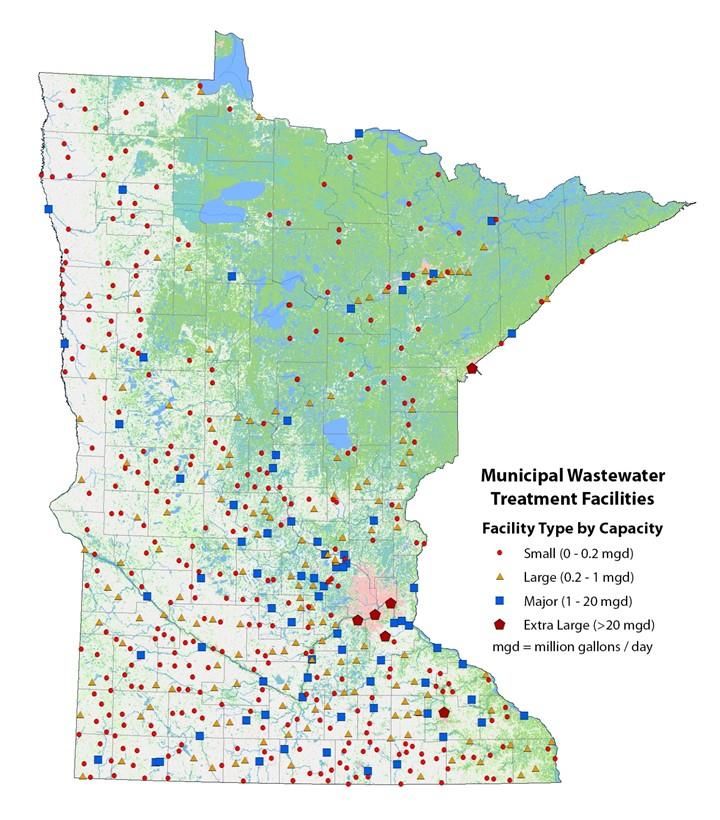
Figure 1. Minnesota statewide emissions trends

                            1,200,000

                            1,100,000
                                                                           Aggregate emissions NOX, SO2 , VOC, PM 2.5
                            1,000,000
         Emissions (Tons)

                             900,000

                             800,000

                             700,000

                             600,000

                             500,000
                                        2002 2003 2004 2005 2006 2007 2008 2009 2010 2011 2012 2013 2014 2015 2016
                                                             Year
Emissions in 2002, 2005, 2008, 2011 and 2014 are from all sources, including mobile, non-permitted and permitted
sources. Subsequent yearly emissions changes are due entirely to permitted sources. Mobile and non-permitted
estimates were held constant for in-between years. Prior to 2012, PM2.5 emissions were calculated every three
years. In 2012, MPCA started calculating emissions annually for all permitted sources. It is therefore important not
to place undue emphasis on yearly changes. Fire and biogenic emissions are not included in the totals because they
vary greatly from year to year.

Since 2002, overall emissions have been decreasing. This is generally due to improvements in pollution
control technology, governmental regulations, and changes to estimation methodologies. Most criteria
pollutant emission estimates from permitted sources decreased between 2014 and 2016. Changes at
utilities and mining companies resulted in major decreases in sulfur dioxide and nitrogen oxide
emissions. Mining production was down in 2016 compared to both 2014 and 2015, resulting in lower
emissions. In 2015, Xcel Energy – Black Dog Plant switched from burning coal to natural gas, and Xcel
Energy – Sherburne Generating Plant installed new control equipment, which decreased emissions
significantly. Minnesota Power – Bowell Energy Center also burned less coal than in 2014.
In 2016, all facility criteria emissions continued to decrease except for ammonia. Ammonia emissions
increased slightly from 2015. This increase in likely due to the inclusion of new and updated emission
factors for combustion processes. Statewide draft emission estimates for 2014 across all sources have
decreased in comparison to 2011. The states and the U.S. Environmental Protection Agency (EPA) have
taken steps to increase transparency and collaboration among the different state and federal
organizations. As a result, for the 2014 emission inventory, a number of methodological improvements
were implemented for many categories including solvent use and industrial/commercial/institutional
combustion.
In 2014, most air pollution came from smaller, widespread sources, including vehicles, small businesses
and construction equipment. Figure 2 shows a breakdown of draft 2014 statewide emissions.

2018 Pollution Report to the Legisla ture • April 2018                                            Minnesota Pollution Control Agency

                                                                       2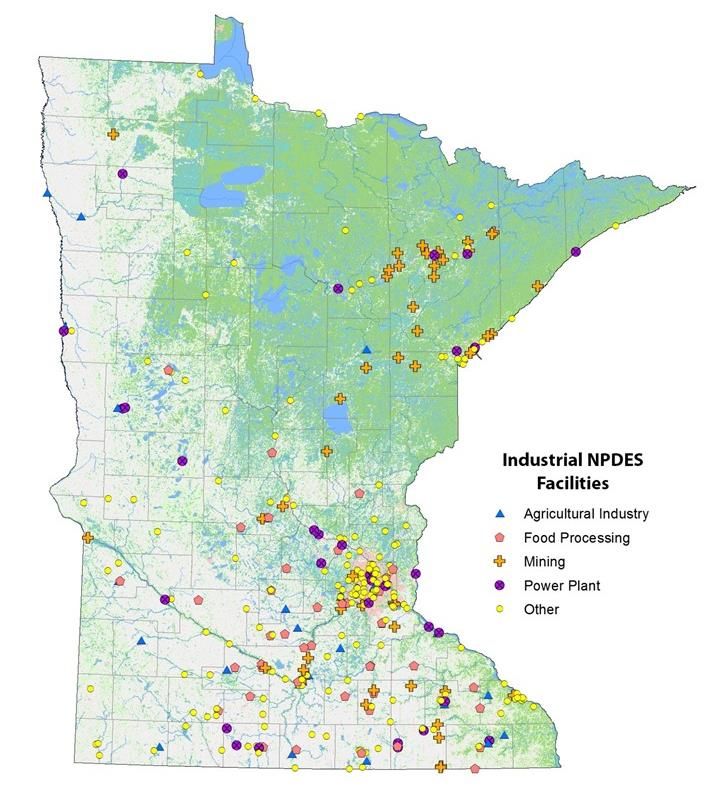
Figure 2. Sources of criteria air pollutant emissions in Minnesota, 2014

A third of Minnesota emissions come from non-permitted sources, such as auto-body shops, gas
stations, and home heating and air conditioning systems. Individually, these are small sources, but when
combined, contribute significantly to overall emissions. On-road vehicles, such as cars and trucks, make
up about 23% of emissions in Minnesota. Off-road vehicles and agricultural and construction equipment
contribute 22% of total emissions in Minnesota. Emissions from permitted sources, typically power
plants and large industrial factories, make up about a quarter of total statewide emissions.
Lead, mercury and other air toxics are pollutants that can be toxic at very low concentrations. In 2014,
an estimated 17 tons of lead and more than 2000 (draft number) pounds of mercury were emitted in
Minnesota. These pollutants have also trended downward, with about 12% statewide decrease in air
emissions of lead from 2011 to 2014 with a 16% decrease in mercury during the same period.
In Minnesota, the MPCA estimates greenhouse gases (GHGs) for electric generation, transportation,
agriculture, industrial, residential, commercial, and waste sectors. The most recently completed
emission inventory for GHGs was in 2014. Since 2005, Minnesota’s total greenhouse gas emissions have
declined by about 4% and are currently not on track to meet the goals of the Next Generation Energy
Act. Air toxics are estimated every three years, with latest draft estimates available from 2014.
Statewide emissions have decreased for all source types compared to 2011 emissions.
There may be differences in the total emission figures for a given year discussed in this report versus
past MPCA emission reports because data may be updated in MPCA’s emission inventory due to
corrections or changes in methodology. Detailed and updated air emissions data can be found at
https://www.pca.state.mn.us/2018-pollution-report.

2018 Pollution Report to the Legisla ture • April 2018                          Minnesota Pollution Control Agency

                                                         3
Future emissions of pollution to Minnesota’s air may be influenced by a number of factors, including:
Emissions from electric utilities should continue to decrease due to increases in renewable
energy sources such as wind and solar, increased energy efficiency, power plant modernization
that includes retirement of less efficient, older coal plants, and increased use of natural gas.
Emissions from taconite facilities are expected to decrease due to future installation of NO x
controls under federal rules and improved measurement methods.
Continued decreases in on-road mobile emissions due to more stringent federal vehicle tailpipe
standards as fleets turn over both in light duty and heavy-duty vehicles.
Water discharges
In this report, the MPCA provides estimates of surface water discharges from point sources of pollution
—primarily municipal and industrial wastewater treatment facilities. The report also describes agency
efforts to reduce nonpoint sources of pollution and progress in watershed monitoring and assessment. A
final section highlights ongoing efforts in the state to monitor and address contaminants of emerging
concern.
Overall pollutant loads to receiving waters are based on a combination of effluent flow and pollutant
concentrations in the effluent. Loads are calculated by combining facility-reported flow and
concentration data. If facility-specific data are not available, loads are estimated with information based
on facilities with similar waste streams or other best professional judgment. Pollutant loads calculated
from measured wastewater flows and observed concentrations are considered to be highly reliable
while less confidence is warranted for pollutant loads derived from estimated concentrations.
The chart below shows pollutant effluent flow and loading trends for four measures of wastewater
pollution from 2000-2017. The four pollutants are total suspended solids (TSS), carbonaceous
biochemical oxygen demand (CBOD 5 ), total phosphorus, and total nitrogen. Effluent flow is reported in
billion gallons per year. Pollutant loads for TSS, CBOD 5 , total phosphorus, and total nitrogen are
reported in metric tons per year.
2018 Pollution Report to the Legisla ture • April 2018 Minnesota Pollution Control Agency
4
Figure 3. Pollutant loading trends from Minnesota wastewater facilities, 2000-2017
Overall, effluent flows tend to fluctuate based on precipitation. The overall health of the economy also
affects the amount of industrial production, which in turn affects industrial effluent flows and the
amount of industrial effluent treated at municipal wastewater treatment facilities. Regulatory policies
implemented over the past 15 years have promoted reduction of total phosphorus discharged by
wastewater treatment facilities, which has led to significant improvements in water quality. Total
phosphorus is the primary pollutant associated with increased algae growth in Minnesota’s lakes and
streams.
With the exception of total nitrogen levels, which have increased in wastewater discharges, facilities
have also decreased:
Total suspended solids, which are sediment and other particles that cloud the water.
Carbonaceous biochemical oxygen demand, which is a measurement of how pollutants can
deplete oxygen needed by fish and other aquatic life.
Facilities throughout Minnesota have made significant investments in technology, equipment and
training that have led to these improvements.
Wastewater treatment facilities have also significantly reduced direct discharges of mercury to
Minnesota’s waters. Mercury is a toxic element that accumulates in fish tissue. Mercury reduction in
wastewater is a result of successful source reduction programs and installation of treatment
technologies for mercury removal, where necessary. On average, the data show a 42% reduction in
mercury loads from a 3.86 kilogram per year baseline in 2005/2006. Direct discharges of mercury in
wastewater are very small compared to atmospheric sources of pollution.
Minnesota has made significant progress in cleaning up point sources of water pollution but it is the
nonpoint sources of pollution from rainfall or snowmelt moving over or through the ground carrying
natural or human-made pollutants into lakes, streams or wetlands that now pose the greater challenge
for prevention and cleanup. Many of the stresses from nonpoint sources of pollution that affect
Minnesota’s surface and groundwater resources are the result of choices that people make every day
such as lawn care practices, farming practices, watercraft operation and waste disposal. The daily
decisions that homeowners, developers, farmers and businesses make regarding land uses are crucial to
protecting water resources from the effects of nonpoint source pollution.
2018 Pollution Report to the Legisla ture • April 2018 Minnesota Pollution Control Agency
5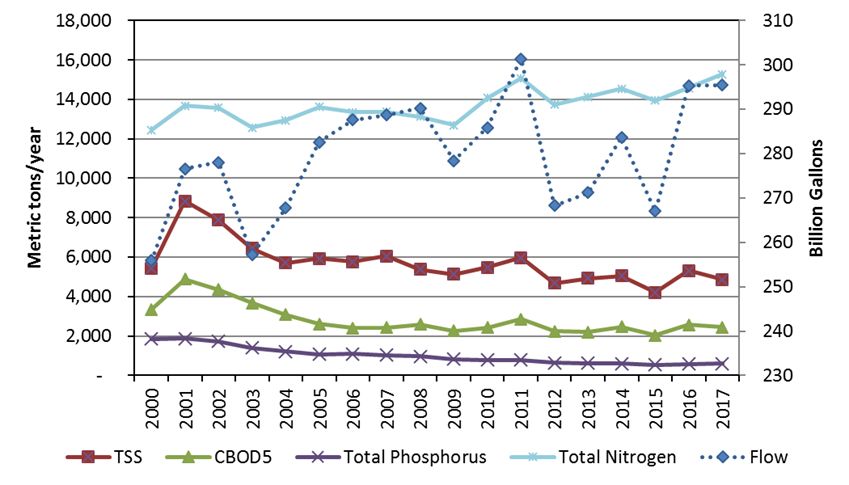
Point sources have the greatest potential to impact the environment during periods of low precipitation
and stream flow. Nonpoint sources include runoff from agricultural fields, feedlots, urban areas, and on-
site sewage treatment (septic) systems. Nonpoint sources are most significant during periods of high
precipitation and medium to high stream flow. Further improvements are needed in both point sources
and nonpoint sources of pollution in order to achieve goals set in federal and state law for protecting
human health and the environment.
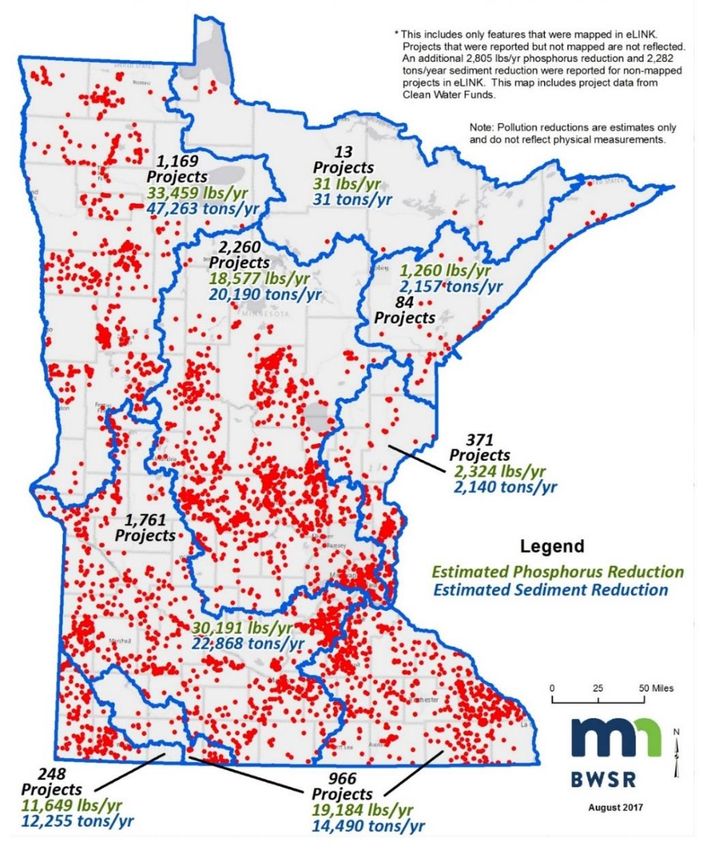
Although there is no completely reliable way to quantify volumes of water pollutants released by
nonpoint sources, the Board of Water and Soil Resources (BWSR) tracks Clean Water Fund projects and
estimates pollutant reductions associated with them. From 2000 to 2017, more than 6,872 best
management conservation practices have been installed, resulting in a reduction of about 116,675
pounds of phosphorus and 121,394 tons of sediment across the state.
Future discharges of point source and nonpoint sources of pollution to Minnesota’s waters will be
influenced by a number of factors, including:
Wastewater treatment infrastructure — Minnesota’s wastewater systems are aging. Significant
investments will be needed to replace failing infrastructure and upgrade treatment facilities to
meet higher standards and expand systems to accommodate growth. Both rural and metro
facilities face serious challenges to make these improvements to their infrastructure.
Nutrient Reduction Strategy — Multiple state and federal agencies developed the Minnesota
Nutrient Reduction Strategy in 2014 to address excess levels of nutrients — primarily
phosphorus and nitrogen — in Minnesota’s waters. Reduction goals for phosphorus and
nitrogen outlined in the strategy are designed to protect both Minnesota waters and
downstream waters, including both Lake Winnipeg and the Gulf of Mexico. Nitrate loads leaving
Minnesota via the Mississippi River contribute to the oxygen-depleted “dead zone” in the Gulf
of Mexico. A 2013 study, Nitrogen in Minnesota Surface Waters, indicated that more than 70%
of nitrate is coming from cropland, with the rest coming from sources such as wastewater
treatment plants, septic and urban runoff, forests and the atmosphere.
River eutrophication standards — First adopted in 2014, these standards are designed to
protect aquatic life from the negative impacts of excess algae in rivers and streams. More
restrictive limits associated with these standards have the potential to further reduce pollutants
from wastewater facilities.
Clean Water Fund investment — Clean Water Fund dollars resulting from passage of the Clean
Water, Land and Legacy Amendment will continue to accelerate the implementation of practices
to improve and protect Minnesota’s water resources. However, Clean Water Funds available for
implementation are not keeping pace with the demand from local governments and
landowners.
2018 Pollution Report to the Legisla ture • April 2018 Minnesota Pollution Control Agency
6
Air pollutant emissions overview
Thousands of chemicals are emitted into the air. Many of these are air pollutants that can directly or
indirectly affect human health, reduce visibility, cause property damage and harm the environment. For
these reasons, the MPCA attempts to reduce the amount of pollutants released into the air. In order to
understand the sources of air pollution and to track the success of reduction strategies, the MPCA
estimates the emissions of certain air pollutants released in Minnesota.
The Minnesota Emission Inventory estimates emissions from permitted facilities every year in order to
fulfill Minnesota rules. In addition, federal rules require the MPCA to estimate emissions every three
years from three other principal source categories: non-permitted sources, mobile sources, and fire
sources. Biogenic sources include emissions from natural sources such as soils and vegetation. This
report only includes manmade sources. Overall, the Minnesota Emission Inventory includes emissions
from four principal source categories.
1. Permitted sources: Typically large, stationary sources with relatively high emissions, such as electric
   power plants and refineries. A "major" source emits a threshold amount (or more) of at least one
   criteria pollutant, and must be inventoried and reported.
2. Non-permitted sources: Typically stationary sources, but generally smaller sources of emissions than
   point sources. Examples include dry cleaners, gasoline service stations and residential wood
   combustion. These sources do not individually produce sufficient emissions to qualify as point
   sources. For example, a single gas station typically will not qualify as a point source, but collectively
   the emissions from many gas stations may be significant.
3. Mobile sources: Mobile sources are broken up into two categories: on-road vehicles and off-road
   sources. On-road vehicles include vehicles operated on highways, streets and roads. Off-road
   sources include off-road vehicles and portable equipment powered by internal combustion engines.
   Lawn and garden equipment, construction equipment, aircraft and locomotives are examples of off-
   road sources.
4. Fires: Fire emissions are produced by inadvertent or intentional agricultural burning, prescribed
   burning or forest wild fires.
Criteria pollutants—The 1970 Clean Air Act identified six major air pollutants that were present in high
concentrations throughout the United States known as “criteria pollutants.” These air pollutants are
particulate matter (PM2.5 and PM10 ), sulfur dioxide (SO2 ), nitrogen oxides (NOx), ozone (O3 ), carbon
monoxide (CO) and lead (Pb). The Minnesota Criteria Pollutant Emission Inventory estimates emissions
of five criteria pollutants (PM10 , SO2 , NOx, CO and Pb) as well as a group of ozone precursors called
volatile organic compounds (VOCs). Emissions estimates for large facilities are available for 2016. Draft
2014 emissions are available for non-permitted, mobile and fire sources.
PM2.5 and ammonia (which is tracked because it contributes to PM 2.5 formation) yearly emission
calculations for permitted facilities started in 2012, while non-permitted, mobile, and fire are still
calculated on a three-year cycle, with latest draft estimates available for 2014. Fire emissions depend on
many factors including type of fire, ecosystem conditions, and weather. As a result, fire emissions vary
greatly from year to year. Similarly, biogenic emissions are widespread and contribute to background air
pollution concentrations. They are impacted by vegetation, temperature and solar radiation. Biogenic
emission estimates are not included in this report.
Greenhouse gases—Increases in ambient levels of greenhouse gases can lead to global climate change.
The MPCA tracks and reports emissions for six greenhouse gases (carbon dioxide (CO 2 ), nitrous oxide,
methane, hydrofluorocarbons, perfluorocarbons and sulfur hexafluoride) in terms of CO2 equivalents

2018 Pollution Report to the Legisla ture • April 2018                           Minnesota Pollution Control Agency

                                                         7
(CO2 e). CO2 e compares the warming potential of different gases to the impact of CO 2 . Emission
estimates for 2014 are included in this report. Federal and state rules require MPCA to estimate GHG
emissions from permitted sources each year. Starting in 2011, small permitted sources started reporting
GHG emissions. In 2012, all permitted point sources began submitting GHG emissions to the MPCA.
—Many other air pollutants are released in smaller amounts than most of the criteria
pollutants, but may still be toxic. The EPA refers to chemicals that can cause serious health and
environmental hazards as hazardous air pollutants or air toxics. Air toxics include chemicals such as
benzene, formaldehyde, acrolein, mercury and polycyclic aromatic hydrocarbons (PAHs). Air toxic
emissions from all sources are estimated every three years. Minnesota data comes from the draft 2014
Minnesota Air Toxics Emission Inventory.
With each new inventory, improvements are made in terms of pollutants covered, source categories
included, and the accuracy of emission estimates. Therefore, changes in the way emissions are
calculated may affect trends, even if there was no real increase or decrease in emissions.
The reader may note differences in the total emission figures for a given year discussed in this report,
versus previous emission reports the MPCA has published, because data may be updated in past
emission inventories due to corrections or changes in methodology.
This report shares summarized statewide emissions of air pollutants. A detailed breakdown of finalized
2014 air emissions will be available online on the MPCA website in the spring of 2018. MPCA has
developed multiple workbooks containing permitted source, statewide and county-level emissions. The
applications contain permitted source data going back to 2006 and statewide data starting in 2008. The
workbooks are a way for MPCA to share data in an automated, interactive and user-friendly format.
For more information, see the following websites:
https://www.pca.state.mn.us/air/air-emissions
https://www.pca.state.mn.us/air/statewide-and-county-air-emissions
https://www.pca.state.mn.us/air/point-source-air-emissions-data
Criteria air pollutant emissions
Minnesota’s Emission Inventory Rule requires all facilities in Minnesota that have an air emissions
permit to submit an annual emission inventory report to the MPCA. The report quantifies emissions of
the following regulated pollutants:
Particulate matter less than 10 microns in diameter (PM10 ) is a broad class of chemically and
physically diverse substances that exist as discrete particles (liquid droplets or solids) over a
wide range of sizes. EPA currently has National Ambient Air Quality Standards for particulate
matter in two size classes, PM2.5 and PM10 . PM2.5 and PM10 are associated with numerous
adverse health effects. Fine particles are the major cause of reduced visibility in parts of the
United States. In addition, when particles containing nitrogen and sulfur deposit onto land or
waters, they may affect nutrient balances and acidity. Finally, different types of particulate
matter, for example black carbon (soot) and sulfate particles, play a role in climate change.
Sulfur dioxide (SO2 ) belongs to the family of sulfur oxide gases and forms when fuel-containing
sulfur (mainly coal and oil) is burned and during gasoline production and metal smelting. Short-
term exposures to SO2 is linked with adverse respiratory effects. SO2 also reacts with other
chemicals in the air to form tiny sulfate particles and acids that fall to earth as rain, fog, snow, or
2018 Pollution Report to the Legisla ture • April 2018 Minnesota Pollution Control Agency
8dry particles. Acid rain damages the environment, accelerates the decay of buildings and
monuments and is a major component of haze.
Nitrogen oxides (NOx) are made up of two primary constituents: nitric oxide (NO) and nitrogen
dioxide (NO2 ). NO is a colorless, odorless gas that is readily oxidized in the atmosphere to NO 2 .
NO2 exists as a brown gas that gives photochemical smog its reddish-brown color. NOx forms
when fuel is burned at high temperatures. NO2 exposure is linked with adverse respiratory
effects. It is also a major precursor both to ozone and to fine particulate matter (PM 2.5 ).
Deposition of nitrogen can lead to many environmental problems including fertilization,
acidification of terrestrial, wetland and aquatic systems, increased visibility impairments and
others. Nitrous oxide (N2 O), another component of NOx, is a greenhouse gas.
Volatile organic compounds (VOCs) are compounds containing the elements carbon and
hydrogen that exist in the atmosphere primarily as gases because of their low vapor pressure.
VOCs are defined in federal rules as chemicals that participate in forming ozone. Many VOCs are
also air toxics and can have harmful effects on human health and the environment.
Carbon monoxide (CO) is a colorless and odorless toxic gas formed when carbon in fuels is not
burned completely. A major source of CO is motor vehicle exhaust. Exposure to elevated CO
levels is associated with impaired visual perception and work capacity among others, and can
lead to death. At concentrations commonly found in the ambient air, CO does not appear to
have adverse effects on plants, wildlife or materials. However, CO is oxidized to form carbon
dioxide (CO2 ), a major greenhouse gas and it contributes to the formation of ground-level ozone.
Lead (Pb) is a naturally occurring element. Major sources of lead emissions were motor vehicles
and industrial sources. Since lead in gasoline was phased out, air emissions and ambient air
concentrations have decreased dramatically. Currently, metals processing (lead and other
metals smelters) and aircraft using leaded fuel are the primary sources of lead emissions. There
are no known safe levels of lead in the body. Chronic exposure or exposure to higher levels can
result in multiple effects, including damage of the kidneys and nervous system in both children
and adults. Elevated lead levels are also detrimental to animals and to the environment.
The Minnesota Criteria Pollutant Emission Inventory is complete for permitted sources through 2016.
The figure below shows emission trends for permitted sources since 2005. These emissions have
decreased significantly over the past decade largely due to governmental regulations and industry
efforts to reduce emissions. As mentioned elsewhere in this report, emissions of nitrogen oxides and
sulfur dioxide have decreased significantly in the past decade due to facilities switching from coal to
natural gas and installing new pollution controls on their units. Mining production has also decreased
over the last few years, further reducing emissions.
Figure 4. Minnesota permitted source emissions 2005-2016
There has been a reduction in all criteria pollutant emissions from 2008 to 2014 (the most recent years
we have emission estimates from all sources). Figure 5 shows the statewide total in emissions from
nitrogen oxide, sulfur dioxide, volatile organic compounds and particulate matter. Emissions from all
source types (mobile, non-permitted and permitted sources) have decreased by about a third since
2008.
2018 Pollution Report to the Legisla ture • April 2018 Minnesota Pollution Control Agency
9Figure 5. Criteria air pollutant statewide emission trends
1,000,000
800,000
Emissions (Tons)
600,000
400,000
200,000
0
2008 2011 2014 (draft)
Year
Non-permitted sources Off-road vehicles and equipment
On-road vehicles Permitted sources
Table 1 shows statewide emissions for major criteria air pollutants and percent changes from 2014 to
2016. Despite the importance of secondary formation in creating particulate matter and some other
pollutants, it is important to note that estimated air emissions data in this report are only based on
direct releases from sources into the atmosphere. Emissions decreased for all pollutants from 2014 to
2016.
Table 1. Minnesota Air Pollution Emission Estimates 2014 to 2016 (tons)
2014-2016 %
Pollutant 2014 2015 2016 change*
Particulate matter (PM10)** 1,092,636 1,088,264 1,087,039 -0.5
Sulfur dioxide (SO2) 46,374 34,351 30,652 -34
Nitrogen oxides (NOx) 256,815 241,113 237,792 -7
Volatile organic compounds
(VOCs) 224,296 224,175 223,755 -0.2
Particulate matter (PM2.5)** 125,440 121,316 120,963 -4
Lead (Pb) 17 17 15 -7
Total Criteria Pollutants 3,060,840 3,023,578 3,014,359 -1.5
* Draft 2014 mobile and nonpoint emissions estimated were used in the 2014 to 2016 emissions
estimates. The only changes are from point sources.
** PM10 and PM2.5 emissions represent only direct emissions; secondary formation is not included.
2018 Pollution Report to the Legisla ture • April 2018 Minnesota Pollution Control Agency
10Air toxics
The EPA defines air toxics as pollutants that cause or may cause cancer or other serious health effects,
such as reproductive effects or birth defects, or adverse environmental and ecological effects.
The Minnesota Air Toxics Emission Inventory estimates emissions of air toxics from all sources every
three years. The majority of pollutants with MPCA emission estimates are part of EPA’s hazardous air
pollutant group. The most recent completed inventory for Minnesota is 2011; however, 2014 draft data
are available and will be the focus of this report. The inventory includes four principal source categories:
permitted, non-permitted, mobile and fire sources.
MPCA staff compiled the emissions estimates for permitted and the majority of non-permitted sources
in the 2014 inventory. Emissions for wildfires and prescribed burning were obtained from EPA. The
results for aircraft (including ground support equipment), locomotives and commercial marine vessels
were also estimated by EPA. For all off-road equipment and on-road vehicles, MPCA used estimates
from EPA’s national inventory.
The following chart summarizes 2014 draft statewide emissions from directly emitted air toxics
pollutants. It does not include secondarily formed pollutants. Once finalized 2014 data is available, the
breakdown of air toxics categories may change. Non-permitted sources include very small stationary
sources such as auto body shops and dry cleaners. These account for 19% of emissions. Mobile sources,
including both on-road vehicles such as cars and trucks and off-road equipment such as recreational
vehicles and agriculture equipment, account for over 60% of total emissions. Large permitted facilities
contributed 5% and fires accounted for 13% of the total. Biogenic emissions are not included in the
breakdown because they depend on many environmental factors such as weather, background and
ecosystem conditions that are largely uncontrolled by human activity.
Figure 6. Sources of air toxics emissions in Minnesota, 2014
For more details about 2014 air toxics emissions, please visit the online application. This application will
be updated with 2014 data once finalized emissions become available. MPCA developed multiple
workbooks containing permitted sources, statewide and county level emissions. End users have hands-
on access to emissions data, which they can view and use in an interactive format. Web applications
contain statewide data going back to 2008.
2018 Pollution Report to the Legisla ture • April 2018 Minnesota Pollution Control Agency
11Greenhouse gases
Greenhouse gases (GHGs) warm the atmosphere and surface of the planet, leading to alterations in the
earth’s climate. Many greenhouse gases occur naturally, but burning fossil fuels and other human
activities are adding these gases to the natural mix at an accelerated rate. In 2014, Minnesota’s GHG
emissions were estimated to be 158.3 million CO2 e tons. CO2 e compares the global warming potential of
emissions of different gases to the impact of the emission of one ton of CO2 . Most of Minnesota’s GHG
emissions are the result of using fossil fuel energy for electricity generation, transportation, heating, and
other uses. Figure 7 shows GHG emissions by economic sector. The largest source of emissions is from
the generation of electricity. GHG emissions from electricity generation include emissions from
electricity generated in other states to meet Minnesota’s net electricity demand. Over half of the GHG
emissions from the transportation sector are from passenger and light-duty vehicles. Other significant
sources include heavy-duty trucks, aviation, and natural gas transmission in pipelines.
Figure 7. 2014 sector GHG emissions, storage sources, and sector percent of total
Trends in Minnesota’s greenhouse gas emissions
Trends in emissions over time let us see the effects of policies and other factors that might change
emissions. Since 2005, Minnesota’s total greenhouse gas emissions have declined by about 4%. Each
economic sector shows a unique trend in emissions.
The Next Generation Energy Act of 2007 (Minn. Stat. § 216H.02) established a 2015 GHG emission
reduction goal 15% below 2005 emissions, and longer-term goals for 2025 (30% below 2005 emissions),
and 2050 (80% below 2005 emissions).
2018 Pollution Report to the Legisla ture • April 2018 Minnesota Pollution Control Agency
12Figure 8. Minnesota’s GHG emissions 1990-2014 and goals
References/web links
For more information on climate change in Minnesota, greenhouse gas emissions, and initiatives to
reduce emissions and adapt to a changing climate, see the following website:
https://www.pca.state.mn.us/air/climate-change-minnesota
Mercury
Exposure to mercury can harm the nervous system, posing the greatest risk to a developing fetus and
fish-eating wildlife. For most Minnesotans, eating fish contaminated with unhealthy levels of mercury
poses the greatest risk of exposure. While fish are a desired source of protein and other nutrients,
citizens are advised to limit their consumption of larger predatory fish. Consult the Minnesota
Department of Health (MDH) Fish Consumption Advisory for guidelines to specific lakes and rivers at
http://www.health.state.mn.us/divs/eh/fish/eating/sitespecific.html.
Mercury emissions are transported through the atmosphere and deposited by rain into Minnesota’s
lakes and rivers. Of the waters tested in the state, roughly two-thirds are impaired for mercury. To
achieve necessary reductions of mercury in fish, the MPCA developed a statewide mercury Total
Maximum Daily Load (TMDL) study. The TMDL establishes a goal of 93% reduction in mercury from all
human sources including emissions originating from outside of Minnesota. The MPCA is working to meet
the 93% reduction in the state by following the mercury TMDL implementation plan, developed by
stakeholders in 2009. In order to evaluate the progress of reducing mercury in our waters, mercury
emissions inventories are developed and tracked, and the subsequent response in fish tissue is
documented.
All lakes and rivers within Minnesota will benefit from the reduced mercury emissions from
accomplishing the goals of the statewide TMDL implementation plan. The TMDL demonstrated that
mercury deposition was essentially uniform throughout the state and that deposition represented 99%
of the mercury source to lakes and rivers in the state. Despite the uniform deposition of mercury, about
2018 Pollution Report to the Legisla ture • April 2018 Minnesota Pollution Control Agency
1310% of Minnesota surface waters may not meet the water quality standard after the mercury emissions
goal is achieved, because these waters are more efficient at concentrating mercury into fish. Scientists
understand some of the factors that cause this enhanced mercury accumulation, but not well enough to
know the relative importance of each factor and what actions could reduce the enhanced mercury
accumulation. MPCA’s scientific research into the unusually high mercury concentrations in fish in some
Minnesota rivers was funded by the Legislative-Citizen Commission on Minnesota Resources (LCCMR) in
2014 and continued through June 2017 (https://www.lccmr.leg.mn/projects/2014-index.html#201403j)
MPCA staff and collaborating academic scientists are continuing to analyze the large acquired dataset.
MPCA will pursue additional funding from other sources for the remainder of the research.
Sector activities and reductions
A number of efforts are in place to reduce mercury emissions. The state’s power utilities achieved
reductions ahead of schedule achieving the goals of the Minnesota Mercury Emissions Reduction Act of
2006 and the mercury TMDL. The 2016 emissions are draft and currently being analyzed, and therefore
not included in this report. It is estimated that electric utilities emitted an approximate 173 pounds of
mercury in 2016 and are estimated to represent the smallest of the three source categories. This is a
remarkable decrease from 1,867pounds emitted in 2005.
The taconite mining sector continues its research to test possible mercury-reduction technologies and is
required to submit reduction plans to the MPCA in December 2018. The plans will describe how the
goals of the TMDL will be met by year 2025.
The MPCA continues to work to improve the confidence interval of the mercury emissions inventory
through partnerships and research. Research to improve emissions estimates with crematories is
complete and a new emission factor developed. Additional work has been identified with industries such
as waste haulers, appliance recyclers and other metal smelters.
2018 Pollution Report to the Legisla ture • April 2018 Minnesota Pollution Control Agency
14Figure 9. Mercury emission from Minnesota sources: 2005 through 2014
3,312
2,843
2,705
2,279
1,564
1,274
Mercury concentration in Minnesota fish
The trend in fish-mercury concentrations reported in previous versions of this report focused on 1982 to
the present. However, a re-examination of the data showed fish collection prior to 1990 was focused on
lakes in northern Minnesota, a region where mercury concentrations are generally higher than the state
average and that a long-term trend analysis could be biased if the pre-1990 samples were included. As a
result, MPCA scientists are now using walleye and northern pike collected since 1990 to examine the
change in mercury concentrations in lakes over time.
What progress has been made? The 27-year fish-mercury trend from 1990 to 2016 shown in Figure 10
indicates a different pattern than has been reported in previous years. Data from lakes sampled starting
with 1990 as the baseline year show an upward trend in average mercury concentration. The increase,
0.37% per year on average, is significant. Minnesota’s water standard for mercury in edible fish tissue –
200 parts per billion (ppb) – is shown for reference on the figure, because it is the threshold above
which lakes and streams are impaired. The standard protects humans for consumption of one meal per
week of fish caught in Minnesota. MPCA scientists plan to update the fish mercury trend analysis after
an additional five years of data are available. More explanation of the mercury trends in fish is available
in the 2018 Clean Water Fund Performance Report http://www.legacy.leg.mn.
2018 Pollution Report to the Legisla ture • April 2018 Minnesota Pollution Control Agency
15Figure 10. Trend of mercury in northern pike and walleye from Minnesota lakes: 1990-2016
References/web links
For more information on mercury, see the following websites:
MPCA’s mercury emission inventory: https://www.pca.state.mn.us/sites/default/files/wq-iw4-02g5.pdf
MPCA’s mercury webpages: https://www.pca.state.mn.us/quick-links/mercury
UN Environment, Global Mercury Partnership: http://web.unep.org/chemicalsandwaste/global-
mercury-partnership
2018 Pollution Report to the Legisla ture • April 2018 Minnesota Pollution Control Agency
16Water pollutant discharges overview
Minnesota’s rivers, streams and lakes provide great natural beauty, and supply the water necessary for
recreation, industry, households, agriculture and aquatic life. The major goal of the MPCA’s water
quality program is to enable Minnesotans to protect and improve the state’s rivers, lakes, wetlands and
groundwater so that they support healthy aquatic communities and designated public uses such as
fishing, swimming and drinking water. The key strategies for accomplishing this goal include regulating
point source discharges, controlling nonpoint sources of pollution, and assessing water quality to
provide data and information to make sound environmental management decisions.
Point sources consist mainly of municipal and industrial wastewater discharges. Point sources have the
greatest potential to impact the environment during periods of low precipitation and low stream flow.
Nonpoint sources include runoff from agricultural fields, feedlots, urban areas, and on-site sewage
treatment (septic) systems. Nonpoint sources are most significant during periods of high precipitation
and medium to high stream flow.
Minnesota has been largely successful in controlling end-of-pipe discharges to our state’s waters from
wastewater treatment plants and industries. However, at the same time, the challenges posed by
nonpoint sources of pollution are increasing as land use changes and population expands. The federal
Clean Water Act requires states to adopt water quality standards to protect the nation’s waters. These
standards define how much of a pollutant can be in a surface or groundwater supply while still allowing
it to meet its designated uses, such as for drinking water, fishing, swimming, irrigation, aquatic life or
industrial purposes.
For each pollutant that causes a water to fail to meet state water quality standards, the federal Clean
Water Act requires the MPCA to conduct a TMDL study. A TMDL study identifies both point and
nonpoint sources of each pollutant that fails to meet water quality standards. While lakes, rivers a nd
streams may have several TMDLs, each determining the limit for a different pollutant, the state has
moved to a watershed approach that addresses multiple pollutants and sites within a watershed to
efficiently complete TMDLs. Many of Minnesota’s water resources cannot currently meet their
designated uses because of pollution from a combination of point and nonpoint sources.
Wastewater discharges
Owners or operators of any disposal system or point source are required by Minnesota law to obtain
permits, maintain records and make reports of any discharges to waters of the state. These self-
monitoring reports submitted to MPCA are commonly referred to as Discharge Monitoring Reports
(DMRs). DMR data are compiled using compliance tracking data systems maintained by MPCA data
specialists.
The MPCA’s water quality program continues to evolve from a predominantly concentration-based,
facility-by-facility regulatory approach to one that emphasizes managing total pollution discharges to
Minnesota’s watersheds. The current report represents a continuing effort to improve the MPCA’s
capacity to accurately perform loading analyses. Due to the five-year permit cycle, however, some
permits have yet to be modified for select pollutants to incorporate the monitoring and reporting
requirements necessary to enable efficient, computerized calculations of total annual pollutant loadings.
As the MPCA reissues permits and conducts ongoing review of data, it will continue to build capability in
this area and the assessment of pollutant trends over multiple years will become more reliable.
2018 Pollution Report to the Legisla ture • April 2018 Minnesota Pollution Control Agency
17Overall pollutant loads to receiving waters are based on a combination of effluent flow and pollutant
concentrations in the effluent. Loads are calculated by combining facility-reported flow and
concentration data. If facility-specific data are not available, loads are estimated with information based
on facilities with similar waste streams or other best professional judgment. Effluent flow and pollutant
loading estimates for National Pollution Discharge Elimination System (NPDES) permitted facilities
exclude once-through non-contact cooling water data from power generation facilities—large volumes
of (primarily) river water used for cooling purposes. These once-through non-contact cooling waters are
discharged with the addition of heat, and with minor additions of other pollutants. Pollutant loads
associated with these discharges were largely present in the waterbodies before the waters were
withdrawn for cooling purposes so reporting them as wastewater pollutants would be misleading.
Pollutant loads calculated from measured wastewater flows and observed pollutant concentrations are
considered to be highly reliable while less confidence is warranted for pollutant loads derived from
estimated concentrations. The degree of confidence in each loading estimate can be expressed as the
proportion of the load derived from observed values compared to the proportion derived from
estimated values. The loading graphs in this report are color coded by ‘Observed’ and ‘Estimated’ to
serve as a confidence measure for each pollutant load measure.
Prior to 2014, the wastewater sections of the MPCA’s Pollution Reports to the Legislature were based on
data reported by approximately 99 major wastewater dischargers. These are facilities permitted to
discharge at least 1 million gallons of treated wastewater per day and account for approximately 85% of
the volume of treated wastewater discharged to waters of the state. Reports now include data from all
surface water dischargers, regardless of size. The inclusion of non-major facilities provides a more
complete measure of pollutant loads since non-major facilities can collectively impact water quality.
Figure 11 shows the distribution of municipal wastewater facilities by size.
2018 Pollution Report to the Legisla ture • April 2018 Minnesota Pollution Control Agency
18Figure 11. Distribution of municipal wastewater facilities by size
2018 Pollution Report to the Legisla ture • April 2018 Minnesota Pollution Control Agency
19The map below shows the distribution of industrial discharges by type. Facilities are grouped in the
following broad categories: agricultural industry, food processing, mining (including non-metallic mining
operations), power plants and other.
Figure 12. Distribution of industrial wastewater dischargers by type
Five common chemical parameters found in wastewater treatment plant effluent are highlighted in this
report: total suspended solids (TSS), carbonaceous biochemical oxygen demand (CBOD 5 ), total
phosphorus, total nitrogen and mercury.
Effluent flow volumes are also included this report. Although flow is not a regulated pollutant, it is a
useful gauge of overall facility performance because of the direct relationship between pollutant loading
and effluent flow volume. For example, if effluent flow and pollutant loading show proportional annual
increases, it is an indication that overall effluent concentrations have remained stable and the loading
increase is attributable to the increase in flow. Conversely, if the pollutant load showed consistent
annual decreases despite an increase in effluent flow volume, the concentration has likely decreased
and the effluent quality has improved.
Table 2 summarizes effluent pollutant loading and flow volume estimates for municipal and industrial
wastewater treatment facilities in Minnesota from 2000 to 2017.
2018 Pollution Report to the Legisla ture • April 2018 Minnesota Pollution Control Agency
20Flow
Overall, wastewater flow volumes have fluctuated from a baseline of 270 billion gallons per year in
2000/2001 to a peak of 304 billion gallons per year in 2011. Average effluent flow from 2013 through
2017 was 283 billion gallons/year. Since the year 2000, major facilities have discharged approximately
78% of the total treated wastewater. Municipal wastewater treatment facilities discharged 64% of the
total treated wastewater from 2000 through 2004. Since 2005, the proportion of municipal wastewater
flow has declined to 59% of the total. Wastewater flow reductions have occurred since 2011. 2012 was a
particularly dry year, which affected the volume of water being processed by municipal wastewater
treatment facilities. However, despite increasing precipitation and higher stream flows in subsequent
years, changes in wastewater flows remained relatively modest. From 2014 to 2017, surface water
discharges reported by the wastewater sector have averaged 286 billion gallons per year, a slight
increase from the long-term average.
Figure 13. Minnesota wastewater effluent flow for 2017
2018 Pollution Report to the Legisla ture • April 2018 Minnesota Pollution Control Agency
21Point source pollutant loading trends
Figure 14 shows pollutant effluent flows and loading trends for TSS, CBOD 5 , total phosphorus and total
nitrogen from 2000 – 2017. Mercury trends from wastewater treatment facilities are shown in Figure 22
on page 35. Overall, effluent flows tend to fluctuate based on the amount of rainfall and snow melt. The
overall health of the economy also affects the amount of industrial production, which in turn affects
industrial effluent flows and the amount of industrial effluent treated at municipal wastewater
treatment facilities. Overall trends include:
TSS loads: Stable –TSS loads increased in 2001 and 2002 but have otherwise remained fairly stable at
approximately 5,000 metric tons per year.
CBOD5 loads: Declined—Loads have declined from loads ranging from 3,000 to 4,000 metric tons per
year during the 2000 to 2004 period to an average load of 2,400 tons per year since 2005.
Total phosphorus loads: Declined--Significant total phosphorus reductions have been achieved since
2000.
Total nitrogen loads: Increased—Total nitrogen loads have increased from 13,000 metric tons per year
in 2000/2001 to 15,000 metric tons per year in 2016/2017. The long-term 2000 -2017 average
phosphorus effluent load is 13,700 metric tons per year.
Mercury loads: Decreased—Significant mercury load reductions have been achieved. Mercury loads
prior to 2005 are excluded because of changes in the ability to detect mercury in effluent.
Figure 14. Pollutant loading trends from Minnesota wastewater facilities, 2000-2017
2018 Pollution Report to the Legisla ture • April 2018 Minnesota Pollution Control Agency
22Table 2 shows pollutant effluent flow and loading trends from 2000 through 2017. Effluent flow is
reported in billion gallons per year. Pollutant loads for TSS, CBOD 5 , total phosphorus and total nitrogen
are reported in metric tons per year. Pollutant loads for mercury are reported in kilograms per year.
Table 2. Annual total flow and pollutant load
Total Total
Flow TSS phosphorus CBOD5 nitrogen Mercury
(MG/year) (MT/year) (MT/year) (MT/year)¹ (MT/year) (Kg/year)²
2000 258,476 5,429 1,841 3,350 12,457 -
2001 280,737 8,836 1,860 4,893 13,673 -
2002 281,585 7,881 1,733 4,355 13,582 -
2003 260,201 6,430 1,405 3,664 12,572 -
2004 271,917 5,708 1,224 3,087 12,948 -
2005 289,444 5,916 1,080 2,605 13,606 4.2
2006 293,900 5,757 1,089 2,402 13,348 3.9
2007 294,131 6,045 1,027 2,419 13,367 3.2
2008 295,388 5,368 971 2,577 13,132 2.8
2009 283,705 5,136 823 2,259 12,684 2.6
2010 292,249 5,473 794 2,428 14,069 3.0
2011 303,759 5,967 776 2,851 15,067 3.2
2012 269,183 4,673 640 2,232 13,747 2.0
2013 273,402 4,687 619 2,205 14,123 2.3
2014 285,805 5,046 599 2,473 14,541 2.8
2015 267,352 4,195 548 2,031 13,951 2.3
2016 294,670 5,310 584 2,557 14,587 2.2
2017 294,588 4,855 592 2,437 15,279 2.2
¹Industrial facilities are excluded from CBOD 5 load calculations due to lack of data.
²Peat mining facilities are excluded from mercury calculations due to unreliability of flow and mercury data.
2018 Pollution Report to the Legisla ture • April 2018 Minnesota Pollution Control Agency
23Table 3 shows flow-weighted mean concentration (FWMC) trends from 2000 through 2017. FWMC is
calculated by dividing the annual load by the annual flow and is a measure of the overall performance of
wastewater dischargers. All FWMCs are reported in milligrams per liter (mg/L) except for mercury, which
is reported in nanograms per liter (ng/L). TSS FWMCs have remained fairly stable at approximately
5 mg/L. CBOD 5 FWMCs have declined from approximately 3 mg/L in the 2000 to 2004 period to
approximately 2 mg/L since 2005. Total phosphorus FWMCs have declined from approximately 1.5 mg/L
in the 2000 to 2003 time period to approximately 0.5 mg/L in from 2014 to 2017. Total nitrogen FWMCs
have increased approximately 1 mg/L. Mercury concentrations declined from approximately 4 ng/L in
2005 to approximately 2 ng/L since 2015.
Table 3. Annual flow-weighted mean concentration
Total Total
TSS CBOD5 phosphorus nitrogen Mercury
(mg/L) (mg/L) (mg/L) (mg/L) (ng/L)
2000 5.55 3.42 1.88 12.73 -
2001 8.32 4.60 1.75 12.87 -
2002 7.39 4.09 1.63 12.74 -
2003 6.53 3.72 1.43 12.77 -
2004 5.55 3.00 1.19 12.58 -
2005 5.40 2.38 0.99 12.42 3.79
2006 5.18 2.16 0.98 12.00 3.53
2007 5.43 2.17 0.92 12.01 2.91
2008 4.80 2.30 0.87 11.75 2.54
2009 4.78 2.10 0.77 11.81 2.43
2010 4.95 2.19 0.72 12.72 2.69
2011 5.19 2.48 0.68 13.10 2.76
2012 4.59 2.19 0.63 13.49 1.94
2013 4.53 2.13 0.60 13.65 2.23
2014 4.66 2.29 0.55 13.44 2.63
2015 4.15 2.01 0.54 13.79 2.31
2016 4.76 2.29 0.52 13.08 1.94
2017 4.35 2.19 0.53 13.70 1.98
2018 Pollution Report to the Legisla ture • April 2018 Minnesota Pollution Control Agency
24You can also read