Valorization of rare earth processing byproducts for agriculture usage
←
→
Page content transcription
If your browser does not render page correctly, please read the page content below
www.nature.com/scientificreports
OPEN Valorization of rare earth
processing byproducts
for agriculture usage
Mohamed Musa Hanafi1,2,3*, Parisa Azizi1,6, Sheu Tijani Akinbola1,6, Roslan Ismail3,6,
Abdul Rahim Sahibin4,6, Idris Wan Mohd Razi5,6 & Aznan Fazli Ismail6,7
Sandy texture soil, a major problem for agriculture requires structure and capacity improvements.
However, utilization of soil conditioner may arrest this problem. This research was carried out to
investigate the accumulated levels of metal ions and radionuclides in water, soil and plants following
phosphogypsum organic (PG organic) added to a sandy soil for 23-month in 3 cropping seasons. The
condition in the field was simulated in the laboratory using an open leaching column for 30-day under
constant but different pH of leachant. More ions were released at pH < 4.6 and decreases greatly at
pH > 5.6. The metal ions measured in the surface and borehole water, and soils were below the target
values for respective standard raw drinking water. The metal ions did not accumulate in soil, plant
and grain, and water as indicated by biological accumulation coefficients, contamination factors,
I-geo index and pollution load index in a sandy soil that received the PG organic. Naturally occurring
radionuclide concentrations, such as 226Ra, 228Ra, and 40K, in soil and plant tissue were found to be
lower than the average value reported by several earlier studies. Under field condition the pH of
water (i.e., rainfall) was greater than pH 5.6, thus renders PG organic became less soluble. There
was no leaching of natural occurring radionuclides to the groundwater. Therefore, the application
of PG organic to the studied soil had no impact on the soil, plants, and water and suitable as a soil
conditioner in sandy texture soils.
Phosphogypsum (PG) is typically a solid waste and mostly made of gypsum (CaSO4.2H2O). It may contain
further solid segments (e.g., fluorides), traces of unreacted phosphate rock (PR) and organic matter (OM). In
addition, minor liquid waste components (remains of process waters) can be included in P G1. It is estimated that
the total amount of PG produced up to 2006 was approximately 6 billion tons, of which 2.2 billion tons (37%)
were manufactured in the United S tates2.
The emergence of different studies focused on the discovery of new recycling alternatives for PG, such as
the manufacture of building materials, the application in agriculture, the acquisition of mineral resources or
environmental applications, has promoted the attractive economic potential of PG. The PG has commonly been
recognized as an amendment to improve the physico-chemical characteristics of soils because of its high content
in certain elements, such as calcium (Ca), phosphorus (P) and sulfur (S). This route of valorization is not new; the
possible use of this by-product in agriculture was reviewed by Alcordo and Rechcigl3. Since then, many studies
have been allocated to the agricultural uses of P G4–9. Notably the studies have been carried out to improve crop
yield and soil s tructure , decreasing soil e rosion11, treating soils that are acidic or metal-rich12,13 or increasing
10
the available soil concentrations of S and P 14. The analysis of PG impurities along with their mobility and bio-
availability are of crucial significance to ensure a healthy long-term application in agriculture. To simulate the
movement of contaminants from PG modified soils to agricultural products, some authors have tackled this
1
Laboratory of Climate‑Smart Food Crop Production, Institute of Tropical Agriculture and Food Security, Universiti
Putra Malaysia, 43400 Serdang, Selangor, Malaysia. 2Laboratory of Plantation Science and Technology, Institute
of Plantation Studies, Universiti Putra Malaysia, 43400 Serdang, Selangor, Malaysia. 3Department of Land
Management, Faculty of Agriculture, Universiti Putra Malaysia, 43400 Serdang, Selangor, Malaysia. 4Environmental
Science Program, Faculty of Science and Natural Resources, Universiti Malaysia Sabah, 88400 Kota Kinabalu,
Sabah, Malaysia. 5Centre for Earth Sciences and Environment, Faculty of Science and Technology, Universiti
Kebangsaan Malaysia, 43600 Bangi, Selangor, Malaysia. 6Nuclear Science Program, Faculty of Science and
Technology, Universiti Kebangsaan Malaysia, 43600 Bangi, Selangor, Malaysia. 7Centre for Frontier Sciences,
Faculty of Science and Technology, Universiti Kebangsaan Malaysia, 43600 Bangi, Selangor, Malaysia. *email:
mmhanafi@upm.edu.my
Scientific Reports | (2021) 11:15234 | https://doi.org/10.1038/s41598-021-93704-9 1
Vol.:(0123456789)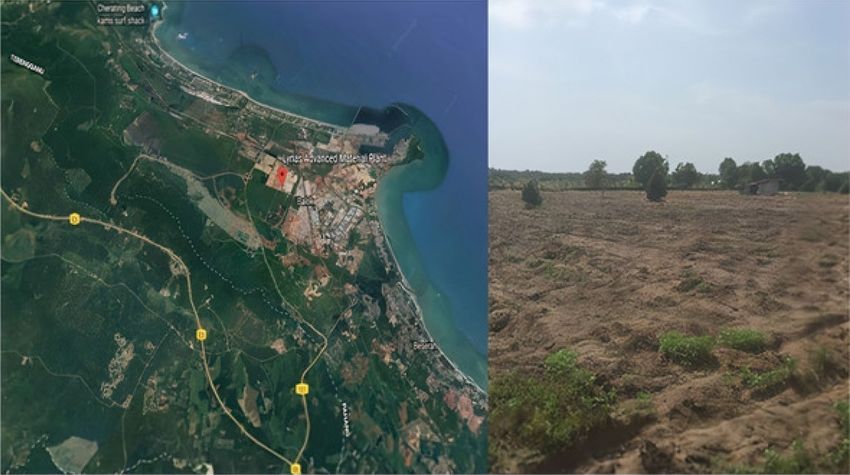
www.nature.com/scientificreports/
problem by adding various extractants to PG, such as by measuring leaching amounts of radionuclides and metals
from Brazilian PG in comparison to PR15, aqua regia digestion and sequential e xtractions16,17.
In this research we used PG organic, which contains neutralization underflow (NUF) residue, water leached
purification (WLP) residue from rare-earth elements processing plant, and organic filler material in a ratio of
2:1:7. In order, to develop specific soil quality remediation and having soil with a great preference, which will be
important requisites in the development of agricultural product, PG organic has been applied to improve sandy
soils. The organic material used as filler is derived from composted oil palm empty fruit bunch (COPEFB), a
by-product from palm oil processing mill. This soil contains more than 80% of sand fraction is a problematical
soil in Southeastern Asia, including Malaysia and I ndonesia18. It is unsuitable for agricultural purposes because
of its weak structure, deficient of nutrients, low capacity of water retention, high soil temperature, and ultimately
inadequate supports of plants to grow19. However, it is assumed that application of fertilizer in combination of
PG organic may improve sandy soil structure and quality. The organic fraction may play an important role to
held nutrients and for the formation of soil structure. Successful utilization of this PG organic in this soil might
be used for other problematic soils worldwide. To the best knowledge of the authors, there was no such study
relating the usage of PG organic for improvement of sandy soil and its effect on soil, water, and plants ecosystems.
On the other hand, one of the main sources of metal ions in water (surface and ground water), soil and plants
is leachate m igration20. Therefore, the objectives of this study were (i) to observed migration of selected ions
related to plant nutrition in the short-term laboratory experiment and (ii) to investigate the accumulated levels
of metal ions (MIs) (e.g., As, Cd, Ce, La, Se, Sr, Th, Ra, Zn, B, Mn, Pb, Cr, Ag, Ba and Hg) and natural radioac-
tivity concentrations, such as 226Ra, 228Ra, 238U and 232Th in water, soil, and plants between sandy soil under PG
organic treatment and control (normal sandy soil) in real field situation.
Materials and methods
Phosphogypsum organic. This PG organic was developed by Lynas, the world’s second largest producer
of rare earth materials and the Universiti Putra Malaysia (UPM) as a ‘soil conditioner’ in 2015. It contains neu-
tralization underflow (NUF) residue, water leached purification (WLP) residue from rare-earth elements pro-
cessing, and organic filler material. Lynas Malaysia, a subsidiary of Lynas Corporation Ltd (Australia), is one of
the largest and most modern rare earths separation plants in the world. At optimum production, Lynas Advance
Materials Plant (LAMP) produces WLP and NUF at 64,000 and 124,000 tons/year, respectively. These industrial
by-products are an environmental and safety issues not only in Malaysia, but also worldwide21. The PG organic
(Supplementary characterization data—I) was prepared in the LAMP complex and transported by a special land
transport following the guideline approved by the Department of Environment Malaysia for immediate use at
the experimental site.
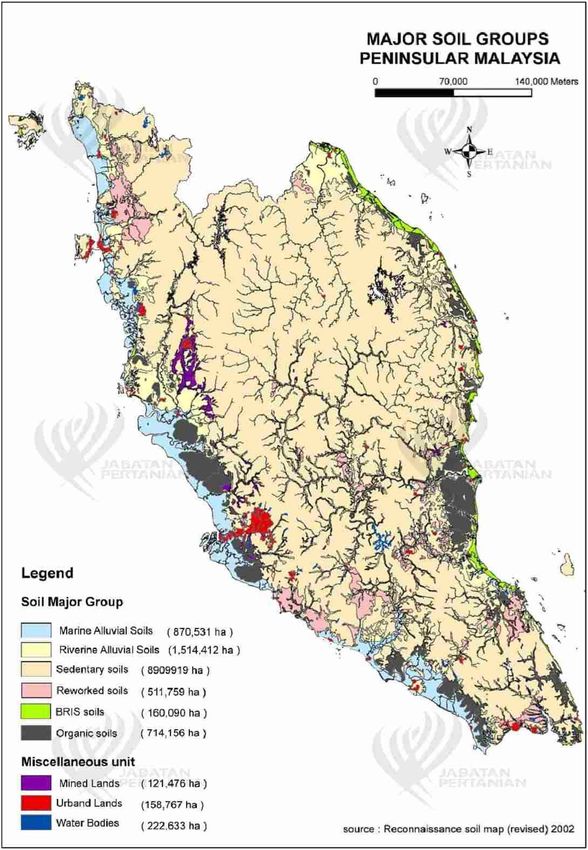
Soils. A group of sandy (> 80% sand fraction) soils developed from marine deposits on a coastline (Fig. 1)
and containing a spodic horizon (spodosol) (Typic Haplorthord) or without spodic horizon (Typic Quartzisam-
ment) is a problematical soil in Southeastern Asia including Malaysia and I ndonesia18,19. These soils are devel-
oped on ridges and swales, which is locally known as the beach ridges interspersed with swales (BRIS). During
monsoon seasons, the steep cliffs layers erosion and deposition of residues and sand from the sea is developed by
moving sea water and create BRIS soil containing coarse sand c omponents20. This soil is categorized into seven
soil series based on drainage, depth and soil profile, including Rhu Tapai, Rusila, Rudua, Rompin, Merchang,
Jambu and B aging19.
Simulation of ions released from PG organic in a sandy soil column. Leaching columns of diam-
eter 5.5 cm were cut to length of 30 cm of poly vinyl chloride (PVC) pipe and then transported to the field. In
the field leaching columns were pressed into the soil at a depth of 0–30 cm, cut and then covered at the two ends
and transported back to the laboratory for the experimental set up.
In the laboratory, rubber stoppers fitted with tubing outlet were fixed to the bottom of each of the soil col-
umn in preparation for leaching experimental setup (Fig. 2). The soil columns were equilibrated on a rack after
allowing water to flow up by capillary rise through an outlet at the bottom of the soil columns to a saturated
point and then allowed to drain completely. Top 2 cm of the soil in the column was removed and PG organic
was mixed thoroughly in top of soil of the column at the rate of 28 tons/ha (equivalent to 14.0 g per column)
(Fig. 2a). Then, the leaching solutions, varied in acidities (pH 1–9) were delivered using a proportioning pump
with tubing (Tygon Y/Y) of flow rate of 0.16 mL per minute, and then allowed to drop on a filter paper placed
on the soil surface in the column (Fig. 2b). This procedure was successfully used to measure the dissolution of
PR in acid Malaysian soils in an open-leaching column22. The top of the columns was covered by transparent
waterproof tape. Leaching of sandy soil amended PG organic continued up to 30 days, which was approximately
equivalent to the total rainfall for 1 year (2,400 mm) in the region.
Leaching solution of five different pH values was prepared and stored in a plastic container, which was used
for a period of 30 days. The leaching solution was prepared according to Pearse23; pH 1.2 solution was prepared
with 0.2 M HCl and 0.2 M KCl, while 0.1 M glacial acetic acid and 0.1 M Na acetate was used to prepare leaching
solution of pH 3.6, 4.6 and 5.6, and finally pH 8.8 solution was prepared with 0.2 M glycine and 0.2 M NaOH.
Leachate was collected for every 3 days, sampled, and kept in the refrigerator for the period of 1 month of
experiment. The pH and electrical conductivity (dS/m) reading of the leachate were taken using a pH meter
(Model TRANS BP 3001) and EC meter (Model TRANS BC 3020), respectively. Leaching solution was analyzed
using inductively coupled plasma mass spectrometry (ICP-MS) (Model: Perkin Elmers Elan 9000, Shelton, USA)
for the following ions, such as phosphorus (P), calcium (Ca), magnesium (Mg), cupper (Cu), iron (Fe), man-
ganese (Mn) and zinc (Zn); while aluminum (Al), strontium (Sr), chromium (Cr), thorium (Th) and lead (Pb).
Scientific Reports | (2021) 11:15234 | https://doi.org/10.1038/s41598-021-93704-9 2
Vol:.(1234567890)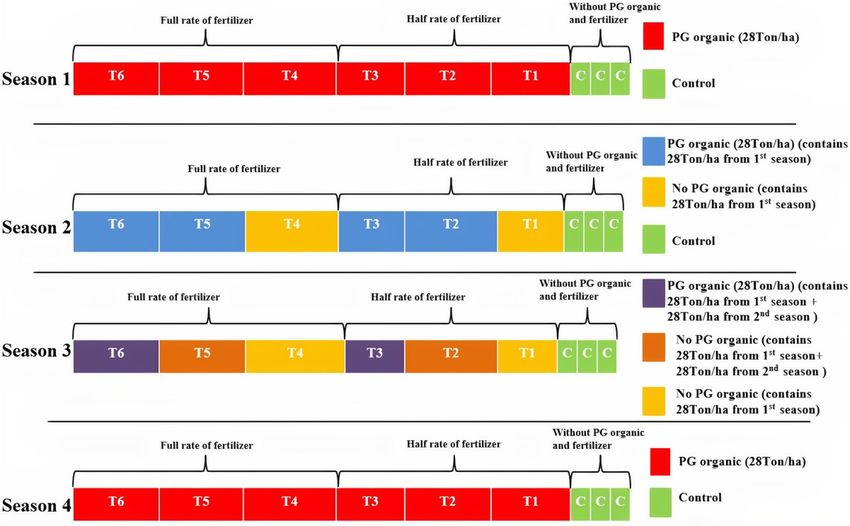
www.nature.com/scientificreports/
Figure 1. The extent of sandy soils distributions in Peninsular M
alaysia70.
Scientific Reports | (2021) 11:15234 | https://doi.org/10.1038/s41598-021-93704-9 3
Vol.:(0123456789)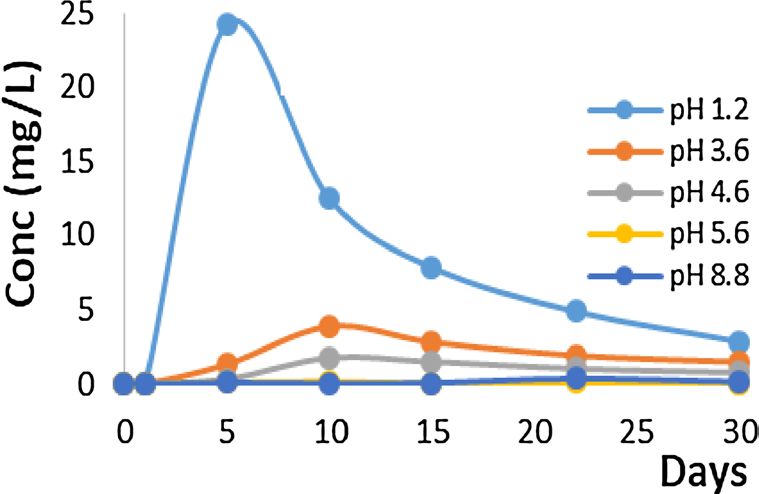
www.nature.com/scientificreports/
Figure 2. Schematic diagram of the experimental set-up (a) and the constructions of soil leaching column (b)
using a PVC pipe.
At the end of the experiment (30 days), the soil columns were allowed to drain completely and were cut into
5 cm each, and the soil was air-dried, extracted with Mehlich 3 e xtractant24 and analyzed for the same nutrients
listed above using AAS analyzer and ICP-MS, respectively.
Scientific Reports | (2021) 11:15234 | https://doi.org/10.1038/s41598-021-93704-9 4
Vol:.(1234567890)www.nature.com/scientificreports/
Figure 3. The location of the experimental site and the Lynas Advance Material Plant (LAMP)71; Note: Scale of
map; 1.0 cm = 1.0 km.
Field experimental site. The field trial was conducted on 1.62 ha at Kampung Darat Sungai Ular, Pahang
(GPS 3°50′51"N, 103°21′46"E) as shown in Fig. 3.
The implication of PG organic application to the environment was monitored for three planting seasons (23-
month) beginning in 2015 with 4-month cycles for each season. The residual effect of the PG organic conditioner
was measured for three test crops, including corn (Zea mays L.), kenaf (Hibiscus cannabinus L.) and guinea grass
(Panicum maximum).
Plot design and treatment. The randomized complete block design (RCBD) was applied on the experi-
mental site with three replications for two seasons. There are seven treatments applied as shown in Fig. 4.
The PG organic was applied at the top of soil surface and mixed thoroughly in the top 15 cm soil depth using
a rotovator machine. There was allowed to equilibrate for 7 days before cropping of plants. Fertilizer treatments
based on crop recommended rate and frequencies of application were added to top of the soil under the plant
canopy, when permissible based on soil and foliar analyses. A drip irrigation water system was applied to each plot
using black plastic tape tubing. The water was supplied when necessary to achieve the target moisture content of
soil field capacity (FC). All soil, plants and water characteristics were compared between control plots (without
PG organic and fertilizer) and those plots received maximum amount of PG organic as conditioner (T6).
Sampling of soils, water and plants. Soils were sampled on three occasions: before the PG organic
application (base line), after the PG organic application (one month after application) and at harvest. Soil sam-
ples, water samples and plant samples were taken for analysis in the three seasons of field experiment. Every
season the soil and water samples were taken before PG organic applications, one month after PG organic appli-
cation and at harvest. Plant samples were taken during harvest. In total 18 composite soil samples corresponding
to the treatment were taken whereas three soil samples were for control every season. Water samples were col-
lected from five boreholes available within the study area and two surface water samples from the nearby river
every time during sampling.
Topsoil (0–30 cm) samples were taken randomly in a composite manner from the designated plot to deter-
mine their physico-chemical properties, plant nutrients, metal ions and natural radionuclides contents. Approxi-
mately 2 kg of composite topsoil (0–30 cm) samples was collected and kept in a plastic bag. Meanwhile, water
was sampled from boreholes within or near the plots, and surface water was sampled in the nearby Sungai Ular.
In situ water parameters, such as pH, salinity, dissolved oxygen, electrical conductivity, temperature, and total
dissolved solids were examined in the field using an YSI 556 MPS handheld multi-parameter water quality
meter. All water samples collected for laboratory analysis were kept in an ice box with a temperature below 4 °C
and contained the addition of several drops of H NO3 acid to control the pH below 2. The aboveground mass of
plants was cut and sampled for their stems, leaves and grain for corn. The summarized of detailed information
regarding the samples is shown in Table 1.
Scientific Reports | (2021) 11:15234 | https://doi.org/10.1038/s41598-021-93704-9 5
Vol.:(0123456789)www.nature.com/scientificreports/
Figure 4. The sub-plots receiving the PG organic conditioner treatment for 3 cropping seasons for kenaf, maize,
and guinea grass. Blue represents the sub-plot receiving the soil conditioner for each cropping season, and
yellow represents the sub-plot receiving residual treatment.
Characterization of soil properties. Soils were tested for their particle size distribution and organic mat-
ter content. The particle size distribution was determined using the pipette method together with dry sieving25,
whereas organic matter was determined by the loss on ignition m ethod25. Soil chemical tests involved the pH
(H2O), plant nutrient contents (Ca, Mg, K, and P), organic carbon content, electrical conductivity, and metal
ions. The soil pH in water was determined at soil: solution ratio (1/2.5) and measured using a pH meter (Model:
Metrohm 827, Riverview, FL, USA). Organic carbon was measured with the Walkley and Black method26. Elec-
trical conductivity was measured in saturated gypsum extracts27 (Model: Mettler Toledo SevenEasyTM Conduc-
tivity Meter S30, Hamilton, New Zealand). The total C, N, and S were measured using a CHNS analyzer (Model:
LECO CHNS-932).
Analysis of Metal Ions
Soils. Soil samples were dried at room temperature, ground, and sieved to pass through a 2-mm sieve. For the
determination of metal ion contents, the soil was pulverized to pass through a 63-micron sieve. Plant samples
were cleaned in running water and rinsed with deionized water at least three times before being cut into small
pieces, dried and ground using a micro-hammer mill (Model: IKA mills MF 10.1, IKA Works GmbH & Co.,
Staufen, Germany). The total metal ion contents in the soil was extracted with nitric acid and perchloric acid
in a 3:1 ratio28. Metal ion contents (As, Cd, Ce, La, Se, Sr, Th, Zn, B, Mn, Pb, Cr, Ag, Ba and Hg) were extracted
by the wet digestion method. Metal ions in solution were determined using the ICP-MS (Model: Perkin Elmers
Elan 9000, Shelton, USA).
Water. The water analysis followed the standard methods proposed by American Public Health Association,
PHA29. Metal ion contents in water (e.g., As, Cd, Ce, La, Se, Sr, Th, Ra, Zn, B, Mn, Pb, Cr, Ag, Ba, Al, and Hg)
A
were measured using ICP-MS (Model: Perkin Elmers Elan 9000, Shelton, USA).
Plants. The plant parts were separated into roots, stems, leaves and grain and analyzed for metal ions and
plant nutrient. The total metal ion contents of the plants were extracted with nitric acid and hydrogen peroxide
in a 3:1 ratio30. The metal ion contents determined included As, Cd, Ce, La, Se, Sr, Th, Zn, B, Mn, Pb, Cr, Ag, Ba,
Al, and Hg. Metal ions in solution extracts were determined using ICP-MS (Model: Perkin Elmers Elan 9000,
Shelton, USA).
Scientific Reports | (2021) 11:15234 | https://doi.org/10.1038/s41598-021-93704-9 6
Vol:.(1234567890)www.nature.com/scientificreports/
Season Sample type Sample ID Note
Kenaf-soil-control
Control sample without PG organic
Kenaf-soil-control
Soil
Kenaf-soil-PG organic
Soil treated with PG organic
Guinea grass-soil-PG organic
BH-1
BH-2
BH-3 Underground water
2nd Season Water BH-4
BH-5
SW-1
Surface water (river)
SW-2
Kenaf-stem-Control
Plant growing without PG organic
Guinea grass-leaf-Control
Plant
Kenaf-stem-PG organic
Plant Growing with PG organic
Guinea grass-leaf-PG organic
Kenaf-soil-control
Control sample without PG organic
Kenaf-soil-control
Soil
Kenaf-soil-PG organic
Soil treated with PG organic
Guinea grass-soil-PG organic
BH-1
BH-2
BH-3 Underground water
3nd Season Water BH-4
BH-5
SW-1
Surface water (river)
SW-2
Kenaf-stem-control
Plant growing without PG organic
Guinea grass-leaf-control
Plant
Kenaf-stem-PG organic
Plant Growing with PG organic
Guinea grass-leaf-PG organic
Table 1. Locations of soil, plant, and water sampling at the experimental plot.
Natural radioactivity analysis
Sample preparation-Each sample was prepared accordance to the International Atomic Energy Agency (IAEA)
guidelines31,32. The soil and plant samples were cleaned and dried in the oven at 105 °C for 72 h, until a constant
weight was achieved. Soil and plant samples were then left to cool at room temperature, ground using a grinder
and sieved with a 500 µm sieve size to ensure the homogeneity of the samples. Meanwhile, water samples were
filtered out from impurities using a clean dried sieve cloth. The samples were then packed into Marinelli counting
beaker, sealed and for 30 days to attain secular equilibrium between the parents’ radionuclides (238U and 232Th)
and their respective progenies.
Gamma spectrometry analysis. Natural radioactivity in samples was determined after 12 h of counting
using a gamma spectrometry system with a Canberra High-purity Germanium Detector (HPGe) coupled to a
multichannel analyzer. The HPGe detector was shielded inside CANBERRA model-747 lead shielding coated
with tin and copper to provide a low background environment. The radioactivity concentrations of 226Ra, 232Th
and 40K were determined through gamma-ray photo peaks of 1764 keV (214Bi), 2614 keV (208Tl) and 1460 keV
(40K) with the corresponding emission probability of 15.2, 99.8 and 10.7%, respectively. The gamma spectrom-
etry system was calibrated using a standard source with a mixture of 22Na, 51Cr, 57Co, 60Co, 85Sr, 88Y, 109Cd, 113Sn,
137
Cs, 123Te and 241Am radionuclides. The analysis of gamma spectra was performed using Genie-2000 software
supplied by CANBERRA. The IAEA Soil-375 (certified reference material), IARMA-004 (certified reference
material) and 0802 Silica Standard (Multinuclide Standard Mixed with Silica) were used as reference in this
research. The counting errors were quoted at 1-sigma absolute. Natural radionuclide concentrations in soil and
plant samples were determined using Eqs. (1) and (2), respectively, as f ollows33,34.
Mrm × As
Ws = × Wrm (1)
Ms × Arm
Scientific Reports | (2021) 11:15234 | https://doi.org/10.1038/s41598-021-93704-9 7
Vol.:(0123456789)www.nature.com/scientificreports/
As
Ws = (2)
εθ Ms
The Ws and W
rm are radionuclide concentrations for sample and reference materials in Bq/kg, M s and M
rm
are sample and reference material masses (g), while, As and Arm are the activities (net count per second, cps) for
sample and reference materials, respectively. The Є and θ are the energy efficiency and abundance of the interest
gamma energy peak, respectively. The accuracy of the procedure was checked by measuring the IAEA Soil-375
the lower limit detection (LLD) and the measured activity of 226Ra, 232Th and 40K under the same condition and
samples (Supplementary data available -II).
Pollution indices related to metal ions and radionuclides
The guidelines used as a comparison to the metal ion contents in water were the available standard, such as
the new Dutch L ist35, Malaysian Guidelines for Raw Water Quality C
riteria36 and the National Water Quality
Standard (NWQS) . The metal ion contents in soil were compared with the new Dutch List35, and the metal ion
37
contents in the grain were compared with values from the Malaysian Food Act38 and Food Regulation39 standard.
Biological accumulation coefficient. The biological accumulation coefficient (BAC), which is an indica-
tor of the ability of a plant to accumulate a specific metal ion in contrast to the concentration of the metal ion in
the soil substrate40, was calculated as follows:
Metal concentration in plant
BAC = (3)
Metal concentration in soil
where, the metal ion concentrations in the edible parts of the plant and the soil are represented by metal ion
concentration in the plant and metal ion concentration in the soil, respectively.
Geo‑accumulation index. Established by Muller41, the geo-accumulation index (I-geo) was used to dis-
cover how much metal ion has built up in sediments and has been employed in a number of applications and for
a number of research purposes. The I-geo is mathematically expressed as:
I − geo = log2 (Cn/1.5Bn), (4)
where, Cn = Concentration of element in the soil sample, and Bn = the geochemical background value. Factor
1.5 is used in the equation to take into consideration the chance of disparities in background data because of
lithogenic factors. The I-geo scale is made up of seven levels (0–6), from no contamination to heavy pollution.
Pollution load index. The pollution index (PLI) is composed of contamination factors (CF), which are
the quotients given by the division of the concentration of each metal ion. The CF is made of four levels (0–3,
low CF to high CF)42. The PLI of the site is estimated by gathering the n-root from the CFs, which were found
from the metal ions the PLI gathered from each location43. The PLI was created by Tomlinson et al.44 using the
formula below:
CF = C metal/C background value. (5)
(6)
n
PLI = (CFI × CF2 × CF3 . . . × CFn
where, CF = contamination factor, n = number of metals, C metal = the metal concentration in soil samples and
C Background value = the background value of that metal.
Determination of radiological hazard index. A radium equivalent ( Raeq) was used to estimate radio-
logical hazard index (RHI). The significance of 226Ra, 232Th, and 40K concentrations, with respect to radiation
exposure, was defined in terms of Raeq activity in Bq/kg. The Raeq was calculated using the following e quation44–46:
Raeq = CRa + 1.47CTh + 0.077CK (7)
226 228 40
where, CRa, CTh, and CK are the activity concentrations of Ra, Ra, and K in Bq/kg, respectively. This
equation is based on the estimation that 10 pCi/g of 226Ra, 7 pCi/g of 232Th and 130 pCi/g 40K will produce the
same gamma dose rates45,47. The value of Raeq should be less than 370 Bq/kg to be safe for agricultural applica-
tions or building materials, as recommended by Nuclear Energy Agency (NEA) and Organization for Economic
Co-operation and Development (OECD)48.
Determination of radionuclide uptakes by plant. The uptake of 226Ra, 228Ra, 238U, 232Th and 40K from
soil to plants was determined using a parameter known as the transfer factor (TF), as f ollows49:
Cp
TF = (8)
Cs
where, Cp and Cs are the concentrations of radionuclides (Bq/kg) of interest in plants and soil, respectively. The
TF is used to describe the soil-to-plant transfer of radionuclides through the plant roots.
Scientific Reports | (2021) 11:15234 | https://doi.org/10.1038/s41598-021-93704-9 8
Vol:.(1234567890)www.nature.com/scientificreports/
Quality assurance of metal ions and radioactivity analyses. Quality assurance/quality control (QA/
QC) was considered using blanks and replicates for the water, soil, and plant tissue samples. The method for
water sample was validated by analyzing the standard reference material (SRM) NIST 1640a (Trace Elements
in Natural Water), purchased from National Institute of Standards and Technology (NIST)50. The method for
soil was standardized using procedure of SRM-2711a Montana II soil51. In addition, metal ions analysis in plant
samples was validated by the SRM 1568b rice flour52 and CRM-LGC7162 strawberry leaf53.
Furthermore, internal reference materials were used for precision, quality assurance and control (QA/QC)
for selected metal measurements. The average values of three replicates were taken for each determination. The
precision of analytical procedures was expressed as the relative standard deviation (RSD), which ranged from 5
to 15% and was calculated from the standard deviation divided by the mean. The recovery rates of the studied
metals were within 85 ± 15%.
The measured radioactivity concentrations for 226Ra (238U series), 228Ra (232Th series) and 40K for the gamma
spectrometry system were in the range of the 95% confidence level, as proposed by the IAEA for reference mate-
rial CRM-375 (Supplementary data available—II). Moreover, the MDA analysis indicated that the lower limits
of detection for 226R, 228Ra and 40K were 0.7, 0.2 and 1.2 Bq/kg, respectively. Based on both analyses, it can be
judged that the gamma spectrometry system was in good condition, and the results were acceptable during the
analysis period.
Chemicals, stock solutions, and reagents were obtained from Sigma/Fluka/Merck and were of analytical
grade. All glassware was washed with distilled water, soaked in nitric acid (30%) overnight, rinsed in deionized
water and air dried before use.
Statistical analysis. All the data were analyzed using the Statistical Analysis System (SAS) version 9.4 soft-
ware. All data were subjected to an analysis of variance (ANOVA) statistical analysis to detect the variation of
metal ion contents at different sampling times, which coincided with the PG organic application. A comparison
of means was performed using the least significant difference (LSD) test for the test crops.
Results
Dissolution of PG organic as affected by acidity of leachant. Most of the ions in the PG organic
dissolved and leached in higher concentration in the earlier days, and gradually reduced by days, irrespective of
the pH of leachant (Fig. 3). Each ion leached from soil column differed in quantity to achieve the maximum and
minimum concentration. The highest dissolution of phosphate was found in strongly acidic leachant pH of 1.2
but decreased over time (Fig. 5a). The highest concentration (24.3 mg/L) recorded was on day 5, and it decreased
to 2.85 mg/L after 25 days.
For Ca and Mg, the highest concentration was found on day 1 with 573.9 and 231.1 mg/L, respectively, as
dissolved by pH 3.6 leachant. This value decreased by days and at day 30, the concentration recorded became
63.76 and 4.91 mg/L, respectively (Fig. 5b). For Cu and Fe ions, there were an increased leaching of these elements
in the strongly acidic leachant. For both elements, concentration increased by days, up to day 10 in leaching
solution of pH 1.2 and later decreased gradually and as low as P, Ca and Mg, both was still able to release more
even at day 30 (Figs. 5d and e).
In case for other metal ions, the pH of leachant used was reduced from five to two in this study because there
was limited dissolution of ions in most of the leachant pHs, except in the case of pH 1.2, which most elements
dissolved in it. The Al, Sr, Cr and Pb were observed to dissolve more in strongly acidic leachant of pH 1.2 than
at pH 5.6 (Fig. 5), which is considered as the pH of this soil. The concentration of Al, Sr, Cr and Pb was higher
in pH 1.2, except in the case of Th that was dissolved more in the leachant of pH 5.6, though in a very small
amount. At pH 1.2, the concentration of Al was higher at the earlier days, and decreased by days, and up to zero
at the end of 30 days. The highest concentration was observed on day 5 with 606.1 mg/L and then reduced to
22.0 mg/L in day 10, and finally to 2.5 mg/L in day 30 (Fig. 5f). For other metal ions Sr, Cr, Th and Pb, the high-
est concentration was observed on day 22, 30, 10 and 5, respectively in lower amount except for Sr at 13.9 mg/L.
Among all, only Th was dissolved in pH 5.6 leachant in a higher amount than at pH 1.2, with just 0.0025 mg/L as
the highest concentration throughout the study period. The highest cumulative quantity of dissolved PG organic
at the respective of pH of leachant in the amended sandy soil column at the end of 30 days (in mg) was 658.4
(Al), 29.0 (Sr), 0.40 (Cr), 0.007 (Th), and 1.5 (Pb) (Supplementary data available—III).
The pattern of ions movement in the soil column. After 30 days of leaching, P concentrations in PG
organic soil column were higher at pH 3.6 to 8.8 leachants at the deeper soil column depth (Fig. 6a). In contrast,
Ca concentration was found higher in the pH 8.8 leachant at the deeper part of the soil column, while its move-
ment in the leachant of pH 1.2 and pH 3.6 was the least concentration observed (Fig. 6b). The same trend was
observed as the case of Mg in Fig. 6c.
Different pattern of movement in the soil was observed in the case of metal ions classified as micro-nutrients,
except for Fe that higher concentrations was found at the deeper part of the column, and this was peculiar to
all the five leachants. Manganese was found in higher concentrations at the top of the column but lower at the
bottom, except for the alkaline leachant, which all have been leached out into the leachate, no Mn was found
left in the soil (Fig. 6d).
Field evaluation of ions released from PG organic in a sandy soil
PG organic application effect on soil. The soil is a sandy type, with particles dominated by more than
80% sand (Supplementary data available—IV). The organic matter (OM) content remained unchanged through-
out the study period. Soil pH was strongly acidic but improved significantly at the last harvest from 4.11 to 5.64.
Scientific Reports | (2021) 11:15234 | https://doi.org/10.1038/s41598-021-93704-9 9
Vol.:(0123456789)www.nature.com/scientificreports/
(a) Phosphorus
600 (b) Calcium
500
Conc (mg/L)
400 pH 1.2
pH 3.6
300 pH 4.6
pH 5.6
200 pH 8.8
100
0
0 5 10 15 20 25 30
Days
(c) Magnesium 0.5 (d) Copper
250 pH 1.2
pH 1.2
pH 3.6
Conc (mg/L)
0.4
200 pH 3.6 pH 4.6
Conc (mg/L)
pH 4.6 0.3 pH 5.6
150 pH 8.8
pH 5.6
100 0.2
pH 8.8
50 0.1
0 0
0 5 10 15 20 25 30 0 5 10 15 20 25 30
Days Days
40 (e) Iron pH (f) Aluminium
1.2 600
Conc (mg/L)
30 pH
Conc (mg/L)
3.6 400
20 pH 1.2
200 pH 5.6
10
0 0
0 5 10 15 20 25 30 0 5 10 15 20 25 30
Days Days
14
(g) Stron um (h) Chromium
0.25 pH
pH 1.2
12 1.2
pH 5.6 0.2
Conc (mg/L)
Conc (mg/L)
10
8 0.15
6 0.1
4
2 0.05
0 0
0 5 10 15 20 25 30 0 5 10 15 20 25 30
Days Days
0.0030
(i) Thorium (j) Lead
0.8
pH 1.2 pH 1.2
Conc (mg/L)
Conc (mg/L)
0.0020 0.6
pH 5.6 pH 5.6
0.4
0.0010
0.2
0.0000 0
0 5 10 15 20 25 30 0 5 10 15 20 25 30
Days Days
Figure 5. The dissolution of PG organic over the period of 1 month in amended sandy soil column.
Scientific Reports | (2021) 11:15234 | https://doi.org/10.1038/s41598-021-93704-9 10
Vol:.(1234567890)www.nature.com/scientificreports/
(a) Phosphorus Conc (mg/kg) (b) Calcium Conc (mg/kg)
0 50 100 150 0 500 1000 1500 2000
0 0
pH 5 pH 1.2
5 1.2
Depth (cm)
Depth (cm)
10 pH 3.6
10 pH
pH 4.6
3.6 15
15 pH 5.6
pH
20 pH 8.8
20 4.6
25
25
30
30
(c) Magnesium Conc (mg/kg) (d) Manganese Conc (mg/kg)
0 50 100 0 10 20 30 40
0 0
5
5 pH 1.2
pH 3.6 10
10 pH 4.6
Depth (cm)
pH 5.6 15
15 pH 1.2
pH 8.8
20 pH 3.6
20
pH 4.6
25 pH 5.6
25
30 pH 8.8
30
(e) Aluminium Conc (mg/kg) (f) Thorium Conc (mg/kg)
0 2000 4000 6000 8000 0 0.5 1
0 0
5
5 pH 1.2
Depth (cm)
10
Depth (cm)
pH 1.2 10 pH 5.6
15
pH 5.6 15
20
20
25
30 25
30
Figure 6. The concentration of residual ions in PG organic amended sandy soil with the depth of soil column
after 30-day leaching with different of pH of lecahants.
The electrical conductivity (EC) and cation exchange capacity (CEC) remain unchanged throughout the study
period, with value of ~ 2.0 mS/cm and < 2.0 cmol+ /kg soil, respectively. The CEC value was extremely low, which
is typical for the sandy texture soil. The available P showed no significant difference before and after the PG
organic treatment. Total C significantly increased from 1.7 to 3.47% after PG organic application; however, total
N and S showed the opposite trend.
The content of cytotoxic metal ions As, Cd, Cr, Pb, Hg and Se in soil after PG organic application did not show
a significant increase from the metal ion contents before PG organic applications throughout the study period
(Supplementary data available—IV). All values were well below the target values stipulated in the New Dutch
List35. Phytotoxic metals showed a significant (p < 0.05) increase in Zn and Mn contents, but not B. Zinc and Mn
Scientific Reports | (2021) 11:15234 | https://doi.org/10.1038/s41598-021-93704-9 11
Vol.:(0123456789)www.nature.com/scientificreports/
are plant micronutrients normally added to fertilizer as trace elements to improve plant growth and yield. The
Zn content in the soil was lower than the target values provided by the New Dutch List35. For the content of other
metals, such as Ce, Sr and La showed significantly higher contents in the maximum PG organic treatment at the
second harvest compared to the baseline data but decreased significantly at the third harvest.
PG organic application effect on water. The pH values of surface water and water in the boreholes were
acidic (Supplementary data available—V). The pH of water in the borehole was within Class IV of the National
Water Quality S tandard37. The pH of surface water was below the Class IV range in the NWQS standard. Other
in situ parameters fluctuated during different sampling times. This in situ parameter could be influenced by
the amount of water in the borehole and stream due to changing seasons and the rising and falling of the tide.
The salinity and EC readings in the boreholes were lower than the limit in the Class IV standard. Surface water
recorded a high EC reading at the baseline compared to the Class IV standard. A high DO reading of more than
3 mg/L indicated that both boreholes and surface water were much better than Class IV in the NWQS standard.
The cation contents (Al, Ca, Mg and K) in the surface water and in the boreholes varied significantly with
time of sampling. Metal ion contents in water were separated between the boreholes and surface water (Sup-
plementary data available—V). This was to give a better data comparison to their respective values before PG
organic application.
Concentrations of cytotoxic metal ions, As, Cd, Cr, Pb, Hg, and Se in water boreholes were generally signifi-
cantly lower than those in the surface water (Supplementary data available—V). Their concentrations fluctuated
with the time of sampling. All values were lower than the target value stipulated in the Malaysian Standard for
Raw Drinking Water Quality37. Phytotoxic metal ions, Zn, Mn, and B concentrations fluctuated with the time
of sampling. The contents of these metal ions in the boreholes were significantly lower than in the surface water.
Their contents in the borehole water were not significantly different with the baseline data and lower than the
target values in the Malaysian Standard for Raw Drinking Water Quality40. The other metal ions concentrations
in boreholes also fluctuated with the time of sampling. Their concentrations in the boreholes were significantly
lower than in the surface water.
PG organic application effect on plant nutrition. Ions related to plant nutrients, such as macronu-
trients in control plants (Supplementary data available—VI) showed a significantly higher content (p < 0.05)
or were not significantly different (p > 0.05) from the PG organic treated plant. Total N, C, and S contents also
showed a similar level in treated and control plants. The macronutrient contents in corn grains treated with PG
organic were not significantly different (p > 0.05) or significantly lower than (p < 0.05) the control (Supplemen-
tary data available -VI). Carbon, N and S follow a similar pattern. There were significant increases in K and P in
the third harvest season compared to the second harvest season.
For cytotoxic metal ions, As, Cd, Cr, Pb, Hg and Se contents in plants treated with PG organic were not signifi-
cantly different or significantly lower than (p < 0.05) the control (Supplementary data available—VI). Phytotoxic
metal ions B, Zn, and Mn in plants treated with PG organic were significantly lower or not significantly different
compared to the control plants. There was no significant difference in the contents of other metal ions between
the plants treated with PG organic and the control plants.
Cytotoxic metal ions As, Cd, Pb, Cr, Hg and Se in the corn grain recorded a low value compared to the limit
stipulated in the Malaysian Food Act38 and Food Regulation39 standards (Supplementary data available—VI).
Phytotoxic metal ions B, Mn and Zn in the plots treated with PG organic were significantly higher than the con-
trol. Concentrations of the other metal ions were low, and in general, the contents of metal ions in grain from
plots treated with PG organic were significantly lower (p < 0.05) than the control.
PG organic application effect on natural radioactivity of soil. The analysis revealed that the radio-
activity concentrations of 226Ra, 228Ra, and 40K in all concentrations in Malaysia’s samples (Supplementary data
available—VII) were found to be much lower than the average soil (226Ra = 67.0 Bq/kg; 226Ra = 82.0 Bq/kg;
238
U = 66 Bq/kg; and 232Th = 82.0 Bq/kg), as reported by the United Nations Scientific Committee on the Effect of
Atomic Radiation 54. There were variations in the concentrations of 226Ra, 228Ra and 40K in soil before and after
the application of PG organic for each season, however, there were no significant differences (p > 0.05) in the
natural radionuclide concentrations due to the PG organic treatment.
PG organic application effect on natural radioactivity of water. The activity concentrations of
226
Ra, 228Ra and 40K in water were fluctuated for each location (Supplementary data available—VIII). In general,
the activity concentration of 228Ra for both seasons ranged from 0.3 to 3.9 Bq/L and 0.6 to 3.9 Bq/L, respectively.
However, concentrations of natural radionuclides in samples for each sampling point (BH1 to BH5), showed
there were no significant differences (p > 0.05) in 226Ra, 228Ra and 40K concentrations in water for both seasons.
PG organic application effect on natural radioactivity of plant. There was a significant difference in
the activity concentration for 40K in Guinea grass (2nd season) and kenaf (3rd season) between the control sam-
ple and treated sample (PG organic sample) (Supplementary data available—IX). The average concentrations of
40
K in the control samples for Guinea grass leaf (2nd season) and kenaf stem (3rd season) were recorded to be
19.9 ± 8.5 and 44.8 ± 3.1 Bq/kg, respectively. On the other hand, the average activity concentrations of 40K in the
samples treated with PG organic (Guinea grass leaf and kenaf stem) increased to 225.3 ± 1.2 and 111.7 ± 1.2 Bq/
kg, respectively. In addition, most plant samples contain higher 40K concentrations compared to the concentra-
tions of 40K in soil.
Scientific Reports | (2021) 11:15234 | https://doi.org/10.1038/s41598-021-93704-9 12
Vol:.(1234567890)www.nature.com/scientificreports/
Parameter Value
Moisture (%) 13.79 ± 0.052
pHwater (1:2.5) 7.16 ± 0.012
Conductivity (mS/cm) 4.96 ± 0.058
Cation exchange capacity (CEC) (cmol+/kg) 24.31 ± 2.325
Exchangeable Ca 65.60 ± 5.205
Exchangeable K 14.82 ± 1.209
Exchangeable Mg 51.04 ± 5.074
Exchangeable Na 1.85 ± 0.010
Nitrogen (%) 1.29 ± 0.027
Phosphorus (%) 2.62 ± 0.143
Potassium (%) 2.24 ± 0.030
Calcium (%) 9.56 ± 0.598
Magnesium (%) 2.99 ± 0.022
Water soluble P (mg/kg) 154.67 ± 12.837
Aluminium (%) 0.74 ± 0.056
Boron (%) 0.02 ± 0.003
Copper (%) 0/01 ± 0.001
Ferum (%) 5.93 ± 0.345
Manganese (%) 0.17 ± 0.007
Zinc (%) 0.04 ± 0.003
Arsenic (mg/kg) 1.51 ± 0.083
Cadmium (mg/kg) 0.33 ± 0.01
Cobalt (mg/kg) 1.64 ± 0.024
Chromium (mg/kg) 21.84 ± 3.90
Mercury (mg/kg) nd
Molybdenum (mg/kg) 1.26 ± 0.089
Nickel (mg/kg) 106.85 ± 1.14
Lead (mg/kg) 53.58 ± 3.03
Selenium (mg/kg) 3.34 ± 0.45
Table 2. Chemical characteristics of PG organic. MS ISO/IEC 1702; nd = not detected.
Discussion
The dissolution of PG organic releases ions into soil solution. At equilibrium, the concentration of ions released
into solution are in congruent to the chemical composition of the PG organic. The dissolution of PG organic
depends on the characteristics of PG organic, the soil properties, and characteristics of solvent. The ions released
may be adsorbed to the soil particles or organic materials, such as humic acid components and/or absorb by
plant through the root systems and transported to the organs, such leaf and fruit. Any ions are not adsorbed and
absorbed are subjected to leaching losses through the soil profile to the underground water, river and finally to
the sea. Therefore, the mode(s) of ions released and their movements in the soil, water and plant ecosystems are
very important aspect in assessment of PG organic for agricultural usage.
In general, PG organic comprises mainly gypsum (Calcium sulfate hydrate) (PDF 00-033-0311) and deploy
the monoclinic geometry (SG: C2/C, 15) as confirmed by Powder X-ray diffraction (PXRD) diffractogram (Sup-
plementary data available—I). The presence of sulfur, carbon, magnesium, and thorium are indicated in this
XRD diffractogram. Thorium is in the form of Th O2, which has a cubic geometry (SG: Fm3m) with the lattice
constants a = 5.597 Å; and concur to the reported value in literature for bulk Th
O2 (PDF00-042-1462). Chemically,
PG organic is a natural compound with pH about 7 and electrical conductivity (5.0 mS/cm) of about ten-fold
lower than the sea water. The macro-nutrients such as P, Ca, and micro-nutrients Zn, Cu, B, Co, Mn and Mo are
important for plant growth and development; and other metal ions contributed to soil and water contamination
and plant and human toxicity are detected at very low levels (Table 2).
The ions released from PG organics vary with the acidity of leachants used and the extent of dissolution vary
with time for each ion (Fig. 5). For instance, Sr, Cr, Th and Pb did not dissolve at any time at the pH of leachants
< 5.6. Though existed variations between the ions and pH of leachants during this experiment, the quantity of
ions released from PG organic showed that most ions were released at about 40% or more occurred at pH of
leachants between 1.2 and 4.6 (Table 3). In contrast, Th was almost not dissolved at all at pH of most common soil
at about 5.6. The solubility of ions in the present study are related to the water solubility and chemical reagents
used (Supplementary data available—X) to estimate suitability of PR fertilizer for used in direct application for
several countries22.
Scientific Reports | (2021) 11:15234 | https://doi.org/10.1038/s41598-021-93704-9 13
Vol.:(0123456789)www.nature.com/scientificreports/
Elements Quantity Applied Quantity Dissolved Dissolution of elements# pH of leachant
mg mg %
P 73.50 48.64 66.18 pH 1.2
Ca 848.05 623.53 73.52 pH 3.6
Mg 224.25 100.72 44.91 pH 4.6
Cu 1.02 0.78 76.47 pH 1.2
Fe 224.00 121.62 54.29 pH 1.2
Mn 13.65 9.95 72.88 pH 3.6
Zn 1.75 0.87 49.93 pH 1.2
Al 757.87 334.43 44.13 pH 1.2
Sr 946.05 2.401 0.25 pH 1.2
Cr 0.38 0.144 37.96 pH 1.2
Th 0.87 0.005 0.54 pH 5.6
Pb 1.46 0.726 49.77 pH 1.2
Table 3. Amount of PG organic applied, and percentage dissolved at the end of leaching. # D = QD/QA × 100%,
where: D = % of element dissolved, QD = quantity dissolved, QA = quantity applied; QD = cumulative quantity
dissolved at day 30 in amended column minus the cumulative quantity dissolved at day 30 in control expressed
in mg; QA = calculated total amount of elements in the PG organic applied to each column expressed in mg.
The pattern of ions mobility in the soil column during this study supported the view that most of easily dis-
solved ions were translocated more at a deeper depth of soil column (e.g., P, Ca and Mg) and in contrast the less
dissolved accumulated at the lower or in in the middle (e.g., Al and Th) of soil column depth (Fig. 6).
Under field evaluation, PG organic treated plots were subjected to plant growing condition and weather con-
dition, especially rainfall. Any ions released excess than the plant requirement is subjected to migration to the
underground water table. Most of the soil chemical properties remain consistent throughout this study period
as compared to standard value used for comparison of soil (Supplementary data available—IV). However, a
significant increase in C from 1.7 to 3.4% was observed in the PG organic treated plot attributed to the addition
of organic matter in PG organic. However, total N and S showed the opposite trend, since these two elements
are normally required by plant for growth and development.
The application of PG organic to the experimental plot could influence the metal ion concentrations in the
boreholes but it had not influenced the metal ion contents in the river though the experimental site proximity
to the river (Supplementary data available—V). Any changes in metal ion contents in the river were a direct
contribution of the natural input and anthropogenic input from the surrounding environment. Evidence from
the data gathered in this monitoring program showed that the application of PG organic did not accumulate
and contaminate the borehole water.
The concentration of ions for plant nutrition and other metal ions showed no significant difference between
control and in plot treated with PG organic during the period of this study (Supplementary data available—VI).
However, ability of plant absorbs those ions are critical in the assessment of plant uptake of metal ions in edible
parts, such as grain. Since, dissolved ions are absorbed by the root systems and transported to the other organs
for growth and development, and for yield. The corn grain in the experimental plot treated with PG organic
showed BAC values of less than 1, except for B and Mn (Table 3). This suggests that all metal ions do not have
the potential to be accumulated in the plant. In contrast B and Mn have a BAC of more than 1, indicating very
active uptake. These metal ions are micronutrients normally required by plants for their growth and development.
Contamination of soil is indicated by the I-geo index. The I-geo index showed that all metal ions in this site
are in grade 0 (Table 4). This suggests that a sandy soil used at these experimental plots treated with PG organic
were not contaminated. The CF values of all the metal ions in the study area were low (< 1) indicating that there
was no increase of metal ions in the soil. In addition, the PLI values for all metal ions were very low, indicating
that the soils were not polluted by the application of PG organic.
Addition of PG organic to soils in the study area to enhance the growth and development and yield was proved
to have no effect on the metal’s ion accumulation in soils. The experimental site pollution indices showed low
values of I-geo, CF, and PLi. Subsequently, low BAC value in plant supports the hypothesis that the application
of PG organic to the sandy soil deos not increase metal ions in plant or grain.
Since PG organic is derived from a mixture of WLP: NUF from rare-earth processing plant and organic mate-
rials, there is a possibility of radionuclides elements present in the PG by-products. The natural radioactivity of
soil as measured by the concentration of 226Ra, 228Ra, and (Supplementary data available—VII) showed there was
no significant difference between the plot treated with PG organic and control for the different season. The com-
parison between the previous studies performed in Malaysia showed that the results obtained in this study were
in the normal range (Supplementary data available—VII). In Malaysia, the paddy soils values were 83.6 ± 40.4
for 226Ra, 108.1 ± 28.4 for 228Ra and 403.8 ± 224.8 for 40K Bq/kg. However, the respective values were slightly
higher than reported in Egypt’s s oil55. The differences in natural radionuclide concentrations in soil are related
to several factors, such as geographical factors and geological conditions, as well as to the extent that fertilizer is
used on the land in the agricultural industry 56. Prolong usage of fertilizer in the paddy soil in Malaysia attributed
to the higher of these values as compared to the other soils. In addition, this study showed 40K had the highest
Scientific Reports | (2021) 11:15234 | https://doi.org/10.1038/s41598-021-93704-9 14
Vol:.(1234567890)www.nature.com/scientificreports/
Metal Treatment plot Notes
As
BAC 0.19 Moderate
I-geo −2.89 Uncontaminated
CF 0.20 low CF
Cd
BAC 0.75 Moderate
I-geo −1.38 Uncontaminated
CF 0.58 low CF
Pb
BAC 0.05 Low
I-geo −0.36 Uncontaminated
CF 0.45 low CF
BAC 0.03 Low
I-geo −3.86 Uncontaminated
CF 0.10 low CF
Se
BAC 0.00 Weak
I-geo 0.00 Uncontaminated
CF 0.00 low CF
Zn
BAC 0.61 Moderate
I-geo −3.08 Uncontaminated
CF 0.18 low CF
Mn
BAC 1.76 Active
Igeo −4.29 Uncontaminated
CF 0.07 low CF
B
BAC 20.88 Active
Igeo −6.87 Uncontaminated
CF 0.01 low CF
PLI 0.25 Not polluted
Table 4. Biological accumulation coefficients of metal ions in grains and soil contamination levels following
treatment with PG organic in the experimental plots.
concentrations compared to 226Ra and 228Ra. The higher 40K was ascribed to K as water soluble nutrient that tends
to dissolve and accumulate on the soil surface 56. Since 40K is not from the uranium or thorium decay series57, its
concentrations in soil do not contribute significantly to the total radioactive concentration in soil. Potassium-40
exists in nature, but the activity concentration may increase due to the use of fertilizer in agriculture.
The activity concentrations of 226Ra, 228Ra and 40K in water recorded from this study (Supplementary data
available—VIII) were lower than the levels reported by Almayahi et al.45 in water samples sampled along the
Northern Peninsula of Malaysia. The present study suggests that there was no leaching of the radionuclides from
soil to groundwater. The activity concentrations of 226Ra, 228Ra and 40K in groundwater depended greatly on the
type of minerals derived from aquifer rocks and soil c ompounds58. In addition, the surface water analysis from
the nearest river also suggested that there is no accumulation (discharge) of natural radionuclides in the water
due to the application of PG organic. This result is also in agreement to the concentration of metal ions measured
in the water bore hole and the surface water samples (Supplementary data available—V).
Natural activity in plant and grain showed the results (Supplementary data available—IX) agree to previous
studies59–63. This is not the expected result, since the activity concentrations of 40K in the soil samples treated
with PG organic were much lower than the concentrations of 40K in the plant samples. The increases in the 40K
concentration in plants (compared to the soil) might be contributed by other or additional sources, such as ferti-
lizers, pesticides, or herbicides rather than PG organic. It should be noted that the uptake mechanism will differ
for each plant species. Several factors, such as the kinetic parameters of plants to absorb specific radionuclides,
metabolic behavior as well as plant tolerance for a specific radionuclide will influence the uptake of radionuclides
by plants64. In addition, International Atomic Energy Agency, I AEA65 reported that the level of radioactivity
concentrations for 226Ra and 238U in NPK fertilizer can reach up to 450 and 1280 Bq/kg, respectively. Therefore,
further investigation is recommended to verify the sources that contribute to the increase of 40K in plants.
Though some variations were observed in the natural activity in the soil, however, the calculated radiological
hazard index as measured by Raeq for soil was much lower than the 370 Bq/kg, a recommended limit of R aeq in
Scientific Reports | (2021) 11:15234 | https://doi.org/10.1038/s41598-021-93704-9 15
Vol.:(0123456789)www.nature.com/scientificreports/
Transfer factor soil-to-plants
226
Ra 228
Ra 40
K
Season Sample Raeq Bq/kg Note
Kenaf-Soil-Control 43.2 0.54 0.08 2.88 This research
Kenaf-Soil-PG organic 46.6 0.71 0.03 5.34
2nd season Guinea grass-Soil-Control 44.7 0.10 0.01 0.30
Guinea grass -Soil-PG organic 67.0 0.12 0.01 3.75 This research
Kenaf-Soil-Control 42.7 0.70 0.05 0.85
Kenaf-Soil-PG organic 50.7 0.42 0.01 2.12
3rd season Guinea grass -Soil-Control 41.3 0.50 0.12 6.98
Guinea grass -Soil-PG organic 45.0 0.28 0.02 3.54
72
Rice (Malaysia) – 0.04–0.20 0.02–0.15 0.09–4.14
73
Rice (Malaysia) 9.9–27.7 0.01–0.40 0.01–0.60 0.10–1.30
74
Vegetables – 0.08–0.93 0.15–0.56 1.27–3.7
67
Vegetables (Malaysia) – 0.03–0.09 0.001–0.01 1.59–5.20
55
Soya bean (Egypt) – 0.21–0.57 – 0.95–2.52
69
Sesame and cowpea – 0.25—0.56 – 1.04–1.54
45
Peninsular of Malaysia 63.2–414.4 – – –
Table 5. Radium equivalent and soil-to-plant transfer factor obtained in this study.
soil (Table 5). For non-hazardous materials, the calculated R aeq should not exceed a maximum value of 370 Bq/
kg for s oil66. Therefore, the radiological concern due to the 226Ra, 228Ra and 40K in soil can be ignored; hence, PG
organic is suitable for agriculture applications. The TFs of 226Ra, 228Ra, 238U, 232Th and 40K obtained in this study
were comparable to those observed in several types of plants from other studies (Supplementary data available
-IX). The highest radionuclide TF was 40K, which ranged from 0.85 to 6.98. Minor dissimilarities of the TF among
the samples were perhaps due to transport processes as well as different absorption capacities of the plants i tself67.
It may also depend on the type of soil, soil texture, clay content, pH and organic matter c ontent68.
Conclusion
Both the phosphate fertilizer industry and a rare-earth processing facility are witnessing tremendous growth
worldwide PG by-products, commonly stacked near their processing plants. For these by-products to be used
in agriculture’s field, it must be proven not to have an adverse effect to the soil, water, and plant ecosystems. The
ions released from PG organic under laboratory conditions showed that depends on the acidity of the lechant
used. The pattern of ion ions released differed greatly under the same pH condition. Most ions are released under
a very acid pH < 4.6 but less at the pH for optimum growth (pH 5.5 to 6.5). This is an ideal prevailing condition
under field situation. Under field condition, the metal ion contents in borehole were significantly lower than the
their contents in surface water. Metal ion contents in the borehole after PG organic application were below the
target value standard in the Malaysian Standard for Raw Drinking Water Quality. Metal ion contents in soil in the
plot treated with PG organic were significantly lower or not significantly different compared to the control. All
metal ions concentrations were below the target values stipulated in the new Dutch list. Metal ion concentrations
in the corn grain were lower than the standards in the Malaysian Food Act and Food Regulation.
The analysis of the naturally occurring radionuclide concentrations in soil samples indicated that the radio-
activity concentrations of 226Ra, 228Ra, and 40K in all samples were much lower than their average concentrations
in most soils as reported by United Nations. The determined radioactivity concentrations of 226Ra, 228Ra and 40K
were also comparable to those published values in the literature. The analysis of the natural radioactivity con-
centration in several plants also showed that the results obtained in this study were comparable with those other
studies. The analysis of the groundwater indicated that no leaching of the radionuclides from soil to groundwater
occurred. In addition, the analysis of the surface water (nearest river) suggested that no accumulation (discharge)
of natural radionuclide due to the application of PG organic occurred in the surface water. The calculated R aeq
for soil was less than the 370 Bq/kg recommended limit of R eq in soil.
Based on these findings, it can be concluded that the application of PG organic had no impact on the envi-
ronment (in soil and plants) at the studied location. The BAC, CF, I-geo and PLI showed that there was no
accumulation of metal ions in grain, and no contamination and no pollution occurred in borehole water and
the BRIS soil that received applications of PG organic. These data indicated that the use of PG organic as a soil
conditioner in sandy soil is safe for the soil–plant-water ecosystem.
Received: 13 December 2020; Accepted: 28 June 2021
References
1. Lottermoser B. Mine Wastes: Characterization, treatment and environmental impacts. Springer, Berlin (2010).
Scientific Reports | (2021) 11:15234 | https://doi.org/10.1038/s41598-021-93704-9 16
Vol:.(1234567890)You can also read