Wind Energy For A Cleaner America II - Wind Energy's Growing Benefits for Our Environment and Our Health
←
→
Page content transcription
If your browser does not render page correctly, please read the page content below
Wind Energy For A Cleaner America II
  Wind Energy’s Growing Benefits for
   Our Environment and Our Health
Wind Energy For A
       Cleaner America II
   Wind Energy’s Growing Benefits for
    Our Environment and Our Health

                       Written by:

    Jordan Schneider and Tony Dutzik, Frontier Group

Rob Sargent, Environment America Research & Policy Center

                        Fall 2013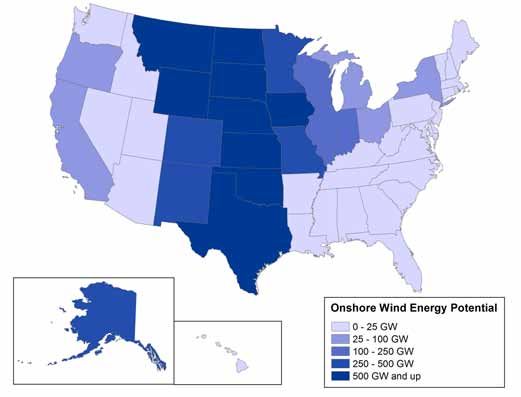
Acknowledgments
The authors thank Jeff Deyette and Michelle Davis of the Union of Concerned Scientists, Emily
Williams and Elizabeth Salerno of the American Wind Energy Association, David Carr of the Southern
Environmental Law Center, Catherine Bowes of the National Wildlife Federation, Jonathan Peress of the
Conservation Law Foundation, and Cai Steger of the Natural Resources Defense Council for providing
useful feedback and insightful suggestions on drafts of this report. We also thank Elizabeth Ridlington
at Frontier Group for providing editorial support.
Environment America Research & Policy Center thanks the New York Community Trust and the John
Merck Fund for making this report possible.
The authors bear responsibility for any factual errors. The recommendations are those of Environment
America Research & Policy Center. The views expressed in this report are those of the authors and do
not necessarily reflect the views of our funders or those who provided review.
© 2013 Environment America Research & Policy Center
Environment America Research & Policy Center is a 501(c)(3) organization. We
are dedicated to protecting our air, water and open spaces. We investigate
problems, craft solutions, educate the public and decision-makers, and help
the public make their voices heard in local, state and national debates over the
quality of our environment and our lives. For more information about Environment America Research
& Policy Center or for additional copies of this report, please visit www.environmentamericacenter.org.
Frontier Group conducts independent research and policy analysis to support a cleaner, healthier
and more democratic society. Our mission is to inject accurate information and compelling ideas into
public policy debates at the local, state and federal levels. For more information about Frontier Group,
please visit www.frontiergroup.org.
Layout: To the Point Publications, www.tothepointpublications.com
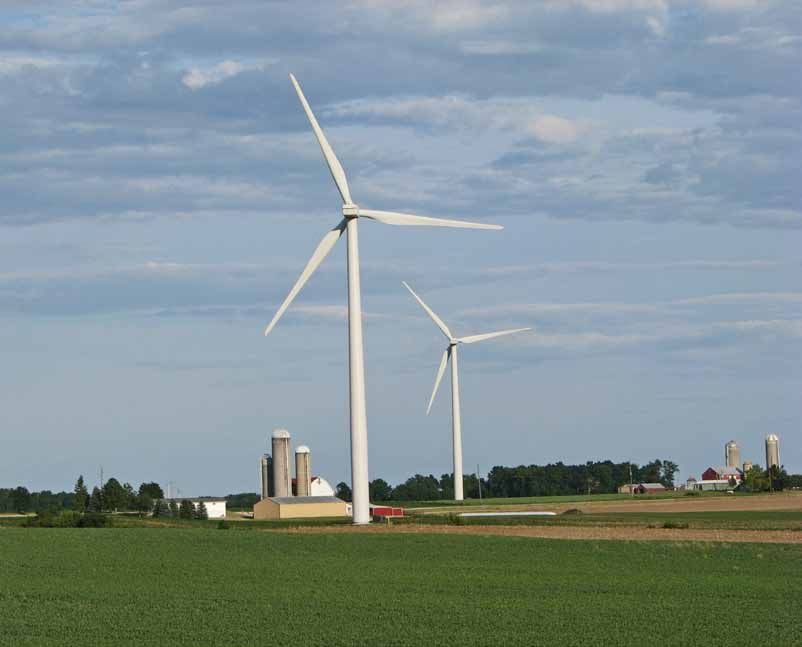
Cover photo: Forward Wind Energy Center in Wisconsin by Ruth Baranowsky, NREL 21206.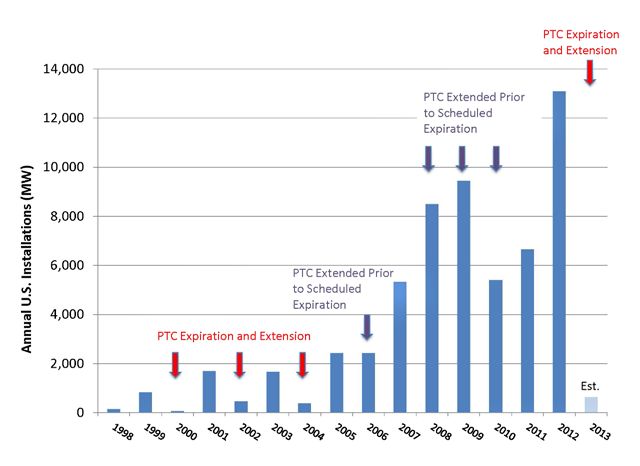
Table of Contents
Executive Summary . . . . . . . . . . . . . . . . . . . . . . . . . . . . . . . . . . . . . . . . . . . . . 4
Introduction . . . . . . . . . . . . . . . . . . . . . . . . . . . . . . . . . . . . . . . . . . . . . . . . . . . . 7
Wind Energy Is Growing Rapidly in The U.S. . . . . . . . . . . . . . . . . . . . . . . . . 8
Power Plants Damage the Environment . . . . . . . . . . . . . . . . . . . . . . . . . . . . 9
     Power Plants Are America’s Leading Source of Global Warming Pollution . . . . . . . . . . . . . . . .9
     Power Plants Use Lots of Water  . . . . . . . . . . . . . . . . . . . . . . . . . . . . . . . . . . . . . . . . . . . . . . . . . . . . . . . 11
     Power Plants Create Harmful Air Pollution . . . . . . . . . . . . . . . . . . . . . . . . . . . . . . . . . . . . . . . . . . . . .11

Wind Energy Reduces Pollution and Saves Water . . . . . . . . . . . . . . . . . . . 13
     America Stands to Benefit Further if We Continue to Expand Wind Power  . . . . . . . . . . . . . . 14

America Should Continue to Invest in Wind Energy . . . . . . . . . . . . . . . . 16
Methodology . . . . . . . . . . . . . . . . . . . . . . . . . . . . . . . . . . . . . . . . . . . . . . . . . . . 19
Appendix A. Current and Possible Future Wind Generation by State . . .  23
Appendix B. Carbon Dioxide Emissions Avoided by Wind Energy . . . . 24
Appendix C. Water Consumption Avoided with Wind Energy  . . . . . . . . 26

Appendix D. Nitrogen Oxide and Sulfur Dioxide Emissions
Avoided with Wind Energy . . . . . . . . . . . . . . . . . . . . . . . . . . . . . . . . . . . . . . . 28
Notes  . . . . . . . . . . . . . . . . . . . . . . . . . . . . . . . . . . . . . . . . . . . . . . . . . . . . . . . . . 30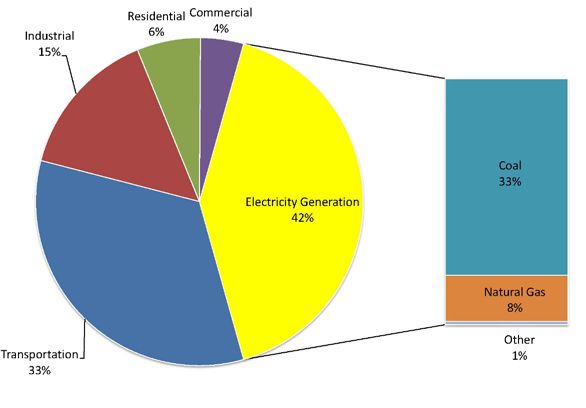
Executive
Summary

B
        urning fossil fuels to generate electricity pol-                            Wind energy displaced about 84.7 million metric
        lutes our air, contributes to global warming,                               tons of carbon dioxide emissions in 2012—more
        and consumes vast amounts of water—harm-                                    global warming-inducing carbon dioxide pollu-
ing our rivers and lakes and leaving less water for                                 tion than is produced annually in Massachusetts,
other uses. In contrast, wind energy produces no air                                Maryland, South Carolina or Washington state.
pollution, makes no contribution to global warming,                                 Wind energy also saves enough water nationwide
and uses no water.                                                                  to meet the domestic water needs of more than a
                                                                                    million people.
America’s wind power capacity has quadrupled in
the last five years and wind energy now generates                                   America has vast wind energy resources, and there
as much electricity as is used every year in Georgia.                               is still plenty of room for growth. But the pending
Thanks to wind energy, America uses less water for                                  expiration of the federal renewable energy produc-
power plants and produces less climate-altering                                     tion tax credit and investment tax credit threatens
carbon pollution.                                                                   the future expansion of wind power. To protect the

                                Figure ES-1. Growth in Electricity Generated by Wind Power1

4  Wind Energy for a Cleaner America II: Wind Energy’s Growing Benefits for Our Environment and Our Health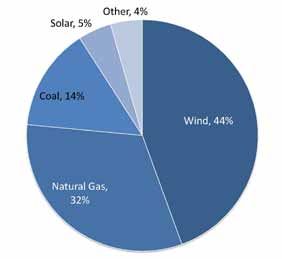
environment, federal and state governments should          wildlife, recreation or domestic use. More water
continue and expand policies that support wind             is withdrawn from U.S. lakes, rivers, streams and
energy.                                                    aquifers for the purpose of cooling power plants
                                                           than for any other purpose.
Wind energy is on the rise in the United States.
                                                         • Avoid 79,600 tons of nitrogen oxide (NOX)
• Electricity generated with wind power quadrupled         and 98,400 tons of sulfur dioxide emissions.
  in the last five years, from about 34,500 gigawatt-      Nitrogen oxides are a key ingredient of smog,
  hours (GWh) in 2007 to more than 140,000 GWh at          which contributes to asthma and other respira-
  the end of 2012—or as much electricity as is used        tory problems; power plants are responsible for
  each year in Georgia. (See Figure ES-1.)                 about 15 percent of the nation’s total nitrogen
                                                           oxide (NOX) pollution each year. Power plants also
• Wind energy was the largest source of new
                                                           produce about 60 percent of all sulfur dioxide
  electricity capacity added to the grid in 2012.
                                                           pollution, which contributes to acid rain. Finally,
• Nine states now have enough wind turbines to             coal-fired power plants emit heavy metals such
  supply 12 percent or more of their annual electric-      as mercury, a potent neurotoxicant that can
  ity needs in an average year, with Iowa, South           cause developmental and neurological disorders
  Dakota and Kansas now possessing enough wind             in babies and children. Nearly two-thirds of all
  turbines to supply more than 20 percent of their         airborne mercury pollution in the United States
  annual electricity needs.                                in 2010 came from the smokestacks of coal-fired
                                                           power plants.
By displacing dirty electricity from fossil fuel-
fired power plants, wind energy saves water and          If America were to continue to add onshore wind
reduces pollution. In 2012, wind energy helped           capacity at the rate it did from 2007 to 2012, and
the United States:                                       take the first steps toward development of its
                                                         massive potential for offshore wind, by 2018 wind
• Avoid 84.7 million metric tons of carbon               energy will be delivering the following benefits:
  dioxide pollution—or as much pollution as is
  produced by more than 17 million of today’s            • Averting a total of 157 million metric tons of
  passenger vehicles in a year. Fossil fuel-fired          carbon dioxide pollution annually—or more
  power plants are the nation’s largest source of          carbon dioxide pollution than was produced by
  carbon dioxide, the leading global warming pollut-       Georgia, Michigan or New York in 2011.
  ant. In the United States, warmer temperatures
                                                         • Saving enough water to supply the annual domes-
  caused by global warming have already increased
                                                           tic water needs of 2.1 million people—roughly
  the frequency and severity of heat waves and
                                                           as many people as live in the city of Houston and
  heavy downpours, resulting in more intense
                                                           more than live in Philadelphia, Phoenix or San
  wildfires, floods, droughts, and tropical storms and
                                                           Diego.
  hurricanes.
                                                         • Averting more than 121,000 tons of smog-forming
• Save enough water to supply the annual
                                                           nitrogen oxide pollution and 194,000 tons of sulfur
  domestic water needs of more than a million
                                                           dioxide pollution each year.
  people. Power plants use water for cooling, reduc-
  ing the amount of water available for irrigation,

                                                                                                Executive Summary   5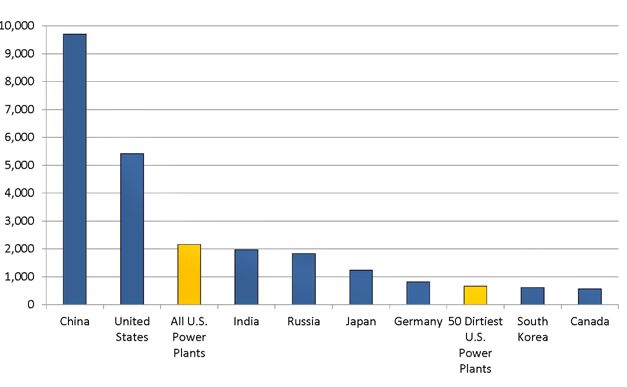
Wind energy’s success in reducing air pollution                                     • Strong renewable electricity standards. A strong
and saving water will continue to grow if America                                     renewable electricity standard (RES) helps support
makes a stable, long-term commitment to clean                                         wind energy development by requiring utilities to
energy at the local, state and national levels.                                       obtain a percentage of the electricity they provide
Specific policies that are essential to the develop-                                  to consumers from renewable sources. These
ment of wind energy include:                                                          standards help ensure that wind energy produc-
                                                                                      ers have a market for the electricity they generate
• The federal renewable energy production tax
                                                                                      and protect consumers from the sharp swings
  credit (PTC) and investment tax credit (ITC). The
                                                                                      in energy prices that accompany over-reliance
  PTC provides an income tax credit of 2.3 cents per
                                                                                      on fossil fuels. Today, 29 states have renewable
  kilowatt-hour (kWh) for utility-scale wind energy
                                                                                      electricity standards—other states and the federal
  producers for 10 years, while the ITC covers up to
                                                                                      government should follow their lead.
  30 percent of the capital cost of new renewable
  energy investments. Wind energy developers can                                    • Continued coordination and collaboration
  take one of the two credits, which help reduce                                      between state and federal agencies to expedite
  the financial risk of renewable energy investments                                  siting of offshore wind facilities in areas that
  and create new financing opportunities for wind                                     avoid environmental harm.
  energy. Both the ITC and the PTC, however, are
  scheduled to expire at the end of 2013.

6  Wind Energy for a Cleaner America II: Wind Energy’s Growing Benefits for Our Environment and Our Health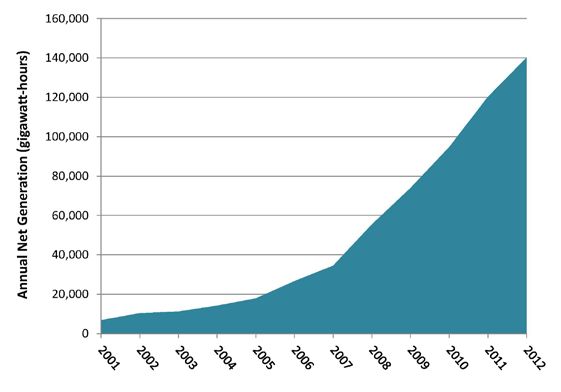
Introduction

F
       rom the Pacific Coast to the Great Plains to       The boom in wind power is no accident, however.
       the Atlantic Ocean, wind power is on the rise      State and federal policy-makers have implemented
       in the United States, producing an increasing      far-sighted public policies that have created the
share of our electricity with minimal impact on the       conditions under which wind energy can thrive. By
environment.                                              unleashing the energies of innovative companies and
                                                          American workers, and tapping the natural power of
Just a decade ago, wind energy was a trivial part of
                                                          the wind, these public policies are moving the nation
the nation’s electricity picture. Today, wind energy is
                                                          toward a clean energy future and delivering growing
one of the fastest growing forms of electricity gen-
                                                          benefits for our environment and our health.
eration and an increasingly important part of the
nation’s energy mix.                                      With the environmental and economic advantages of
                                                          wind energy becoming ever more apparent, now is
The remarkable progress of wind energy is gen-
                                                          the time for our leaders to renew their commitment
erating real environmental results. Wind energy is
                                                          to the key public policies that will enable the nation
reducing demand for electricity from fossil fuels
                                                          to achieve even greater benefits in the years to come.
such as coal and natural gas—curbing emissions
that cause global warming while minimizing the use
of water for cooling.

                                                                                                     Introduction   7
Wind Energy Is Growing
Rapidly in The U.S.
W
ind energy is quickly becoming an impor- Figure 2. New Electricity Capacity Additions
tant part of the energy mix in the United by Technology, 20127
States. Nationwide, electricity generation
from wind power has quadrupled in the last five years,
from 34,500 GWh in 2007 to more than 140,000 GWh
in 2012—or as much electricity as is used each year in
the state of Georgia.2 (See Figure 1.) Nine states now
have enough wind turbines to produce 12 percent or
more of their annual electricity needs in an average
year—with Iowa, South Dakota and Kansas now having
enough wind energy capacity to produce 20 percent or
more of their annual electricity needs in a typical year.3
With more than 10,000 MW of new wind capacity in-
stalled in 2012, wind energy became the largest source
of new electricity generating capacity in the United
States last year—ahead of even natural gas, which electric generating capacity added to the grid in
added about 8,746 MW of new capacity.5 In 2012, wind the United States, making it the nation’s largest
energy accounted for more than 40 percent of the new source of new generating capacity.6 (See Figure 2.)
Employment in the wind industry has also grown
Figure 1. Growth in Electricity Generated by
significantly. In 2003, the wind industry directly
Wind Power4
employed 24,300 people.8 By 2012, that num-
ber had more than tripled to more than 80,000
people.9
As the wind industry has grown and technology
has advanced, the cost of wind energy has de-
clined. By 2013, these cost declines had led wind
energy to be competitive with other forms of
power generation. When the costs imposed by
emissions of global warming pollution are fac-
tored in, wind power is less expensive than new
coal-fired power plants and is competitive with
new natural gas power plants and even existing
coal-fired plants.10
8 Wind Energy for a Cleaner America II: Wind Energy’s Growing Benefits for Our Environment and Our HealthPower Plants Damage
the Environment
B Power Plants Are America’s
urning coal and natural gas to generate
electricity damages the environment by
Leading Source of Global
contributing to global warming, consuming
vast quantities of water, and creating health-threat- Warming Pollution
ening air pollution. Wind energy has none of these Fossil fuel-fired power plants are the nation’s
problems—it emits no air pollution and consumes largest source of carbon dioxide pollution,
little or no water. Generating clean electricity using the leading global warming pollutant.11 In
wind power reduces the need for dirty electric- 2011, power plants were responsible for 42
ity from fossil fuel-fired power plants, avoiding percent of all U.S. global warming pollution.12
millions of tons of harmful air pollution and saving (See Figure 3.)
millions of gallons of water.
Figure 3. Energy-Related Carbon Dioxide Emissions by Sector in the U.S., 2011,
with Electricity Generation Broken Down by Fuel13
Power Plants Damage the Environment 9Figure 4. 50 Dirtiest U.S. Power Plants Compared to Total Emissions from
Other Countries (MMT CO2)15
America’s power plants are also among the most Warmer average annual temperatures are connected
significant sources of carbon dioxide pollution in the to increases in extreme precipitation and more
world. For example, if the U.S. power sector were an intense heat waves.18 In the United States, extreme
independent nation, it would be the third-largest downpours now happen 30 percent more often
emitter of carbon dioxide pollution in the world, nationwide than in 1948, and the largest annual
behind China and the United States as a whole.14 A storms now produce 10 percent more precipitation
large share of those emissions come from just a small on average.19 Meanwhile, the number of heat waves
number of old, dirty coal-fired power plants. The in the United States has increased since 1960 while
carbon dioxide pollution coming from America’s 50 the projected time between prolonged dry spells
dirtiest power plants, for example, is greater than the has become shorter.20 The U.S. has also experienced
amount of pollution produced annually by the entire an increase in the frequency and severity of other
economies of South Korea or Canada. (See Figure 4.) extreme weather events, including floods, more
intense wildfires, and stronger tropical storms and
The United States is already feeling the impacts of
hurricanes.21
global warming. In the last 50 years the U.S. aver-
age annual temperature has risen 2° F, and experts Sea levels have risen eight inches along some parts
project that it will continue rising.16 Depending on of the U.S. coastline in the past 50 years. Rising seas
the scale of continued greenhouse gas emissions, erode shorelines—putting homes, businesses and
global average annual surface temperatures are likely infrastructure at risk—and can cause saltwater intru-
to increase by 0.5°F to 8.6 °F by 2100, according to the sion into coastal fresh water aquifers, leaving some
most recent assessment by the Intergovernmental unusable without desalination.22 According to the
Panel on Climate Change (IPCC).17 IPCC, sea levels are likely to rise 10 to 32 inches by the
10 Wind Energy for a Cleaner America II: Wind Energy’s Growing Benefits for Our Environment and Our Healthlate 21st century; in the worst case, sea levels could power plants can deplete groundwater supplies and
rise by as much as 38 inches.23 affect the ecosystems of the waterways on which they
depend. Fish and other aquatic life can be sucked into
Science tells us that these and other impacts are
power plant intakes, while the discharge of heated
expected to become more pronounced in the de-
water can also harm wildlife. Water discharged from
cades to come, unless we cut the dangerous carbon
a power plant can be 17 degrees hotter than it was
pollution that is fueling the problem. Increasing
when it was withdrawn for cooling.26 This hotter water
our production of wind power will help the United can affect the health and viability of the plants and
States make the emissions reductions necessary to animals living in the receiving waterway by subject-
forestall the worst impacts of global warming. ing organisms to water temperatures higher than they
are able to tolerate and by depriving the waterway
Power Plants Use Lots of Water of dissolved oxygen. A 2013 study estimated that half
of all power plant cooling systems discharge water at
Fossil fuel power plants use vast amounts of water temperatures that can harm aquatic life.27
for cooling.
Recirculating cooling systems withdraw less water
There are two ways to measure the use of water in from waterways and aquifers, but lose more of that
power plants. Withdrawals represent the amount of water to evaporation, potentially exacerbating local
water taken from waterways or groundwater for use water supply problems. Many regions of the United
in a power plant, regardless of whether that water States currently struggle to balance demands for water
is eventually returned to the river, lake or aquifer from industry, agriculture, and residential and com-
from which it came. More water is withdrawn from mercial users while maintaining sufficient water levels
U.S. lakes, rivers, streams and aquifers to cool power in rivers and streams to preserve healthy ecosystems.
plants than for any other purpose.24 Water con- Water consumption in power plants adds to those de-
sumption reflects the amount of water that is lost mands. In arid regions, power plants contribute to the
to a given watershed as a result of its use in power long-term drawdown of critical groundwater supplies.
plants, with losses primarily taking place through In the Southwest and California, approximately one-
evaporation. third to two-thirds of the water consumed by power
plants comes from groundwater.28
Almost all fossil fuel-fired power plants use water
for cooling, but different power plant technologies
have differing impacts on water supplies. Once- Power Plants Create Harmful Air
through cooling systems withdraw vast amounts of Pollution
water for cooling and return it—usually at a higher
temperature—to the waterways from which it Coal- and natural gas-fired power plants also produce
came. Recirculating systems use the same water for pollution that contributes to ozone smog, particulate
cooling multiple times, reducing withdrawals, but matter and acid rain. This pollution hurts public health
plants with recirculating systems typically consume and ecosystems.
more water than once-through systems due to
Each year, power plants are responsible for about 15
higher losses from evaporation.25
percent of the nation’s emissions of nitrogen oxides
Regardless of the type of cooling system used, wa- (NOX) – a key ingredient in ozone smog.29 When
ter use in power plants can create big problems for inhaled, ozone quickly reacts with airway tissues and
the environment. Large-scale water withdrawals for produces inflammation similar to sunburn on the
Power Plants Damage the Environment 11inside of the lungs. This inflammation makes lung Finally, nearly two-thirds of all airborne mercury tissues less elastic, more sensitive to allergens, and pollution in the United States in 2010 came from the less able to ward off infections.30 Minor exposure smokestacks of coal-fired power plants.35 Mercury is a to ozone can cause coughing, wheezing and throat potent neurotoxicant, and exposure to mercury dur- irritation. Constant exposure to ozone over time can ing critical periods of brain development can contrib- permanently damage lung tissues, decrease the abil- ute to irreversible deficits in verbal skills, damage to ity to breathe normally, and exacerbate or potentially attention and motor control and reduced IQ.36 even cause chronic diseases like asthma.31 Children, adults who are active outdoors, and people with existing respiratory system ailments suffer most from ozone’s effects. Particulate matter pollution also contributes to a host of respiratory and cardiovascular ailments. Sulfur di- oxide, too, is a respiratory irritant for sensitive popu- lations.32 It is also a major component of acid rain that has damaged forests across the eastern United States.33 Power plants are responsible for nearly 60 percent of U.S. sulfur dioxide pollution annually.34 12 Wind Energy for a Cleaner America II: Wind Energy’s Growing Benefits for Our Environment and Our Health
Wind Energy Reduces
Pollution and Saves Water

I
     n 2012, the United States generated 140,000         • Water savings of nearly 38 billion gallons, more than
     gigawatt-hours (GWh) of electricity from wind         enough to meet the annual domestic water needs
     power—or as much as electricity as was used in        of more than a million people (see Appendix C).40
the state of Georgia in 2011.37 (See Appendix A for a
                                                         • Reductions in air pollution, including reductions of
breakdown of wind power generation and its ben-
                                                           79,600 tons of nitrogen oxide emissions and 98,400
efits by state.)
                                                           tons of sulfur dioxide emissions (see Appendix D).41
Assuming that wind energy displaced generation
                                                         Texas reaps greater savings from wind energy than
from natural gas and coal-fired power plants, the en-
                                                         any other state, avoiding 19.3 million metric tons of
vironmental benefits of wind power in 2012 included:
                                                         carbon dioxide emissions annually, or about 8 percent
• Avoided emissions of 84.7 million metric tons of       of 2011 emissions from the state’s electric sector.42 (See
  carbon dioxide, the leading global warming pollut-     Figure 5 and Table 1, next page.) In addition, as the
  ant—as much as would have been emitted by 17.6         state recovers from the extreme drought in 2011 that
  million passenger vehicles in a year (see Appendix     caused major rivers run dry, wind power is averting
  B).38 That’s more than all the energy-related carbon   the consumption of at least 8.6 billion gallons of water
  dioxide emissions in Massachusetts, Maryland,          per year, enough to supply the domestic water needs
  South Carolina or Washington state in 2011.39          of more than 172,000 people.

        Figure 5. Top 10 States for Carbon Dioxide Emission Reductions from Wind Power in 2012

                                                                              Wind Energy Reduces Pollution and Saves Water   13
Table 1. Benefits of Wind Energy in Top 10 States, 2012
Wind Power Avoided Carbon Dioxide Water Saved (million
Generation (GWh) Emissions (million metric tons) gallons)
State
Texas 31,860,000 19.3 8,610
Iowa 13,945,000 8.4 3,769
California 9,937,000 6.0 2,685
Oklahoma 8,234,000 5.0 2,225
Illinois 7,708,000 4.7 2,083
Minnesota 7,529,000 4.6 2,035
Washington 6,688,000 4.0 1,807
Oregon 6,066,000 3.7 1,639
Colorado 6,045,000 3.7 1,634
North Dakota 5,316,000 3.2 1,437
Seven of the top ten wind power-producing states install nearly 11,000 GW of onshore wind capacity, and
are also on the list of states that suffered from areas another 4,200 GW of offshore wind capacity.45 (See
of extreme or exceptional drought in 2012.43 Collec- Figures 6 and 7.) That amount of wind capacity could
tively, wind power helped these seven states avoid produce nearly 49.8 million GWh of electricity annu-
consumption of 27.9 billion gallons of water at power ally—12 times the amount of electricity generated in
plants, enough to serve the annual domestic water the United States in 2012.46
needs of 773,000 people—or nearly all the residents
If the United States were to install wind energy be-
of Fort Worth.44
tween now and 2018 at the same pace that it did from
2007 to 2012, in five years, wind energy would help the
America Stands to Benefit Further United States:
if We Continue to Expand Wind • Avoid 157 million metric tons of carbon dioxide
Power pollution annually—or as much as that emitted
by 32 million of today’s passenger vehicles in a
From the wide plains of the Midwest to the river
year.49 That’s also more than all the energy-related
valleys of the Pacific Northwest to the shores of the
emissions of Georgia, Michigan or New York in
Atlantic Ocean, the United States has only scratched
2011.50
the surface of its vast wind energy potential. Tapping
just a fraction of this potential by maintaining and • Save enough water to supply the annual domestic
expanding America’s commitment to wind energy water needs of 2.1 million people—roughly as many
will produce even greater benefits. people as live in the city of Houston and more than
live in Philadelphia, Phoenix or San Diego.
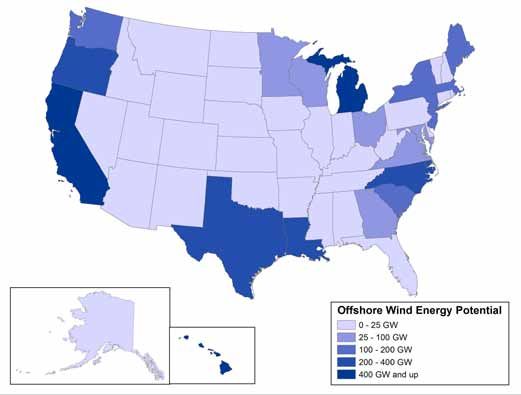
Wind turbines can be placed virtually anywhere the
wind blows. A 2012 report by the National Renew- • Averting more than 121,000 tons of smog-forming
able Energy Laboratory estimates that as a whole, nitrogen oxide pollution and 194,000 tons of sulfur
the United States has the technical potential to dioxide pollution each year.
14 Wind Energy for a Cleaner America II: Wind Energy’s Growing Benefits for Our Environment and Our HealthFigure 6: Onshore Wind Energy Technical Potential by State, 201247
Figure 7: Offshore Wind Energy Technical Potential by State, 201248
Wind Energy Reduces Pollution and Saves Water 15America Should Continue
to Invest in Wind Energy
A
merica’s clean energy boom is no accident. It projects are often capital intensive. Unlike fossil fuel
is the direct result of strong, forward-think- power plants, for which fuel costs represent a signifi-
ing policies adopted over the last decade cant share of the overall cost of producing power, the
at both the state and federal levels, policies that vast majority of the costs of building a wind turbine
have unleashed the energy of innovative companies or installing a solar panel are incurred before the first
and American workers to fuel dramatic growth in kilowatt-hour of electricity is produced. Public poli-
renewable energy. As wind energy and other forms cies that defray some of those initial capital costs, or
of clean, renewable energy take root in the United that help assure a reliable rate of return over the long
States—delivering ample benefits for our environ- term, can reduce the risk for investors—opening the
ment and economy—now is not the time to turn our floodgates for investment and the rapid expansion of
back on further progress. To further reduce global renewable energy.
warming pollution, curb smog and soot, move away
The PTC provides an income tax credit of 2.3 cents
from fossil fuels, save water, and grow our economy,
per kilowatt-hour (kWh) for utility-scale wind energy
the United States should make a long-term commit-
producers.51 It is available for electricity generated
ment to renewable energy with policies to support
during the first 10 years of the wind farm’s opera-
growth of the wind industry.
tion. After expiring at the end of 2012, the PTC was
Federal Tax Incentives renewed in January 2013 and will be available for all
projects that begin construction on or before Decem-
Two of the most important tools that have helped
ber 31, 2013.
grow the wind industry in the United States are the
federal renewable electricity production tax credit The investment tax credit (ITC) covers up to 30
(PTC) and the investment tax credit (ITC). percent of the capital cost of new renewable energy
investments, with the credit becoming available the
Policies such as the PTC and ITC recognize that
moment the wind energy system is placed into ser-
renewable energy is a key component of an electric-
vice. The ITC also expires on December 31, 2013.52
ity grid that is not only cleaner but that also delivers
stable, reasonable prices for consumers. Renewable Wind energy developers and other builders of renew-
energy sources such as wind are not subject to the able energy systems may choose to take advantage
fuel price volatility of coal and natural gas, and can of either the PTC or the ITC, but not both. Different
deliver reliable, affordable electricity for decades, types of renewable energy projects stand to reap
making them a smart long-term investment in the greater benefits from one or the other program,
nation’s energy future. However, renewable energy depending in part on the capital intensity of the
16 Wind Energy for a Cleaner America II: Wind Energy’s Growing Benefits for Our Environment and Our Healthproject and the amount of power it produces over The economic uncertainty created by the spo-
time.53 Federal renewable energy tax credits have radic availability of incentives discourages busi-
been a key contributor to the growth of wind energy nesses that manufacture turbines, gear boxes,
over the last decade, but their effectiveness has been blades, bearings and towers from entering the
hamstrung by their “here today, gone tomorrow” market or expanding, restricting the supply chain
inconsistency. Over the past 13 years, the renewable and increasing costs. On the other hand, long-
energy PTC has been available only sporadically. term consistency in renewable energy policy can
When the PTC has been renewed by Congress for encourage new businesses to enter the field and
only for one or two years at a time or even allowed expand operations, bringing new jobs and invest-
to expire, the ensuing uncertainty has discouraged ment to the United States. For example, between
wind developers from building new capacity, stunt- 2005-2006 and 2012—a period of relative stability
ing industry growth. For instance, in 2000, 2002 and in clean energy incentives—the amount of do-
2004—years when the PTC was allowed to expire mestically produced content in U.S. wind power
temporarily—new wind installations dropped by projects increased from 25 percent to 72 percent,
93 percent, 73 percent and 77 percent, respectively, creating new jobs and economic opportunity in
from the previous year when the PTC had been in the United States.55
force.54 (See Figure 8.)
Figure 8. The Impact of the Sporadic Expiration and Renewal of the PTC on the Wind Industry56
America Should Continue to Invest in Wind Energy 17Establish Strong Renewable Electricity In order for RES policies to continue to drive wind
Standards energy growth, however, states without RESs will
need to adopt them, those with policies will need to
A renewable electricity standard (RES) helps support
strengthen them, and the federal government will
wind energy development by requiring utilities to
need to adopt a national policy of its own. According
obtain a percentage of the electricity they provide
to the U.S. Department of Energy, existing state RESs
to consumers from renewable sources. These stan-
will drive the addition of only 3 to 5 GW of renewable
dards help ensure that wind energy producers have a
energy per year between now and the end of the de-
market for the electricity they generate, as electricity
cade, which is lower than the amount of wind energy
suppliers seek to reach their required threshold for
added in recent years.62 Strengthening the nation’s
renewable electricity. This certainty makes it easier
renewable energy goals will help keep the United
for wind developers to finance and build new wind
States on pace to tap an increasing share of its wind
power installations. Today, 29 states have renewable
energy potential.
electricity standards.57 From 1999 through 2012, 69
percent of all new wind capacity was built in states
with renewable electricity standards.58 In 2012, the Facilitate Development of Offshore
proportion rose to 83 percent.59 Some of the states Wind Resources
with the strongest standards, such as Colorado, have Some of the best wind energy resources are offshore.
seen the greatest growth in wind power generation.60 To capture that potential, policymakers need to set
a bold goal for offshore wind development in the
Renewable electricity standards have not only proven
Atlantic. A goal will help articulate the important
to be effective at spurring wind energy development,
role of offshore wind in America’s energy future. The
but they have also had little effect on ratepayers, with
Department of the Interior and the Bureau of Ocean
most policies resulting in either a small net benefit
Energy Management will need sufficient staff and re-
or a small cost to ratepayers on the order of $5 per
sources to manage multiple renewable energy leases
year.61 This does not include the economic value
along the coast and to promote an efficient leasing
of the environmental and public health benefits of
process. A coordinated effort by federal, state and
renewable energy, nor does it reflect the economic
regional economic development, energy and com-
benefits of wind energy-driven job creation, leading
merce agencies is needed to develop commitments
to the conclusion that renewable electricity stan-
to purchase offshore wind power. Finally, offshore
dards are a winner for both the environment and the
wind projects must be sited, constructed and operat-
economy.
ed responsibly in order to avoid and mitigate conflict
with local marine life and other uses.
18 Wind Energy for a Cleaner America II: Wind Energy’s Growing Benefits for Our Environment and Our HealthMethodology
E
stimates of the benefits of wind energy were on data from Navigant Consulting, Offshore Wind
obtained by applying national assumptions Market and Economic Analysis: Annual Market Assess-
regarding the amount of pollution or water ment, prepared for the U.S. Department of Energy,
consumption avoided per megawatt-hour (MWh) of 22 February 2013.
wind energy to estimated wind energy production
in 2012 and the amount of wind energy assumed to
be produced in 2018 if the United States continues Table 2. Actual and Assumed Growth in
to add wind energy at a pace consistent with recent Cumulative U.S. Wind Installations, 1999-201864
experience.
Wind Energy
Data on annual wind generation (in MWh) for 2012 Year Capacity (MW)
were obtained from Energy Information Administra-
1999 2,472
tion, Electric Power Monthly, February 2013.
2000 2,539
To estimate output from wind facilities in 2018, we 2001 4,232
assumed the installation of a modest 640 MW of 2002 4,687
new wind energy capacity in 2013, based on the 2003 6,350
assumption that approximately half of the 1,280 MW 2004 6,723
of new wind capacity under construction as of the 2005 9,147
end of the second quarter of 2013 would be com- 2006 11,575
pleted by the end of the year.63 We then assumed 2007 16,907
that the United States would add onshore wind 2008 25,410
capacity at a pace equivalent to the average annual 2009 34,863
addition of wind power capacity from 2007 to 2012, 2010 40,267
or 8,620 MW—a level of wind energy development 2011 46,916
well within the historical experience of the United
2012 60,007
States.
Estimated onshore additions
In addition to onshore wind energy, the United in 2013 640
States has ample potential to develop wind energy Assumed onshore additions,
resources in ocean waters and the Great Lakes. To 2014-18 43,100
date, the United States does not have any operation- Assumed offshore additions,
al offshore wind energy facilities, but several such 2013-18 3,380
facilities are in development. Our analysis assumes Installed wind capacity at
that the United States will add 3.4 GW of wind end of 2018 107,127
energy capacity between 2013 and 2018, based
Methodology 19We apportioned new onshore wind energy capac- In this report, we assume that 75 percent of the gen-
ity among the states according to their share of the eration offset by wind energy is in the form of natural
nation’s existing wind power capacity.65 New offshore gas generation and 25 percent in the form of coal-
wind capacity was apportioned among the states fired generation. This simple assumption reflects the
based on the locations of the projects identified in frequent status of natural gas as a marginal source
the Navigant Consulting study. of generation in much of the country, as well as the
recent dominance of natural gas in proposals for new
To estimate electricity generation from these capac-
fossil fuel-fired generation capacity. For wind turbines
ity additions in each state, we used regional capac-
installed through the end of 2012, we assume that the
ity factors based on historical performance data for
natural gas generation avoided shares the emission
existing U.S. wind turbines, per Ryan Wiser and Mark
characteristics of existing natural gas power plants; for
Bolinger, 2011 Wind Technologies Market Report, U.S.
plants installed in 2013 and later years, we assume that
Department of Energy, August 2012. Because the
wind offsets new natural gas combined cycle power
state-level data did not include Alaska or Hawaii, we
plants.
assumed wind projects in those states achieved the
national average capacity factor of 33 percent. We The use of simplified national assumptions blurs
assumed that the southeastern states have the same regional variations in the emission reduction benefits
capacity factor as the East. The capacity factor for of wind energy generation. In its 2012 market report,
offshore wind projects is assumed to be 39 percent, the American Wind Energy Association estimated
based on U.S. Department of Energy, National Energy that a megawatt-hour of electricity produced from a
Technology Laboratory, Role of Alternative Energy newly installed wind turbine will offset 1,300 pounds
Sources: Wind Technology Assessment, 30 August 2012. of carbon dioxide pollution on average nationally, but
that the reductions would vary by region from as much
Technological improvements could lead to signifi-
as 1,630 pounds/MWh to as little as 970 pounds/MWh.67
cantly increased capacity factors for onshore and
Readers should be aware of these potential regional
offshore wind installations in the near future. To the
variations in the emission benefits of wind energy and
extent that those improvements develop and are
understand that the emission reductions estimated
implemented in U.S. wind energy projects, the en-
here may vary by as much as +/- 25 percent.
vironmental benefits presented here can be consid-
ered conservative estimates.
Table 3. Average Capacity Factor, Based on
Projects Built from 2004-201066
Estimating Carbon Dioxide Emission
Reductions Region Average Capacity Factor
When a wind turbine generates electricity, it dis-
East 25%
places some other source of electricity on the grid.
New England 28%
The type of electricity production that is offset by
California 30%
wind depends on several factors: regional variations
in the electricity resource mix, the degree to which Great Lakes 31%
wind energy offsets new versus existing generation Northwest 32%
capacity, the relative price of competing forms of Texas 34%
electricity generation (including marginal prices), and Mountain 36%
the way in which wind energy is integrated into the Heartland 37%
grid, among others. Offshore 39%
20 Wind Energy for a Cleaner America II: Wind Energy’s Growing Benefits for Our Environment and Our HealthWe calculated a national average carbon dioxide from natural gas power plants and 25 percent is from
emissions rate for coal and natural gas plants for 2011 coal plants, with water consumption for combined
based on emissions figures for the electric power cycle plants used to calculate savings for both exist-
industry from U.S. Department of Energy, Energy ing and future wind power capacity. The U.S. DOE
Information Administration, State Historical Tables for study used national estimates of water consumption
2011, February 2013, and net generation of electricity due to the lack of regional variation in water con-
from U.S. Department of Energy, Energy Information sumption patterns among specific technologies, and
Administration, Electricity Data Browser, accessed at used the same figures for current and future genera-
www.eia.gov/electricity/data.cfm, 21 October 2013. tion technologies.
For new natural gas-fired power plants, we used the
In this report, we present data on water consumption
emission rate given for a new natural gas combined
by power plants, which is the amount of water lost to
cycle power plant without carbon capture and stor-
a watershed (usually through evaporation) as a result
age in U.S. Department of Energy, National Energy
of power plant operation. We do not present data
Technology Laboratory, Life Cycle Analysis: Natural Gas
on water withdrawals for power plant operations.
Combined Cycle (NGCC) Power Plant, 30 September
Withdrawals are also a critical measure of power
2010.68
plants’ environmental impact as high levels of wa-
To put carbon dioxide emission reductions in per- ter withdrawals can have significant impacts on the
spective, we calculated how many passenger vehicles environment and wildlife. By reducing the need for
would have to be removed from the road in order to fossil fuel-fired power plants, wind energy can also
produce comparable savings. Data on vehicle emis- reduce the amount of water withdrawn for power
sions rates is from Environmental Protection Agency, plant cooling.
Clean Energy: Calculations and References, updated
We calculated the number of individuals whose
19 September 2013 and accessed at www.epa.gov/
domestic water needs could be met with this amount
cleanenergy/energy-resources/refs.html.
of saved water. We obtained state-level per capita
It is important to note that U.S. power grids cross domestic water use from Joan Kenny et al., Estimated
state lines, such that electricity generated in one Use of Water in the United States in 2005, U.S. Geologi-
state may be consumed in a neighboring state. The cal Survey, 2009.
emission reductions attributed to each state in this
As with estimates of the carbon dioxide emission
report reflect the emissions impact of wind power
benefits of wind power, estimates of water savings
produced within each state.
based on national averages may overstate or under-
state water savings experienced in a particular state,
Estimating Avoided Water depending on the specific mix of electricity genera-
Consumption tion that is avoided through the use of wind energy.
We estimated water savings using freshwater con-
sumption rates in coal and natural gas combined Estimating Avoided Emissions of
cycle power plants from U.S. Department of Energy Nitrogen Oxides and Sulfur Dioxide
(DOE), Office of Energy Efficiency and Renewable
We also estimated avoided emissions of nitrogen
Energy, 20% Wind Energy by 2030: Increasing Wind En-
oxides (NOX) and sulfur dioxide (SO2) by multiplying
ergy’s Contribution to U.S. Electricity Supply, July 2008.
electricity generation from wind power by an an-
We used the same assumption as for carbon dioxide
nual emissions rate for each pollutant. We created
savings that 75 percent of displaced generation is
Methodology 21an average annual emission rate for each pollutant and net generation of electricity from U.S. Depart-
assuming that 25 percent of the electricity displaced ment of Energy, Energy Information Administration,
by existing wind generation would be from existing Electricity Data Browser, accessed at www.eia.gov/
coal plants, and 75 percent from natural gas power electricity/data.cfm, 21 October 2013. For new natural
plants. As with our estimates of carbon dioxide emis- gas-fired power plants, we used the emission rate
sion reductions, we assumed that wind turbines built given for a new natural gas combined cycle power
through the end of 2012 offset emissions from natural plant without carbon capture and storage in U.S.
gas-fired power plants at a rate characteristic of the Department of Energy, National Energy Technology
existing generation fleet, while new wind turbines Laboratory, Life Cycle Analysis: Natural Gas Combined
offset emissions at a rate characteristic of new natural Cycle (NGCC) Power Plant, 30 September 2010.69
gas combined cycle power plants.
As with the other estimates of environmental impacts
We calculated a national average emissions rate for in this report, reductions in nitrogen oxide and sulfur
coal and natural gas plants for 2011 based on emis- dioxide may vary by region depending on the spe-
sions figures for the electric power industry from U.S. cific characteristics of the electric grid in those areas,
Department of Energy, Energy Information Adminis- as well as regulatory limits on pollution from power
tration, State Historical Tables for 2011, February 2013, plant smokestacks.
22 Wind Energy for a Cleaner America II: Wind Energy’s Growing Benefits for Our Environment and Our HealthAppendix A: Current and Possible Future
Wind Generation by State
Wind Energy Rank, Wind Possible Production from Wind Energy Rank, Wind Possible Production from
Production, 2012 Energy Produc- Wind Energy Added 2013-18 Production, 2012 Energy Produc- Wind Energy Added 2013-18
State (MWh) tion in 2012 (MWh in 2018) State (MWh) tion in 2012 (MWh in 2018)
Texas 31,860,000 1 32,970,227 New Hampshire 260,000 30 273,532
Iowa 13,945,000 2 12,161,374 Arizona 255,000 31 548,215
California 9,937,000 3 10,651,416 Nevada 129,000 32 350,120
Oklahoma 8,234,000 4 7,419,456 Vermont 109,000 33 190,352
Illinois 7,708,000 5 7,077,142 Massachusetts 85,000 34 1,184,880
Minnesota 7,529,000 6 7,069,080 Tennessee 47,000 35 46,388
Washington 6,688,000 7 5,749,346 Alaska 14,000 36 124,577
Oregon 6,066,000 8 6,455,729 New Jersey 13,000 37 1,558,346
Colorado 6,045,000 9 5,300,178 Delaware 5,000 38 3,199
North Dakota 5,316,000 10 3,974,878 Rhode Island 3,000 39 80,096
Kansas 5,119,000 11 6,420,410 Alabama 0 40 (tie) 0
Wyoming 4,394,000 12 3,247,828 Arkansas 0 40 (tie) 237
Indiana 3,163,000 13 3,060,546 Connecticut 0 40 (tie) 0
New York 3,033,000 14 2,620,145 Florida 0 40 (tie) 0
South Dakota 2,914,000 15 1,856,048 Georgia 0 40 (tie) 0
New Mexico 2,226,000 16 1,792,064 Kentucky 0 40 (tie) 0
Pennsylvania 2,208,000 17 2,143,464 Louisiana 0 40 (tie) 0
Idaho 1,821,000 18 1,992,206 Mississippi 0 40 (tie) 0
Wisconsin 1,546,000 19 1,287,294 North Carolina 0 40 (tie) 0
West Virginia 1,286,000 20 932,567 South Carolina 0 40 (tie) 0
Nebraska 1,275,000 21 1,086,640 Virginia 0 40 (tie) 0
Missouri 1,245,000 22 1,086,640
Montana 1,238,000 23 1,320,630
Michigan 1,108,000 24 1,959,702 Note: Assumptions about future onshore wind capacity are based on a
Ohio 988,000 25 918,294 national growth rate, apportioned to states based on historical wind en-
Maine 884,000 26 689,428
ergy development patterns. Technological, economic or policy changes
Utah 712,000 27 748,613
Appendix
could result in a different distribution of wind power capacity between
Hawaii 367,000 28 434,963
now and 2018 than is assumed here.
23
Maryland 314,000 29 191,952Appendix B: Carbon Dioxide
Emissions Avoided by Wind Energy
Avoided Carbon Dioxide Emissions, 2012 (metric tons) Equivalent in Cars Off the Road
Reductions from Wind Reductions from Possible Additional Reductions from Reductions from Possible Additional
State Energy in 2012 Wind Energy, 2013-18 Wind Energy in 2012 Wind Energy, 2013-18
Alabama – – – –
Alaska 8,468 65,940 1,764 13,737
Arizona 154,242 290,176 32,134 60,453
Arkansas – 125 – 26
California 6,010,609 5,637,907 1,252,210 1,174,564
Colorado 3,656,449 2,805,441 761,760 584,467
Connecticut – – – –
Delaware 3,024 1,693 630 353
Florida – – – –
Georgia – – – –
Hawaii 221,988 230,231 46,247 47,965
24 Wind Energy for a Cleaner America II: Wind Energy’s Growing Benefits for Our Environment and Our Health
Idaho 1,101,471 1,054,496 229,473 219,687
Illinois 4,662,351 3,746,006 971,323 780,418
Indiana 1,913,209 1,619,980 398,585 337,496
Iowa 8,434,935 6,437,144 1,757,278 1,341,072
Kansas 3,096,338 3,398,391 645,070 707,998
Kentucky – – – –
Louisiana – – – –
Maine 534,707 364,921 111,397 76,025
Maryland 189,930 101,602 39,569 21,167
Massachusetts 51,414 627,170 10,711 130,660
Michigan 670,198 1,037,291 139,625 216,102
Minnesota 4,554,079 3,741,739 948,766 779,529Avoided Carbon Dioxide Emissions, 2012 (metric tons) Equivalent in Cars Off the Road
Reductions from Wind Reductions from Possible Additional Reductions from Reductions from Possible Additional
State Energy in 2012 Wind Energy, 2013-18 Wind Energy in 2012 Wind Energy, 2013-18
Mississippi – – – –
Missouri 753,065 575,170 156,889 119,827
Montana 748,831 699,023 156,006 145,630
Nebraska 771,211 575,170 160,669 119,827
Nevada 78,028 185,322 16,256 38,609
New Hampshire 157,267 144,783 32,764 30,163
New Jersey 7,863 824,849 1,638 171,844
New Mexico 1,346,444 948,558 280,509 197,616
New York 1,834,576 1,386,870 382,203 288,931
North Carolina – – – –
North Dakota 3,215,498 2,103,945 669,895 438,322
Ohio 597,613 486,063 124,503 101,263
Oklahoma 4,980,513 3,927,197 1,037,607 818,166
Oregon 3,669,151 3,417,086 764,407 711,893
Pennsylvania 1,335,557 1,134,558 278,241 236,366
Rhode Island 1,815 42,396 378 8,832
South Carolina – – – –
South Dakota 1,762,596 982,426 367,207 204,672
Tennessee 28,429 24,554 5,923 5,115
Texas 19,271,210 17,451,491 4,014,835 3,635,727
Utah 430,669 396,249 89,723 82,552
Vermont 65,931 100,756 13,736 20,991
Virginia – – – –
Washington 4,045,381 3,043,190 842,788 633,998
West Virginia 777,865 493,617 162,055 102,837
Wisconsin 935,132 681,378 194,819 141,954
Wyoming 2,657,806 1,719,110 553,710 358,148
U.S. Total 84,735,862 72,504,016 17,653,305 15,105,003
Appendix
25Appendix C: Water Consumption
Avoided with Wind Energy
Avoided Water Consumption (gallons) Equivalent in Number of People Whose Daily Water Use Could Be Met
Reductions from Wind Reductions from Possible Additional Reductions from Reductions from Possible Additional
State Energy in 2012 Wind Energy, 2013-18 Wind Energy in 2012 Wind Energy, 2013-18
Alabama – – - -
Alaska 3,783,500 33,666,891 113 1,003
Arizona 68,913,750 148,155,070 1,349 2,899
Arkansas 0 63,979 0 2
California 2,685,474,250 2,878,545,113 59,334 63,600
Colorado 1,633,661,250 1,432,373,178 36,990 32,432
Connecticut – – - -
Delaware 1,351,250 864,584 61 39
Florida – – - -
Georgia – – - -
Hawaii 99,181,750 117,548,806 1,647 1,952
26 Wind Energy for a Cleaner America II: Wind Energy’s Growing Benefits for Our Environment and Our Health
Idaho 492,125,250 538,393,588 7,210 7,888
Illinois 2,083,087,000 1,912,597,572 63,412 58,222
Indiana 854,800,750 827,112,683 30,815 29,817
Iowa 3,768,636,250 3,286,611,347 158,847 138,529
Kansas 1,383,409,750 1,735,115,821 46,792 58,688
Kentucky – – - -
Louisiana – – - -
Maine 238,901,000 186,317,797 12,121 9,453
Maryland 84,858,500 51,875,025 2,133 1,304
Massachusetts 22,971,250 320,213,817 767 10,699
Michigan 299,437,000 529,609,417 10,255 18,137
Minnesota 2,034,712,250 1,910,418,821 81,979 76,971Avoided Water Consumption (gallons) Equivalent in Number of People Whose Daily Water Use Could Be Met
Reductions from Wind Reductions from Possible Additional Reductions from Reductions from Possible Additional
State Energy in 2012 Wind Energy, 2013-18 Wind Energy in 2012 Wind Energy, 2013-18
Mississippi – – - -
Missouri 336,461,250 293,664,514 10,475 9,143
Montana 334,569,500 356,900,169 8,184 8,730
Nebraska 344,568,750 293,664,514 6,993 5,960
Nevada 34,862,250 94,620,045 503 1,364
New Hampshire 70,265,000 73,921,910 2,567 2,700
New Jersey 3,513,250 421,143,114 139 16,722
New Mexico 601,576,500 484,305,229 15,403 12,401
New York 819,668,250 708,094,085 23,151 20,000
North Carolina – – - -
North Dakota 1,436,649,000 1,074,210,717 43,253 32,341
Ohio 267,007,000 248,168,912 10,602 9,854
Oklahoma 2,225,238,500 2,005,108,032 71,724 64,629
Oregon 1,639,336,500 1,744,660,826 37,118 39,503
Pennsylvania 596,712,000 579,271,108 28,681 27,843
Rhode Island 810,750 21,646,052 28 751
South Carolina – – - -
South Dakota 787,508,500 501,596,904 22,953 14,620
Tennessee 12,701,750 12,536,464 435 429
Texas 8,610,165,000 8,910,203,822 172,186 178,186
Utah 192,418,000 202,312,596 2,834 2,980
Vermont 29,457,250 51,442,733 1,261 2,202
Virginia – – - -
Washington 1,807,432,000 1,553,760,735 48,076 41,329
West Virginia 347,541,500 252,026,161 9,427 6,836
Wisconsin 417,806,500 347,891,206 20,082 16,722
Wyoming 1,187,478,500 877,725,415 21,404 15,821
United States 37,859,052,250 37,018,358,774 1,071,304 1,042,700
Appendix
27Appendix D: Nitrogen Oxide
and Sulfur Dioxide Emissions
Avoided with Wind Energy
Avoided Nitrogen Oxide Emissions (tons) Avoided Sulfur Dioxide Emissions (tons)
Reductions from Wind Reductions from Possible Reductions from Wind Reductions from Possible Additional
State Energy in 2012 Additional Wind Energy, 2013-18 Energy in 2012 Wind Energy, 2013-18
Alabama - - - -
Alaska 8 37 10 87
Arizona 145 165 179 384
Arkansas - 0 - 0
California 5,649 3,206 6,978 7,468
Colorado 3,437 1,595 4,245 3,716
Connecticut - - - -
Delaware 3 1 4 2
Florida - - - -
28 Wind Energy for a Cleaner America II: Wind Energy’s Growing Benefits for Our Environment and Our Health
Georgia - - - -
Hawaii 209 131 258 305
Idaho 1,035 600 1,279 1,397
Illinois 4,382 2,130 5,413 4,962
Indiana 1,798 921 2,221 2,146
Iowa 7,928 3,660 9,793 8,526
Kansas 2,910 1,932 3,595 4,501
Kentucky - - - -
Louisiana - - - -
Maine 503 208 621 483
Maryland 179 58 221 135
Massachusetts 48 357 60 831Avoided Nitrogen Oxide Emissions (tons) Avoided Sulfur Dioxide Emissions (tons)
Reductions from Wind Reductions from Possible Reductions from Wind Reductions from Possible Additional
State Energy in 2012 Additional Wind Energy, 2013-18 Energy in 2012 Wind Energy, 2013-18
Michigan 630 590 778 1,374
Minnesota 4,280 2,128 5,287 4,956
Mississippi - - - -
Missouri 708 327 874 762
Montana 704 397 869 926
Nebraska 725 327 895 762
Nevada 73 105 91 245
New Hampshire 148 82 183 192
New Jersey 7 469 9 1,093
New Mexico 1,265 539 1,563 1,256
New York 1,724 789 2,130 1,837
North Carolina - - - -
North Dakota 3,022 1,196 3,733 2,787
Ohio 562 276 694 644
Oklahoma 4,681 2,233 5,782 5,202
Oregon 3,449 1,943 4,260 4,526
Pennsylvania 1,255 645 1,551 1,503
Rhode Island 2 24 2 56
South Carolina - - - -
South Dakota 1,657 559 2,046 1,301
Tennessee 27 14 33 33
Texas 18,112 9,923 22,374 23,115
Utah 405 225 500 525
Vermont 62 57 77 133
Virginia - - - -
Washington 3,802 1,730 4,697 4,031
West Virginia 731 281 903 654
Wisconsin 879 387 1,086 902
Appendix
Wyoming 2,498 978 3,086 2,277
29
United States 79,641 41,228 98,378 96,033Notes
1. U.S. Energy Information Administration, Electric 11. Intergovernmental Panel on Climate Change,
Power Annual with Data for 2011, 30 January 2013. Climate Change 2007: The Physical Science Basis,
Contribution of Working Group I to the Fourth Assessment
2. 2012 wind generation and annual electricity sales:
Report of the Intergovernmental Panel on Climate Change,
U.S. Energy Information Administration, Electric Power
2007; National Research Council, Advancing the Science of
Monthly with Data for December 2012, February 2013;
Climate Change, 2010.
Electricity sales in Georgia: U.S. Energy Information
Administration, Electric Sales, Revenue, and Average Price, 12. U.S. Environmental Protection Agency, Inventory
with data for 2011, 27 September 2012. of U.S. Greenhouse Gas Emissions and Sinks: 1990-2011, 12
April 2013.
3. U.S. Department of Energy, 2012 Wind Technologies
Market Report, August 2013. 13. Ibid.
4. See note 1. 14. Jordan Schneider and Travis Madsen, Frontier
Group, and Julian Boggs, Environment America Research
5. Federal Energy Regulatory Commission, Office of
& Policy Center, America’s Dirtiest Power Plants: Their
Energy Projects: Energy Infrastructure Update for December
Oversized Contribution to Global Warming and What We
2012, downloaded from www.ferc.gov/legal/staff-reports/
Can Do About It, September 2013.
dec-2012-energy-infrastructure.pdf on 13 September 2013.
15. Ibid.
6. See note 3.
16. Thomas R. Karl, et al. (eds.), United States Global
7. U.S. Department of Energy, Energy Information
Change Research Program, Global Climate Change Impacts
Administration, Electric Power Monthly with Data for
in the United States, 2009, 28.
December 2012, February 2013. 2012 data are preliminary.
17. Intergovernmental Panel on Climate Change,
8. Mark Muro et al., Metropolitan Policy Program, The
Working Group I Contribution to the IPCC Fifth Assessment
Brooking Institution, Sizing the Clean Economy: A National
Report, Climate Change 2013: The Physical Science Basis,
and Regional Green Jobs Assessment, 2011.
Technical Summary - Final Draft Underlying Scientific-
9. American Wind Energy Association, Wind Energy Technical Assessment, 26 September 2013.
Facts at a Glance, accessed at www.awea.org/Resources/
18. Ibid.
Content.aspx?ItemNumber=5059, 22 October 2013.
19. Travis Madsen and Nathan Willcox, Environment
10. Laurie T. Johnson, Starla Yeh and Chris Hope, “The
America Research and Policy Center, When It Rains,
Social Cost of Carbon: Implications for Modernizing Our
It Pours: Global Warming and the Increase in Extreme
Electricity System,” Journal of Environmental Studies and
Precipitation from 1948 to 2011, July 2012.
Sciences, September 2013, doi: 10.1007/s13412-013-0149-5.
30 Wind Energy for a Cleaner America II: Wind Energy’s Growing Benefits for Our Environment and Our HealthYou can also read