CO2 Reduction Measures in the Electricity Supply Chain in Libya - IEOM
←
→
Page content transcription
If your browser does not render page correctly, please read the page content below
Proceedings of the 5th NA International Conference on Industrial Engineering and Operations Management
Detroit, Michigan, USA, August 9 - 11, 2020
CO2 Reduction Measures in the Electricity Supply Chain in
Libya
Husen E. Bader & Saber Kh. Elmabrouk
School of Applied Sciences and Engineering, Libyan Academy for Postgraduate Studies, Janzour, Libya
hossenbader@yahoo.com & saber.elmabrouk@academy.edu.ly
Abstract
The electricity supply chain consists of three components; electricity generation, transmission and distribution (T&D)
system, and the end-user stage. CO2 emissions from electricity generation are caused by the burning of fossil
fuels. Unjustified end-users and electricity losses in the T&D system increase electricity production, which of
course indirectly contributes to further emissions. Consequently, this study presents the state of the electricity
supply chain in Libya and measures taken to reduce emissions. The analysis shows that efforts are currently being
made to diversify the energy mix and to exploit the potential of solar and wind energy. Low carbon fuels
and combined cycle technologies remain key sources of electricity generation. In the T&D system, Libya has
built a strong transmission system and strict design criteria have been applied. Libya is working on the
establishment of Energy Demand Management (EDM), where some power plants have installed EDM-related
equipment. Further efforts are needed to reduce technical and non-technical losses. In the end-user stage, per
capita electricity consumption corresponds to 3.73MWh, which is considered to be the largest energy consumer in
Africa. There is no time-differentiated price that would encourage consumers to switch from peak hours. Libya is
currently preparing a national energy efficiency action plan.
Keywords
Electricity Supply Chain, CO2 emissions, Libyan Power Plants, T&D System, Energy Demand Management.
1. Introduction
The relationship between energy consumption and environmental pollution has become clear due to negative
results such as high CO2 and climate change. The unreasonable use of consumers and the loss of electricity in the
transmission and distribution (T&D) system increase electricity production, which of course contributes indirectly
to further CO2 emissions. However, Libya's population growth requires new infrastructure, especially in power
generation, which is dramatically increasing electricity demand. In fact, Libya has the highest per capita
electricity consumption, 3.73 MWh, which corresponds to Africa’s largest electricity consumption, in which
electricity consumption increases by 8% per year, which in turn increases CO2 emissions (energy-pedia and World
Data). Also, of the 225 countries, Libya ranks 53rd in the list of countries in terms of CO2 emissions, with a
contribution of 0.22%, and 41st in the list of countries in terms of CO2 emissions per capita (Nassar et al,
2017). Also, according to the IEA, in 2017, carbon emissions increased by 61.5% compared to 1990. Fig. 1a
shows total CO2 emissions between 1996 and 2017. This shows the emissions reached a maximum level of
48Mt in 2010 and 2013 then dropped to 42Mt in 2017 due to declining electricity production during armed
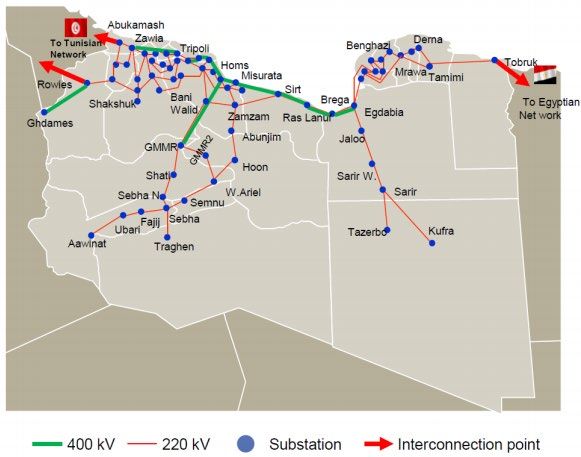
conflict, and political instability. On the other hand, power plants account for approx. 35% of CO2 emissions,
followed by transport with 31% and then with the residential and commercial sector with 15% (Nassar et al.,
2017) as shown in Fig. 1b.
a) b)
Fig. 1- CO2 Emissions in Libya; a) Total Emissions from 1996 to 2017 b) Emissions by Sector.
© IEOM Society International
121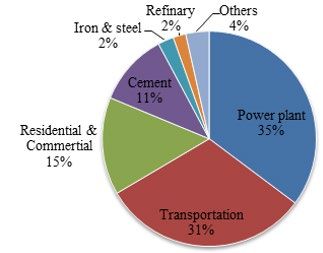
Proceedings of the 5th NA International Conference on Industrial Engineering and Operations Management
Detroit, Michigan, USA, August 9 - 11, 2020

Consequently, this study presents the situation of the Libyan electricity supply chain and the measures taken to reduce
CO2 emissions from Libyan power plants in the following three integrated components: (1) Electricity Generation
Sector, (2) Electrical T&D System, and (3) End-Users Stage. Fig. 2 illustrates a typical diagram of an electricity supply
chain. However, before discussing these measures, we would like to present the definition of the components of the
electricity supply chain with an overview of the current situation of the electricity sector in Libya.

                               Fig. 2 - Typical Diagram of an Electricity Supply Chain

Electricity Generation:
The main purpose of electricity generation is to produce electricity by the conversion of other forms of energy into
electrical energy; it is usually expressed in kWh or MWh. To generate electricity, fossil fuel power plants burn coal
or oil to produce heat, which in turn is used to generate steam to power turbines that generate electricity. In gas-fired
power plants, hot gases drive a turbine to generate electricity, while a combined-cycle gas turbine plant also uses a
steam generator to increase the amount of electricity produced. Therefore, the burning of fossil fuels emits huge
amounts of CO2 into the atmosphere, causing pollution.

Electrical Transmission and Distribution (T&D) System:
The T&D system refers to the different stages of transmission of electricity from power generators through the grid to
the end-users. More specifically, it is the mass transfer of electrical energy from an electricity generation plant to
substations in populated areas, over long distances at overhead lines or underground cables. The power transmission
system is called a grid. On the other hand, electricity distribution is the last phase of electricity supply; it provides
electricity from the transmission system to individual consumers (Short, 2018). The distribution substations are
connected to the transmission system and reduce the transmission voltage to medium voltage. The primary distribution
lines transmit this medium voltage power to the distribution transformers near the receiver. Distribution transformers
again reduce the voltage to the operating voltage used by lighting, industrial or household appliances (Sivanagaraju
and Satyanarayana, 2008). Closer to the end-user customer, a distribution transformer steps the primary distribution
power down to a low-voltage secondary circuit, usually 120/240V. The power comes to the customer via a service
drop and an electricity meter (Short, 2018). However, this long-distance transmission causes a certain amount of
electricity loss. Much of this loss comes from the Joule effect applied in transformers and electrical lines. Electricity
is lost as heat loss in the conductors and in the main parts of the transmission and distribution system. According to
the International Electrotechnical Commission (IEC, 2007) and Garg et al (2018), the total loss between the power
plant and the end-user is between 8-15% of the electricity generation. 1-2% electrical loss through the gradual
transformer from the generator to the transmission line, 2-4% electrical loss through the transmission line, 1-2%
electrical loss through-transformer from the transmission line to the distribution network, and 4-6% losses by means
of distribution network transformers, overhead lines and ground cables. Optimizing these losses therefore results in
savings in electricity generation, which has reduced CO2 emissions. Each unit saved along the T&D system represents
one unit of electricity saved in the electricity generation phase.

Electricity End-Users Consumer:
Electricity end-use is for residential, commercial and industrial consumers. All types of end-users can reduce CO2
emissions by reducing electricity consumption. This can be achieved by rationalizing electricity consumption and all
end-users can be smart consumers. The amount of electricity consumed by the consumer, however, is measured in
kWh through an electricity meter, which is usually placed near the input of housing for easy access to the meter reader.

2. Current Situation in the Electricity Sector
In many countries, electricity utilities own the entire infrastructure, from electricity generation to transmission and
distribution infrastructure. However, the General Electricity Company of Libya (GECOL) is state-owned and

                                            © IEOM Society International
                                                                                                                    122
Proceedings of the 5th NA International Conference on Industrial Engineering and Operations Management
Detroit, Michigan, USA, August 9 - 11, 2020

responsible for the Libyan electricity system. GECOL has a total of fifteen thermal power plants and eleven small
stations. All are completely dependent on heavy fuel oil (HFO), light fuel oil (LFO) and natural gas (NG). Most of
these plants are located along the coastline where most of the population lives. As of 2010, Libya had a combined
electricity capacity of 6.8 GW from oil and natural gas power plants. The World Bank estimates that 99.8% of Libyan
people have access to electricity, which is the highest among African countries. Table 1 shows the electricity
production between 2015 and 2018. Overall electricity generation has remained mostly stable since 2015, ranging
between 36 and 37TWh. There are seven steam turbines (ST), three combined cycles (CC), six main gas turbines (GT)
and eleven small GT. It is known that Libya has been politically and economically unstable since the 2011 civil war.
Many infrastructure sectors have been damaged, including GECOL and most oil fields. As a result, some GECOL
facilities were damaged and robbed. This has led to a severe shortage of generating capacity, which has caused power
outages, especially at peak loads. The table shows that Tripoli West ST, Benghazi North ST and Abukamash Small
GT were out of service between 2015 and 2018. Whilst, Derna ST became inoperable in 2017 and 2018. While, Zahra
Small GT, Tripoli West Old GT, Zletan Small GT, Lamluda Small GT and Zawia GE Small GT were back to service
in 2018. Also, in 2018, the Kufra Small GT and the Tripoli West GE Small GT were out of service. In 2018, however,
power plants were generating 47% of the electricity from the combined cycle, 40% from the gas turbine and 13% from
the steam turbine with total output 37,124,634 MWh.

In fact, as much electricity is generated, CO2 is released into the atmosphere, which contributes to global warming,
which today is a key issue for the future of power generation. Therefore, possible measures should be taken to reduce
the CO2 emissions in the electricity supply system. A number of mitigation measures have been applied to reduce CO2
emissions in the electricity supply chain. The rest of the paper deals with current measures to reduce the carbon
footprint of this chain in Libya.

3. CO2 Reduction Measures of the Electricity Supply Chain in Libya
CO2 emissions are concentrated in the electric power generation sector, where fossil fuels are burned. Therefore,
unjustified use within the end-users, as well as losses in the T&D system, increase the electricity production in the
power generation sector, which indirectly contributes to further CO2 emissions.

The diagram shown in Fig. 3 illustrates the possible CO2 reduction measures of the three main components in the
electricity supply chain. Applicable measures in electricity generation may include: (a) the use of non-fossil fuels, (b)
switching to low-carbon fuels, (c) improving the efficiency of power plants, and (d)) turn on carbon capture power
plants. The measures can be applied to the electricity T&D system; (a) energy data management (EDM), (b) improving
the efficiency of T&D, and (c) building a smart grid. While the actions taken in the end-user phase can be summarized
between demand-side management (DSM) and smart consumers.

             Fig. 3 - CO2 Reduction Measures of the Three Components in the Electricity Supply Chain

3.1 Measures Taken in Electricity Generation Sector
The main purpose of the power generation sector is to generate and supply electricity to end-users. Table 2 shows the
CO2 reduction measures applied to the electricity generation sector. It shows that the electricity supply chain in Libyan
is not pursuing nuclear power generation. Measures to reduce CO2 emissions through turns on the carbon capture
plants, and improves the efficiency of existing power plants by using supercritical and ultra-supercritical power plants
have not yet been implemented in the Libyan electricity generation sector.

                                            © IEOM Society International
                                                                                                                    123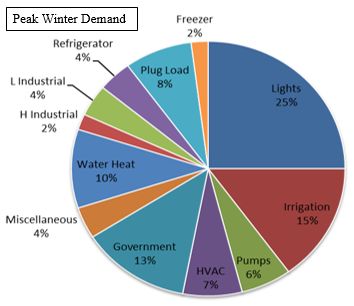
Proceedings of the 5th NA International Conference on Industrial Engineering and Operations Management
Detroit, Michigan, USA, August 9 - 11, 2020

                                     Table 1- Electricity Production between 2015 and 2018

                                                           Electricity Production During Years
                                   2015                    2016                     2017                     2018
                                          Fuel                   Fuel                     Fuel                          Fuel
Type

           Power Plant

                                     No Fuel

                                                             No Fuel

                                                                                    No Fuel

                                                                                                                 No Fuel
                             MWh                     MWh                     MWh                       MWh

                                      HFO

                                                              HFO

                                                                                     HFO

                                                                                                                  HFO
                                      LFO

                                                              LFO

                                                                                     LFO

                                                                                                                  LFO
                                      NG

                                                              NG

                                                                                     NG

                                                                                                                  NG
             Khalij         942,132      √         568,518       √         167,904      √            1,095,412          √
          Tripoli west         0                      0                       0                          0
             Khoms         3,044,061 √ √      √   2,763,291 √ √       √   2,982,314     √            2,994,690          √ √
         Misurata Iron      632,910 √              630,852 √               322,160      √             567,149      √      √
ST

             Tubruk          84,560 √              216,455 √               234,470      √             125,630      √      √
             Derna          116,405 √               2,471     √               0                          0
        Benghazi North         0                      0                       0                          0
          Total ST         4,820,068              4,181,587               3,706,848                  4,782,881
                     Gas   6,043,120     √    √   5,733,996      √    √   5,751,829     √    √       5,596,733          √ √
         Zawia
                   Steam   2,485,867            √ 2,051,668             √ 1,761,822              √   1,900,893                  √
        Benghazi Gas       4,910,868     √        4,778,825      √        5,701,180     √            5,783,078          √ √
CC

         North Steam        359,415             √ 492,966               √ 515,700                √     28,813                   √
                     Gas   3,400,963     √        3,353,208      √        3,073,512     √            3,383,642          √ √
        Misurata
                   Steam   1,343,047            √ 1,268,075             √ 694,188                √    801,847                   √
          Total CC         18,543,280             17,678,738              17,498,231                 17,495,006
         West Mounten      3,299,075          √   5,277,271           √   4,371,752          √       3,976,963          √ √
         Khoms Gas I       2,960,597     √    √   3,652,575      √    √   3,018,995     √    √       2,738,879          √ √
Main GT

         Khoms Gas II       2906820                   0                   2,312,434     √    √       1,146,371            √
         Tripoli South     1,805,132     √    √   2,772,941      √    √   2,897,900     √    √       2,726,314          √ √
         Zwetina Gas       1,289,879     √    √   1,383,395      √    √   1,400,792     √    √       2,308,447          √ √
              Alsrir           0         √        1,055,444      √        1,187,712     √            1,400,299          √
       Total Main GT       12,261,503             14,141,626              15,189,585                 14,297,273
          Aby Kmash            0                      0                       0                          0
              Zahra            0                      0                       0                       146,253           √
           Hy Jamei          44,419      √          36,414       √          15,650      √              8,478            √
         Misurata Gas        77,354      √          96,337       √          34,049      √              39,015           √
        Tripoli west old     4,144       √          8,683        √            0                        11,842           √
Small GT

             Zleten          14,428      √             -                      0                        17,899           √
              Kufra          20,030      √          25,604       √          12,584      √                0
            Lamloda            0                      0                       0                        19,866           √
           Srir Rever        22,998                 16,208       √          84,176      √              80,392               √
           Zawia GE         118,975           √       0          √            0                       225,730               √
        Tripoli West GE     105,411      √         241,503       √         255,341      √                0
       Total Small GT       407,759                424,749                 401,800                    549,474
        Total Output             36,032,610              36,426,700             36,796,464                 37,124,634

Switch on carbon capture power plants means that CO2 emissions must be captured at the power plant before release
to the atmosphere. In fact, there are three technologies for carbon capture: post-combustion capture, pre-combustion
capture and oxy-fuel capture. During post-combustion capture, CO2 is separated from the flue gases before being
released into the atmosphere. Pre-combustion capture means the removal of CO2 from fossil fuels before the
combustion is completed. While oxy-fuel combustion is the process of burning a fuel using pure oxygen instead of air
as the primary oxidant.

3.1.1 Use of Non-Fossil Fuels
Coal, oil, and NG are commonly referred to as fossil fuels. Solar, wind, and hydro are non-fossil fuels and are referred
to RE. In 2018, the Energy Information Administration (EIA) shows that the burning NG for electricity releases
between 0.6 and 2 pounds of CO2E/kWh (CO2 equivalent per kilowatt-hour); coal emits between 1.4 and 3.6 pounds

                                                   © IEOM Society International
                                                                                                                            124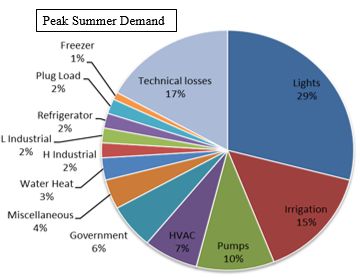
Proceedings of the 5th NA International Conference on Industrial Engineering and Operations Management
Detroit, Michigan, USA, August 9 - 11, 2020
of CO2E/kWh. Wind, on the other hand, is responsible for only 0.02 to 0.04 pounds of CO2E/kWh on a life-cycle
basis; solar 0.07 to 0.2; geothermal 0.1 to 0.2; and hydroelectric between 0.1 and 0.5.
Table 2 - CO2 Reduction Measures Applied to the Electricity Generation Sector
Mitigation Actions Case
Renewable Energy Technologies
Use of Non-Fossil Fuel
Nuclear Power Generation
Switching to Low-Carbon Fuels
Combined Cycle Technology
Improve Power Plants Efficiency Subcritical, Supercritical and Ultra-Supercritical
Maintenance
Turn on Carbon Capture Power Plants
Renewable Energy (RE) Technologies
Libya has huge sources of RE, mainly because parts of the country have the largest amount of solar radiation in the
world. In 2013, the Libyan government launched the RE Strategic Plan for 2013-2025, which aims to achieve a 7%
renewable energy contribution by 2020 and 10% by 2025 in the electricity mix. It comes from wind, concentrated
solar energy, solar PV and solar heat. Unfortunately, this plan has been postponed as Libya’s economy has been
struggling since 2011 due to security and political instability, as well as Libyan oil production disruptions. Against all
these barriers, in 2015, RE accounted for about 2.0% of total actual consumption in Libya.
Libya is located in the center of North Africa, 88% of its territory is desert. The Sahara Desert has great solar potential
that can be used to generate electricity from solar cells, PV and thermal energy. According to NASA's Atmospheric
Science Data Center, the average solar radiation in Libya is about 7.5 kWh/m2/day, with about 3,000 to 3,500 hours
of sunshine a year. In addition, according to Libyan climate archives, the average wind speed is roughly between 6
m/s and 7.5 m/s at a height of 40 m. This enormous amount of sunlight and wind, covering an area of 1,750,000 km2,
will provide Libya and its neighbors with future electricity needs and can also be transported to Europe through high-
voltage DC connections. However, the use of RE reduces dependence on fossil fuels, which in turn reduces CO2
emissions. With this expected growth in RE and the difficult current situation, Libya may face many challenges in
planning for RE and decision-making. For example, lack of meteorological data throughout the country, there is no
good survey or detailed study on the current energy situation, the evolution of electricity demand, and the impact of
the penetration of RE into the grid. Asheibe and Khalil reported in 2013 that the development of RE technologies
faces many barriers. All the planned RE projects, however, are financed by GECOL, which is a state company with
no space for privatization or competition. Due to the inconvenient planning, some RE projects are delayed or
suspended. Below, we present the current situation of wind farms, photovoltaics, concentrated solar projects, and
nuclear power technology in Libya.
Wind Power: The use of wind power for electricity generation in Libya has not yet started, but there are currently
twelve wind farms in various situations, details are given in Table 3. It shows that of the five wind farms in the eastern
region, one project is under construction, two are still in progress, one is being awarded and one is under negotiation.
There are four wind farms in the western region, three of which are under feasibility studies and one under
construction. One wind farm in the south-east and one in the south-west, both under development. Currently, the two
wind farms; The 60MW wind farm in Derna and the 50MW wind farm in Emselata have been shut down due to
security and armed conflict situations.
Solar Energy: The main current uses of solar energy are solar water heating, solar heating of buildings, solar
distillation, solar energy pumping, solar drying of agricultural and animal products, and solar energy furnaces.
However, solar energy can be used to generate electricity in two ways: photovoltaic (PV) and concentrated solar
energy (CSP). However, a solar power plant is any type of facility that directly converts sunlight, such as PV
equipment, or indirectly, such as solar energy, into electricity. CSP systems concentrate the sun's radiation on heating
a liquid substance, which is then used to drive a heat engine and electric generator. This is an indirect method that
generates alternating current, which is then easily distributed over the power grid. PV panels, on the other hand, are
completely different from CSP. PV systems convert sunlight directly to electricity by means of PV cells made of
semiconductor materials (Joshi and Vyas, 2019).
© IEOM Society International
125
Proceedings of the 5th NA International Conference on Industrial Engineering and Operations Management
Detroit, Michigan, USA, August 9 - 11, 2020
Table 3 - Current Situation of Wind Farm Projects in Libya
Region East West SE SW
Derna Stage
Derna Stage
Al-Magrun
Al-Magrun
Tolmitha
Emselata
Misurata
Stage II
Tarhuna
Alkofra
Assaba
Stage I
Sabha
Projects
II
I
Project MW 60 60 80 110 50 50 50 50 50 120 120
Speed (m/s) 7 7 6.2 6.2 6.2 6.6 6.6 - - - -
Area (ac) 1350 1200 - - - - - - - - -
Development
Development
Construction
Construction
Negotiation
In Pipeline
In Pipeline
feasibility
feasibility
feasibility
Awarded
studies
studies
studies
Under
Under
Under
Under
Under
Project Statues
Number of WT 37 37 80 80 25 16 - - 50 - -
Capacity/turbine (MW) 1650 1650 1500 1500 2000 2000 - - 2000 - -
High tower (m) 71 71 - - - - - - - -
Blades Long (m) 42 - - 40 - - - - -
The use of PV systems in Libya began in 1976. Since then, the role of PV application has increased in size and type
of application. Table 4 summarizes the current situation of PV projects in Libya. However, Libya's climate is
subtropical. So it's much drier and warmer than most parts of the United States or Central Europe. Only a few humid
months a year, with a light rainfall. The average daytime temperature during the season is between 19 and 35°C.
Temperatures in some parts of the country rise to 41°C. During colder months, depending on the region, the average
temperature drops to 8°C. The Table shows six off-grid PV projects and two on-grid PV projects are in operation.
Further details can be summarized as follows:
• The first PV project is a PV system that provides cathodic protection to protect the oil pipeline connecting the
Dahra oil field and the Sedra port.
• Microwave communication networks contain more than 500 repeater stations. Until the end of 1997, only 9
remote stations operated with PV systems, with a total peak power of 10.5kWp
• The PV system used in communications projects started in 1980 to power a microwave transmitter near Zella
village.
• The PV pumping system was used in 1983 to pump water for irrigation in El-Agailat city.
• Household heaters were started in 1980 with the installation of a 35 system pilot project, followed by some
other projects. Water pumping projects were also built in early 1984.
• There are all together some 6,000 solar heaters
• PV systems were used in 2003 in rural electric and lighting fixtures as part of the national plan for the
electrification of scattered houses, villages and water pumps in rural areas, PV systems in ten villages
• The peak PV achieved in full microwave communication networks installed by the end of 2005 is
approximately 420KWp.
• The use of evacuated tubes for solar energy detectors has begun in some hotels and homes and is expected to
grow soon. The energy consumption to heat the water is approximately 12% of the national electricity
production.
• CSP concentrated solar energy is not yet used.
In addition, Misurata Free Zone (MFZ) signed a memorandum of understanding with iQ Power in 2018 to develop
integrated CSP and PV projects with a total capacity of 300 MW. As a partner, iQ Power, an American company
dedicated exclusively to the development of renewable energy in the Middle East and North Africa, is exploring how
CSP, PV or Hybrid can best utilize and optimize the smartest and latest engineering designs for the solar energy
industry to make the MFZ a state-of-the-art example of solar energy in North Africa. Moreover, MFZ is considering
building a seawater desalination plant that will use all or part of its solar energy as an energy source to meet Misurata’s
energy needs.
© IEOM Society International
126Proceedings of the 5th NA International Conference on Industrial Engineering and Operations Management
Detroit, Michigan, USA, August 9 - 11, 2020
Table 4 -Libya PV Projects
PV Projects
Capacity In Pipeline Under Construction Operation
Communication Repeater 950kWp
Mobile Phone 1859kWp
Off-Grid PV Water Pumping 120kWp
Street Lighting 1125kWp
Rural Electrification 725kWp
Roof Top Systems 3MW
Wadi-Marsit Centralized 67.2kWp
Grid Connected Small Scale 42kWp
Ghat Plant 15MW
On-Grid
Al-Jofra Plant 14MW
Sabha Plant 40MW
South Green Mountain 50MW
Rural Electrification 275kWp
However, Libya could become a supply and export platform for solar PV modules and inverters to countries in the
Middle East and Africa with solid pipelines for upcoming PV and CSP projects. However, the civil war and the current
unstable situation interrupted timid efforts to develop solar energy. Meanwhile, according to a recent study by the
University of Zawia in Libya, the country currently has about 9 GW of power generation capacity, consisting of 16
gas and oil plants operated by GECOL.
Under Libya's new tax legislation, all RE equipment and parts are completely exempt from import duties, and a new
electricity law is being prepared that will allow private sector companies to generate electricity. In addition, Libya has
a Renewable Energy Authority (REAOL) established in 2007 and a Solar Energy Research Centre established in 1978.
Meanwhile, Libya has been politically and economically unstable during the civil war since 2011, which has damaged
many infrastructure sectors, including GECOL facilities, power plants and most oil and gas fields. Nonetheless, we
are still suffering from a lack of capabilities to implement RE technologies. Here are some of the challenges and
difficulties:
The energy sector in Libya is closed to private investors. However, all planned RE projects are completely
funded by GECOL and REAOL, which are state-owned bodies with no prospect of privatization or
competition.
No fund has yet been created to finance RE projects. However, all planned RE projects are completely
funded by GECOL and REAOL, which are state-owned bodies with no prospect of privatization or
competition. As a result, most renewable energy projects have been delayed or suspended due to planning
and funding problems, mainly due to security and armed conflict situations since 2011.
Wind and solar atlas have not yet been developed and the lack of field data is a burden on planning and
decision-making.
There are gaps and obstacles that need to be addressed quickly, such as the wind and solar atlas not
yet developed, the lack of field data and the burden of planning and decision-making, the lack of
appropriate surveys, detailed studies of the current energy situation and the lack of detailed network
map for designated renewable energy sites.
Besides small scale scattered PV projects, there are practically no PV manufacturers
No grid code. Where, the grid code is a technical specification that defines the parameters that facilities
connected to the public power grid to meet to ensure the safe, secure, and economically viable operation of
the electrical system.
Nuclear Power
In 1963 Libya became a member of the International Atomic Energy Agency and has a Soviet-designed 10MWt
research reactor, built-in 1981. In the late 1970s, Libya signed a contract with the Soviet Atomic Energy Company
for two reactors, each supplying 440MW of electricity in the Gulf of Sirte. The reactors are designed for dual-use
electricity generation and desalination of seawater. As Libya was dissatisfied with the technology the Soviet Union
© IEOM Society International
127Proceedings of the 5th NA International Conference on Industrial Engineering and Operations Management
Detroit, Michigan, USA, August 9 - 11, 2020
wanted to provide, Belgian nuclear company Belgonucleaire was asked to take over the contract. However, the United
States rejected Belgonucleaire's protest over nuclear weapons concerns, and Libya once again appealed to the Soviet
Union. Finally, the project was stopped during the 1986 design phase. Libya and France signed an agreement on the
peaceful use of nuclear energy in 2006 and signed a memorandum of understanding in July 2007 on the construction
of a medium-sized nuclear power plant with the Areva reactor for desalination of seawater. Germany opposed this
agreement. This was followed by a memorandum sharing cooperation with Canada on nuclear medicine, desalination
technology and nuclear research (Cigar, 2012).
3.1.2 Switching to Low-Carbon Fuels
Low-carbon power plants result from processes or technologies that produce significantly lower CO2 emissions than
conventional fossil fuel power generation. Switching from high-carbon to low-carbon fuels, such as HFO or LFO to
NG, would greatly reduce CO2 emissions. Commonly, the amount of CO2 produced when fuel is burned is a function
of carbon content of the fuel. NG has higher energy content relative to other fuels and produces relatively less CO2.
However, a gas-fired power plant is a thermal power station which burns NG to generate electricity. Thus, GECOL
increased the dependence on the NG in order to reduce CO2 emission. It depends entirely on the source of electricity
in power plants HFO, LFO and NG to generate electricity demands. During 2018, 70% of the electricity generated by
natural gas, 21% of LFO and 9% of HFO as displayed in Fig 4. Oil and NG are expected to remain the main source
of energy in Libya, with mitigation measures for steam generators. It is worth noting that in 2016 electricity generated
by NG was 80%, LFO 13% and HFO 7%. The consumption of HFO and LFO decreased from 80% in 2004 (36%
HFO, 44% LFO) to 30% in 2018 (9% HFO, 21% LFO). NG consumption increases from 20% in 2004 to 80% in 2016
and 70% in 2018. The NG, as a low carbon fuel, will continue to be a key source of electricity generation.
Fig. 4 - Electricity Production by Fuel
3.1.3 Improve Efficiency of the Electrical Power Plant
Improving the efficiency of a power plant can also reduce CO2 emissions. One of the main efficiency goals of fossil
fuel plants is to improve the amount of heat. In conventional fossil fuel power plants, the water is boiling and
generating steam that activates the operation of the turbine (Rosen & Tang 2008). However, power plant efficiency
can be improved by (1) regular maintenance, (2) a combination of gas and steam cycles. This type called combined
cycle (CC) power plant or heat recovery steam generator (HRSG) power plant, (3) heating water to a critical point at
high pressures and temperatures. in this case, water acts as a supercritical fluid, and power plants are called
supercritical and ultra-supercritical power plants. However, supercritical and ultra-supercritical techniques have not
yet been implemented in the Libyan electrical generation sector, while CC technology was introduced in 2007.
A CC or HRSG is an energy recovery heat exchanger that recovers the source from a hot gas stream, such as a
combustion turbine or other waste gas stream. It produces steam that can be used to drive a steam turbine, in which
case it is called a combined cycle (Rosen & Tang 2008). HRSG means that fuel does not burn to generate electricity,
but that electricity is generated by a steam generator using the recovered heat from the CC (no fuel was burn). This
technique is considered to be a method of improving the efficiency of an electric power plant. The CC plant has a
thermodynamic cycle that operates between the high combustion temperature of the gas turbine and the waste
temperature of the steam cycle capacitors (Langston, 2004). In a nutshell, as illustrated in Fig. 5, the hot exhaust gases
from the initial GT are sent to the steam turbine, and its heat is used to generate steam. This steam is expanded through
another turbine, generating even more electricity (no fuel used) to increase the overall efficiency of the power plant.
GECOL started using CC technology in 2007 to improve the efficiency of the GT in Zawia and Benghazi North I,
expanding the CC technology.
© IEOM Society International
128Proceedings of the 5th NA International Conference on Industrial Engineering and Operations Management
Detroit, Michigan, USA, August 9 - 11, 2020
Fig .5 - CC Power Generation Technologies
Table 5 shows the efficiency of GECOL power plants between 2015 and 2018. During 2018, the average efficiency
of ST power plants ranged from 23% to 32%, while the efficiency of GT power plants ranged from 26% to 35% and
in CC from 32% to 42%. At the same time, there is a clear improvement in efficiency at some power plants between
2015 and 2018, especially in Zawia and Misurata, because these power plants have been modified to combined cycle
in 2007 and 2013 respectively. The CC power plants shows more efficiency than ST and GT. On the other hand,
efficiency improvements are not observed in GT power plants. Efficiency of ST power plants between 2015 and 2018
about 27%. While the GT shows better efficiency of 29% and a much better efficiency of about 41% in CC power
plants. In short, there has been a slight improvement in the efficiency of power plants. Further efforts are needed with
clear plans to improve performance, such as maintenance and good performance.
Table 5 - Efficiency of Power Plants between 2015 and 2018
Average Efficiency, %
Type Power Plant
2015 2016 2017 2018
Khalij 33 30 34 32
Khoms 29 29 30 30
ST
Tobruk 13 25 25 23 27
Derna 21 19 - -
Average Efficiency 24 26 30 28
West Mountain 29 30 29 29
Khoms - - 33 35
GT South Tripoli 27 27 26 26
29
Zwitina 30 28 27 30
Srrir 27 27 30 29
Average Efficiency 28 28 29 30
Zawia 42 43 41 42
CC Benghazi North 36 43 36 32
41
Misurata 47 36 42 42
Average Efficiency 42 41 40 39
Table 6 shows the existing HRSG power plants and their percentage of electricity generation between 2015 and 2018.
Almost a quarter of total electricity is generated by HRSG at the Zawia and Misurata power plants, while HRSG in
Benghazi North contributed only 7%. HRSG means that fuel is not burned to generate electricity. This is generated
by a steam generator that uses the heat recovered from the CC.
3.2 Measures Taken in T&D System
After generating electricity, the electrical grid transmits electricity from the electric power plant to the end-users. This
power grid is the overhead lines or ground cables that together form the so-called T&D system. Thus, the T&D system
is not just a bridge that physically connects the generation sector to the end-user phase, but is an important tool to
achieve the mitigating benefits of the two electrical supply chain components. There are a number of mitigation
© IEOM Society International
129Proceedings of the 5th NA International Conference on Industrial Engineering and Operations Management
Detroit, Michigan, USA, August 9 - 11, 2020
measures that can be used to reduce CO2 emissions in the electrical T&D system. Table 7 shows the carbon mitigation
measures that may be applied in the T&D system.
Table 6 - Combined Cycles Power Plants in Libya and their percentage of electricity generation between
Power No. of Operation Capacity
Fuel Type 2014 2015 2016 2017 2018
Plant Units Date (MW)
4GT × 165 2000 660
LFO or NG 76% 71% 74% 77% 75%
Zawia 2 GT × 165 2005 330
3 ST × 150 2007 450 HRSG 27% 29% 26% 23% 25%
3 GT × 150 1995 450
Benghazi LFO or NG 90% 93% 91% 92% 100%
1GT × 150 2002 165
North
2ST × 150 2007 300 HRSG 10% 7% 9% 8% 0%
2GT × 285 2010 570 LFO or NG 75% 72% 93% 82% 81%
Misurata
1ST × 250 2013 250 HRSG 25% 28% 27% 18% 19%
Table 7 - Measures Applied in the Electric T&D System
Action Taken Technology Case
EDM Balance between Power Generation & End-Users
Smart Grid
Use Fossil Fuel & Non Fossil Fuel on Grid
Technology
Reduce Technical Losses
Improving Grid
Reduce Non-Technical Losses
Efficiency
National Interconnection
3.2.1 Energy Data Management (EDM)
Dukkipati et al. (2014), with regard to EDM, pointed out that the effective policy formulation in the energy sector
relies on rigorous analysis of readily available, accurate, reliable and comprehensive data. The availability of such
data requires institutional mechanisms and processes to collect, process and disseminate data in a timely manner.
However, EDM Utilities cater to the needs of energy data management, dissemination and analytics. Data management
applies the management of data collected from smart grids and smart meters, meter data analytics (Prasad & Avinash,
2014). The data collected in smart grids are heterogeneous and require data analytic techniques to extract meaningful
information to make informed decisions (Potdar et al, 2018).
In early 2009, GECOL worked on the establishment of the EDM. This system consists of smart energy meters that are
installed in all power transformers, unit and auxiliary transformers, and connecting lines. The smart meters are
designed to be equipped with GSM communication to transmit data to telemetry stations. Some new power plants
have included smart meters and EDM-related equipment in the technical specifications, as was the case with Fast
Track units of Khoms.
The purpose of planning reserve margin is to measure the amount of generation capacity available over the planning
horizon to meet expected demand. However, reserve margin is (capacity - demand)/demand. Where, capacity is the
expected maximum available supply and demand is expected peak demand. For instance, a reserve margin of 15%
means that an electric system has excess capacity in the amount of 15% of expected peak demand (EIA, 2012).
However, peak demand on an electrical grid is simply the highest electrical power demand that has occurred over a
specified time period (Gönen 2008). Peak demand is typically characterized as annual, daily or seasonal and has the
unit of power. Peak demand, peak load or on-peak are terms used in energy demand management describing a period
in which electrical power is expected to be provided for a sustained period at a significantly higher than average supply
level. Peak demand fluctuations may occur on daily, monthly, seasonal and yearly cycles (Landsberg et al, 2008).
In 2017, the World Bank summarized the results of a rapid assessment of demand in Libya, noting that peak demand
and past electricity consumption have been growing slowly since 2012. Fig. 6 shows the evolution of peak demand
between 2000 and 2016. This shows demand peaked at 2.6GW in 2000 and continued to grow by 8%, reaching 5.8GW
in 2010. Then, during the Civil War, in 2011, electricity production declined due to damage to the grid and some
© IEOM Society International
130Proceedings of the 5th NA International Conference on Industrial Engineering and Operations Management
Detroit, Michigan, USA, August 9 - 11, 2020
power plants. During this year, demand peaked at 6GW and started growing again, but this time it grew by 4% to
reach 7GW in 2016.
Fig 6 – GECOL Peak Demand (World Bank, 2017)
The World Bank (2017) also noted that Libya is increasingly unable to meet peak demand, mainly due to a large lack
of capacity. Reserve margins are therefore very low, especially in the southern and western macro-regions. Likewise,
the splay and demand balance between power generation and end-users presents in Fig. 7. It shows unavailable
electricity capacity due to suspended units, installed electricity capacity at risk, and subject to availability. Obviously,
the reserve margin increased 3.5-fold from -6% in 2013 to -21% in 2016. Thus, Libya is increasingly unable to meet
its peak demand, mainly due to the high capacity unavailability. It is clear that GECOL has been suffering from a very
low reserve margin since 2010.
Fig. 7 - Balance Between Power Generation and End-Users (World Bank, 2017)
3.2.2 Smart Grid Technology
The term “smart grid” is used to represent a variety of interlinked social and technological changes to electricity
systems, particularly modernizing networks that link electricity producers and consumers through advanced
information and communication technologies (Morgan et al, 2009). Smart grid is considered to reduce energy
consumption, improve the efficiency of the electricity grid and manage RE access to enter the grid. The smart grid is
seen as a tool that increases the efficiency of the energy system in an environmentally friendly way and manage RE
production. This can be achieved by upgrading the network deployment and generator efficiency, transmission and
distribution, and power consumption (Abdalla et al, 2016). In a nutshell, smart grids are an important tool for achieving
energy savings, reducing emissions and mitigating climate change.
GECOL has built a strong transmission system. Strict design criteria have been used to ensure an appropriate level of
redundancy. GECOL has a solid vision for the creation and development of the power grid. The plan not only relies
on meeting the necessary needs but also takes into account the possible future of advanced automated communication
techniques and information technology, as well as other forms of techniques that manage RE access to the grid. There
is no doubt, however, that the escalated civil war has caused serious disruption to the grid system, resulting in some
deficiencies, delays, and poor coordination in the planning and expansion of the electrical T&D system. In the summer
of 2017 and 2018, customers in Tripoli and its suburbs experienced one or two power outages that can last up to 13
hours in total.
© IEOM Society International
131Proceedings of the 5th NA International Conference on Industrial Engineering and Operations Management
Detroit, Michigan, USA, August 9 - 11, 2020
However, Abdalla et al, in 2016 launched open research on the field of application of the smart grid in Libya. The
study discussed the requirements that should be considered for the current grid to be a smart grid, and they
recommended that GECOL begin upgrading its network equipment and installing new smart devices in each network
section. Thus, the study, which is a noteworthy practical step in this area, and which should be considered as a road
map for the implementation of the smart grid in Libya. With this and that, without a ceasefire, the transmission system
will continue to operate with isolated systems and the Libyan population will continue to experience extended energy
supply blackouts daily. National stability would enable foreign contractors to return and resume their work. However,
GECOL Utility Maintenance teams have repeatedly entered conflict areas to repair repeated damaged power lines and
restore electricity. Since the 400 kV transmission grid system is still relatively new in Libya, with recently installed
overhead wires, GECOL has a relatively small supply of materials to repair damaged circuits. The situation is slightly
better with the 220kV transmission system overhead lines and the 66 and 30kV distribution grid lines as GECOL has
enough spare parts to repair the circuits. Where and whenever possible, GECOL started to repair damaged overhead
lines as well as medium-voltage and low-voltage substations. Moreover, GECOL is taking advantage of this time to
train its staff on smart devices, SCADA, and integrated energy. After national stability, GECOL will be ready to
deploy a smart grid system.
3.2.3 Improve Grid Efficiency
Improving the grid means reducing electricity losses. In fact, there are two types of losses: technical losses and non-
technical losses. Technical losses occur naturally and depend on the type of conductors used, the capacity of the
transformer and other components used for the transmission and distribution of electricity. These losses are inherent
to the distribution of electricity and cannot be eliminated, but can be reduced (Antmann, 2009). On the other hand, in
the case of non-technical losses, the amount of energy consumed is uncertain. These can be considered as electricity
consumed but not invoiced. These are losses due to unidentified, poorly distributed or inaccurate energy flows.
Glauner et al (2018) stated that the three main types of non-technical losses are: energy theft, errors in unmetered
supplies, and conveyance errors.
GECOL has upgraded its transmission line infrastructure to minimize network losses and improve efficiency and
reliability. The total length of the 220kV and 400kV transmission systems is approximately 16,000km and the average
voltage of the 33kV and 66kV systems is approximately 28,000km. GECOL, also, standardized the design of the
overhead lines, so that they are all double circuit lines with towers capable of surviving some of the most severe
environmental conditions and events. In addition to the growing reliance on natural gas, GECOL has, as a further step,
build a 400kV transmission system that will increase the efficiency and reliability of the power transmission system.
Lately, some transmission lines and substations are down, mainly due to security and conflict situations. Cut and
broken OPGW lines and fiber optic connections, also, have led to widespread disruption of the telecommunications
network. Fig. 8 shows the Libyan transmission system.
Fig. 8 – GECOL Transmission System and Interconnection Points
Reduce Technical and Non-Technical Losses
GECOL has established its own overhead line maintenance teams since the early 1990s. The overhead line
maintenance teams acquired experience in all types of overhead maintenance and repair. on the other hand, GECOL
has not been able to keep up with the cleanliness of the overhead required to keep its transmission overhead working
© IEOM Society International
132Proceedings of the 5th NA International Conference on Industrial Engineering and Operations Management
Detroit, Michigan, USA, August 9 - 11, 2020
well. The chains of contaminated insulators are subject to electric shocks during periods of high humidity, in addition
to increasing system losses and electromagnetic noise that can cause interference in communications systems. Sources
of pollution include saline deposits from the sea and dust from rock quarries, which are located near the transmission
line in many parts of Libya. However, to minimize network losses and improve grid efficiency, overhead lines are
usually cleaned with harsh force. The linemen would climb the towers to the insulating strings and clean the insulating
discs by hand. The cleaning of individual dual circuits took many days to weeks. GECOL has been applying a less
labor-intensive methodology in recent years.
Regular maintenance of the power grid is the main key to maintaining grid efficiency. However, GECOL maintenance
activities are initiated by the maintenance programming department, which prepares the maintenance plan annually.
Today, the maintenance department operates more than 30 km of high-voltage lines and nearly 300 substations.
GECOL currently uses three different types of maintenance approaches to maintain the network; preventive
maintenance, predictive condition-based maintenance, and corrective maintenance.
(1) Preventive Maintenance: maintenance approach that is regularly performed on equipment to check the likelihood
of its failing. Preventative maintenance is performed while the equipment is still working, so that it does not break
unexpectedly. This preventive maintenance for all substations equipment, high voltage lines, substations indoor
feeders, line remote protection, and also, for load shedding schedule. So that they are scheduled (Periodically)
Daily, weekly, monthly, semi-annually, annually, etc. Recently, the lines are mostly cleaned with water tankers
fitted with pumps and water pipes. Tankers can be moved along the line, from tower to tower. The pumps are
powerful enough to deliver a jet of water up to the height of the 220kV and 400kV insulating sleeves. The line
guides partially work the hoses on the towers to better control the flow of water than the insulators.
(2) Predictive Condition-Based Maintenance: a maintenance approach used to predict the occurrence of equipment
failure and in which monitors the actual condition of the device to determine if maintenance is required. This type
of maintenance is for all substation equipment and high voltage lines depending on the situation of the triggered
by asset and equipment condition.
(3) Corrective Maintenance: a maintenance approach that is performed when equipment failure occurs when
triggered.
The basic analysis showed that the implementation of the GECOL maintenance plan is often interrupted by several
unplanned maintenance work orders. In the recent period, the implementation of the maintenance plan has been
negatively affected by the security situation, receiving emergency, unscheduled, and unplanned maintenance work
orders. However, in 2012, GECOL contracted local contractors to assist in the maintenance of the 400KV and 230KV
lines and achieved the highest performance rate the period 2012 to 2015. In 2015, the maintenance plan aimed to
fulfill 12,576 maintenance work orders, but only 8,027 were fulfilled, representing a completion rate of 63.8%. In
addition to the work orders included in the maintenance plan, GECOL had 8894 unplanned maintenance work orders,
of which 8,113 executed work orders, representing a performance rate of 91.2%.
Current state of the transmission system; certain it has recently been severely damaged by civil war, vandalism and
theft. It affected overall lines, substations and cables were affected. However, the most serious and lasting cases are
the damages in the south and west of Benghazi between 2014 and 2015, which led to the unbundling of the network
to the eastern and western sections, the reduction of load in Benghazi and the lack of production and the consequent
load reduction in the western network. In almost cases GECOL has been able to repair, replace, or compensate for the
damaged parts of the network. The World Bank (2017), indicating the current performance of technical losses,
remained unchanged, losses were generally kept at pre-2011 levels and is aligned with regional peers. However, Fig.
9 shows transmission and distribution losses between 2010 and 2015. It is clear that T&D losses remain unchanged
and generally show pre-2012 levels. In 2015, transmission losses were 1.8% and distribution losses were
approximately 13.4%. Therefore, the total technical losses in 2015 was 15.2%.
Since technical losses are caused by technical reasons, non-technical losses (commercial losses) are caused by human
factors. In 2009, GECOL performed an analysis of grid losses and the calculation of losses at each voltage level in the
power grid. The results show that 15% of the losses were non-technical losses and 17% losses in technical lines losses.
Fig. 10 shows the non-technical losses from 2010 to 2015 as well as the electricity generated versus the electricity
invoiced in 2015. The value of non-technical losses jumped from 20% in 2010 to 65% in 2014, then it declining
slightly to 60% in 2015. This is due to electricity theft, illegal connections, customer payment difficulties, and poor
management of unpaid bills. However, there are currently no additional actions to reduce non-technical losses, but
GECOL is following some measures to reduce technical losses through maintenance, 400 kV and 220 kV networks,
© IEOM Society International
133Proceedings of the 5th NA International Conference on Industrial Engineering and Operations Management
Detroit, Michigan, USA, August 9 - 11, 2020
substations and national interconnection. The analysis generally shows that the electric T&D system suffers significant
and steadily increasing non-technical losses by 24%, which is considered very high. Thus, according to the World
Bank (2017), the situation in Libya is critical towards regional partners such as Egypt, Algeria and Tunisia. However,
the electricity generated, in 2015, was about 35.4TWh, while electricity invoiced only 8.9TWh, with total losses of
about 75%.
Fig. 9 - Technical Performance of the Transmission and Distribution Networks (World Bank, 2017)
Fig. 10 - Non-Technical Losses from 2010 To 2015 (World Bank, 2017)
Interconnection National Grid
GECOL management also has a solid vision for the development and growth of the transmission system. The planning
was not only based on the requirements to meet the load needs of the grid, but also considered the possible future
energy transfer between Egypt and Tunisia via the Libyan grid network. However, the interconnection of electricity
networks in several countries has many advantages. The main benefit is postponing or avoiding the construction of
new power plants. it is sharing electricity between interconnected grids without affecting their security and reliability.
Interconnection also reduces the need for standby capacity to meet fluctuations in demand, which in turn reduces
operating costs. It allows the construction of new generation power plants in the most economically attractive areas,
typically near inexpensive fuel sources. Accordingly, Libya's grid is currently connected to Egypt via a 220kV dual-
circuit overhead line. The Egypt-Libya link, rated at 170MW, became operational on 220kV in 2008. The
interconnection was supposed to be reinforced with a 500kV high-voltage line on the Egyptian side and a 400kV
Libyan side, but the project seems to have stalled due to the political and economic instability that has existed since
the 2011civil war. Also, there are two 220kV lines linking the Libyan grid to Tunisia, one double-circuit line along
the coast and one single-circuit line through the desert. Fig. 8 shows the interconnection point between Libya and
Egypt and between Libya and Tunisia.
3.3 Measures Taken in End-Users Stage
Energy saving is the most effective measure to reduce CO2 emissions at the end-user stage. It is a series of engagement
activities aiming at energy conservation and environmental protection, by optimizing the terminal power consumption
© IEOM Society International
134Proceedings of the 5th NA International Conference on Industrial Engineering and Operations Management
Detroit, Michigan, USA, August 9 - 11, 2020
mode and improving utilization efficiency. Thus, the power demand and CO2 emissions decrease indirectly. However,
as end-users (consumers) are ever more dependent on electricity networks, they have certain expectations for
electricity services. According to ISO 17743: 2016, energy efficiency aims to reduce the amount of energy required
to provide products and services. Thus, the end-user wants electricity to be affordable, clean, reliable and capable of
supporting both the developing economy and society. Therefore, managing energy demand and end-use efficiency can
be a key contributor to reducing CO2 emissions.
3.3.1 Demand Side Management (DSM)
DSM was coined following the time of the 1979 energy crisis (Torriti, 2015). DSM is the modification of consumer
demand for energy through various methods such as financial incentives and behavioral change through education
(Chiu, 2012). DSM was introduced publicly by Electric Power Research Institute (EPRI) in the 1980s. Nowadays,
DSM technologies become increasingly feasible due to the integration of information and communications technology
and the power system (Balijepalli et al 2011). Generally, the purpose of managing the demand side is to encourage
the consumer to use less electricity during peak hours or to shift the time of electricity use to off-peak times such as
night and weekends. Peak electricity demand, however, refers to the times when electricity consumption is highest.
The demand for energy in Libya is grown rapidly, against the backdrop of population growth and development
projects. Generally, Libya's electricity consumption is high, while the country is considered to be Africa's largest
energy consumer, as Libya is high in electricity consumption and Africa's per capita energy consumer (Energy
Informations, 2013). On the other hand, 99.8% of Libyan people have access to electricity, which is the highest among
African countries. According to GECOL, in 2011 Libya's electricity consumption totaled 32.960 TWh, which
corresponds to 3.73MWh per capita. Commercial and public services accounted for 36%, while the retail sector
accounted for 24% and the industry for 22%. Since DSM endeavors aim to control or limit the demand for electric
energy, both are important to GECOL, the priority in the short to medium term should focus more on reducing peak
power demand. GECOL implemented the first phases of a DSM study in 2010. Where, the study determined the
average daily load curve during the summer and winter peak periods and the contribution of each consumer sector to
the load curve, as well as a breakdown of the end-use contribution to this demand. Fig. 12 shows the peak demand for
end-users in winter and summer system demand. It shows that residential lighting and heating, ventilation and air
conditions (HVAC) together exceeded one-third of total demand. Demand for winter peak lighting and HVAC, which
is about 32%, is slightly lower than the peak demand of 36% in summer. Lighting alone accounts for a quarter of total
winter peak demand and exceeds this value in summer to become 29%. While at the summer peak, lighting and heavy
industry sectors contribute to peak demand, which together account for 4%, while winter peak demand increases to
6% of total demand. However, a later review of the study questioned the amount of public lighting demand, and it
estimated that it was overestimated by up to 10%. The study, also, shows that there is a potential to reduce peak loads
by promoting high energy efficiency equipment such as air conditioners, water heaters and lighting. Currently, the
government is encouraging a switch to solar irrigation systems, solar water heating and solar water pumping.
Nevertheless, there is no time-differentiated price structure in the industrial sector that would encourage consumers to
shift away from peak times. In addition, there is no special charge for households to encourage the rational use of
energy.
Fig. 12 - Peak Demand for End-Users in Winter and Summer
3.2.2 Smart End-Users
Currently, there is no designated energy efficiency agency. Where energy efficiency promotion activities are currently
under the auspices of the Renewable Energy Authority of Libya (REAOL). While the number of electricity consumers
© IEOM Society International
135You can also read