A Water-Energy-Food Nexus approach for conducting trade-off analysis: Morocco's phosphate industry in the Khouribga region
←
→
Page content transcription
If your browser does not render page correctly, please read the page content below
Hydrol. Earth Syst. Sci., 24, 4727–4741, 2020
https://doi.org/10.5194/hess-24-4727-2020
© Author(s) 2020. This work is distributed under
the Creative Commons Attribution 4.0 License.

A Water-Energy-Food Nexus approach for conducting trade-off
analysis: Morocco’s phosphate industry in the Khouribga region
Sang-Hyun Lee1 , Amjad T. Assi2 , Bassel Daher2,3,4 , Fatima E. Mengoub5,6 , and Rabi H. Mohtar2,7,8
1 Research   Institute for Humanity and Nature, Kyoto, Japan
2 Department    of Biological and Agricultural Engineering, Texas A&M University, College Station, TX 77843-2117, USA
3 Texas A&M Energy Institute, Texas A&M University, College Station, TX 77843, USA
4 Institute for Science Technology and Public Policy, Bush School of Government and Public Service,

Texas A&M University, College Station, TX 77845, USA
5 Policy Center for the New South, Suncity Complex, Building C, Angle of Addolb Boulevard

and Albortokal Street, Rabat, Morocco
6 Mohammed VI Polytechnic University, Lot 6620, Hay Moulay Rachid 43150, Ben Guerir, Morocco
7 Zachry Department of Civil and Environmental Engineering, Texas A&M University, College Station, TX 77843-3136, USA
8 Department of Agricultural and Food Sciences, American University of Beirut, Beirut, Lebanon

Correspondence: Rabi H. Mohtar (mohtar@aub.edu.lb)

Received: 28 April 2020 – Discussion started: 18 May 2020
Revised: 11 August 2020 – Accepted: 24 August 2020 – Published: 5 October 2020

Abstract. The study objective was to develop and use the          creased from 5.8 × 10⁶ to 5.2 × 10⁶ m3 . Dynamic manage-
Water-Energy-Food Nexus Phosphate (WEF-P) Tool to eval-           ment of the phosphate industry can also save 143 MWh
uate the impact of Morocco’s phosphate industry on water,         (megawatt-hour) of electricity annually and can bring a re-
energy, and food sectors of Khouribga, which is the repre-        duction of 117 t of CO2 emissions. Making water available at
sentative phosphate mining region of Morocco. The devel-          the correct season and location requires analysis of complex
oped WEF-P Tool enabled a trade-off analysis based on in-         scientific, technical, socioeconomic, regulatory, and political
tegrating supply-chain processes, transportation, and water–      issues. The WEF-P Tool can assist by assessing user-created
energy footprints of the region. Field data from the mining to    scenarios; thus, it is an effective management-decision aid
transportation processes were collected and applied to pos-       for ensuring more sustainable use of limited resources and
sible supply-chain scenarios in accordance with the type of       increased reliability of water resources for both agricultural
product (phosphate rock and slurry). The potential impacts        and industrial use. This study on the applications of WEF
of the scenarios were considered in terms of the water sup-       Nexus to the phosphate industry offers a roadmap for other
ply in the agricultural areas. The analysis of the positive im-   industrial application for which trade-offs between the pri-
pacts of dynamic management suggests that seasonal man-           mary resources must be considered.
agement of phosphate production (less during the irrigated
season, more during wetter or rainier seasons) is more ef-
fective. Additionally, while the transport of raw phosphate
slurry through a pipeline increased the total water required to   1   Introduction
34.6 × 10⁶ m3 , which is an increase of 76 % over the “busi-
ness as usual” (BAU) scenario, it also resulted in an energy      Nexus thinking emerged from the understanding that nat-
savings of nearly 80 % over BAU: slurry transport requires        ural resource availability can limit and is limited by eco-
only 40.5 × 10⁶ L of fossil fuel instead of the 204 × 106 L re-   nomic growth and other goals associated with human well-
quired to transport rocks. During the dry or “water-scarce”       being (Hoff, 2011; Keulertz et al., 2016). The innovative as-
irrigation season (May to July), total groundwater use de-        pect of nexus thinking is its more balanced view of the issues
                                                                  linking resources (Al-Saidi and Elagib, 2017). Thus, nexus

Published by Copernicus Publications on behalf of the European Geosciences Union.
4728 S.-H. Lee et al.: WEF-P Nexus Tool for Morocco’s phosphate industry frameworks identify key issues in food, water, and energy water and energy, which in turn leads to issues of downscal- securities through a lens of sustainability and seek to pre- ing water or energy securities. dict and protect against future risks and resource insecuri- The nexus framework is dependent on the stakeholders, ties (Biggs et al., 2015). The 2015 World Economic Forum system boundary, and analytical tools. In considering the ap- identified water, food, and energy shocks as primary future plication of the nexus as a platform, an integrated model- risks, calling for increased efficiency in water use across all ing approach is essential. These issues manifest in very dif- sectors and the implementation of integrated water resources ferent ways across each sector, but their impacts are often management. Various conceptual frameworks relating to the closely related in terms of trade-offs. In particular, the sub- nexus approach were developed: the Dubois et al. (2014) em- nexus needs to be effectively conceptualized and a theoretical phasized the role of the nexus in food security, and the In- sub-nexus developed. Private-sector water, energy, and food- ternational Renewable Energy Association (Ferroukhi et al., supply-chain players are the key stakeholders to address cur- 2014) applied the nexus approach in transforming conven- rent contradictions arising as a consequence of attempts to tional energy systems to renewable systems. develop a grand nexus approach (Allan et al., 2015). Accord- The demand for water, energy, and food is expected to in- ingly, we must consider the “specialized” nexus of multi- crease due to drivers such as population growth, economic stakeholders, such as agriculture, industry, and urban areas, development, urbanization, and changing consumer habits for which water, energy, and food are treated as subsystems. (Terrapon-Pfaff et al., 2018). The interlinkages across key Current nexus frameworks often focus on macrolevel drivers natural resource sectors and improving their production ef- of resource consumption patterns (Biggs et al., 2015), but ficiency offer a win-win strategy for environmental sustain- major nexus challenges are faced at local levels (Terrapon- ability for current and/or future generations (Ringler et al., Pfaff et al., 2018). Thus, “larger-scale” extraction and con- 2013). Accordingly, application of the Water-Energy-Food sumption of natural resources may lead to depletion of natu- (WEF) Nexus concept or approach is expected to make im- ral capital stocks and increased climate risk with no equitable plementation of the Sustainable Development Goals (SDGs) share of the benefits (Hoff, 2011; Rockström et al., 2009). Al- more efficient and robust (Brandi et al., 2014; Yumkella and Saidi and Elagib (2017) showed the importance of exploring Yillia, 2015). The SDGs are classic examples of the neces- driving forces and interactions at different scales in the con- sity to acknowledge multidimensional nexus interlinkages ceptual development of the nexus, emphasizing more case- and trade-offs, particularly as governments are challenged study-based recommendations in the reality of institutions, to maximize benefits and invest limited resources. Infras- bureaucracies, and environmental stakeholders. tructure and capital are needed to achieve national SDG tar- Morocco’s phosphate and agriculture industries offer an gets, and the nexus concept is now used to highlight inter- example of increasing resource pressures attributable to near- dependencies between resources and the need for integrated, and medium-term growth across these sectors (Taleb, 2006). sustainable governance and management of those resources A holistic approach that considers the needs of all stake- (Pahl-Wostl, 2019). holders is necessary to resolve resource allocation pressures. The debate surrounding effectively addressing water and Between 1990 and 2016, Morocco’s population grew from food security challenges stems from questions about whether 25 million to 35 million people (World Bank, 2019a). Both the water–food crisis is due to a poor understanding of the crop production and total cultivated land significantly in- resources or to their improper management (Mohtar et al., creased since 1971; half of Morocco’s arable land receives 2015; Keulertz and Mohtar, 2019). One long-standing chal- less than 350 mm of rainfall annually, and nearly 87.3 % of lenge to water management lies in the lack of integration Morocco’s total water withdrawals are used for agriculture among the multiple sectors that interact with the water sec- (FAO, 2015). Per capita consumption of electric power in- tors across geographical areas or within large, transboundary, creased from 358 kWh (1990) to 901 kWh (2014); energy basins (Mohtar and Lawford, 2016). Projections about avail- use by oil equivalent per capita increased from 306 to 553 kg ability and quality of water, food, energy, or soil resources are during the same period (World Bank, 2019b). Proper man- often alarming. A fundamental shift is needed away from tra- agement of water, energy, and food resources is critical to ditional “silo” approaches and toward more integrative sys- economic, social, and environmental wellbeing. tems approaches (Daher and Mohtar, 2015). Energy and wa- Globally, phosphates lie at the heart of agriculture and soil ter are crucial for economic growth, especially in industrial- enhancement. More than 75 % of global phosphate reserves, ized areas (Flörke et al., 2013; Cai et al., 2016), making the representing 30 % of the global market share, are found in rapid increase in demand for these resources a serious issue Morocco, positioning that country at a leading role in global for both economics and the environment. While technology food security (OCP, 2013). Phosphate mining and its chem- to reduce industrial demand for water and energy is impor- ical processing require considerable water, energy, land, and tant, we must also understand the relationship between eco- other resource inputs. Morocco uses recycling and reverse nomic growth, water–energy consumption, and the impact of osmosis desalination to relieve some of the pressure on its industrial activity on agriculture at the local level. Increase in fresh water resources and help secure the water necessary for industrial products can cause steep increases in demand for phosphate production processes (OCP, 2016b). Each water Hydrol. Earth Syst. Sci., 24, 4727–4741, 2020 https://doi.org/10.5194/hess-24-4727-2020
S.-H. Lee et al.: WEF-P Nexus Tool for Morocco’s phosphate industry 4729
source carries a distinct energy tag that must be accounted The output in Khouribga is raw phosphate produced as ei-
for, especially in a country that imports nearly 90 % of its ther rock or slurry, which is the main component of manu-
consumed energy (World Bank, 2019c). Water, energy, land, factured phosphorous fertilizers. The transport of the phos-
and financial resources are frequently shared between mul- phate (rocks and slurries) from Khouribga (mining area) to
tiple sectors, especially agriculture (food production) and Jorf Lasfar (industrial production area) is a primary project in
municipal (growing urbanization) sectors, and Morocco is Morocco (OCP, 2016a). The demand for raw phosphate and
no exception. It is critical that potential sectoral competi- the production and export of fertilizer and its products from
tion be understood, quantified, and accounted for when plan- Jorf Lasfar drive the upstream mining activity of Khouribga.
ning for the sustainable progress of all sectors. An integrated In 2015, approximately 20.1×10⁶ t of raw phosphate was ex-
approach to resource allocation is needed to minimize in- cavated, which was 58 % of total raw phosphate excavated in
evitable competition for resources, i.e., one that quantifies Morocco in 2018 (OCP, 2020), and transported to Jorf Las-
the trade-offs associated with the possible pathways. As Mo- far; about 40 % of this product was transported via pipeline
rocco heads toward achieving its phosphate production goals, as slurry and the rest via train as rock.
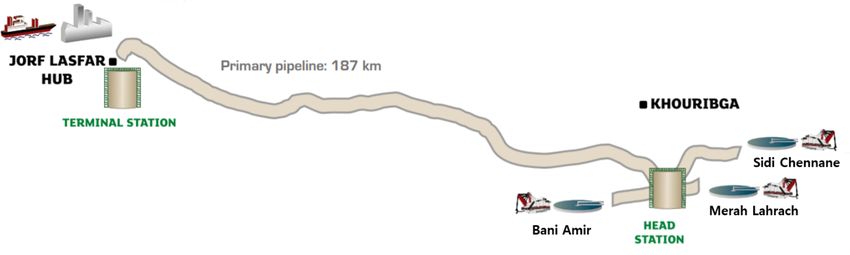
the ability to account for the resources associated with that The pipeline from Khouribga to Jorf Lasfar is 187 km
achievement should be balanced with the associated (and in- and ensures the continuous transport of phosphate from the
creasing) agriculture and municipal demand projections; this Khouribga to Jorf Lasfar (Fig. 1). As the plan was to increase
is key to sustainable resource allocation (OCP, 2013). phosphate production and phase out transport by train, tracks
This study adapted the WEF Nexus Tool linking indus- were replaced by pipeline that ensures the continuous flow of
try and agriculture to integrate the supply chain for indus- raw phosphate from the mining to the industrial area (OCP,
trial products. Using the tool, the authors evaluated the im- 2016a). The plans impact regional water, energy, and food
pact of Morocco’s phosphate production on the water, en- management: in particular, shifting from train to pipeline re-
ergy, and food resource systems of its mining region and then quires additional water to convert dry rock into liquid slurry.
addressed the resource elements in the supply-chain man- Shifting from train to pipeline changes the demand for water
agement of phosphate production. Specifically, they assessed and energy resources at both the mining and the production
the impact of phosphate mining and transportation by slurry locations.
pipeline on potential water and energy savings in the mining In accordance with the Green Morocco Plan (“Plan Maroc
area. The results suggest the need for dynamic management Vert”) (Stührenberg, 2016) and the National Water Plan
of phosphate production, i.e., one that adjusts monthly phos- for Morocco, the use of surface water as a substitute for
phate production in consideration of its potential impacts on groundwater is encouraged: water withdrawals from regional
water and energy management in agricultural areas. The spe- aquifers are being phased out since 2010, which are to be re-
cific objectives of the study are to quantify the water, food, placed entirely by surface water from the nearby Aït Mes-
and energy used by the phosphate industry in the Khouribga saoud Dam, which has a capacity of 13.20 × 10⁶ m3 . The
region of Morocco and to assess the trade-offs of resource plan is to allocate 4.5 × 10⁶ m3 yr−1 of water from the dam
allocations between agriculture and industry. to the mining site. Additionally, OCP launched a plan to
complete treatment plants for urban wastewater (capacity
5 × 10⁶ m3 yr−1 ) to be used for washing phosphate and in-
dustrial reuse in the mining area (OCP, 2016b). The phos-
2 Materials and methods phate mining area is encircled by cropland, whose water is
also supplied from the dam. In this study, the authors con-
2.1 Site description sider the allocation of treated water to both the phosphate in-
dustry and agricultural irrigation (Tian et al., 2018). Both the
We contacted the managers and engineers working in the Of- mining and the agricultural activities of the region represent
fice Chérifien des Phosphates (OCP) group (officially OCP growing enterprises that place added pressure on available
Group), which is the leading phosphate producer in Mo- water resources, making the sustainable management of the
rocco, and we had a lot of discussion about the site, data, water supply a hotspot to be considered in trade-off analyses.
policy, and goals. OCP Group accounts for 3 % of the coun-
try’s gross domestic product and about 20 % of national ex-
ports in value over the course of the 20th century (Croset,
2012). The OCP Group ran three mining fields: one in central
Morocco, near the city of Khouribga, and two on the Gan-
tour site. Khouribga, the largest mining area, includes three
main sites from which raw phosphate is excavated and trans-
ported for chemical processing and fertilizer production: Sidi
Chennane (SC), Merah Lahrach (MEA), and Bani Amir (BA)
(Fig. 1).
https://doi.org/10.5194/hess-24-4727-2020 Hydrol. Earth Syst. Sci., 24, 4727–4741, 20204730 S.-H. Lee et al.: WEF-P Nexus Tool for Morocco’s phosphate industry
transportation scenarios. The tool assesses the effects of de-
cisions of dynamic management of phosphate production as
these impact water and energy securities. The WEF-P Tool
can assess various scenarios and help account for interdepen-
dencies between food and industrial production and between
water and energy consumption, thus allowing the trade-offs
associated with potential resource allocation pathways to be
Figure 1. Study areas: phosphate mining area (Khouribga), quantified.
fertilizer manufacturing area (Jorf), and transportation sys- Throughout the tool development process, the supply
tem (slurry pipeline) (http://www.ocpgroup.ma/ocpslurrypipeline/ chain was verified with OCP and the OCP Policy Center in
slurry-pipeline, last access: 10 September 2019). various ways: (i) during the data collection phase, through
meetings with the OCP steering committee, financial man-
agers, technical managers, and engineers; and (ii) through
2.2 Development of Water-Energy-Food Nexus follow-ups with the OCP Policy Center team (conference
Phosphate (WEF-P) Tool calls and email). The OCP Policy Center team shared their
main concerns regarding the tool structure with the WEF
2.2.1 Overall framework of WEF-P Tool Nexus team , based on input from the OCP technical team.
The WEF Nexus team used these shared concerns in their
The developed WEF-P Tool, adapted from the WEF Nexus considerations of revisions to the tool structure and associ-
Tool 2.0 (Daher and Mohtar, 2015), considers the supply ated Excel spreadsheets of the model. Specifically, the major
chain of final product in terms of its resource consumption, aggregated processes and lines of production were revised
including the set of processes that pass materials forward and identified in a functional supply chain to maximize the
(Mentzer et al., 2001) and various organizations or individu- abilities and flexibilities of the model and ensure efficacy of
als directly involved in the flow of products (Mentzer et al., the available database for processes and production lines.
2001). It assesses the impact of various scenarios and pos- However, the WEF-P Tool has limitations in assessing
sible responses to regional resource management needs. Ta- economic impacts such as cost and benefit analysis. This is
ble 1 shows the differences between WEF Nexus Tool 2.0 because cost must include the price of water, which is still
and WEF-P Tool in the context of variables, scenarios, ana- under discussion, and the price of products when analyzing
lytical tools, and quantitative assessments. their benefits. Raw phosphate is transported to the manufac-
Both tools offer a platform for development of the ana- turing area and used in the production of various fertilizers
lytics necessary to understand the trade-offs and catalyze a that have different prices: this makes it difficult to set the
stakeholder dialogue (Mohtar and Daher, 2016, 2014). The price of excavating raw phosphate in the mining area. Sus-
core of the WEF Nexus is that production, consumption, and tainability assessment also has qualitative aspects in terms of
distribution of water, energy, and food are inextricably inter- environmental impact. The WEF Nexus Tool 2.0 applied the
linked: decisions made in one sector impact the other sec- sustainability index based on resource capacity and availabil-
tors (Hoff, 2011; Mohtar and Daher, 2014). The WEF Nexus ity; however, it is still a quantitative aspect. We should con-
Tool 2.0 allows for holistic quantification of the impact of sider the meaning and definition of sustainability, both quan-
resource allocation strategies to support informed and inclu- titatively and qualitatively, and then assess the index using
sive stakeholder dialogue between policy makers, private- the stakeholder weights for the variables related to sustain-
sector firms, and civil society (Daher and Mohtar, 2015). ability. Additionally, spatial and temporal scales should be
Each stakeholder becomes involved at different stages and included in a sustainability index. For example, the pipeline
scales in the decision-making process. In the WEF-P Tool transportation system requires water, which is transported
(Fig. 2), water resources are shared between the phosphate with products: the pipeline causes greater water use at the ori-
industry and agricultural interests in the region of study. Sus- gin but also provides additional water to the destination area.
tainable water management must holistically consider the al- Also, the water requirement differs with temporal season,
location of water resources for both industrial production and such as the water-intensive agricultural production season.
agricultural irrigation. New water (treated urban wastewater) Thus, more research is needed for a sustainability assessment
has the potential to contribute significantly to bridging wa- based on economic and environmental impacts. However, the
ter and food gaps (Mohtar et al., 2015). However, it carries quantitative analysis is an essential factor for assessing sus-
an energy footprint that must be considered when increas- tainability; therefore, the WEF-P Tool focuses on quantifica-
ing local food production. Potentially, agricultural demand tion of (1) water and requirements for phosphate production
for water competes with those of a growing industry. The and transportation, (2) carbon emissions by energy used in
tool quantifies the use of water and energy and the amount product processes, (3) water supply system and transporta-
of CO2 emitted for each scenario. It also quantifies the water tion, and (4) dynamic production impacts on water and en-
and energy savings resulting from choices made regarding ergy savings.
Hydrol. Earth Syst. Sci., 24, 4727–4741, 2020 https://doi.org/10.5194/hess-24-4727-2020S.-H. Lee et al.: WEF-P Nexus Tool for Morocco’s phosphate industry 4731
Table 1. Comparison between WEF Nexus Tool 2.0 and WEF-P Tool.
WEF Nexus Tool 2.0 WEF-P Tool
Variables and scenarios – Self-sufficiency of produced crops – Static and dynamic phosphate production
– Type of agricultural production – Transportation modes (train and pipeline)
– Sources of water (groundwater, surface water, – Sources of water (groundwater, surface water,
treated water, and so on) treated water, and so on)
– Sources of energy (natural gas, diesel, solar, wind, – Water allocation between industry and
and so on) agriculture
– Trade portfolio (countries of import and amounts
per country)
Analytical tool – Food product base analysis – Process-based analysis
– Food-centric interlinkages among water, energy, – Phosphate-centric interlinkages among produc-
and food tion, transportation, and resource allocation
– Water and energy footprint based on product – Water and energy footprint based on processes
(e.g., water footprint of crops) (e.g., water footprint in washing process)
Quantitative assessment – Water requirement for energy and agricultural – Water and requirement for phosphate production
production and transportation
– Energy requirement for agricultural and water – Carbon emission by energy used in product pro-
production cesses, water supply system, and transportation
– Land footprint for agricultural and energy – Dynamic production impacts on water and
production energy savings
– Carbon emissions from energy used for water and
food production
– Financial cost
2.2.2 Analysis of integrated supply chains linking
subprocesses and transportation modes
The WEF-P Tool used the WEF Nexus approach to assess
the life cycle of the final products supply chain. The wa-
ter and energy used to produce subproducts and final prod-
ucts were calculated by adding the water and energy require-
ments from the subprocesses through the production supply
chain. In Khouribga, raw phosphate products pass through a
sequence of functional processes for SC and MEA (Fig. 3):
mining and screening (S), washing (WW), grinding (WG),
flotation (WF), adaptation including powdering (WA), and
drying. The mining and screening processes include extrac-
tion from the ground, tone removal, and screening to produce
pieces of phosphate rock. Here, the supply chain is deter-
mined by the quality and size of the phosphate rock, which
in turn depends on the phosphate content at extraction, which
ranges from very low to high. High-quality phosphate rock
is transported to a drying process from which it will either
Figure 2. Assessment of holistic impacts of various scenarios relat- be marketed or chemically transformed into fertilizer at the
ing to the phosphate industry, agriculture, and resource management manufacturing site. Low- to medium-quality phosphate rock
using WEF-P Tool. is washed, dried, ground, and subjected to flotation, which
intended to increase the phosphate content.
The change in transportation system can affect the sup-
ply lines (Fig. 3). In the mining area, the products are phos-
phate rocks and slurry, both of which are transported to the
manufacturing area, each with its own resource requirements.
Slurry requires flotation and adaptation and thus is more wa-
https://doi.org/10.5194/hess-24-4727-2020 Hydrol. Earth Syst. Sci., 24, 4727–4741, 20204732 S.-H. Lee et al.: WEF-P Nexus Tool for Morocco’s phosphate industry
cesses, the amount of raw phosphate embedded in products
is not changed. Thus, the amount (in tonnes) of phosphate
in water and energy footprints indicates the raw phosphate
embedded in the products in each process and is constant
through the entire supply chain.
From the technical (engineering) perspective, footprints
are calculated using a regression function or average value
based on survey data; technical experts in each process can
modify this relation function as needed. The WEF-P Tool
uses historical data (from 2015) to estimate the average value
of the footprint and the relationship between water or energy
consumption and phosphate production. First, the relation-
Figure 3. The functional processes and flows of products in ship between outputs of each process and water (or energy)
Khouribga (mining area) by transportation method.
consumption was analyzed. Second, WEF-P Tool considered
transportation of water and consumption of energy by train
ter intensive; phosphate rock is dried in an energy-intensive and pipeline. Transportation by train was only related to fuel,
process that consumes most of the energy produced in the i.e., diesel, consumption. However, the pipeline station con-
mining area. Slurries are transported via pipeline and rock sumes electricity for operating the pipeline and freshwater is
by train; each mode has distinct resource needs at different transported with slurry. The pipeline should be full, but as it
stages. The two transportation systems are also distinct, i.e., is impossible to fill the pipeline with slurry, it alternately car-
the pipeline supply chain includes washing (water) and adap- ries slurry and freshwater. Therefore, total water (or energy)
tation to produce slurry; the train supply chain includes a consumption in the mining area includes not only water (or
fuel-intensive drying process. It is possible to quantify the energy) used in processes but also that used in transportation
flow of products according to the transportation system used. systems and the water consumed at the pipeline station in the
When transport changes from train to pipeline, supply lines mining area, which basically indicates the transported water
also change: the drying process is replaced by the adaptation used in the manufacturing area. WEF-P Tool could quantify
process. If the phosphate is transported by pipeline, it must water and energy consumption of the various processes and
first be transformed into slurry, adding the adaptation pro- at the pipeline station, as shown in Eqs. (1–5).
Xn
cess to the supply chain. Changes in the supply chain impact WCmining area = (Pi × WFPi ) + WCpipleline station , (1)
i
the water and energy consumed and, consequently, the CO2
emitted. The mining and screening processes include extrac- WCpipleline station = Pslurry × WCpipleline station , (2)
Xn
tion from the ground, tone removal, and screening to produce ECmining area = (Pi × EFPi )
i
pieces of phosphate rock.
+ ECpipleline station + ECtrain , (3)
2.2.3 Adaptation of process-based water, energy, and ECpipleline station = Pslurry × EFPpipleline station , (4)
CO2 footprints ECtrain = Pphosphate rock × EFPtrain , (5)
The main functions of the WEF-P Tool are the identifica- where WCmining area (m3 )
is total water consumption in min-
tion of the relationship between resources and production and ing area, ECmining area (MWh or L) is total energy con-
the quantification of the resources consumed in phosphate sumption in mining area, and Pi (tonne) is production from
production. The methodology is based on life-cycle assess- each process (i) in mining area such as mining, screen-
ment. The water and energy footprints were analyzed, indi- ing, washing, flotation, and drying. WFPi (m3 t−1 ) and EFPi
cating the quantity of water or energy consumed in various (MWh t−1 or L t−1 ) are water and energy footprints in each
subprocesses in the supply chain’s integration of production process (i). WCpipeline station (m3 ) is water consumption in
and transportation. The technical details of each process are pipeline station, ECpipeline station (MWh or L) is energy con-
specific and aggregated into functional processes. The main sumption in pipeline station, and ECtrain (MWh or L) is
component is the footprint, which indicates the water and energy consumption by train to transport phosphate rock
energy requirements for phosphate products, as well as the to the manufacturing area. Pslurry and Pphosphate rock (t) are
CO2 emitted through energy consumption. Each process has production of slurry and phosphate rock. WFPpipeline station
a specific footprint based on field data and fed into the tool (m3 t−1 ) is water footprint at pipeline station in mining area.
monthly or when a significant change in capacity of the func- EFPpipeline station and EFPtrain (MWh t−1 or L t−1 ) are energy
tional processes has occurred. For all footprint processes in footprints in pipeline station and of transportation by train. It
Khouribga, the amount of raw phosphate is measured in com- is worth mentioning that the tool distinguishes between two
mercial metric tonnes embedded in slurries and rock. Even types of water: water transported from mining to manufac-
if the phosphate rock changes to slurry through several pro- turing area by pipeline and the embedded water in slurry.
Hydrol. Earth Syst. Sci., 24, 4727–4741, 2020 https://doi.org/10.5194/hess-24-4727-2020S.-H. Lee et al.: WEF-P Nexus Tool for Morocco’s phosphate industry 4733
Table 2. CO2 emission by burning fuels and generating electricity.
CO2 emission by burning fuel CO2 emission by generating electricity
CO2 CO2 emission Proportion CO2
emissiona by sourcesa of sources emission
(kg (t CO2 in Moroccob (t CO2
Sources CO2 L−1 ) Sources 10−6 kWh) (%) 10−6 kWh)
Gasoline 2.59 Coal 1026 43.4 % 820.9
Diesel 2.96 Petroleum 1026 25.3 %
Natural gas 504 22.7 %
Hydroelectricity 19.7 6.9 %
Renewables 15.8 1.7 %
a U.S. Energy Information Administration (USEIA). b International Energy Agency (IEA).
Table 3. Climate information in Khouribga.
Month Precipitation Temperature Relative humidity Sunshine
(mm month−1 ) min (◦ C) max (◦ C) (%) hours per day (h)
Jan 56 3.8 17.3 72 5.6
Feb 65 5 19 76 5.7
Mar 94 7.2 21.8 69 6.4
Apr 70 9.5 25.3 67 7.4
May 32 12.5 29.3 55 8.8
Jun 9 16.6 34.5 48 9.8
Jul 2 19.8 39.7 39 10.9
Aug 7 20 39.6 37 10.3
Sep 12 17.5 34.5 47 9.1
Oct 27 13.5 29 58 7.6
Nov 71 8.8 22 70 5.2
Dec 81 5.1 18.6 71 5.5
CO2 emissions are relevant when assessing the environ- duction). Oil and natural gas account for 25.3 % and 22.7 %,
mental impact of phosphate production. Although real emis- respectively; fossil fuels account for 90 % of the electricity
sion in each process in the supply chain should be measured, produced in Morocco (IEA, 2014). Based on reference data,
this study is limited to measuring CO2 emission in the mining direct and indirect CO2 emissions are calculated as shown in
area. In addition, CO2 emission in crop area is related to soil Eqs. (6)–(7).
and crops, and this is another level of research. Thus, we lim-
ited CO2 emission to that emitted by fuel energy use by ma- n
X
chinery (direct emission) and electricity generation in power DCO2 = CFF_Fi × FCi , (6)
plants (indirect emission), and the reference CO2 footprints i
n
were applied (Table 2). Fossil fuels (gasoline, diesel, coal, X
etc.), when burned, produce direct CO2 emission. Indirect InDCO2 = CFP_Ej × ELCj , (7)
j
CO2 emission is also related to the source fuel used in gener-
ating electricity: indirect emission occurs in the generation of
electricity from other (non-fossil) sources, such as hydroelec- where DCO2 (t) is direct CO2 emission and InDCO2 (t) is
tric, wind power, or solar. According to USEIA (2019), 1 L indirect CO2 emission. CFF_Fi (t L−1 ) is CO2 footprint by
of gasoline used by machinery or a facility produces 2.6 kg burning fuel, FCi (t L−1 ) is fuel consumption by machine ex-
of direct CO2 emission; a power plant burning only coal cluding fuel use for electricity generation, and i is the type of
emits 1026 t of CO2 kWh−1 . Renewable (non-fossil) electric- fuel such as diesel or gasoline. CFP_Ej (t MWh−1 ) is CO2
ity emits only 15.8 t of CO2 kWh−1 . A survey of sources of footprint by generating electricity, ELCj (MWh) is electric-
electricity generation in Morocco indicates that coal is the ity consumption, and j is the source of electricity genera-
main fuel for power generation (43.4 % of the national pro- tion such as coal, petroleum, natural gas, solar, wind, or hy-
dropower.
https://doi.org/10.5194/hess-24-4727-2020 Hydrol. Earth Syst. Sci., 24, 4727–4741, 20204734 S.-H. Lee et al.: WEF-P Nexus Tool for Morocco’s phosphate industry
Table 4. Crop planting and harvesting seasons, stage length, and crop coefficients.
Crop Planting Harvesting Stage length (d) Crop coefficients
season season Initial Development Mid-season Late-season Total Kc initial Kc mid Kc end
Olives March November∗ 30 90 60 90 270 0.65 0.7 0.7
Wheat November June∗ 30 140 40 30 240 0.7 1.15 0.25
Barley March July 20 25 60 30 135 0.3 1.15 0.25
Potato January April 25 30 30 30 115 0.5 1.15 0.75
∗ Next year.
Table 5. Scenarios through combination of production and transportation system.
Scenario Phosphate production Transportation of phosphate products
By pipeline By train
BAU 40 % of total phosphate 60 % of total phosphate
Production in 2015
Scenario 1 100 % of total phosphate None
Scenario 2 40 % of total phosphate 60 % of total phosphate
50 % increase in phosphate export
Scenario 3 100 % of total phosphate None
2.3 Agricultural water requirement for food
production ET0 = {0.4081 (Rn − G) + γ (900/T + 273)
In this study, “water for food” indicates water withdrawn u2 (es − ea )}/{1 + γ (1 + 0.34u2 )}, (9)
for crop production (generally irrigation). CROPWAT 8.0 where ET0 is the reference crop evapotranspiration
is a decision support tool developed by the Land and Wa- (mm d−1 ); ETc is the crop evapotranspiration (mm d−1 ); Kc
ter Development Division of FAO (Smith, 1992) and used is the crop coefficient; 1 is the slope of the saturated va-
to calculate the evapotranspiration, crop water requirements, por pressure–temperature curve (kPa ◦ C−1 ); γ is the psy-
and irrigation requirements of four crops grown in the re- chrometric constant (kPa ◦ C−1 ); u2 the wind speed at 2 m
gion. The climate data (temperature, precipitation, humid- height (m s−1 ); Rn is the total net radiation at crop surface
ity, wind speed, as well as hours of sunshine) were taken (MJ m−2 d−1 ); G is the soil heat flux density (MJ m−2 d−1 );
from the climatic database CLIMWAT 2.0, which offers ob- T is the mean daily air temperature at 2 m height (◦ C); es is
served agro-climatic data from 5000 stations worldwide and the saturation vapor pressure (kPa); and ea is the actual va-
provides long-term monthly-mean values of climatic param- por pressure (kPa). Crop coefficients are influenced by cul-
eters. The compiled data of CLIMWAT 2.0 generally include tivation, local climatic conditions, and seasonal differences
the period 1971–2000 (when these data were not available, in crop growth patterns (Kuo et al., 2006). FAO provides
series ending after 1975 that include at least 15 years of data crop coefficients for each stage. The values for Mediter-
were used). Table 3 shows the average climate data in the ranean countries were applied, as shown in Table 4 (Allen
Khouribga area provided from CLIMWAT 2.0. et al., 1998). Irrigation water requirement was calculated by
CROPWAT 8.0 was used to calculate crop water and ir- ETc and effective precipitation, as shown in Eq. (10). The
rigation requirements based on soil, climate, and crop data. effective precipitation indicated the precipitation except for
The calculation procedures used in CROPWAT 8.0 are based runoff, and it was calculated using the USDA Soil Conserva-
on the FAO publication: irrigation and drainage series nos. 44 tion Service method (Eq. 11) (Smith, 1992).
and 56 “Crop Evapotranspiration (guidelines for computing
crop water requirements)” (Allen et al., 1998; Smith, 1992). IRReq = ETc − Peff , (10)
Irrigation water requirements were calculated by estimat-
ing crop evapotranspiration (ETc ), determined by multiply-
ing the crop coefficient (Kc ) by the reference crop evapotran- Peff = Ptot (125 − 0.2Ptot )/125 for Ptot < 250 mm,
spiration (ET0 ); see Eq. (8). ET0 is calculated using the FAO Peff = 125 + 0.1 Ptot for Ptot > 250 mm, (11)
Penman–Monteith method, as recommended by FAO and de-
scribed in Eq. (9) (Allen et al., 1998). where IRReq is irrigation water requirement, ETc is the crop
evapotranspiration, Peff is effective precipitation, and Ptot is
ETc = ET0 × Kc , (8) total precipitation.
Hydrol. Earth Syst. Sci., 24, 4727–4741, 2020 https://doi.org/10.5194/hess-24-4727-2020S.-H. Lee et al.: WEF-P Nexus Tool for Morocco’s phosphate industry 4735
Figure 4. Water and energy footprints in MEA based on the BAU database.
Table 6. Water and energy use as well as CO2 emission by scenario of phosphate production and transport.
CO2 emission
Scenario Water (106 m3 yr−1 ) Energy (106 t yr−1 )
Water used Transported Electricity Fuels
(Transportation) in processes water (MWh yr−1 ) (106 L yr−1 ) Direct Indirect
BAU 15.84 3.85 424 512 204.0 0.53 0.35
Scenario 1 32.14 2.47 556 344 27.6 0.07 0.46
Scenario 2 19.35 3.45 551 495 297.9 0.77 0.45
Scenario 3 45.15 1.45 743 928 40.5 0.11 0.61
3 Results and discussion 3.2 Quantification of water and energy consumption as
well as CO2 emission by production and transport
3.1 Application of scenarios of phosphate
Increasing the exportable phosphate products and changing
the transportation system from train to pipeline are consid- To quantify the water, energy, and CO2 emission, water and
ered top priorities for OCP Group. Therefore, we assessed energy footprints of each process in each mining site were
the impact of increased production by applying the scenarios analyzed based on survey data. For example, the adapta-
(Table 5). Until recently, dried phosphate was transported by tion process is essential for pipeline transportation and large
train from the mining to the manufacturing site, but in the amounts of water are needed in comparison to other pro-
near future, OCP Group will use only pipeline transport. The cesses; thus, the relationship between the amounts of phos-
change from train to pipeline can affect not only direct energy phate and water used in adaptation process were analyzed
or water consumption by transportation system but also that (Fig. 4a). In addition, the energy footprint includes electric-
of the total supply chain in the mining site. Consequently, the ity and fuel consumption, which are analyzed through the
production processes for slurry and for rock consume differ- linear relationship (Fig. 4b).
ent quantities of water and energy, so the mode of transport Production and transport scenarios were applied and quan-
also becomes a scenario to allow for quantification of their tified for water, energy, and CO2 emission in each scenario
respective water and energy requirements. (Table 6). In the mining area, 20.1 × 10⁶ t of raw phos-
Therefore, we applied the scenario for the transportation phate were produced in 2015 with the “business as usual”
system which only indicates the usage of pipeline. Table 4 (BAU) scenario. And 40 % of production was in the form
shows the scenarios combining production and transporta- of slurry and transported by pipeline; 60 % was in the form
tion. The first two scenarios are related to the “business as of rock and transported by train. Scenario BAU indicates that
usual” (BAU) scenario for production in 2015 but changing 15.84×10⁶ m3 of water was used in all processing (both rock
the transportation system from Khouribga to the terminal sta- and slurry). Additional fresh water was transported through
tion at Jorf Lasfar. The other scenarios are related to the in- the pipeline to maintain slurry consistency in the system. For
crease in the production. the BAU scenario, 3.85 × 10⁶ m3 of fresh water were trans-
ported by pipeline to the industrial area. Scenario 1 (all raw
phosphate transported by pipeline) increases the total water
used to 32.14×10⁶ m3 (103 % increase over BAU). Fresh wa-
ter is also used to maintain good operation of the pipeline, but
https://doi.org/10.5194/hess-24-4727-2020 Hydrol. Earth Syst. Sci., 24, 4727–4741, 20204736 S.-H. Lee et al.: WEF-P Nexus Tool for Morocco’s phosphate industry
Table 7. Water use for crop production under Moroccan condition.
Crops Production∗ Productivity Area Irrigation water requirement
t t ha−1 ha mm yr−1 106 m3 yr−1
Olive 834 1.28 652 622.4 4.06
Wheat 4054 1.40 2895 313.7 9.08
Barely 1840 0.87 2115 562.7 11.90
Potato 1417 23.43 60 48.9 0.03
Total 8146 5722 1547.7 25.07
∗ Crop production is 0.1 % of the amount of national production in Morocco.
Table 8. Water allocation and treated water use scenarios.
Scenario Sources Capacity Assignment of capacity
106 m3 yr−1 Phosphate Agriculture
Alloc. 1 Dam 45.0 80 % 20 %
Treated water 5.0 100 % 0%
Alloc. 2 Dam 45.0 50 % 50 %
Treated water 5.0 50 % 50 %
Treated water supply 2.5 First priority Second priority
with the increase in slurry transported by pipeline, the quan- ergy use and reduce CO2 emission, but more water is re-
tity of “maintenance” fresh water decreased from 3.85 × 10⁶ quired due to additional processes, such as adaptation and
to 2.47 × 10⁶ m3 , leading to a smaller total consumption of water used to operate the pipeline. However, since the wa-
fresh water, i.e., a 76 % increase was shown for total water ter used to operate the pipeline is actually transported to Jorf
consumption (for both processing and transport by pipeline). Lasfar and reused in fertilizer factories, it could be consid-
Using only the pipeline for transport requires an additional ered nonconsumptive water in terms of the supply chain in-
131 832 MWh of electricity for the flotation and adaptation tegrating Khouribga and Jorf Lasfar, even though it is still
processes used to produce slurry (31 % increase in compar- real water withdrawn from Khouribga.
ison to BAU). However, the consumption of fuel signifi-
cantly decreases as there is no need to dry phosphate rock. 3.3 Assessment of the impacts of water allocation and
This results in a nearly 86 % decrease in fuel consumption treated water use in the industrial and agricultural
over the BAU scenario and a fuels savings of 176.4 × 10⁶ L, areas
which translates into a 40 % decrease in CO2 emission in
scenario 1. In scenario 2, there was a 50 % increase in raw The main challenge of the mining area is sustainable wa-
phosphate export over the BAU scenario, with transport the ter allocation for both the phosphate industry and irrigated
same as in BAU. Total water consumed, including fresh agricultural areas. Thus, production targets were established
water transported through the pipeline, increased by 16 % for both phosphates and crops, and scenarios evaluated us-
over BAU, energy consumption increased by 46 %, and CO2 ing the WEF-P Tool. Target crop production rates for Mo-
emission increased by 39 %. Scenarios 3 and 4 represent a rocco’s primary food crops (wheat, olive, barley, and potato)
50 % increase in phosphate exports; thus, target production were set as 0.1 % of national production. Table 7 shows that
was set at 2.45 × 10⁶ t month−1 for raw phosphate (in total 25.07 × 10⁶ m3 yr−1 of irrigation water is required to pro-
29.3 × 10⁶ t yr−1 ). Scenario 3 indicates a total water con- duce 5722 ha of crops. In the case of wheat, irrigation re-
sumption increase to 46.6 × 10⁶ m3 (137 % over BAU) and quirements were calculated at 313.7 mm yr−1 , equivalent to
electricity consumption increase of 75 %. However, transport 9.08 × 10⁶ m3 to produce 0.1 % of national production annu-
by pipeline also led to an 80 % decrease in fuel consumption ally.
(compared to BAU) and consequent 18 % decrease in CO2 The main water resource for the mining area is the Aït
emissions. Messaoud Dam. Water allocations from this source affect
In summary, the comparison between BAU and scenario 1 both phosphate and agricultural areas. Water used for phos-
shows the trade-off between water and energy by the change phate production increases when the pipeline is used to trans-
in transportation method. Pipeline transportation can save en- port slurry (versus dry rocks transported by train). The im-
Hydrol. Earth Syst. Sci., 24, 4727–4741, 2020 https://doi.org/10.5194/hess-24-4727-2020S.-H. Lee et al.: WEF-P Nexus Tool for Morocco’s phosphate industry 4737
Table 9. Additional water and energy for solving water shortage by scenarios of phosphate production.
Production Water Water shortage Additional water supply Energy use for water supply
(only pipeline) allocation Phosphate Agriculture Treated water Groundwater Treated water Groundwater
106 m3 yr−1 106 m3 yr−1 106 m3 yr−1 106 m3 yr−1 MWh yr−1 MWh yr−1
Production Alloc. 1 0.00 9.68 2.50 7.18 1653 1421
as BAU Alloc. 2 9.61 0.07
50 % increase Alloc. 1 5.59 16.07 2.50 19.16 1653 3794
over BAU Alloc. 2 21.59 0.07
Figure 5. Monthly irrigation water requirement and rainfall in Khouribga.
pact of water allocation under only the pipeline is calculated When water resources were allocated according to the Al-
using various scenarios for water allocation (Table 8), and the loc. 1 scenario (80 % of surface water and 100 % of treated
treated wastewater from urban area was considered a water water allocated to the phosphate mining area), 9.68 × 10⁶ m3
resource for both the phosphate industry and agriculture. additional water was required for agriculture (Table 9). When
In the “Alloc. 1” scenario, supply capacity from the dam water is allocated equally between the two industries (Al-
was set at 80 % for the phosphate industry and 20 % for the loc. 2 scenario), there is a shortfall of 9.61 × 10⁶ m3 in the
agricultural area. The wastewater treatment plant operates in phosphate industry but of only 70 000 m3 for agricultural irri-
the mining area. For scenario Alloc. 1, all treated water was gation. In the case of a 50 % increase in phosphate production
assigned to the phosphate industry. The “Alloc. 2” scenario over BAU and using the pipeline as the only mode of trans-
focuses on the importance of water for agriculture and as- port, the Alloc. 1 scenario indicates intensive water supply to
signs the water equally between the phosphate and agricul- the phosphate mining area rather than to agricultural area and
tural areas. Water supplied from the dam plus treated water causes an annual shortage of 5.59 × 10⁶ and 16.07 × 10⁶ m3
from the plant may be insufficient for both industries. To ad- water in the phosphate mining and the agricultural area, re-
dress this issue, treated water and groundwater were consid- spectively. To address this shortage, 2.5 × 10⁶ m3 of treated
ered supplementary water sources and a treated water quan- water could be supplied in addition to 19.16 × 10⁶ m3 of
tity of 2.5 × 10⁶ m3 yr−1 (50 % of current operation) was as- groundwater.
signed to the two industries. Additionally, electricity is required to pump groundwater
and treat wastewater. Thus, the source of water may also
https://doi.org/10.5194/hess-24-4727-2020 Hydrol. Earth Syst. Sci., 24, 4727–4741, 20204738 S.-H. Lee et al.: WEF-P Nexus Tool for Morocco’s phosphate industry
affect electricity consumption. Goldstein and Smith (2002) 2006). Thus, dynamic phosphate production carries positive
noted that 0.198 kWh is required to supply 1 m3 of ground- impacts on sustainable water management and water conser-
water, and the least electricity required to supply surface wa- vation.
ter is 0.079 kWh m−3 . Therefore, a 50 % increase over BAU Dynamic phosphate production also contributes to elec-
is accompanied by 3794 MWh yr−1 electrical consumption tricity savings because supplying water from the dam,
for pumping groundwater (Table 9). Increasing the use of ground, or wastewater treatment require electricity for pump-
treated water releases the demand for groundwater use, but ing, transporting, and treating (Fig. 8). Total electricity con-
the costs of building and operating the infrastructure and sumed in supplying water to the phosphate and agriculture
treatment facility must be considered. In this study, the ca- industries was 9971 MWh yr−1 under the static production
pacity of treated water was set at 2.5 × 10⁶ m3 yr−1 , and scenario (phosphate slurries, no rocks). This number de-
groundwater requirements were changeable only as scenar- creased to 9828 MWh yr−1 when phosphate slurries were
ios of water allocation. produced dynamically. About 143 MWh of electricity can be
saved annually, which is accompanied by a reduction of 117 t
3.4 Assessment of the impact of dynamic management of CO2 emission.
of phosphate production on groundwater and
energy savings
4 Conclusions
Water resource availability and water requirements for crop
As Morocco continues to work toward meeting its pro-
production are seasonal. Rainfall in June and July is less
jected phosphate production goals, it is important to assess
than 10 mm month−1 and irrigation water requirements ex-
and quantify the potential resource competition between the
ceed 80 mm month−1 (Fig. 5). Thus, there is water scarcity
growing municipal and agricultural sectors. Sustainable re-
in the agricultural area during June and July. Given that
source management strives for symbiosis between the phos-
water resources are shared between the phosphate industry
phate industry and other sectors and endeavors to create syn-
and the agriculture industry, static production of phosphate
ergy through multiple strategies. The WEF-P Tool integrates
could accelerate water shortage for agriculture. Dynamic
water–energy–food management and supply-chain manage-
production of phosphate is a scenario with greater agricul-
ment for phosphate production, considering the trade-offs be-
tural production during non-irrigation seasons and less pro-
tween water, energy, and food, as well as a systematic analy-
duction during irrigation seasons. Using the dynamic phos-
sis based on the total supply-chain management of phosphate
phate production scenario, the monthly production of phos-
production. In other words, the WEF-P Tool offers a deci-
phate decreases from 1.68 × 10⁶ to 0.91 × 10⁶ t month−1 be-
sion support system to provide quantifiable trade-off analy-
tween May and October, representing a 50 % decrease in
ses for management decisions such as increasing production,
raw phosphate export compared to the BAU scenario. Be-
transportation systems, and water allocation. The developed
tween November and April, phosphate production increases
WEF-P Tool enables users to do the following:
to 2.45 × 10⁶ t month−1 , representing a 50 % increase in raw
phosphate export compared to the BAU scenario. – understand and identify the associated footprints of the
Water availability and irrigation water requirements differ primary functional production processes and existing
seasonally; dynamic monthly production of phosphate can flows in production lines,
contribute to sustainable water management. The effect of
dynamic phosphate production on water supply becomes ob- – identify the main sources of data to be gathered and fed
vious when the pipeline is the only mode of transport: slurries into the model on a specific temporal basis,
are more water intensive than rock. Under static phosphate
production, the monthly demand for water from the dam – identify the techniques employed to conserve or pro-
in January and February was about 2.5 × 10⁶ m3 month−1 duce water and energy and minimize the impacts of
and increasing to 7.0 × 10⁶ m3 month−1 in June (Fig. 6). phosphate production,
Nevertheless, dynamic phosphate production decreases the – form a translational platform between sectors and stake-
water demanded during the water-scarce season. Moreover, holders to evaluate proposed scenarios and their associ-
the lack of water supply is covered by groundwater; dy- ated resource requirements.
namic production uses less groundwater than static produc-
tion (Fig. 7). During the water-scarce season (May to July), As phosphate mining increases, options that contribute to re-
total groundwater used is 5.77 × 10⁶ m3 in static phosphate ducing water and energy stress include increased reliance on
production. This decreases by 10 % in dynamic production, transport by pipeline and dynamic management of phosphate
potentially saving 0.58 × 10⁶ m3 of groundwater during the production. This tool assesses the impacts of various produc-
water-scarce season. Groundwater resources constitute an tion pathways, including specific process decisions through-
important aspect of the national hydraulic heritage and rep- out the phosphate supply chain, such as the choices for trans-
resent the only water resource in this hyperarid climate (Tale, port by pipeline or train and the impacts on regional water
Hydrol. Earth Syst. Sci., 24, 4727–4741, 2020 https://doi.org/10.5194/hess-24-4727-2020S.-H. Lee et al.: WEF-P Nexus Tool for Morocco’s phosphate industry 4739
Figure 6. Monthly water supply from Aït Messaoud Dam. Figure 7. Monthly groundwater use by static and dynamic produc-
tion of phosphate slurries transported by pipeline.
and energy use. For example, transport by pipeline instead
of train can contribute to energy savings due to the elimina-
tion of the phosphate drying process (a main consumer of
fuels). At the same time, the slurry adaptation processes are
the main consumers of water; although, because the pipeline
also transfers fresh water to Jorf Lasfar where the fertilizers
are produced, the water embedded in slurry is a main wa-
ter resource for Jorf Lasfar. Previously, the main water re-
source in Jorf Lasfar was desalinated water, which consumes
energy in desalination. Transport by pipeline contributes to
a savings of desalinated water and energy for desalinating.
The dynamic management scenario is assessed for its im- Figure 8. Monthly electricity consumption for supplying water by
pacts on regional water and energy savings: dynamic man- static and dynamic production of phosphate slurries transported by
agement of phosphate production indicates different produc- pipeline.
tion quantities during irrigated and non-irrigation seasons.
Less phosphate production during irrigation season can con-
tribute more surface water for agricultural use and is accom- energy) across the supply chain, identifies the interlinkages
panied by a savings of groundwater and the energy required between water and energy in phosphate production and trans-
to pump groundwater. port, and establishes reference values for comparison of out-
Further consideration of the economics of the phosphate comes and performance. The WEF-P Tool enables the user
operation is needed: static production may bring stability to to evaluate trade-offs between water resource allocations and
operations (meeting local and export demand), but there are the impact of the Moroccan phosphate industry with agricul-
benefits from dynamic production that can be attributed to re- tural water use.
duced competition with other water-consuming sectors. Ad-
ditional variables, such as facility operation, labor, economic
cost-benefit analysis of static and dynamic production, etc., Data availability. The resulting data for this study are freely avail-
should be quantified and included for additional trade-off as- able by contacting the corresponding author.
sessments. Quantification of water and energy for phosphate
production is strongly dependent on the relationship between
production and resource consumption: this can change in fu- Author contributions. S-HL, ATA, and RHM conceived and de-
signed the research; S-HL and ATA analyzed the data; S-HL, BTD,
ture scenarios. Proper water availability for the right place
and FEM contributed analysis tools; and S-HL and ATA wrote the
and time in a changing climate requires analysis of complex paper.
scientific, technical, socioeconomic, regulatory, and political
issues.
Beyond the limitations, the deliverables from this study Competing interests. The authors declare that they have no conflict
include a conceptual and analytical model of the phosphate of interest.
supply chain in Morocco: the WEF-P Tool. The tool can as-
sess the various scenarios to offer an effective means of en-
suring the sustainable management of limited resources to Acknowledgements. The authors thank the OCP Policy Center for
both agricultural area and the phosphate industry. It quanti- arranging meetings with their engineers and managers in the mining
fies the products (phosphate) and resource footprints (water, and production areas for data collection. The authors also express
https://doi.org/10.5194/hess-24-4727-2020 Hydrol. Earth Syst. Sci., 24, 4727–4741, 2020You can also read