Gulf Coast Energy Outlook 2020 - This report prepared by the Center for Energy Studies and the E. J. Ourso College of Business - Louisiana State ...
←
→
Page content transcription
If your browser does not render page correctly, please read the page content below

2020

  Gulf Coast
Energy Outlook

   This report prepared by the
   Center for Energy Studies and the
   E. J. Ourso College of Business

   David E. Dismukes | Dek Terrell | Gregory B. Upton, Jr.*
                                                              *Corresponding author
2020 Gulf Coast Energy Outlook
                       David E. Dismukes – LSU Center for Energy Studies
                       Dek Terrell – LSU E. J. Ourso College of Business
                       Gregory B. Upton, Jr. – LSU Center for Energy Studies
                       Release Date: Fall 2019

Acknowledgment
The GCEO would not have been possible without the help of many who contributed both
time and financial resources. First, the input from dozens of industrial, governmental,
civic, and trade organizations that requested having the 2019 GCEO presented to
their organizations is much appreciated. The feedback that was provided during these
conferences and individual meetings was instrumental in preparing the current 2020
GCEO. While “crunching the numbers” is an important aspect of any forecasting process,
the input provided by stakeholders who have an “on-the-ground” view of what is occurring
in real time is equally valuable.
Special thanks are owed to Marybeth Pinsonneault and Ric Pincomb (Center for Energy
Studies) and Stephen Radcliffe (E.J. Ourso College of Business), for their media, editorial, and
production expertise. Numerous students and research associates working in the Center
for Energy Studies also contributed to data collection and analysis included in this report.
Last, but certainly not least, a special thanks and appreciation is extended to our sponsors:
 >>Platinum: Louisiana Mid-Continent Oil & Gas Association (LMOGA)

 >>Gold: Phillips 66

 >>Silver: Enverus

 >>Bronze: Entergy and The TJC Group

 >>Contributor: Louisiana Economic Development and Cameron Parish Port, Harbor & Terminal District

                                                                             Louisiana State University   1
1 | Introduction

The GCEO is now in its third year and as in years past, is designed to provide stakeholders
with a “one-stop” overview of the current trends and outlook for the region’s energy industry
and its various sectors. The GCEO is a collaborative effort of Louisiana State University’s
Center for Energy Studies and E.J. Ourso College of Business and has been sponsored
by several corporations and institutions looking to assist LSU in disseminating timely and
important information and analysis impacting the region’s economy and citizenry.
The 2020 GCEO includes Gulf Coast-specific analyses that span across a wide range of
regional energy sectors, starting with upstream crude oil and natural gas production and
moving through to the downstream refining and petrochemicals (or energy manufacturing)
sectors. The 2020 GCEO includes a new section highlighting crude oil and natural gas
transportation trends and outlooks. This edition also continues last year’s analysis focused
on the growing importance of energy exports for the Gulf Coast region. The regional trends
in energy manufacturing, particularly the continued capital investment in the region, or the
“industrial renaissance” that has been facilitated by unconventional crude oil and natural
gas development, is also figured prominently this year. The 2020 GCEO concludes with an
analysis of the region’s energy sector employment trends and a forecast for each sector’s
employment over the next several years.
Unless stated otherwise, the “Gulf Coast” region specifically refers to the states of Texas,
Louisiana, Mississippi, and Alabama. In some instances, U.S. Department of Energy reporting
conventions will require references to data collected at the Petroleum Administration for
Defense District 3 (PADD 3) level, which includes Arkansas and New Mexico, in addition to
the Gulf Coast states.

2    Gulf Coast Energy Outlook 2020

2 | Crude Oil and Natural Gas Production and Prices

2.1. Recent Market Trends: Production
The upcoming year (2020) marks the beginning of a new decade as well as the 15th year of
the shale revolution. This revolution started to manifest itself in U.S. natural gas supplies in
2005 and has dramatically changed the fortunes of U.S. energy across almost every sector.
That revolution continues today in both crude oil and natural gas supplies, both of which
continue to march upwards, breaking production records from decades long since passed.
Figure 1 shows that this past year (2019) marks the highest level of U.S. natural gas and
crude oil production on record at around 111 billion cubic feet per day (“Bcf/d”) and 12 million
barrels per day (“MMBbl/d”), respectively. As will be shown later, a large share of this U.S.
crude oil and natural gas production increase comes from the Gulf Coast region.
Recent trends in U.S. drilling, however, have begun to slow, given their tendency to closely
follow prices, which have been down since early 2015. The cyclical nature of drilling and
prices is being felt throughout the oil patch as major areas along the Gulf Coast cut back
on activity.

            Figure 1: U.S. crude oil and natural gas production

            Source: U.S. Energy Information Administration.

Figure 2 underscores that the few drilling rig gains made in early 2019 have long since
expended themselves during the mid-year price correction. By year end 2019, drilling

                                                                           Louisiana State University   3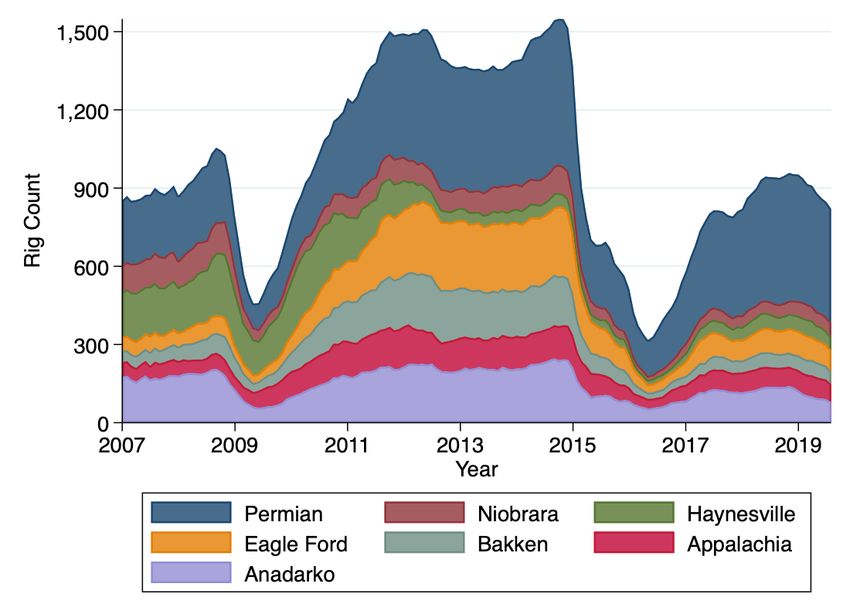
rigs were down by as much as 14 from the recent December 2018 peak. Unfortunately,
the industry continues to be a victim of its own success. Higher drilling productivity has
translated into higher crude oil and natural gas supplies, which in turn has damped prices,
which itself curtails drilling activity. Today, the industry is no closer to reaching its prior 1,500
active rig peak than it was in the prior year.

                        Figure 2: U.S. crude oil prices and rig count

                        Source: U.S. Energy Information Administration.

Regionally, the Permian Basin continues to be the primary focus of drilling and production.
Figure 3 illustrates the rig activity in the seven major U.S. shale plays. Since 2016, the Permian
has been the predominant shale play in the U.S., accounting for more than half of drilling
activity in shale plays during the first half of 2019.1 Last years’ regional constraints do not
appear to have significantly dampened this interest. The 2019 GCEO anticipated that while
regional export capabilities were tight, the development of new transportation alternatives
would likely arrive just in time to prevent any significant basin migration. This appears to
have been the correct call.
Last year, the U.S. became the unequivocal leader in world crude oil production. The
movement to the top of the leader board is entirely attributable to U.S. unconventional
shale production. Figure 4 shows that the U.S. share of total production continues to march
forward and has leaped in the last four years alone from 12 percent of total world crude oil
supplies to a current level in excess of 17 percent. Greater U.S. supplies, coupled with large
production increases in Russia over the past several years, have significantly diversified
1 Based on EIA drilling productivity reports.

4         Gulf Coast Energy Outlook 2020
Figure 3: Rig counts in major shale basins

           Source: U.S. Energy Information Administration.

non-OPEC world energy markets and helped to keep a lid on pricing volatility and minimize
the impacts of sudden geopolitical events.

           Figure 4: Global and U.S. crude oil production

           Source: U.S. Energy Information Administration.

                                                                      Louisiana State University   5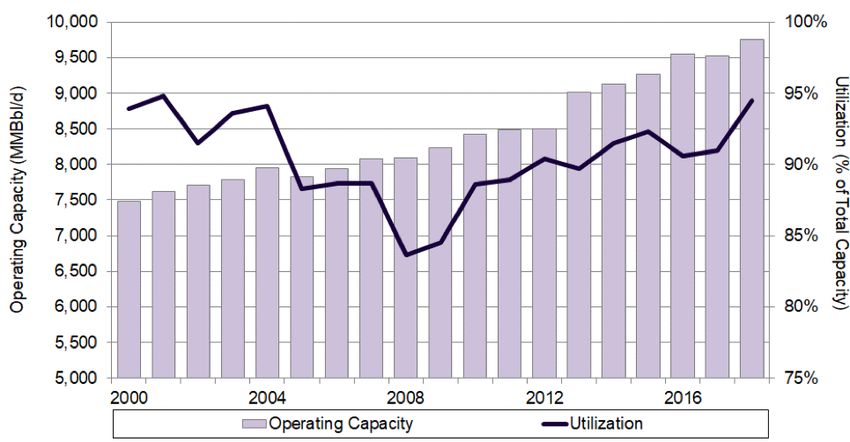
2.2 Recent Regional Trends: Crude Oil and Natural Gas Production
Regional (PADD 3) crude oil production activity mirrors, and in fact, dominates the overall
U.S. production trends discussed earlier. Regional crude oil and natural gas production
continues to progress to higher levels notwithstanding recent price contractions (Figure 5).
Overall, regional 2019 crude oil production was up by 19 percent (1.2 MMBbl/d) relative to
2018. To illustrate this resiliency, consider that in the first half of 2019, PADD 3 oil production
was 14 percent higher than the first six months of 2014. But the price over the first half of
2019 was more than $40 per barrel lower than in the pre-crash time period. Amazingly, the
Gulf Coast region (PADD 3) has been able to maintain this high degree of well productivity
even in the face of low prices.

               Figure 5: PADD 3 crude oil production and crude oil price

               Source: U.S. Energy Information Administration.

Figure 6 breaks out PADD 3 crude oil production by major play within the region. The
Permian Basin dominates regional crude oil production at 4.2 MMBbl/d followed closely
by the offshore outer continental shelf (OCS) at 1.9 MMBbl/d. Eagle Ford follows closely
behind these two predominate regional plays at 1.3 MMBbl/d. While unconventional crude
oil production gains tend to dominate the national media and financial press, the OCS
continues to be a major workhorse for regional crude oil production.
Regional natural gas production continues to rise to record levels, with 2019 production
on course to be the highest producing year in recorded history at close to 45 Bcf/d, or 40

6    Gulf Coast Energy Outlook 2020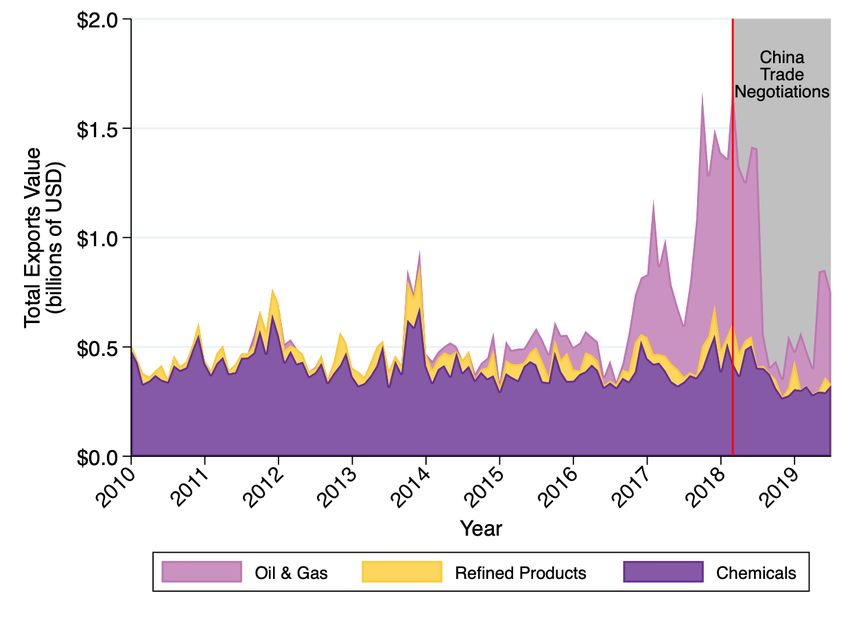
Figure 6: Regional crude oil production by major area/play

            Source: U.S. Energy Information Administration.

percent of total U.S. natural gas production (see Figure 7). This regional surge in natural gas
production reflects a short term rebound from an earlier production contraction that ran
from mid-year 2011 to about early 2017. Regional monthly natural gas production has been
growing at a rapid clip of about 10 percent per year since 2017.

            Figure 7: PADD 3 natural gas production and natural gas price

            Source: U.S. Energy Information Administration.

                                                                            Louisiana State University   7
Figure 8 shows the decomposition of regional natural gas production, which is dominated
by the Permian as well as “other” collective regional sources like Haynesville. The Permian is
now producing as much as 14.5 Bcf/d, while Haynesville is up to about 11 Bcf/d. Recent Eagle
Ford natural gas production, while significant, has been flat over the last two years at around
6.5 Bcf/d. This leaves about 5 Bcf/d being produced in the remainder of the region.

               Figure 8: Regional natural gas production by major area/play

               Note: Alabama and Mississippi are included in Remainder of PADD 3 however production
               estimates are only available through 2017. Values for 2018 and 2019 are estimated using
               average monthly trends from 2017.
               Source: U.S. Energy Information Administration.

Recent regional natural gas supplies have been driven, in large part, by considerable
associated (co-produced) production. Figure 9 presents the overall national trends in
associated gas production, which are driven by the seven major shale plays. From 2007 to
2011, major U.S. shale plays were extracting as much as 15 Bcf/d of natural gas for every one
MMBbl/d of crude oil production. That trend started to fall in 2011 and was down to just 8.5
Bcf/d per MMBbl/d in early 2015. The associated gas production rate has been rebounding
since and has stabilized at a relatively constant rate of 9 to 10 Bcf/d for every MMBbl/d of
crude oil production.
Lastly, recent trends in the Haynesville Shale have had a positive, albeit modest impact on
regional natural gas supplies. Over the past three years, the Haynesville Shale has seen
a relatively quiet revival, at least in natural gas production. Figure 10 shows that current
natural gas production trends have increased the play’s overall production from a low of 5.8
(December 2016) to a current level of 11.5 Bcf/d.

8    Gulf Coast Energy Outlook 2020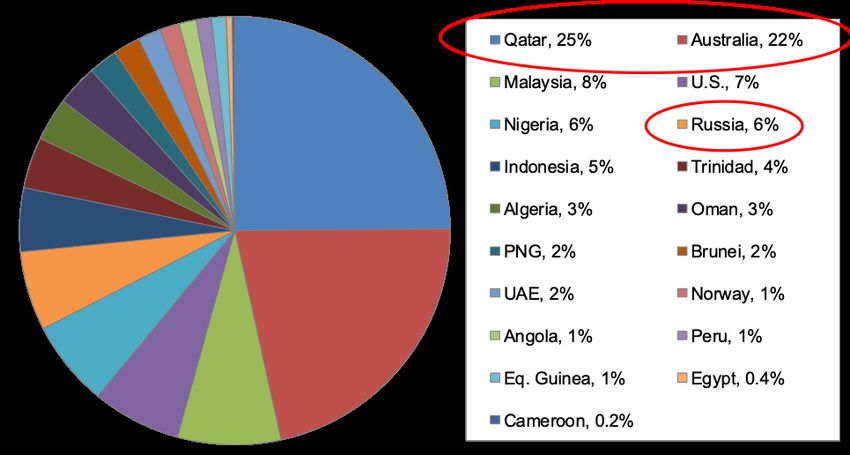
Figure 9: Associated natural gas production (seven major shale plays only)

Source: U.S. Energy Information Administration.

Figure 10: Haynesville natural gas production

Source: U.S. Energy Information Administration.

                                                                  Louisiana State University   9
2.3 Recent Trends: Commodity Pricing
One of the less appreciated aspects of shale production has been its impacts on pricing.
Figure 11 highlights three different natural gas pricing epochs: (1) the period spanning the
1990s; (2) the period starting with the natural gas supply/pricing crisis of the 2000s; and
(3) post-recession period to current. As the chart clearly shows, the current epoch’s prices
are not only competitive relative to historic trends, but the volatility, as measured by the
standard deviation in those prices (or the standard movement about the average) has been
exceptionally low and will continue to be low.
Figure 12 provides a comparable analysis for crude oil pricing, underscoring again the
dramatically reduced volatility that current period prices are experiencing relative to past
pricing epochs. On a year-to-date basis, 2019 crude oil prices have averaged $57/Bbl. As
with natural gas prices, the 2019 GCEO used futures prices to inform the crude oil pricing
forecast. To date, those crude oil pricing expectations (embedded in the prior futures prices)
have been mostly correct; however, actual events, particularly geopolitical and political
events that have arisen over the summer and fall of 2019, have created uncertainty that will
likely extend into 2020 and perhaps even into 2021.
Figure 11: Historic inflation-adjusted natural gas prices
Source: U.S. Energy Information Administration and Louisiana DNR.
10 Gulf Coast Energy Outlook 2020Figure 12: Historic inflation-adjusted crude oil prices
Source: U.S. Energy Information Administration.
2.4 Recent Trends: Uncertainties Created by Geopolitical and Policy Tensions
The past year has seen two important uncertainties hang over energy markets: (a) the trade
tensions between the U.S. and China, which have been pervasive over the better part of the
current administration’s tenure; and (b) more recent geopolitical tensions that have arisen
in the Middle East that include the ongoing U.S.-Iranian disagreements regarding Iran’s
nuclear and regional hegemony goals.
Last year’s GCEO clearly articulated the significant economic and energy market changes
occurring along the Gulf Coast. Increasingly, the region is transforming itself into an exporter
of energy products and supplies, as well as one that will likely serve as a transfer point or
hub for global energy transactions. The U.S., for instance, is exporting about five million
barrels per day of petroleum products, most of which are leaving a Gulf Coast port. The
escalating trade disputes with China, the world’s most populous country and second largest
economy, have resulted in increased tariffs on natural gas and petroleum products, which
could have significant implications for the Gulf Coast region’s ability to sell basic energy
commodities, refined products, and commodity chemicals overseas.
On June 1, 2019, China increased its tariff on natural gas coming from the United States
in the form of liquified natural gas (LNG) from 10 percent to 25 percent, in response to
recently implemented U.S. tariffs on other Chinese goods and products. This is already
Louisiana State University 11having impacts on LNG export facility development along the Gulf Coast and changing the
economics and opportunities for overall development. To date, at least one announced
LNG project has been postponed, with others seriously considering their development
potentials and postponing their final investment decisions.
The ongoing trade disputes with China could have a negative effect on Louisiana’s economy
in two ways. First, a negative demand shock associated with reduced U.S.-based energy
exports could negatively impact regional refiners and petrochemical companies that have
made billions in local investments to serve these international markets. Lower exports,
resulting from unnecessary trade restrictions, make the region’s recent energy manufacturing
investments less profitable relative to management’s original expectations and reduce these
firms’ incentive to make additional capacity investments until this uncertainty plays itself out.
Further, the negative demand shock arising from continued U.S.-Chinese trade tensions
could reduce U.S. crude oil prices relative to international prices, thereby negatively
impacting domestic upstream oil and gas producers due to reduced drilling activity, and
ultimately U.S. production.
Figure 13 explores these impacts in greater detail by examining U.S. exports of oil and
natural gas, refined products, and chemicals to China (collectively, “energy products”).
The first round of U.S. tariffs was announced in March 2018 at a time when the Gulf Coast
was exporting more than $1.5 billion monthly in energy products to China. Within several
Figure 13: Gulf Coast exports to China
Source: U.S. Census Bureau, Economic Indicators Division, USA Trade Online.
12 Gulf Coast Energy Outlook 2020months, exports dropped to less than a third.2 In more recent months, exports to China have
rebounded but clearly not to pre-tariff levels.
Figure 13 underscores Gulf Coast trade tension vulnerabilities. This vulnerability was
recently verified by a Federal Reserve Bank of Dallas analysis that estimates Louisiana
could lose an astounding seven percent of gross state product (GSP) if a trade war were to
escalate, ranking Louisiana as the third most vulnerable state to a U.S.-Chinese trade war.3
Figure 14 examines the trends in Gulf Coast energy product exports to the rest of the world
in order to assess whether some of these displaced energy products are finding a home
elsewhere during this trying period. Fortunately, Gulf Coast energy exports have been
relatively strong since the tariff announcements, and there is even a slightly upward bump in
the balance of energy trade after these announcements were made; however, more recent
trends clearly show a downward movement, albeit not as significant as the downward trend
shown earlier for China-bound energy exports.
It is very likely that the more recent export decreases to the rest of the world shown in Figure
14 are attributable to the weakening of the global economy that itself is at least partially a
function of the ongoing U.S.-China trade dispute. If the Chinese economy starts to contract
from this trade dispute, its ability to purchase goods and products from its other trading
Figure 14: Gulf Coast exports to world
Source: U.S. Census Bureau: Economic Indicators Division USA Trade Online.
2 Agricultural products also experienced a large decrease in exports to China over this time period but are not shown in this figure.
3 Sposi, Michael and Kelvinder Virdi. Steeling the U.S. Economy for the Impacts of Tariffs. Federal Reserve Bank of Dallas. Economic Letter. Vol. 13, No. 5. April 2018.
Louisiana State University 13partners will start to deteriorate as well, even if they are not directly embroiled in this problem. The Eurozone, Japan, and other economies around the world are also experiencing slow growth, thereby reducing trade opportunities for Gulf Coast energy manufacturing. The second, and potentially more dangerous uncertainty that has arisen in 2019 has been the geopolitical tensions in the Middle East. On September 14, 2019, Houthi rebels in Yemen claimed to have launched coordinated drone attacks against neighboring Saudi Arabia, directly into the heart of its Abquiq and Khurais oil fields. These fields, collectively accounting for five MMBbl/d of production, and the important oil field equipment that processes the lower quality crude oil into a more suitable intermediate crude oil grade for western refining, were immediately damaged. This event followed closely behind summer maritime tensions in the Straits of Hormuz, over which 21 percent of world’s petroleum liquids consumption flows and re-energized concerns about how geopolitics, energy supplies, energy prices, and economics interact. While energy markets responded quickly and meaningfully to the attack on Saudi Arabian production, this market reaction ultimately proved to be short-lived. International oil spot prices (Brent exchange) surged on the day of the event, increasing by 20 percent, or $12 per barrel (Bbl). But futures prices, reflecting trades contracted for closure 12 months later, only increased by about $4.50/Bbl or eight percent. This pricing outcome suggests that markets were banking that the longer-run impact of the attacks would not be that deleterious to world energy supplies. Three days after the event, spot prices had fallen to around $4/Bbl to $5/Bbl above pre-attack prices. The increase in 12-month futures prices was down to just three percent, indicating that the markets were doubling down on the belief that there would be no significant long- run impacts. The market’s optimism was seemingly proven correct on October 3, 2019, when the Saudis reported that 100 percent of all production damaged by the earlier attacks was back online. While world crude oil prices appear to have stabilized, this is likely not the end of the story. There are considerable continued geopolitical tensions that could have important ramifications for the U.S. energy sector, particularly, and perhaps most importantly, along the Gulf Coast. As will be discussed later, current futures prices likely factor in a good part of this uncertainty, and what appears to be clear from these futures prices is that the market continues to be relatively well supplied. 2.5 Outlook: Commodity Pricing Futures markets are indicating that both crude oil and natural gas prices will be relatively flat in real terms over the forecast horizon primarily because: (a) the global economy is weakening, and the demand for energy will clearly follow this weakness in the near term; (b) non-OPEC energy resources, including unconventional U.S. supplies, continue to be 14 Gulf Coast Energy Outlook 2020
prolific; and (c) Saudi Arabia is likely to be accommodative on crude oil supplies given the
precariousness of tensions in the Persian Gulf region, and increasing throughout the Middle
East, particularly in Syria. This should come as no surprise, as futures markets are at least
pricing in the same considerations.
In fact, an examination of Figure 15 and Figure 16, which chart respective futures market prices
for crude oil and natural gas, show continued pricing moderation. November 2019 futures
markets are predicting that prices will remain below $55 per barrel for the foreseeable
future. In other words, futures markets are predicting that this new era of lower prices for oil
is here to stay.
Figure 16 shows the corollary for natural gas futures prices. Natural gas prices are forecasted
to bottom out in 2020 yet stay well below $3.00/MMBtu for the foreseeable future. This is

            Figure 15: Crude oil price outlook

            Source: S&P Global Market Intelligence.

a positive price outlook for most of the Gulf Coast energy complex, since regional energy
manufacturing and export investments rely so heavily on an affordable and amply supplied
natural gas feedstock.

2.6 Outlook: Crude Oil and Natural Gas Production
As noted earlier, an important issue arising in the development of the 2019 GCEO crude oil

                                                                           Louisiana State University   15
Figure 16: Natural gas price outlook
Source: S&P Global Market Intelligence.
and natural gas production forecasts was the extent to which the region’s unconventional
basins would continue to expand production. At the time of the 2019 GCEO development,
there was a considerable debate, particularly among various industry analysts, as to whether
the region could maintain its unparalleled productivity improvements, with some analysts
going so far as to suggest that the region had topped out in terms of well productivity,
particularly for crude oil, and would start to see flat-to-declining daily crude oil production
rates over the next several years.
For the past three years, the GCEO has utilized the Enverus ProdCast model for production
forecasts.4 The 2019 production forecasts did not take this position and, as shown in the
earlier section of this outlook, the past year’s production trends underscore the likelihood
of continued strong production growth. This year, the ProdCast model continues to take the
position that it is simply too early in the unconventional revolution to discount the ingenuity
of U.S. producers and their ability to extract copious levels of hydrocarbons from these
reserves. Ultimately, the law of diminishing returns will kick-in, but the GCEO takes the
position that this is not in the very immediate future (to 2030).
The GCEO crude oil and natural gas production forecasts, to 2030, are provided in Figure
17 and Figure 18.5 The forecast for U.S. production and Gulf Coast production are provided
4 Enverus was formerly DrillingInfo.
5 Crude oil and natural gas production forecasts for the 2020 GCEO are based on market observations and the Enverus Prodcast software formerly known and branded as
DrillingInfo. Despite the name change, this is the same forecasting tool utilized by the 2018 and 2019 GCEO.
16 Gulf Coast Energy Outlook 2020as separate series in each of these outlooks, along with the Gulf Coast’s anticipated share
of total U.S. crude oil and natural gas production, respectively.
Total U.S. crude oil production is projected to increase to approximately 18 million barrels
per day by 2030, with more than 12 million barrels a day of that production coming from the
Gulf Coast region. This will lead to a modest increase in the share of oil production coming
from the Gulf Coast region from about 66 percent in 2019 to 70 percent by 2030.
Figure 18 shows the forecast for U.S. and regional natural gas production through 2030. The
2020 GCEO U.S. natural gas production forecast anticipates an increase from 100 Bcf/d in
2019 to 131 Bcf/d by 2030. While Gulf Coast natural gas production is anticipated to increase
from 42 Bcf/d in 2019 to 56 Bcf/d in 2030, the region’s share of U.S. natural gas production
is forecast to flatline after 2027.6
Figure 17: Crude oil production forecast and Gulf Coast share of US.
production
Source: Enverus ProdCast.
6 Note that the ProdCast model is based on specific reservoirs, some of which cross state lines. For this reason, these do not match the specific state level production shown in above
historical production figures.
Louisiana State University 17Figure 18: Forecast for natural gas production and Gulf Coast share of
U.S. production
Source: Enverus. DI ProdCast.
3 | Pipeline Activity
3.1 Recent Trends
While both crude oil and natural gas production forecasts are strong, there are however, a
number of challenges to PADD 3 production, and those have less to do with geology than
they do the physical transportation constraints of moving crude oil out of the Permian Basin
and to the Gulf Coast. Recent financial and trade press articles have continued to emphasize
the challenges that the Permian Basin has in getting commodity out of the region and into
consuming and/or export areas.
An examination of the current level of natural gas flaring that is occurring in East Texas
is a good indicator of this transportation constraint (see Figure 19). Between November
2018 and January 2019, East Texas natural gas flaring peaked at 500 million cubic feet
per day (“MMcf/d”), primarily driven by associated natural gas production in the Permian
Basin, exceeding two percent of Texas total natural gas production. In the Permian itself,
flaring has exceeded five percent of total natural gas production in some months. For some
producers, these natural gas transportation constraints are becoming so significant that
18 Gulf Coast Energy Outlook 2020Figure 19: Natural gas flaring in Texas
Source: Texas Railroad Commission.
they have made decisions to simply not bring wells online because they would be forced
to flare the gas, even if bringing the well online could be profitable just from a crude oil
production perspective alone.
There are three types of transportation-oriented constraints arising in the Permian region.
The first constraint rests with the limited in-field gathering system capabilities in some areas.
The second constraint rests with limited gas processing, while the third constraint rests with
the need for additional longer-haul transmission pipeline capacity to move natural gas out
of the Permian to Gulf Coast markets.
Collectively, these constraints are leading to high in-region natural gas pricing discounts,
as seen in the Henry Hub/Waha pricing comparison provided in Figure 20. Over the past
several years, these two hubs traded at very similar prices, with Henry Hub receiving a small
premium, on average, due to its proximity to many large sources of natural gas demand.
However, early 2008 saw the emergence of significant Waha price discounts relative to
Henry Hub, and on some days, natural gas at Waha has traded at negative prices.
However, price signals do appear to be doing the trick of motivating regional infrastructure
development that includes the recently operational Gulf Coast Express Pipeline (Waha Hub
to Corpus Christi) that has two Bcf/d of capacity and should help to alleviate these growing
flaring challenges, as well as their corresponding negative impacts on prices.
Louisiana State University 19Figure 20: Henry Hub and Waha natural gas prices
Source: S&P Global Market Intelligence.
These transportation constraints are not limited to natural gas. Last year’s GCEO noted that
one of the more watched issues for the region was the degree to which new takeaway
crude oil transportation capacity could be developed. Figure 21 highlights the extent to
which these transportation constraints can influence crude oil pricing discounts.7
Specifically, Figure 21 investigates the extent to which shipping constraints can explain the
discount of West Texas Intermediate (WTI) relative to Louisiana Light Sweet (LLS). Three
vertical lines are drawn. The first vertical line is January 2007, the date at which EIA began
tracking crude oil and natural gas unconventional production in its Drilling Productivity
Reports. The second line is May 2012, when the Seaway pipeline was reversed. Seaway
initially moved crude from Freeport, Texas, on the Gulf Coast, to Cushing, Oklahoma, where
WTI is priced. After Seaway was reversed, the pipeline carried crude produced in the mid-
continent to Gulf Coast refineries. This line divides a regime of increasing internal shipping
constraints from a regime where those constraints were relieved. The third line is December
2015, when the U.S. government lifted the export ban that constrained the sale of crude oil
overseas.
The top panel of Figure 21 shows the share of crude oil transported from PADD 2 and PADD
4 in the mid-continent (states in the Rocky Mountain and Midwestern regions) to PADD 3 in
7 For more detailed analysis see: Agerton, Mark and Gregory B. Upton Jr. “ Decomposing crude price differentials: Domestic shipping constraint or the crude oil export ban?” The
Energy Journal 40 (3) 155-172; Upton, Gregory B. Crude Oil Exports and the Louisiana Economy. A discussion of U.S. policy of restricting crude oil exports and its implications for
Louisiana. LSU Center for Energy Studies. November 2015.
20 Gulf Coast Energy Outlook 2020Figure 21: PADD 3 crude oil movements by transportation type
Source: U.S. Energy Information Administration and Bloomberg.
the Gulf Coast. From 1990 to 2007, almost all crude was transported from the mid-continent
to the Gulf Coast via pipeline. Shippers used pipelines because rail and tanker were more
expensive on the margin. During this time WTI and LLS moved in lockstep. In fact, by April
2012, more than half of the crude shipped from the mid-continent to the Gulf Coast went via
high-cost barge and rail. Almost immediately after the reversal of the Seaway pipeline, this
trend stopped, and the share of crude shipped via pipeline began to recover.
The LLS-WTI premium closely mirrors changes in the mode of transport over the 2007-2015
time period. This close correlation between shipping and prices can explain between half
and three-quarters of the movement in relative prices. Empirical research has investigated
whether changes in the composition of refining as captured by API gravity of crude inputs
can explain these differentials. Evidence of shipping constraints, but not refining constraints,
is observed.
This analysis provides strong evidence that shipping constraints between the mid-continent
and Gulf Coast were the culprit for the price discount. Since the beginning of 2019, LLS
has once again began trading at a small premium to WTI. There are currently nine crude
oil pipeline projects in the Gulf Coast region, either under construction or announced, that
are expected to be completed by the end of 2021. We anticipate that this premium will be
temporary and relieved as additional pipeline infrastructure is built.
Louisiana State University 213.2 Pipeline Outlook
Figure 22 shows the pipeline transmission capacity additions anticipated over the next five
years. These capacity additions are restricted to just larger, interstate transmission pipelines
and do not include intrastate or gathering pipeline additions that may arise over the same
time period. The chart shows a decreasing level of interstate natural gas development
activity. Year end 2019 should see some relief to these regional constraints with about 34
percent of the announced natural gas transportation capacity coming on-line: The remaining
66 percent will come online in subsequent years.
Figure 22: U.S. interstate natural gas pipeline capacity expansions by
project type
Source: U.S. Energy Information Administration.
Table 1 provides the underlying natural gas pipeline projects that are under construction or
have been announced for development. This table includes the 42 largest projects, and
focuses only on major interstate natural gas pipelines, not the other corresponding pipeline
infrastructure (like intrastate lines and gathering system lines) that could be developed over
the same time period.
There are 15 major interstate natural gas pipeline projects currently under construction or
identified for development in the Northeast region. These are all new pipelines or expansions
of existing systems, representing 12 Bcf/d, and are being developed to alleviate regional
export constraints, particularly in the Permian and Appalachian Basins. For instance, Mountain
Valley Pipeline is a natural gas pipeline project that will run 304 miles from northwestern
West Virginia to southern Virginia, and transport natural gas produced in the Marcellus and
Utica shale to markets in the Mid and South Atlantic regions of the U.S. (Mountain Valley
22 Gulf Coast Energy Outlook 2020Table 1: Major U.S. interstate natural gas pipeline projects
Additional
Cost
Project Name Pipeline Operator Name Project Type Status In Service State(s) Region(s) Miles Capacity
(million $)
(MMcf/d)
Equitrans Expansion Project Equitrans LP Expansion Construction 2019 PA,WV Northeast 8 600
Mountain Valley Pipeline Mountain Valley Pipeline, LLC New Pipeline Construction 2020 WV,VA Northeast $5,000 304 2,000
Supply Header Project Dominion Transmission Expansion Construction 2019 PA,WV Northeast $500 38 1,500
Empire North Expansion Project Empire Pipeline Expansion Construction 2019 PA,NY,ON Northeast, Canada $141 25 300
Atlantic Coast Pipeline Atlantic Coast Pipeline New Pipeline Construction 2020 WV,VA,NC Northeast, Southeast $5,100 600 1,500
Northeast Supply Enhancement Project Transcontinental Gas Pipeline New Pipeline Approved 2019 PA,NJ,NY Northeast $927 37 400
PennEast Pipeline Co PennEast Pipeline Co New Pipeline Approved 2019 PA,NJ Northeast $1,000 118 1,107
Constitution Pipeline Constitution Pipeline Co New Pipeline Approved/On Hold 2020 PA,NY Northeast $683 121 650
Northern Access 2016 Project (PA to NY) National Fuel Gas Supply Corp Expansion Approved/On Hold PA,NY Northeast $455 101 497
FM 100 Project National Fuel Gas Supply Corp Expansion Applied 2021 PA Northeast 31 330
Leidy South Project Transcontinental Gas Pipeline Expansion Applied 2021 PA,MD,DE Northeast 12 580
Buckeye Xpress Columbia Gas Transmission Expansion Applied 2020 OH,WV,KY Northeast, Midwest $709 64 275
MVP Southgate Project Mountain Valley Pipeline, LLC New Pipeline Applied 2020 VA,NC Northeast, Southeast $440 73 300
Diamond East Project Transcontinental Gas Pipeline Expansion Announced 2020 PA,NY Northeast $800 50 1,000
Regional Energy Access Project (I and II) Transcontinental Gas Pipeline Expansion Announced 2022 PA,NJ Northeast 34 1,050
Cheniere MIDSHIP Pipeline Project Cheniere MIDSHIP Pipeline New Pipeline Construction 2019 OK,TX South Central $1,025 233 1,440
Creole Trail Expansion Project 2 Cheniere Creole Trail Pipeline Reversal Approved 2019 LA South Central $610 104 1,500
Port Arthur Pipeline- Texas Connector Port Arthur Pipeline LLC New Pipeline Approved 2022 TX South Central 34 2,000
Golden Pass LNG Bidirectional Pipeline Golden Pass Pipeline LLC Expansion Approved/On Hold 2023 LA,TX South Central $383 69 2,500
Lake Charles Expansion (Magnolia LNG) Kinder Morgan Louisiana PL Co Reversal Approved/On Hold 2023 LA South Central $202 1,362
Corpus Christi Stage III Pipeline Cheniere Energy Corpus Christi Expansion Applied 2021 TX South Central 21 1,530
Index 99 Expansion Project Gulf South Pipeline New Pipeline Applied 2020 LA, TX South Central 22 500
Port Arthur Pipeline- Louisiana Connector Port Arthur Pipeline LLC New Pipeline Applied 2023 LA,TX South Central $1,207 131 2,000
Rio Bravo Pipeline Project Rio Bravo Pipeline Company New Pipeline Applied 2020 TX South Central $2,173 138 4,500
TransCameron Pipeline Venture Global Calcasieu Pass New Pipeline Applied 2021 LA South Central $345 24 1,900
Delta Express Pipeline Project Venture Global New PIpeline Pre-applied LA South Central 281
Gulf Run Pipeline Enable Gas Transmission New Pipeline Pre-applied 2022 LA South Central 165 2,750
Permian Global Access Pipeline Tellurian New Pipeline Announced 2023 TX,LA South Central 2,000
Spire St. Louis Pipeline (Laclede Lateral) Spire STL Pipeline LLC Lateral Construction 2019 IL,MO Midwest $220 65 400
Louisiana XPress Project Columbia Gulf Transmission Expansion Applied 2022 KY,TN,MS,LA Midwest, South Central $472 493
NGPL Gulf Coast Southbound Project (Ph. II) Nat Gas P L Co of America Reversal Applied 2021 IL,MO,AR,TX Midwest, South Central $145 300
NGPL Gulf Coast Southbound Project (Ph. III) Nat Gas P L Co of America Reversal Announced 2021 IA,IL,MO,AR,TX Midwest, South Central $145 260
NGPL Waha Deliverability Expansion Project Nat Gas P L Co of America Reversal Announced 2019 IL,IA,NE,KS,OK,TX Midwest, South Central 465
Sierrita Pima Expansion Sierrita Gas Pipeline LLC Expansion Construction 2020 AZ,MX Mountain, Mexico $56 61 323
Cheyenne Connector Pipeline Tallgrass Energy Partners LP Expansion Applied 2019 CO Mountain $213 70 600
Sendero Gateway Project Sendero Midstream New Pipeline Applied 2019 NM,TX Mountain, South Central $45 23 400
Cheyenne Hub Enhancement Project Rockies Express Pipeline LLC Expansion Applied 2019 CO,WY,NE,KS,MO,IL Mountain, S.Central, Midwest $133 1,000
Double E Pipeline Summit Midstream Partners Expansion Pre-applied 2021 NM,TX Mountain, South Central $450 134 1,400
Western Energy Storage and Transportation Magnum Gas Storage LLC New Pipeline Announced 2021 UT,NV,AZ,MX Mountain, Mexico 650 2,000
Louisiana State University
Trail West/N-MAX Northwest Pipeline Co Expansion Announced 2021 OR Pacific $800 106 450
Pacific Connector Gas Pipeline Pacific Connector Gas Pipeline LP New Pipeline Applied 2021 OR Pacific $1,700 229 1,200
Island Gas Connector Island Gas New Pipeline Announced 2020 WA,BC Pacific, Canada 81 700
23
Source: U.S. Energy Information Administration.Pipeline, 2019). Similarly, the Atlantic Coast Pipeline is a 600-mile interstate natural gas pipeline project that will originate in West Virginia and move gas through Virginia and into eastern North Carolina. This project is anticipated to come online in 2020 with a capacity of 1.5 Bcf/d (Atlantic Coast Pipeline, 2019). Several other projects are being developed primarily to move U.S. natural gas production volumes to the Gulf of Mexico (GOM) region for industrial consumption and the Gulf Coast for LNG exports. For instance, Cheniere’s Midship Pipeline is being developed “to deliver a reliable supply of domestic natural gas from Oklahoma’s rapidly growing production areas to consumers predominantly in the Gulf Coast and Southeast U.S. markets. Natural gas will be delivered through the pipeline to industrial facilities, natural-gas-fired power generators, liquefaction terminals, and downstream users such as local distribution companies” (Midship Pipeline, 2019). Enable’s Gulf Run Pipeline is a proposed interstate transmission line designed to bring natural gas from the Haynesville, Marcellus, Utica and Barnett shales, as well as the Mid-Continent region to the Gulf Coast. It is designed to provide a critical link between increased domestic natural gas production and increasing demand from Gulf Coast and international markets. In total, the larger projects listed in Table 1 amount to 46 Bcf/d of new or expanded transmission capacity. About 12 Bcf/d are in the Northeast region and are being developed to alleviate regional constraints, as well as to transport production from prolific Appalachian shale. More than half of the new capacity in Table 1, almost 24 Bcf/d, is in the South Central region, being developed to bring natural gas toward the GOM. And another 2 Bcf/d will originate in the Midwest and also bring natural gas toward the GOM. Much of this capacity will be a reversal of pipeline flow. 4 | Energy Manufacturing Activity 4.1 Recent Trends The Gulf Coast has some of the highest concentration of energy manufacturing activities in the U.S. The level of capital development in the region has been phenomenal, but there are warning signs that these capital investments may be starting to slow. The political and geopolitical challenges discussed earlier, which create considerable investment uncertainty, do not bode well for potential projects that typically run in the hundreds of millions of dollars, if not billions. Figure 23 highlights the recent Gulf Coast industrial capital investments that have been leveraged by lower cost and more available unconventional hydrocarbons. In total, across the entire period examined, the Gulf Coast region is anticipated to potentially experience as much as $308 billion in new capital investments. This investment averages to about $15 24 Gulf Coast Energy Outlook 2020
Figure 23: GOM energy manufacturing investments by state

            Source: LSU Center for Energy Studies.

billion per year along the GOM over a 20-year period. Through 2018, all GOM states, mostly
Texas and Louisiana, have experienced as much as $113 billion (or about $14 billion per
year). Louisiana has received the larger share of this investment ($62 billion or 55 percent)
while Texas has received as much as $50 billion (or 44 percent).
Most investments made in the region over the past decade originally began as expansions
to existing facilities, including LNG facilities, which at the time were dedicated primarily to
facilitating natural gas imports, not exports. While some greenfield investments have been
made, these too have been to leverage existing low-cost, abundant hydrocarbons and the
existing regional infrastructure that can be used to process and move those hydrocarbons
from point A to point B.
Figure 24 provides a breakdown of these GOM investment trends by sector and shows that
LNG export facility investments dominate the historic trend, and clearly dominate the outlook
from 2019 to 2023. Prior to 2019, LNG investments accounted for $55 billion (45 percent)
of all capital investments along the Gulf Coast. Olefins (cracker) and other petrochemical-
based investments accounted for the second highest share at $43 billion (38 percent). The
high investment shares in LNG facilities should come as no surprise given the high individual
investment cost per train, which can run as much as $8 billion to $12 billion.

                                                                          Louisiana State University   25
Figure 24: GOM energy manufacturing investments by sector
Source: LSU Center for Energy Studies.
4.2 Energy Manufacturing Outlook
As noted earlier, there are strong headwinds negatively impacting industrial development in
the region. Ongoing trade tensions impact industrial projects in the region in numerous and
different ways, from raising their cost of development, to lower utilization of existing capital/
capacity investments, to creating a degree of uncertainty that is never conducive for large
capital investments. To date, there is at least one major Gulf Coast project (Wanhua Chemical
in Convent, Louisiana) that has been cancelled due in large part (but not exclusively) to the
ongoing trade tensions between the U.S. and China.
One of the more important ramifications of the current U.S.-China trade tensions is the
resulting negative implications they have for continued economic growth around the world.
The International Monetary Fund (IMF) has already revised its outlook for Chinese economic
growth downward (Figure 25) and has revised its outlook for world growth downward at
least twice this year from 3.3 percent in April 2019 to 3.2 percent July 2019 and 3.0 in
October 2019.
The Organization for Economic Co-operation and Development (OECD) and International
Energy Agency (IEA) have expressed the same expectations by downgrading world
economic growth outlooks this year.
Furthermore, overall industrial weakness is starting to become more and more visible in the
overall U.S. manufacturing numbers. Figure 26, for instance, shows the trend in the Federal
Reserve’s Industrial Production Index and the Institute for Supply Management (ISM)
Purchasing Managers’ Index (PMI). The Industrial Production Index can be thought of as a
barometer of current industrial activity, whereas the PMI is often thought of as a barometer of
future industrial activity and investment sentiment.
26 Gulf Coast Energy Outlook 2020Figure 25: Changes in Chinese GDP
Source: International Monetary Fund.
Unfortunately, both the Industrial Production Index and the PMI have been falling throughout
the better part of 2019 to the point where, by August 2019, the PMI registered a number
well below 50, indicating potential contraction of the U.S. manufacturing sector. This does
not bode well for future U.S. economic activity since (a) manufacturing activities in the oil
and gas sector have carried the U.S. economy for the better part of the decade, and (b)
overall, manufacturing has surged since mid-year 2016 and has proven to be an important
source of economic growth pushing the U.S. economy beyond its prior two percent per
year GDP doldrums.
Figure 26: U.S. industrial production index
Source: Federal Reserve Bank of St. Louis.
Louisiana State University 27Lastly, economic and geopolitical uncertainty, as is often the case, has created a flight to
quality in capital and foreign exchange markets over the past year. Dollar valuations, as a
result, continue to be high, returning to previous exchange levels that peaked in January
2017. High dollar valuations make U.S. goods and products, including energy manufacturing
goods (refined product, commodity chemicals, etc.) and energy exports, increasingly more
expensive. Figure 27 highlights recent dollar valuation shifts using the Federal Reserve
Board’s “Broad Index,” which is a weighted average of foreign exchange values for the U.S.
dollar versus its major trading partners.
Figure 27: U.S. dollar valuation, Federal Reserve Broad Index
Source: Federal Reserve Bank of St. Louis.
Table 2 provides an overview of total investment dollars associated with all the project
announcements in the major parts of the Gulf Coast (Texas, Louisiana, and other GOM). The
total investment dollars for each GOM state is broken down in the table by LNG-related
investments and non-LNG-related investments. Overall, for the time period 2019 to 2029,
the 2020 GCEO anticipates a maximum level of investments, based on current project
announcements of $195 billion. A large share, 68 percent ($133 billion), of these potential
investments are related to LNG facilities. Louisiana, at this point, is likely to receive as much
as $116 billion of this investment (60 percent); however, it is very heavily weighted to LNG
export facilities (76 percent of total Louisiana investment). Texas could receive as much as
$71 billion of this investment; however, the totals are slightly more balanced between LNG
facility investments, several olefins investments ($36 billion), and several other methanol
facility investments ($35 billion).
28 Gulf Coast Energy Outlook 2020Table 2: Total GOM investment, all project announcements
Texas Louisiana Other GOM Total GOM
Year LNG Non-LNG LNG Non-LNG LNG Non-LNG LNG Non-LNG
------------------------------------------------------------------------ (million $) ------------------------------------------------------------------------
2019 $ 3,503 $ 5,126 $ 2,466 $ 2,075 $ – $ – $ 5,969 $ 7,201
2020 5,374 10,387 17,337 5,688 11 – 22,723 16,075
2021 9,817 15,352 31,773 9,001 561 – 42,150 24,352
2022 10,419 3,502 21,291 2,560 2,665 – 34,375 6,062
2023 5,448 151 12,167 1,699 3,327 – 20,941 1,850
2024 1,421 – 3,033 2,279 1,332 – 5,786 2,279
2025 99 – 476 2,159 104 – 679 2,159
2026 – – 29 1,442 – – 29 1,442
2027 – – – 648 – – – 648
2028 – – – 162 – – – 162
2029 $ – $ – $ – $ 11 $ – $ – $ – $ 11
Total $ 36,082 $ 34,518 $ 88,511 $ 21,124 $8,000 $ – $ 132,653 $ 62,241
Table 3 presents the 2020 GCEO baseline outlook for energy manufacturing in the region.
This baseline discounts certain projects based upon their likelihood of development in the
2019-2029 time period. Most of the adjustment in this baseline comes from LNG facility
development, which is now forecast to occur much later in the time horizon that current
announcements suggest. As a result, the 2020 GCEO sees near- term energy manufacturing
and export investment reduced during the 2019-2029 time period from an announced level
of $195 billion to $131 billion. This forecast, however, is highly dependent upon the ongoing
Table 3: Total GOM investment, new baseline outlook
Texas Louisiana Other GOM Total GOM
Year LNG Non-LNG LNG Non-LNG LNG Non-LNG LNG Non-LNG
------------------------------------------------------------------------ (million $) ------------------------------------------------------------------------
2019 $ 3,417 $ 4,975 $ 2,205 $ 1,991 $ – $ – $ 5,622 $ 6,966
2020 3,660 7,207 8,686 5,683 – – 12,346 12,891
2021 4,667 9,655 11,830 9,001 – – 16,497 18,655
2022 5,885 4,908 11,760 2,560 – – 17,644 7,468
2023 3,037 491 11,642 1,699 – – 14,679 2,191
2024 578 – 6,925 2,279 – – 7,503 2,279
2025 34 – 1,891 2,159 – – 1,924 2,159
2026 – – 132 1,442 – – 132 1,442
2027 – – – 648 – – – 648
2028 – – – 162 – – – 162
2029 $ – $ – $ – $ 11 $ – $ – $ – $ 11
Total $ 21,277 $ 27,237 $ 55,071 $ 27,635 $ – $ – $ 76,348 $ 54,872
Louisiana State University 29trade and geopolitical uncertainties discussed earlier. An exacerbation of these uncertainties
could reduce this near-term capital expenditure profile considerably.
5 | Energy Exports
5.1 Recent Trends: Refined Product Exports
The Gulf Coast region is the largest concentrated area of petroleum refining in the U.S.
Figure 28 shows the concentration for PADD 3 relative to other regions of the U.S. There
are 56 refineries operating on the Gulf Coast that can process up to 9.8 MMBbl/d of refined
product. The region’s refineries account for 52 percent of all U.S. operating refinery capacity.
Figure 28: Number and capacity of U.S. refineries
Source: International Monetary Fund.
Operable capacity in the region has grown considerably over the past 30 years, primarily due
to capacity creep at existing facilities. No new greenfield refinery has been built since 1976
in Garyville, Louisiana (the Marathon refinery). The last several years have seen considerable
growth in PADD 3 refining capacity in order to meet new opportunities for the export of
30 Gulf Coast Energy Outlook 2020refined product to other places of the world (Figure 29). The operating utilization of that
capacity has increased considerably since the contractions of the earlier part of the last
decade. Over the past several years, the region’s refineries have been operating at around
90 percent, a level comparable to, and likely driving, the national average.
Figure 29: PADD 3 refining capacity and utilization
Source: U.S. Energy Information Administration.
Figure 30 underscores the changing composition of the Gulf Coast energy economy and
the greater emphasis toward export-oriented projects. This chart shows the overall refined
product trends for PADD 3 refineries. Overall, refined product output is up from the lows
Figure 30: PADD 3 petroleum products supplied
Source: U.S. Energy Information Administration.
Louisiana State University 31experienced after the 2008-2009 recession. Further, the shares of finished motor gasoline,
produced predominately for the U.S. market, have begun to contract in each year in the
series. More profitable distillates and jet fuel are taking their place. These products, in large
part, are consumed abroad and are designed for international markets.
Lastly, Figure 31 shows the trends in overall petroleum imports and exports for the U.S. Prior
to 2011, the U.S. was a net importer of all refined petroleum products. After that year, the U.S.
shifted to becoming a net exporter, and that position has continued to increase on a year-
over-year basis since 2011. As noted earlier, increasingly, the U.S., and PADD 3, are leveraging
distillation capacity to produce higher value distillates to sell in international commerce.
Figure 31: U.S. petroleum product imports and exports
Source: U.S. Energy Information Administration.
5.2 Recent Trends: Crude Oil Exports
U.S. energy exports continue to grow, as does the continued progress and productivity of
most unconventional plays along the GOM. While crude oil, like any commodity, is fungible,
a large amount of in-region (PADD 3) crude oil production is finding its way to GOM ports and
into international commerce. Over 80 percent of all U.S. crude oil exports exit the country
from a GOM port, most of which are export facilities around Houston and Corpus Christi, and
through the new export investments at the Louisiana Offshore Oil Port (LOOP).
U.S. crude oil exports continue to grow at a rapid pace, by as much as 20 percent since
2016. The past year (2019) has been no different. Figure 32 shows how these exports have
dramatically changed the U.S.’ balance of crude oil trade. Crude oil imports into the U.S.,
while still substantial, continue to fall. This decrease, however, appears to be flattening, in
large part due to qualitative requirements that many refineries have in the U.S., particularly
those on the West Coast.
32 Gulf Coast Energy Outlook 2020Figure 32: U.S. crude oil exports and imports
Source: U.S. Energy Information Administration.
5.3 Recent Trends: LNG Exports
LNG exports are driven by trends in domestic production costs as well as world markets,
particularly the price of crude oil, since crude, and its refined products, are often substitutes
for natural gas. The U.S. is not the only source of abundant low-cost natural gas supply, and
any LNG that leaves domestic markets must compete with natural gas produced by other
countries from both conventional and unconventional plays.
Figure 33 shows there are several countries with robust natural gas reserves totaling close
to 7,100 trillion cubic feet (Tcf). While U.S. unconventional development has greatly enhanced
domestic supplies, these recent domestic resource developments pale in comparison to the
size of natural gas reserves in other countries, such as Russia, Iran and Qatar. Each of these
three countries has reserves that are two- to four-times that of the U.S. and, collectively,
the three countries control over half of estimated global natural gas reserves. The U.S., by
contrast, reports six percent of global natural gas reserves.
Cost is also an important factor in determining global natural gas (LNG) market share;
however, relative cost, which is the cost of natural gas relative to crude oil, is often just
as important as any individual country’s overall cost advantage. Figure 34 shows the cost
differential between crude oil and natural gas, standardized on a barrel of oil equivalent
(BOE) basis. Here, crude oil prices are those associated with the Brent index, and natural
gas is the domestic U.S. price at the Henry Hub. The relative difference in these two energy
commodity prices drives the market, since LNG prices in these markets are often pegged
to crude oil prices.
Louisiana State University 33You can also read