Operational and Safety-Based Analyses of Varied Toll Lanes - ROSA P
←
→
Page content transcription
If your browser does not render page correctly, please read the page content below
Operational and Safety-Based Analyses of
 Varied Toll Lanes

 Didier Valdés, PhD, Benjamín Colucci, PhD,
 University of Puerto Rico at Mayagüez University of Puerto Rico at Mayagüez
 Department of Civil Engineering and Surveying Department of Civil Engineering and Surveying
Operational and Safety-Based Analyses of Varied Toll Lanes

Didier M. Valdés Díaz, PhD Benjamín Colucci Ríos, PhD
Principal Investigator Principal Investigator
Department of Civil and Surveying Department of Civil and Surveying
University of Puerto Rico at Mayagüez University of Puerto Rico at Mayagüez

Johnathan Ruiz González, BSCE Bryan Ruiz Cruz, BSCE, BSST
Graduate Research Assistant Graduate Research Assistant
Department of Civil and Surveying Department of Civil and Surveying
University of Puerto Rico at Mayagüez University of Puerto Rico at Mayagüez

Ricardo García Rosario Enid Colón Torres
Undergraduate Research Assistant Undergraduate Research Assistant
Department of Civil and Surveying Department of Civil and Surveying
University of Puerto Rico at Mayagüez University of Puerto Rico at Mayagüez

 A Report on Research Sponsored by SAFER-SIM

 February 2016
Operational and Safety-Based Analyses of Varied Toll Lanes 1

 Table of Contents

Table of Contents ...................................................................................................... 1

List of Figures............................................................................................................ 3

List of Tables ............................................................................................................. 5

Acronyms .................................................................................................................. 6

Sponsorship .............................................................................................................. 7

Abstract ..................................................................................................................... 9

CHAPTER 1 INTRODUCTION .......................................................................... 11

1.1 Background.......................................................................................... 11

1.2 Problem Description ............................................................................. 13

1.3 Hypothesis ........................................................................................... 13

CHAPTER 2 LITERATURE REVIEW ................................................................ 15

2.1 Safety in Tollway Facilities ................................................................... 15

2.2 Toll Plaza Signage Configuration ......................................................... 18

2.3 Driving Simulation ................................................................................ 19

CHAPTER 3 METHODOLOGY ......................................................................... 21

3.1 Methodology Description ...................................................................... 21

3.2 Experimental Design ............................................................................ 23

3.3 Subject Drivers ................................................................................... 24

3.4 Study Protocol...................................................................................... 25

3.5 Runtime Setup Instruction .................................................................... 27

3.6 Configurations ...................................................................................... 27

3.7 Running the Simulation......................................................................... 30

3.8 Driving Simulator.................................................................................. 31

3.9 Scenario Development Process ........................................................... 33

3.10 Configuration Signs Description ........................................................... 35
Operational and Safety-Based Analyses of Varied Toll Lanes 2

3.11 Independent Variables ......................................................................... 35

3.12 Variables Evaluated ............................................................................. 36

3.13 Locator References ............................................................................ 36

CHAPTER 4 ANALYSIS AND RESULTS .......................................................... 42

4.1 Statistical Test Description ................................................................... 42

4.2 Standard Deviation of Roadway Position Analysis ............................... 43

4.3 Average Speed Analysis ...................................................................... 44

4.4 Acceleration Noise Analysis ................................................................. 45

4.5 Discussion of the Results ..................................................................... 47

CHAPTER 5 CONCLUSIONS ........................................................................... 57

5.1 Recommendations ............................................................................... 58

5.2 Acknowledgements .............................................................................. 59

REFERENCES........................................................................................................ 60

APPENDIX .............................................................................................................. 62
Operational and Safety-Based Analyses of Varied Toll Lanes 3

 List of Figures

Figure 2.1 Changes in Lane Configuration Usage in Caguas Sur Toll Plaza ................. 17

Figure 3.1 UPRM Research Methodology ..................................................................... 22

Figure 3.2 Subject Age Distribution Amongst Participants ........................................... 25

Figure 3.3 Realtime Sim Creator® Runtime Set-Up Screen ........................................... 27

Figure 3.4 UPRM Driving Simulator Stationary Version ............................................... 32

Figure 3.5 UPRM Mobile Driving Simulator Version ...................................................... 32

Figure 3.6 Caguas Sur Toll Plaza Simulated Model Illustration ..................................... 33

Figure 3.7 Configuration 1 Current Roadside Signage .................................................. 34

Figure 3.8 Configuration 2 Proposed Overhead Signage .............................................. 34

Figure 3.9 Locator References for the SDRP Variables ............................................... 38

Figure 3.10 Locator References for the Speed and Acceleration Noise Variables ....... 40

Figure 4.1 Position vs. Distance of Scenario 11 for Both Configurations ....................... 48

Figure 4.2 Position vs. Distance of Scenario 3 for Both Configurations ......................... 49

Figure 4.3 Position vs. Distance of Scenario 4 for Both Configurations ......................... 50

Figure 4.4 Position vs. Distance of Scenario 8 for Both Configurations ......................... 51

Figure 4.5 Position vs. Distance of Scenario 9 for Both Configurations ........................ 52

Figure 4.6 Position vs. Distance of Scenario 12 for Both Configurations ....................... 53

Figure 4.7 Position vs. Distance of Scenario 6 for Both Configurations ........................ 54

Figure 4.8 Average Speed Along the Tollway for Scenario 8 ......................................... 55

Figure A.1 SDRP Configuration Comparison Scenario 1 ............................................... 63

Figure A.2 SDRP Configuration Comparison Scenario 2 ............................................... 64

Figure A.3 SDRP Configuration Comparison Scenario 3 ............................................... 65

Figure A.4 SDRP Configuration Comparison Scenario 4 ............................................... 66

Figure A.5 SDRP Configuration Comparison Scenario 5 ............................................... 67

Figure A.6 SDRP Configuration Comparison Scenario 6 ............................................... 68
Operational and Safety-Based Analyses of Varied Toll Lanes 4

Figure A.7 SDRP Configuration Comparison Scenario 7 ............................................... 69

Figure A.8 SDRP Configuration Comparison Scenario 8 ............................................... 70

Figure A.9 SDRP Configuration Comparison Scenario 9 ............................................... 71

Figure A.10 SDRP Configuration Comparison Scenario 10 ........................................... 72

Figure A.11 SDRP Configuration Comparison Scenario 11 ........................................... 73

Figure A.12 SDRP Configuration Comparison Scenario 12 ........................................... 74

Figure B.1 Average Speed Diagram for Scenario 1 ....................................................... 75

Figure B.2 Average Speed Diagram for Scenario 2 ....................................................... 77

Figure B.3 Average Speed Diagram for Scenario 3 ....................................................... 78

Figure B.4 Average Speed Diagram for Scenario 4 ....................................................... 79

Figure B.5 Average Speed Diagram for Scenario 5 ....................................................... 80

Figure B.6 Average Speed Diagram for Scenario 6 ....................................................... 81

Figure B.7 Average Speed Diagram for Scenario 7 ....................................................... 82

Figure B.8 Average Speed Diagram for Scenario 8 ....................................................... 83

Figure B.9 Average Speed Diagram for Scenario 9 ....................................................... 84

Figure B.10 Average Speed Diagram for Scenario 10 ................................................... 85

Figure B.11 Average Speed Diagram for Scenario 11 ................................................... 86

Figure B.12 Average Speed Diagram for Scenario 12 ................................................... 87
Operational and Safety-Based Analyses of Varied Toll Lanes 5

 List of Tables
Table 3.1 Scenario Descriptions. ................................................................................... 24

Table 3.2 Toll Plaza Final Destination Depending on the Scenario................................. 26

Table 3.3 Subject Distribution by Configuration, Gender and Age ................................. 28

Table 3.4 Configuration 1 Subject Drivers Sequence ................................................... 29

Table 3.5 Configuration 2 Subject Drivers Sequence................................................... 30

Table 3.6 Data Collection Area for SDRP Variables. ..................................................... 39

Table 3.7 Data Collection Area for the Speed and Acceleration Noise Variables ........... 41

Table 4.1 SDRP in the Twelve Scenarios for Both Configurations. ................................ 44

Table 4.2 Average Speed in the 12 Scenarios for Both Configurations. ........................ 45

Table 4.3 Average Acceleration Noise in the 12 Scenarios for Both Configurations. ..... 47
Operational and Safety-Based Analyses of Varied Toll Lanes 6

 Acronyms

DOT Department of Transportation

ETC Electronic Toll Collection

FHWA Federal Highway Administration

IRB Institutional Review Board

ITS Intelligent Transportation Systems

MPH Miles per Hour

MUTCD Manual on Uniform Traffic Control Devices

ORT Open Road Tolling

PDO Property Damage Only

RITA Research and Innovative Technology Administration

SDRP Standard Deviation of Roadway Position

TCD Traffic Control Devices

UPRM University of Puerto Rico at Mayagüez

UTC University Transportation Center

VMS Variable Message Signs

WHO World Health Organization
Operational and Safety-Based Analyses of Varied Toll Lanes 7

 Sponsorship

 This project is part of Safety Research using Simulation Center (SAFER-SIM)

program that was established in 2013 and sponsored by the Research and Innovative

Technology Administration (RITA). The investigation program brings together

transportation safety research from multiple educational institutions with the goal of

analyzing and addressing safety issues on America’s roads. The following universities

comprise the consortium:

University of Iowa, Iowa City, IA (UI)

 The University of Iowa was founded in 1847 and is a major national research

university with 30,000 students that are spread through 11 colleges. UI offers education

in Engineering, Medicine, Pharmacy, Public Health and Liberal Arts and Sciences,

along with six research centers that carry out transportation- related research

projects.

University of Central Florida – Orlando, FL (UCF)

 The University of Central Florida, founded in 1963, offers college education

to approximately 60,000 students among 183 bachelors and 29 master’s degrees

and doctoral programs. This institution has a Center for Advanced Transportation Systems

Simulation (CATSS) in which driving simulators and traffic data sensing technology has

been used for road safety research. This Center has students from civil engineering,

computer science, kinesiology, and psychology.

University of Massachusetts –Amherst, MA (UMass)

 The University of Massachusetts provides education to nearly 30,000 students.

Installed in 1980 was the Arbella Insurance Human Performance Lab (HPL), a laboratory
Operational and Safety-Based Analyses of Varied Toll Lanes 8

that realized transportation-related investigations to address safety and driving behavior

using a driving simulator.

University of Wisconsin – Madison, WI (UW)

 The University of Wisconsin was founded in 1848 and has over 42,000 students

enrolled under 150 bachelors and master’s degrees and 100 doctoral programs. UW has

transportation related research with faculties from Civil Engineering, Industrial

Engineering, Computer Science, Medicine, Public Health, Urban Planning, Geography,

Psychology and Law.

University of Puerto Rico – Mayagüez. PR (UPRM)

 The University of Puerto Rico at Mayagüez is a recognized minority serving

institution established in 1911. It is a bilingual college that offers studies to approximately

12,000 students in Agricultural Science, Arts and Science, Business Administration,

Engineering, and Division of Continuing Education and Professional Studies. The Civil

Engineering and Surveying Department offers a BS in Civil Engineering and Surveying,

MS in Construction Management, Environmental Engineering, Geotechnical Engineering,

Structural Engineering and Transportation Engineering. In addition, PhDs in

Transportation, Structures and Environmental are offered at this institution.
Operational and Safety-Based Analyses of Varied Toll Lanes 9

 Abstract

 Over the past decades, fatal crashes and severe injuries have been observed to

increase in highway facilities. This has created a big concern among different

transportation agencies and other organizations such as State Departments of

Transportation (DOT) and the World Health Organization (WHO). One of the most

important components of highway operations that is affected by the increase in crashes

are toll road systems.

 Recent toll plaza designs have changed drastically due to the implementation of

new technologies such as Electronic Toll Collection (ETC). Although these emerging

features are developed to improve toll plaza operations, it has altered driver behavior

and increased crash frequency as a result of driver confusion and difficult merging

scenarios that occur when approaching toll plazas with alternative payment methods.

Driving simulators are cost-efficient devices that can be used to understand how these

changes affect driving behavior and safety issues in toll roads without endangering the

health of the participants. Past studies have used driving simulators to evaluate the

effectiveness of pavement markings, crash cushions, traffic control devices, Variable

Message Signs (VMS) and other emerging technologies.

 This research presents the first mobile driving simulator in Puerto Rico used to

address safety issues related to driver behavior and toll plaza design, which is located in

the Transportation Laboratory of the University of Puerto Rico at Mayaguez (UPRM). The

purpose of this research is to evaluate the effectiveness of two different signage

configurations of Caguas Sur Toll Plaza using a virtual simulation environment. The first

configuration contained roadside signage that corresponded to the existing sign

conditions, while the second configuration consisted of the proposed overhead signage.
Operational and Safety-Based Analyses of Varied Toll Lanes 10

Both signage configurations provided information regarding the speed limits and lane

purpose before approaching the toll plaza. A sample of subject drivers was selected to

drive through different scenarios to evaluate the effectiveness of both signage

configurations. The variables used for analysis were standard deviation of roadway

position (SDRP), average speed and acceleration noise, which were calculated in different

locator references prior to the toll plaza.

 The outcome of the research indicated that the configuration with the proposed

conditions had a statistically significant reduction of acceleration noise, which was used

as a surrogate measure of safety. This was a result of the reduction in lane-changing

patterns. It was found that subject drivers of scenarios containing overhead signage

changed lanes smoothly and reduced vehicle velocity with anticipation when approaching

the toll plaza. Significant difference was found between the signage configurations

when analyzing acceleration noise in the Toll Plaza Locator Reference.

 In conclusion, this study provides strong evidence that driving simulators can be

used as an effective and low-cost technology to identify alternative signage configurations

at toll plazas without exposing drivers to dangerous situations. These results are expected

to contribute both to the understanding of driving behavior and the safety of new features

used in the operation of toll facilities around the world.
Operational and Safety-Based Analyses of Varied Toll Lanes 11

 CHAPTER 1 INTRODUCTION

 This chapter provides background information regarding safety issues that have

influenced the urge for the development of research in toll plazas. Generally, the problem

being attended in the investigation is associated with the diversity of toll plaza signage

designs and how road safety has been affected by this component of highway operations.

Therefore, a hypothesis is analyzed to determine if a change in the existing signage

configuration can positively influence driving behavior, with the use of the driving

simulator, and contribute to road crash reduction in toll plazas.

 1.1 Background

 Different organizations and state DOTs are concerned with the increment of fatal

crashes and severe injuries related to highway facilities that have occurred during the

recent decades. According to WHO, the ninth cause of disease or injury in 1990 was road

traffic injuries (Peden et al., 2004), and it is estimated to rank third by the year 2020 with

an approximate forecast of 1.9 million deaths per year (WHO, 2013). Different highway

systems, such as toll roads, are being highly affected by the increase of crash frequency

as a consequence of the development of new transportation technologies. Even though

toll road systems have been designed and operated in the United States for more than 50

years, there is no recognized design standard that addresses the uniformity of toll plaza

design and safety issues (Brown et al., 2006). The lack of uniformity among different toll

plazas has altered drivers' speed and lane changing patterns when approaching toll

facilities that affect toll plaza safety. New innovative technologies and lane modifications

in toll plazas, such as ETC and Open Road Tolling (ORT), have amplified driving confusion

and challenging merge scenarios that have resulted in unexpected driving behavior.

Driving simulators have been used in different transportation studies to analyze how
Operational and Safety-Based Analyses of Varied Toll Lanes 12

human factors and road safety are related in a virtual environment. This type of simulation

can be used to understand driving behavior under different scenarios where drivers are in

a hazardous situation without the subject driver being exposed to physical injury.

 Driving simulators can be a cost-effective solution to study emerging technologies

and lane modifications that are currently used or will be implemented in toll plazas.

Scenarios can be created to understand how signage configuration and the number of

lanes with different types of toll collection affects toll plaza safety. The purpose of this

research is to recreate toll plaza scenarios in a virtual environment using an RTI (Realtime

Technologies Inc.) cockpit driving simulator and evaluate if the proposed signage

configuration has the potential to improve road safety of an existing toll road. The toll plaza

selected for this study is Caguas Sur Toll Plaza, which is located on PR-52 within the

municipality of Caguas, Puerto Rico. Therefore, the main goal of this investigation is to

determine which of the following signage configurations has a lower likelihood of road

crashes: existing conditions (roadside signage) or proposed conditions (overhead

signage).

 A methodology for the construction of toll plaza scenarios was developed in the

Transportation Engineering Laboratory located in the University of Puerto Rico at

Mayaguez (UPRM) with the collaboration of the University of Massachusetts Amherst and

the University of Wisconsin in Madison. The research included three variables: standard

deviation of roadway position (SDRP), average speed, and acceleration noise. Studies

have demonstrated that acceleration noise distributions can be used as surrogate

measures of road safety (Boonsiripant, 2009; Chung and Gartner, 1973). Average speed

and acceleration noise were determined in four locator references while SDRP was

determined in five locator references prior to the toll plaza. The variables were analyzed

for both signage configurations using 12 different scenarios in which three different factors
Operational and Safety-Based Analyses of Varied Toll Lanes 13

were controlled: traffic flow condition, starting lane position, and destination lane at the toll

plaza. In addition, daylight and nighttime conditions were compared to determine how both

situations affect driving behavior.

 1.2 Problem Description

 In the beginning, toll plazas were designed and constructed using cash- only

systems for all lanes. Toll roads have been modified to mixed systems that operate cash

lanes and ETC lanes with different posted speed limits. Caguas Sur Toll Plaza uses the

extreme left lanes as ETC lanes for passenger cars only with a posted maximum speed

of 55 mph. Similarly, center lanes operate as ETC lanes for general use, allowing both

passenger cars and heavy vehicles to travel at a maximum speed of 35 mph. Lastly, lanes

located at the extreme right are used as cash-only and recharge lanes, where drivers have

to stop their vehicles in the toll plaza to perform the transaction.

 Safety problems with toll plaza systems increased after the implementation of

technologies with automatic tolling in combination with cash- only lanes. Although the

Manual on Uniform Traffic Control Devices (MUTCD) added a section for toll plaza

signage, toll roads prior to the release of the manual have not updated their signage

configurations to fulfill the requirements (MUTCD 2009). Therefore, the potential for driving

confusion increases when drivers have to decide which lane to use in a system that has

diverse operating speeds at the same time.

 1.3 Hypothesis

 The general hypothesis for this research is that drivers of scenarios created with

the proposed signage configuration would have a better performance, in terms of SDRP,

average speed and acceleration noise, than those presented the scenario with the

existing signage configuration. This hypothesis is used for the evaluation and comparison
Operational and Safety-Based Analyses of Varied Toll Lanes 14

of three driving behaviors: first, the distribution of acceleration noise when subject drivers

are exposed to both signage configurations; second, the difference in average speed and

acceleration noise between participants who drive through the electronic toll lane or cash

lane; and third, the difference between subject drivers in scenarios that include

daytime or nighttime conditions. The performance measures used to evaluate driving

behavior were obtained from the differences of SDRP, average speed, and acceleration

noise between both signage configurations. The experimental design was based on the

Latin square principle to counterbalance the order of subject drivers throughout the 12

scenarios and obtain results that are not dependent on the order in which participants saw

each scenario. In addition, drivers were allowed to use the simulator in scenarios that were

not related to the investigation to ensure their understanding of the equipment prior to the

beginning of the experiments. However, participants that suffered from simulation

sickness were excluded from analysis. This research was approved by the UPRM

Institutional Review Board (IRB) protocol number 20141109, which represents a low risk

under category 7 of 45CFR46.110.

 This report is composed of the following chapters. Chapter 2 summarizes the

literature used to understand safety in toll roadways, toll plaza signage configuration, and

driving simulators. Chapter 3 includes the methodology used to develop the investigation

(including the experimental design and subject drivers), driving simulator description,

signage configurations, scenario- developing process, variables evaluated, and locator

references used to acquire data. Chapter 4 describes the results of the investigation,

analysis of the variables taken into consideration, and the discussion of results. Chapter

5 provides conclusions, recommendations, and acknowledgements. Lastly, references

and appendices are included at the end of the report.
Operational and Safety-Based Analyses of Varied Toll Lanes 15

 CHAPTER 2 LITERATURE REVIEW

 This chapter consists of a review of studies over the past years that are related to

safety in toll roadways, signage configuration at tolls, and the use of driving simulators in

transportation- related studies. Road safety in toll plazas has created a huge concern

among public and private transportation agencies due to the increase in road crashes.

One element that can be negatively affecting safety in toll roads is the lack of uniformity in

traffic control devices. Therefore, these sections were studied to understand how driving

simulation could be used to evaluate safety of signage configurations in toll plazas that

operate electronic toll collection systems in the Commonwealth of Puerto Rico.

 2.1 Safety in Tollway Facilities

 Fatal, injury, and property damage only (PDO) crashes are frequently associated

with lane changes and speed variations on highway facilities. Road users have

involuntarily modified driving behavior when approaching toll plazas as a consequence of

the evolution and implementation of new technologies. The increase of fatal and injury

crashes during highway operations has created safety awareness among different public

and private agencies that manage toll plazas. Although toll plaza operations are crucial

for highway facilities, design standards for toll systems that address the uniformity of traffic

control devices (TCD) and road safety have been under slow development. Benda et al.

(2009) stated that toll plaza operations and the accompanying TCDs used to facilitate

their operation have varied widely from agency to agency.

 Initially, cash payments were the only tolling method used in every toll road in the

United States and Puerto Rico. At this moment, all lanes in the station served the same

purpose. Later, automatic coin collectors were implemented in toll plazas to reduce time
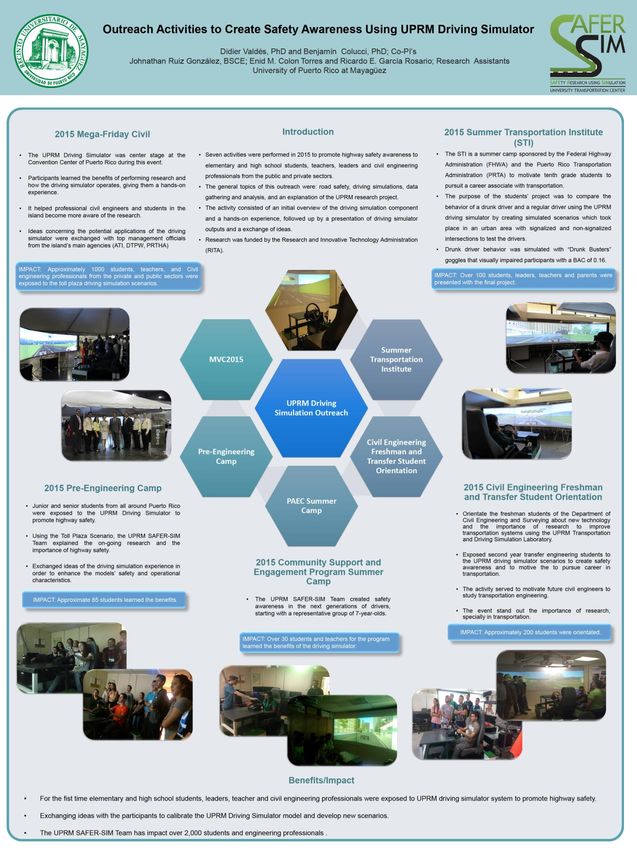
Operational and Safety-Based Analyses of Varied Toll Lanes 16

travel and enhance toll operation. Still, each driver had to completely stop their vehicle in

one of the lanes approaching the toll plaza to either insert the coins in the coin machine

or make the transaction with one of the toll workers. Although the automatic coin collector

achieved faster transaction time than the traditional payment method, long travel time and

heavy traffic congestion were still affecting toll road operations. The design and

construction of toll plazas drastically changed as a consequence of other emerging

technologies such as Electronic Toll Collection (ETC) and Open Road Tolling (ORT). ETC

is an efficient Intelligent Transportation Systems (ITS) application that has numerous

benefits such as lower transaction time, reduced air pollution and fuel consumption due to

the fact that drivers do not need to stop the car at the station (Coelho et al., 2005;

Venigalla and Krimmer, 2006). Likewise, ORT consists of high-speed ETC lanes that allow

drivers to automatically pay tolls in an electronic way without the need for a significant

speed reduction (Yang et al., 2013).

 However, these design modifications and other elements used to improve toll plaza

systems have altered drivers’ reaction-perception time. Yang et al. (2013) indicated that

adverse safety issues in barrier toll plazas were caused by the mix of different lanes with

alternative payment methods. For example, drivers in traditional toll plaza configurations

can generate acceleration-deceleration patterns and complex lane movements as a

consequence of the variety of lanes with alternative payment options that are available.

These issues are observed in Caguas Sur Toll Plaza, where the toll system operates both

ETC and cash-only lanes.

 Figure 2.1 illustrates how toll plazas in Puerto Rico have shifted from automatic

coin collection and cash-only lanes into a hybrid toll system that combines ETC and cash

lanes. Abuzwidah et al. (2014) reveal that toll plazas with varied tolling systems raise

the potential for hotspots and crashes as result of acceleration-deceleration patterns and
Operational and Safety-Based Analyses of Varied Toll Lanes 17

difficult merging scenarios of vehicles traveling at different speeds. These issues produce

conflict points prior to toll plazas that result in unexpected lane change movements and

fluctuations in drivers’ speeds. The increase in crashes that take place in toll road systems

has created the necessity for studying driving behavior when approaching toll plazas

(Abdelwahab et al., 2002; Mckinnon, 2013).

 Figure 2.1 Changes in Lane Configuration Usage and Toll Collection Payment in Caguas Sur Toll
 Plaza, Puerto Rico (a) Year 2004 and (b) Year 2015 (Source: Google Earth)
Operational and Safety-Based Analyses of Varied Toll Lanes 18

 2.2 Toll Plaza Signage Configuration

 Over the past decades, toll plaza systems were designed and constructed among

transportation agencies without the use of a guideline that maintained consistency and

uniformity in TCD’s messages, color, placement and dimensions (Schaufler, 1997).

Previous versions of the MUTCD did not include signage standards for toll plazas,

resulting in a vast diversity of signage configurations and placement among different

agencies who operate toll plazas in United States and Puerto Rico. In 2004, the Federal

Highway Administration (FHWA) started to study existing conditions in toll plazas and

developed a design standard that could facilitate toll plaza operations and improve road

safety (Brown et al., 2006). In the year 2009, Chapter 2F “Toll Road Signs” was

incorporated in the MUTCD to address signage requirements on toll roads where all lanes

were used for payment. According to the MUTCD, signage should be located in such a

manner that drivers can process the information illustrated in the sign and perform better

with changes that occur in the approximation of a toll plaza. One of the key elements

considered for signage location is the driver’s perception-reaction time. This expression is

defined as the time needed to detect, recognize, decide, and react to a situation. MUTCD

indicates that toll pay warning signs should be located at an approximated distance of 1

mile and ½ mile before approaching the toll plaza in an overhead structure (MUTCD,

2012). Incorporating warning signs at a distant location from the condition for which the

information is provided can cause drivers to forget the warning as a consequence of road-

related distractions. Though two revisions of the MUTCD 2009 have been published,

existing toll plazas still have signage configurations that do not fulfill the manual

requirements, affecting the safety of road users in toll roads (Dutta et al., 2014). Benda et

al. (2009) found that participants of their study considered that signage configurations

should be improved in ORT systems. Some of the suggestions given were better signs for

toll plaza fare, incorporation of arrows that indicate lane use, and additional
Operational and Safety-Based Analyses of Varied Toll Lanes 19

warning signs when approaching the toll plaza. Although vehicle speeds at toll plazas are

generally lower than other highway operations, they still cause a considerable number of

injuries and PDO crashes. However, these modifications in toll plaza designs affect the

reaction of drivers and, consequently, the safety of all road users, leaving space for

researchers to study and provide solutions.

 2.3 Driving Simulation

 Due to being an efficient and cost-effective instrument to address road safety in

several transportation studies, the demand for driving simulators has increased.

Simulators provide researchers the opportunity to investigate driving behavior on both

existing and future roadway conditions in a more secure manner, meaning that human

subjects can be exposed to potentially hazardous scenarios without physically harming

the participant.

 A wide variety of driving simulator styles are being used in transportation-related

studies to evaluate human factors on transportation facilities. The type of simulator varies

depending on different elements, such as: screen systems, adapted audio systems, and

simulation software that employs each of its elements to recreate the driving experience.

Non-motion simulation systems like desktop and cockpit simulators provide an adequate

and realistic experience of what happens in real-life situations. Desktop simulators consist

of a set of screens or monitors, a steering wheel, acceleration and brake pedals, a sound

system, and other features that are used for driving maneuvers. For example, Benda et

al. (2009) used a desktop driving simulator to evaluate the effectiveness of ORT under

different signage scenarios. On the other hand, cockpit simulators include features similar

to desktop simulators with the addition of a vehicular seat that is positioned along with

controls similar to those found in a real vehicle. However, the fidelity and comfort of the

simulation is restricted by the available budget and equipment compatibility. For example,
Operational and Safety-Based Analyses of Varied Toll Lanes 20

driving simulations with motion systems and real car body kits provide feedback far closer

to the effect of the real driving experience at a higher cost than non-motion simulations.

 Therefore, driving simulators can be used as efficient research instruments to

investigate safety issues in existing or future transportation facilities. Researchers have

used driving simulation to analyze driving behavior and skills, such as: driver distraction,

impairment, novice training, and fatigue, among other factors (Varkaki et al., 2014; Oron

et al., 2014). In addition, simulation has been of great value for evaluating the

effectiveness of road design, Variable Message Signs (VMS), crash cushions, and other

emerging TCD (Watson et al., 2006; Fitzpatrick et al., 2013; Jeihani et al., 2014). Driving

simulation has also been used to address human factor issues, making it an effective tool

not only for transportation but other disciplines, such as: psychology, medicine, and

computer science (Fisher et al., 2011). However, this technology has not been used to

evaluate driving behavior in toll plaza systems with multiple lanes and alternative tolling

methods. This provides an opportunity for researchers to develop studies that involve

signage configuration on toll roads with lanes that serve different purposes.
Operational and Safety-Based Analyses of Varied Toll Lanes 21

 CHAPTER 3 METHODOLOGY

 This chapter presents the methodology followed to accomplish the objectives of

this research project. The experimental design, subject drivers, participant selection

criteria, study protocol, instrument for data collection, scenarios, and configuration

descriptions are presented in the different sections of this chapter.

 3.1 Methodology Description

 The methodology followed in this research project is illustrated in Figure 3.1 and

described below. First, a literature review was conducted, focusing on three major

aspects, namely toll plaza signage configurations, safety in tollway facilities and driving

simulations. Second, the Latin Square experimental design, which consisted of 20

subjects divided into two groups, was selected for this research. Third, representing

scenarios of the Caguas Sur Toll Plaza were developed using AutoCAD Civil 3D, Blender

2.49b, Google Sketch-Up and Sim Creator. Fourth, subjects had to satisfy certain criteria

in order to be eligible as a participant for this study. Fifth, data collection and analysis was

performed after all participants completed the designated scenarios. Sixth, an integrated

analysis was conducted using the F-Test and ANOVA with Tukey comparison test for the

three variables under evaluation. Lastly, results and conclusions were made.
Operational and Safety-Based Analyses of Varied Toll Lanes 22

Figure 3.1 UPRM Research Methodology
Operational and Safety-Based Analyses of Varied Toll Lanes 23

 3.2 Experimental Design

 Ten of the subjects drove 12 scenarios with the current roadside signage

configuration, and the other 10 subjects drove 12 scenarios with a proposed overhead

signage configuration. Within each group of participants, a Latin Square was used to

counterbalance the order of the 12 scenarios. This design ensured that the order in which

the participants were exposed to the 12 simulation scenarios was counterbalanced across

participants. Therefore, results obtained for each of the scenarios were not dependent on

the order in which the participants saw the scenarios. As noted above, twelve different

scenarios were created for each of the two configurations. The scenarios were the same

between the two signage configurations, making signs the only aspect that varied between

them. The twelve scenarios are presented Table 3.1.
Operational and Safety-Based Analyses of Varied Toll Lanes 24

 Table 3.1 Scenarios Description.

 Traffica Start Lane Toll Lane Environment
Scenario
 1 2 3 4 Left Right E-ZPass Cash Day Night

 1 ✓ ✓ ✓ ✓

 2 ✓ ✓ ✓ ✓

 3 ✓ ✓ ✓ ✓

 4 ✓ ✓ ✓ ✓

 5 ✓ ✓ ✓ ✓

 6 ✓ ✓ ✓ ✓

 7 ✓ ✓ ✓ ✓

 8 ✓ ✓ ✓ ✓

 9 ✓ ✓ ✓ ✓

 10 ✓ ✓ ✓ ✓

 11 ✓ ✓ ✓ ✓

 12 ✓ ✓ ✓ ✓

 3.3 Subject Drivers

 A total of 9 female and 11 male subjects were used in this research. The age

 distribution amongst all participants was the following: 8 subjects from 18 to 25 years old,

 7 subjects from 26 to 55 years old and 5 subjects from 56 to 70 years old. All subjects had

 to meet the following criteria:

 Have a driver’s license
Operational and Safety-Based Analyses of Varied Toll Lanes 25

 Be in good health and free from any condition that could be aggravated by the

simulation

 Be between 18 and 70 years of age.

 The mean age for the population used in the research was 34 years old. Figure

3.2 presents the subjects’ distribution by age.

 Age Distribution Amongst Participants
 10

 8

 6
 Subjects

 4

 2

 0
 18-25 26-55 56-70
 Age Intervals

 Figure 3.2 Subjects' Age Distribution Amongst Participants

 3.4 Study Protocol

 The risks involved in using the driving simulator were explained to participants as

soon as they arrived at the study area. They were given the Informed Consent Form along

with a detailed explanation of the study and the questionnaire form. Research assistants

were available for answering any question that the participants had. Those subjects that

did not sign the Informed Consent Form were excluded from the study. On the other hand,

those subjects that signed the form started the simulation study only if they met the

participation requirements.
Operational and Safety-Based Analyses of Varied Toll Lanes 26

 When the subjects sat at the simulators, each of the components they would be

using was explained to them. In addition, it was emphasized that driving in this equipment

would feel different from the one they use to drive on a daily basis. Before running the

research simulation, subjects ran a generic simulation until they felt comfortable driving

the simulation. At that point the researchers answered any questions the subjects had.

However, research assistants had to make it clear that no questions were to be answered

during the run of each scenario related to the investigation. Before beginning the

experiments, each subject was told what they would find in the simulation along with other

brief instructions. It was also explained to them that they would drive through a toll road

and he/she would interact with the toll lanes of E-ZPass, Every Traffic E-ZPass, and cash

lanes. In addition, subjects were not allowed to listen to music at any time during the study.

The researcher did not talk to the subject during any scenario simulations. At the beginning

of each scenario, the researcher told the subject which lane he/she would pass through at

the toll plaza depending on the scenario the subject was running (as shown in Table 3.2).

 Table 3.2 Toll Plaza Final Destination Depending on the Scenario

 Scenario Lane in Toll Plaza

 1-4 E-ZPass

 5-8 Cash lane

 9-12 E-ZPass
Operational and Safety-Based Analyses of Varied Toll Lanes 27

 3.5 Runtime Setup Instruction

 The information provided in the simulation, before clicking “Run Simulation”, is an

essential part when analyzing the data. For this reason, the values placed in each space

were standardized. The “Experiment Name” space has to be in position “1” when using

Configuration 1 scenarios and “2” for Configuration 2 scenarios. The “Participant ID” space

is for the subject’s number, which was assigned to the subject when he or she filled out

the questionnaire form. The “Drive ID” space is for the scenario number that the subject

is running. An example of this is shown in Figure 3.3.

 Figure 3.3 Realtime Sim Creator® Runtime Set-Up Screen

 3.6 Configurations

 There are two configurations; Configuration 1 represents the current roadside

signage location for the toll road of Caguas Sur, Puerto Rico, and Configuration 2

represents the proposed overhead sign location for the toll road of Caguas Sur, Puerto

Rico. The distributions of subjects in the configurations depends on the distribution

presented in Table 3.3, which depends on gender and age.
Operational and Safety-Based Analyses of Varied Toll Lanes 28

 Table 3.3 Subject Distribution by Configuration, Gender and Age

 Quantity for Quantity for
 Age Group Gender Subjects
 Configuration 1 Configuration 2

 Female 2 2 4
 18-26 Male 2 2 4

 Female 2 2 4
 27-55 Male 2 2 4

 Female 2 2 4
 56-70 Male 2 2 4

 Total: 24

 The following table details the order in which the researcher ran the scenarios;

for example: If the first subject is a 59-year-old male, the subject would be 1, Gender

M, and age 59. The first scenario number would be 2, followed by scenario 3, then

scenario 1, and so on from left to right until the subject driver reached the last scenario in that

row (in this case, scenario 12). The researcher followed the order assigned under

Scenario for each subject. If for some reason the subject could not continue the scenarios

evaluated, the scenario(s) are marked in red to identify which one(s) was not completed.

The information for Configuration 1 is presented in Table 3.4 and for Configuration 2 in

Table 3.5.
Operational and Safety-Based Analyses of Varied Toll Lanes 29

 Table 3.4 Configuration 1 Subject Drivers Sequence

 Configuration 1
Subject Gender Age Scenario
 1 M 59 2 3 1 5 8 10 6 7 11 9 4 12
 5 M 66 6 7 8 10 11 9 4 12 1 3 2 5
 8 F 19 4 9 11 12 1 2 3 5 6 7 8 10
 10 F 57 10 11 2 1 5 6 8 3 4 12 7 9
 12 M 26 5 12 3 4 10 7 9 11 8 1 6 2
 14 F 31 9 6 7 8 12 4 1 2 10 5 3 11
 16 M 22 11 1 4 9 2 3 5 8 12 6 10 7
 20 F 26 7 10 5 2 9 1 12 6 3 4 11 8
 21 M 29 3 8 12 6 4 11 7 10 9 2 5 1
 24 F 22 12 4 10 3 7 5 11 1 2 8 9 6
 25 M 22 1 5 6 11 3 8 2 9 7 10 12 4

 8 2 9 7 6 12 10 4 5 11 1 3
Operational and Safety-Based Analyses of Varied Toll Lanes 30

 Table 3.5 Configuration 2 Subject Drivers Sequence

 Configuration 2
Subject Gender Age Scenario
 2 M 70 2 10 4 1 8 12 5 11 3 6 7 9
 3 F 21 12 3 6 8 2 9 7 4 5 10 11 1
 6 M 52 5 7 9 11 6 1 10 3 4 2 8 12
 11 F 57 8 9 10 12 11 4 2 6 1 7 5 3
 13 M 56 3 5 7 2 1 8 9 10 12 11 4 6
 15 M 23 6 11 1 4 5 7 3 12 9 8 10 2
 17 M 40 1 4 2 3 10 6 8 9 11 5 12 7
 18 F 20 10 12 11 9 7 3 4 5 6 1 2 8
 19 F 36 7 6 8 5 12 11 1 2 10 3 9 4
 22 F 26 9 2 12 6 3 5 11 7 8 4 1 10
 23 M 21 11 8 3 10 4 2 12 1 7 9 6 5

 4 1 5 7 9 10 6 8 2 12 3 11

Note: Subject that did not finish the scenarios is marked in red

 3.7 Running the simulation

 When the simulation was initiated, the scenarios were run in the order presented

in the previous section. Each scenario took approximately five minutes to complete. To

ensure the wellness of the subject, between each scenario the researcher asked the

subject if he or she was fine and wished to continue on to the next scenario. While the

subjects ran the scenario, the researcher took notes regarding the behavior of the driver

in order to gather more information to improve future research and make a deep analysis

of the subject’s behavior.

 While running the simulation, the subject’s behaviors changed per scenario. For

example, it was found that most of the subjects shifted between one hand and two hands
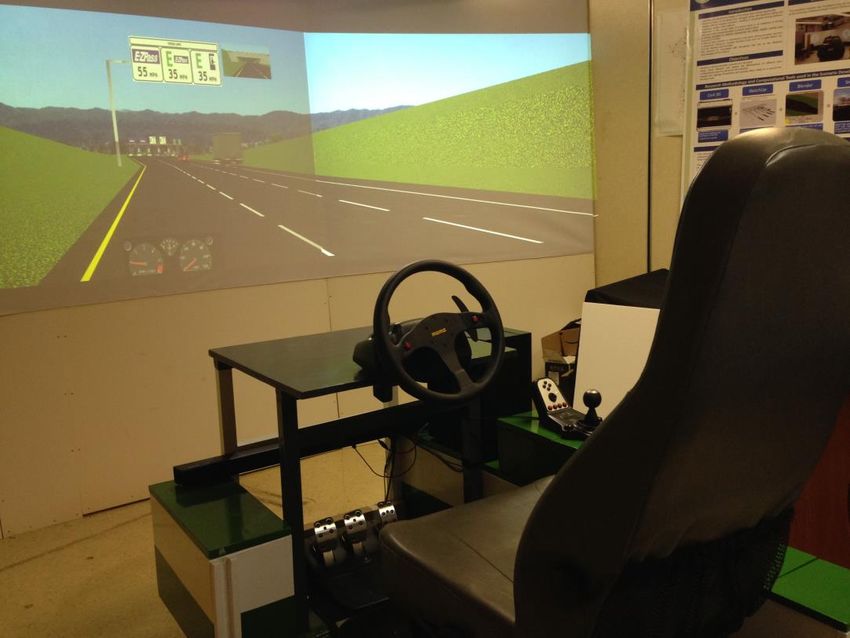
Operational and Safety-Based Analyses of Varied Toll Lanes 31

when changing scenarios. It was also observed that most of the drivers used the lane-

changing signal, something that is not usually seen on the roads. Also it was found that

some of the drivers were driving slower at some points because they could read what was

written on the sign.

 3.8 Driving Simulator

 The UPRM driving simulator system used in the experiments is a desktop simulator

configured as a cockpit simulator with three primary components: the vehicle, the

projection and screens, and the computer hardware and software (illustrated in Figure

3.4). The vehicle consists of a car seat placed in a wood frame with six wheels attached

to make it versatile for mobile applications (see Figure 3.5). A steering wheel with turn-

signal controls is installed in front of the car seat, which rests on a wooden countertop

that serves as a dashboard for the simulator. The gear shifter is located on the right-hand

side of the car seat, whereas the brake and accelerator pedals are fixed to the wooden

floor. In terms of projection and screens, the simulator has three overhead projectors, each

with their respective screen, which gives the subject a perspective visibility of 120° of the

roadway. The audio from the simulation comes through a sound bar system, which is also

located within the simulator’s wooden frame. In terms of hardware and software, the

simulator has desktop and laptop computers with Nvidia graphics and Realtime

Technologies Inc. (RTI) SimCreator/SimVista simulation software.
Operational and Safety-Based Analyses of Varied Toll Lanes 32

Figure 3.4 . UPRM Driving Simulator Stationary Version

 Figure 3.5 UPRM Mobile Driving Simulator Version
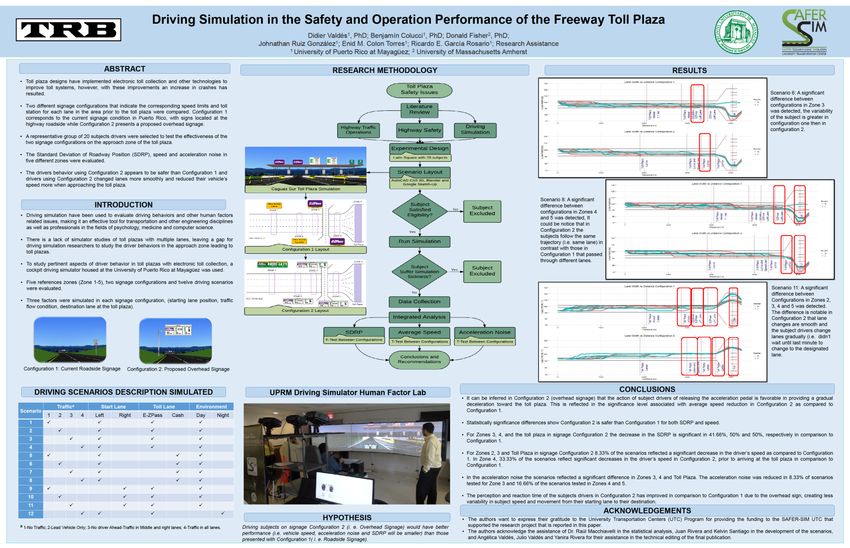
Operational and Safety-Based Analyses of Varied Toll Lanes 33

 3.9 Scenario Development Process

 For this study, toll plaza scenarios were developed because the driving simulation

software provided by RTI did not have an integrated toll plaza scenario. To develop the

scenarios, four commercial programs were used: AutoCAD Civil 3D, Google SketchUp,

Blender 2.49b, and Internet Scene Assembler (ISA). Research was performed in two

phases. The initial phase was conducted at UMass Amherst where the initial scenarios

were developed, and the second phase was conducted at the University of Puerto Rico in

Mayaguez and consisted of fine-tuning the scenarios and conducting the experiments

in the driving simulator.

 The first phase essentially consisted of three primary tasks described below. The

first task consisted of designing the toll plaza structure and the toll roadway. The roadway

was created by modeling a corridor in AutoCAD Civil 3D and exporting the surface of the

model as a .dxf file. Pavement markings were also created in AutoCAD and exported as

a .dxf file. The toll plaza structure, illustrated in Figure 3.7, was created using Google

SketchUp and was then exported as a 3D model.

 Figure 3.6 Caguas Sur Toll Plaza Simulated Model Illustration
Operational and Safety-Based Analyses of Varied Toll Lanes 34

 In the second task, all the newly designed files were imported into Blender 2.49b.

Blender was used because this software has the capability of exporting .vrml files, which

is the file extension used by the simulator software employed in this experiment. In

Blender, materials and textures were created so as to add color and other visual features

to the roadway and the toll plaza. The created materials included the grass on the

roadside, concrete for the traffic barriers, and the pavement’s asphalt texture. The objects

were then exported as .vrml files.

 The third task consisted of importing the new .vrml files into the ISA software

library. The designed objects contained within the new files were added to the objects

within the simulation software library. The simulation scenarios were completed using

these objects and the signs that were taken from the pre-existing files.

 Figure 3.7 Configuration 1 Current Roadside Signage

 Figure 3.8 Configuration 2 Proposed Overhead Signage

 Figure 3.7 resembles the current signage condition, while Figure 3.8 resembles the

proposed signage configuration. Both figures illustrate a perspective view of the two

signage configurations that were used for the research.
Operational and Safety-Based Analyses of Varied Toll Lanes 35

 3.10 Configuration Signs Description

 Two signage configurations, roadside and overhead, were simulated.

Configuration 1 consists of a set of 14 signs located at the freeway’s roadside. Three of

these signs indicate the distance with respect to the toll plaza, two indicate the location of

the E-ZPass station, and the remaining nine indicate the posted speed limit for the

freeway segment. In regards to driver information workload, nine of the 14 signs are

located within the last ½ mile (805 meters) of the toll plaza.

 Configuration 2 consists of 14 signs located both at the roadside and over the

freeway. Nine out of the 14 signs are located on the side of the freeway. Out of these nine

signs, three indicate the distance from the toll plaza, one indicates the location of the E-

ZPass station, the next two indicate the locations of the Every Traffic Station and the Cash

Lane Station, and the last three indicate the speed limit of the segment. The remaining

five signs are located in overhead form. Two of these indicate the position of the E-ZPass,

Every Traffic or Cash Lane Stations, and the other three indicate the position of the station

and the speed limit for each lane. An additional three of the 14 signs came in the last ½

mile (805 meters) from the toll plaza. All the signs' dimensions and colors follow the

requirement of the last revision of the MUTCD.

 3.11 Independent Variables

 Three independent variables were controlled in each configuration, specifically: the

starting lane position, traffic flow condition, and destination lane at the toll plaza. Two

starting lane positions are evaluated: left lane and right lane. Four different traffic flow

conditions are evaluated: no traffic, only one lead vehicle in front of the test vehicle, no

traffic in the left lane and traffic mix in the middle and right lanes, and traffic in all lanes.

The two possible destination lanes at the toll plaza are passing through the E-Z Pass lane

or passing through the cash lane.
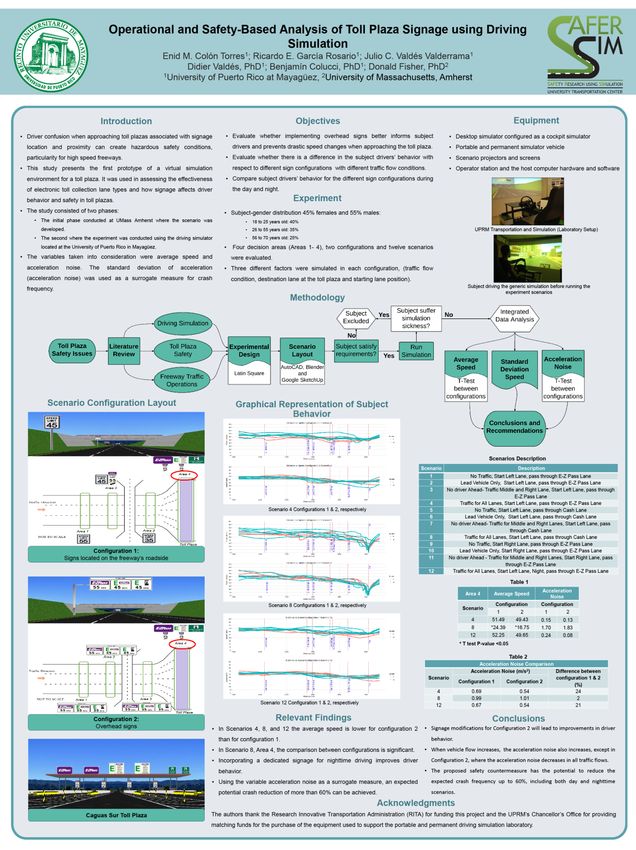
Operational and Safety-Based Analyses of Varied Toll Lanes 36

 3.12 Variables Evaluated

 Three dependent variables were evaluated in the experiment, namely, Standard

Deviation of Roadway Position (SDRP), average speed, and acceleration noise. SDRP is

defined herein as the standard deviation of the average position of the subject drivers in

the roadway for each zone. The average value of SDRP and speed were calculated for

each subject in each zone of interest. The standard deviation of the acceleration, which

has been used as a surrogate measure for crash frequency and a potential indicator of

traffic flow quality that can be experienced by individual drivers, was calculated and

denominated acceleration noise.

 3.13 Locator References

 Five locator references were used for the dependent variable, SDRP. The five

locator references are illustrated in Figure 3.9 and described below. The first locator

reference corresponds to the Toll Plaza distance located at 1.0 miles (1609 meters) from

the toll plaza. For Configuration 1, the driver is informed that a toll plaza is one mile ahead.

In Configuration 2, the driver is informed that the toll plaza is one mile ahead with the

addition of the location of the toll stations. The second locator reference corresponds to

the Toll Plaza distance sign. Configuration 1 advises the driver that there is a toll plaza in

0.5 miles (805 meters), while in Configuration 2, the driver is shown the toll station located

in each lane and its corresponding speed limit. The third and fourth locator references in

Configuration 1 indicate to the driver that the E-ZPass lanes are located at the left, while

in these same zones in Configuration 2 the signs show the driver the toll stations located

in each lane and the speed limit. The fifth locator reference is the Toll Plaza, which is the

same for both configurations.

 The rationale of the five zones delimited to perform the simulation was to evaluate

how adequate the time allotted was for the location of each sign for the expected response
Operational and Safety-Based Analyses of Varied Toll Lanes 37

of the subject drivers for a high- speed freeway segment approaching a toll plaza. For

example, in the first two zones of Configuration 1, advance warning signs were located on

the roadside to illustrate what to expect ahead and the corresponding distance (i.e., Toll

Plaza 1 mile, Toll Plaza ½ mile). In these two zones, it was expected that the subject

drivers be informed of the relative distance to the toll plaza. In zones 3 and 4, where

E-ZPass signs were used to identify the electronic toll collection (ETC) lanes, it was

expected that the subject drivers perform two tasks: reduce speed and change to the

corresponding lane (ETC or Cash Lane). The Data Collection Area of each Locator

Reference for the SDRP variable are specified in Figure 3.9
Operational and Safety-Based Analyses of Varied Toll Lanes 38

(a)

(b)

 Figure 3.9 Locator References for the SDRP Variables

 (a) Configuration 1 Current Roadside Signage

 (b) Configuration 2 Proposed Overhead Signage
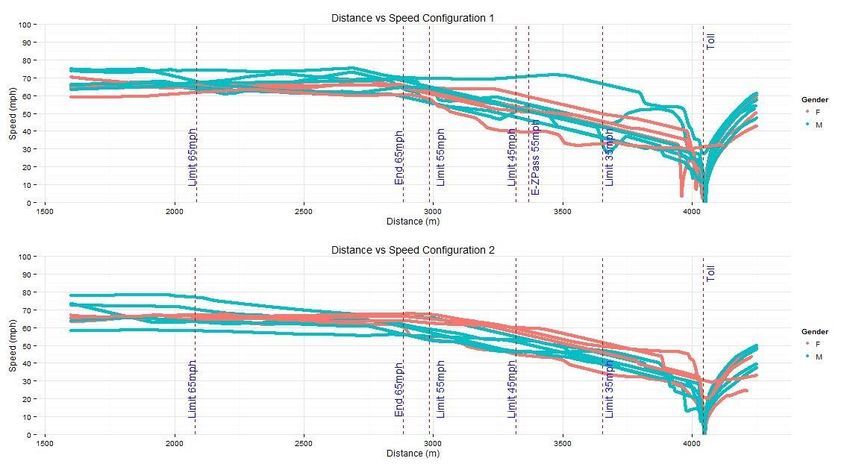
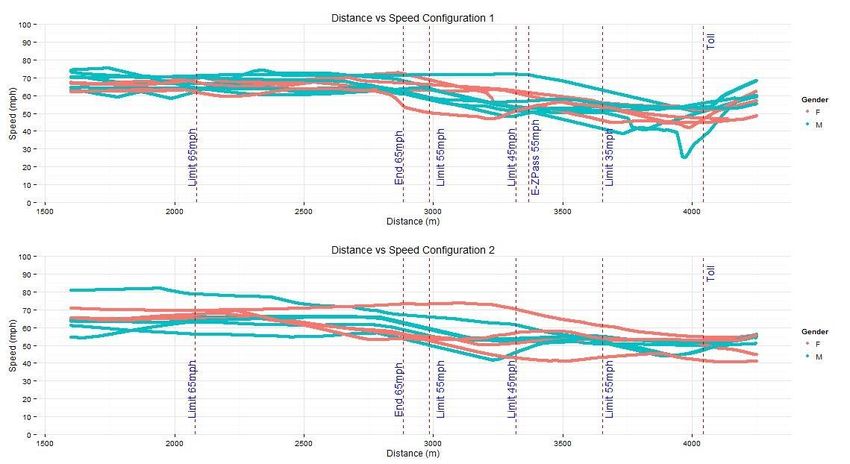
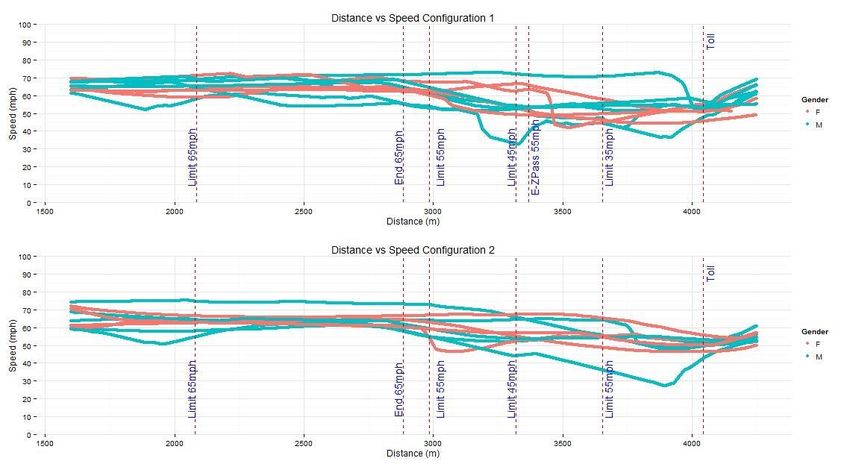
Operational and Safety-Based Analyses of Varied Toll Lanes 39

 Table 3.6 Data Collection Area for SDRP Variables.

 Locator Reference Data Collection Area
 (meters)
 Toll Plaza 1 Mile Ahead 496.8
 Toll Plaza ½ Mile Ahead 334.4
 E-ZPass Left Lane 280.4
 E-ZPass Left Lane 198.1
 Toll Plaza 246

 Four locator references were used for the dependent variables average speed

and acceleration noise. These locator references are illustrated in Figure 3.10 and

described below. The first locator reference corresponds to the 55 mph speed limit

regulatory sign. This sign is the first indication to the driver to reduce from the base speed

of 65 mph to 55 mph due to the approach to the toll plaza. The second locator reference

corresponds to the speed limit regulatory sign of 45 mph for the toll plaza cash lanes and

the 55 mph regulatory sign for the “E-Z Pass lanes”. The 45 mph regulatory sign was

placed in order to indicate a decrease of speed to the vehicles traveling toward the cash

lanes in the toll plaza, as opposed to those heading towards the “E-Z Pass lanes”, which

maintained the aforementioned speed restrictions. The third locator reference

corresponds to the speed limit regulatory sign of 35 mph for vehicles traveling toward the

cash lanes and 55 mph regulatory sign for vehicles traveling towards the “E-Z Pass lanes”.
You can also read