U ah Ph ician Workforce, 2020 - The Utah Medical Education Council - Utah Medical Education ...
←
→
Page content transcription
If your browser does not render page correctly, please read the page content below

U ah Ph ician
Workforce, 2020
The Utah Medical Education Council
UTAH'S PHYSICIAN WORKFORCE, 2020

 The Utah Medical Education Council

            State of Utah

          www.umec.utah.gov

             Prepared by:
       Jared Staheli, MPPc, MPHc
       Clark Ruttinger, MPA, MBA

                   i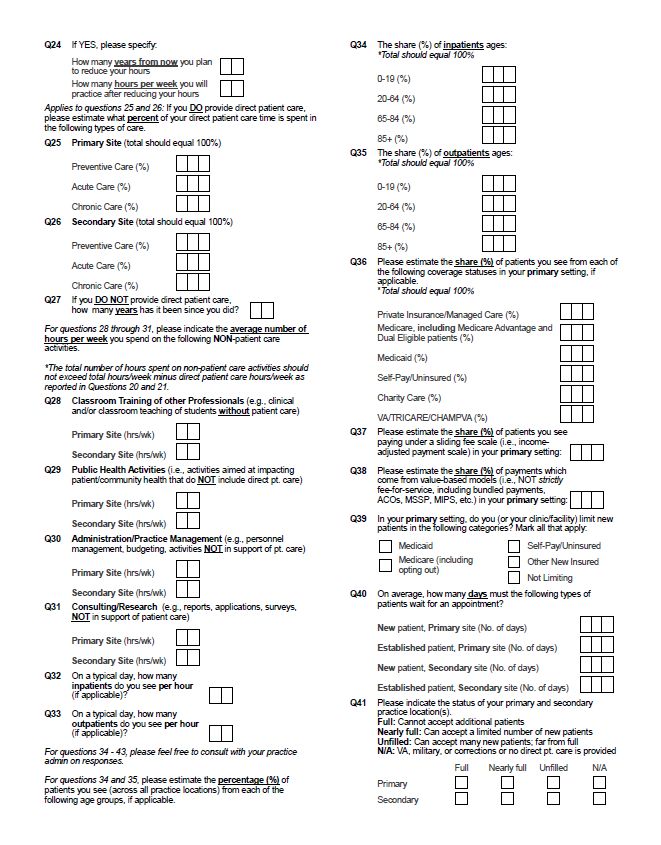
Utah's Physician Workforce, 2020

© Copyright 2020 by the Utah Medical Education Council
All Rights Reserved
Printed in the United States of America

This publication cannot be reproduced or distributed without permission. Please contact the UMEC at
(801) 526-4554 or juolson@utah.gov for permission to do so. This report and all others by the UMEC can
be viewed at umec.utah.gov.

Suggested Citation:
Utah Medical Education Council (2020). Utah's Physician Workforce, 2020. Salt Lake City, UT.

                                                   ii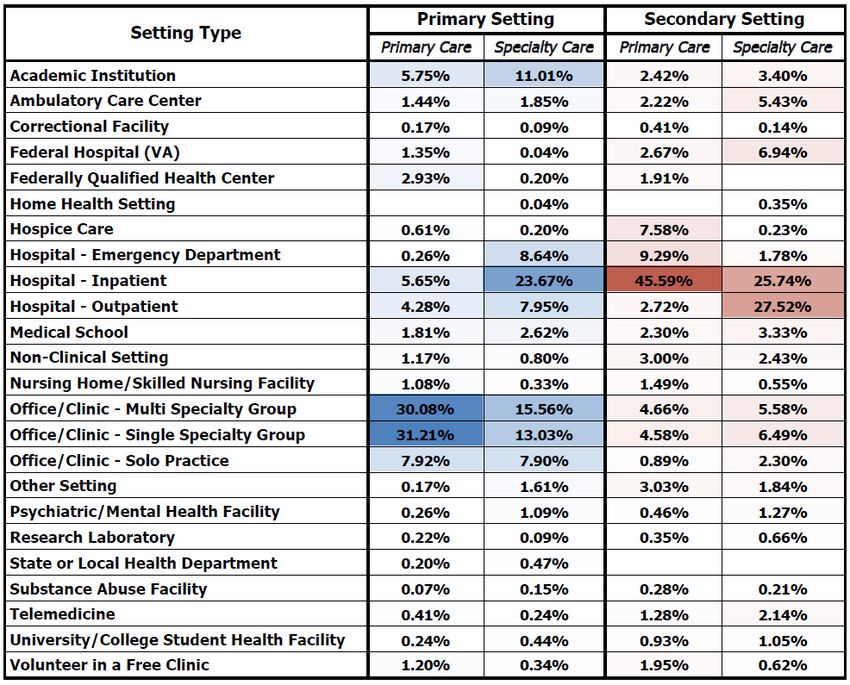
THE UTAH MEDICAL EDUCATION COUNCIL

The Utah Medical Education Council (UMEC) was created in 1997 to secure and stabilize the state's
supply of health care clinicians. The enabling legislation authorized the UMEC to conduct healthcare
workforce research, advise on Utah's healthcare training needs, and influence graduate medical education
financing policies. In addition, UMEC facilitates the training of healthcare professionals in rural areas of
the state. The state legislature expanded UMEC's research responsibilities in 2013 to include nursing and
UMEC has accepted the designation as the Nursing Workforce Information Center. The UMEC is presided
over by an eight-member board appointed by the Governor to bridge the gap between the health care
workforce industry and educational interests. Members of the UMEC include:

 Wayne Samuelson, MD (Chair)                                C. Gregory Elliott, MD

 Vice Dean, School of Medicine                              Intermountain Healthcare
 University of Utah

 John Berneike, MD                                          Douglas D. Gray, MD

 Director, Family Practice Residency Program                School of Medicine
 Utah Health Care Institute                                 University of Utah

 Amy Khan, MD                                               Mary Williams, RN, Ph.D.

 Executive Medical Director                                 Public Member
 Regence BlueCross BlueShield of Utah

 Sue Wilkey, DNP, RN                                        Gar Elison

 Public Member                                              Public Member

                                                      iii
ACKNOWLEDGEMENTS

This study of Utah's physician workforce is based on a survey disseminated in 2019 by the Utah Medical
Education Council (UMEC) with assistance from the Utah Division of Occupational and Professional
Licensing (DOPL).

The UMEC would like to thank its staff for their assistance and the following members of the physician
workforce advisory committee, also known as the Physician Implementation Advisory Committee (PIAC)
for their time and expertise in developing this report:

 Marc E. Babitz, MD                                   Timothy W. Farrell, MD

 Deputy Director                                      Associate Professor of Medicine
 Utah Department of Health                            University of Utah School of Medicine

 David J. Park, DO                                    Brad Poss, MD

 Vice President and Dean of the Southern Utah         Associate Dean for Graduate Medical Education
 Campus                                               University of Utah Health
 Rocky Vista University

 Michael J. Farrell IV, DO, MBA                       Sri Koduri, BTech, MS, MPA

 Assistant Clinical Professor Medicine                Director, Strategy and Workforce Planning
 University of Utah Hospitals and Clinics             University of Utah Health
                                                      Graduate Medical Education (GME) Strategic
                                                      Initiatives

                                                      iv
ADDITIONAL RESOURCES

HEALTHCARE WORKFORCE REPORTS
Since its establishment, the UMEC has completed multiple reports on Utah's healthcare workforce,
including:

        Advanced Practice Nurses
        Dentists
        Genetic Counselors
        Medical Technologists
        Mental Health Professionals
        Occupational Therapists
        Pharmacists
        Podiatrists
        Physical Therapists
        Physicians
        Physician Assistants
        Radiology Technologists
        Registered Nurses

For access to any of these reports, please visit umec.utah.gov.

PHYSICIAN JOB OPPORTUNITIES IN UTAH
The UMEC conducts annual job fairs for Physicians and Advanced Practitioners (PAs, APRNs including
CNAs, CNMs, CRNAs, and NPs) attending training programs and/or practicing in Utah. These job fairs
are free of cost for attendees and are geared towards promoting retention of Utah trained workforce in
Utah. Major health care employers in Utah are invited to recruit at the fairs. As a part of its rural
workforce initiative, the UMEC encourages rural and frontier hospitals, clinics, and practices to take part
in these job fairs by discounting their participation fees.

The UMEC also hosts a listing of Utah physician jobs by specialty at umec.utah.gov/umec-job-board.

                                                       v
CONTENTS

The Utah Medical Education Council .................................................................................. iii

Acknowledgements ............................................................................................................. iv

Additional Resources ........................................................................................................... v

   Healthcare Workforce Reports....................................................................................................................... v

   Physician Job Opportunities in Utah ............................................................................................................. v

List of Figures .................................................................................................................... viii

List of Tables ........................................................................................................................ x

Executive Summary ...............................................................................................................1

Policy Recommendations ..................................................................................................... 3

Physician Characteristics ..................................................................................................... 5

   Supply and Distribution ................................................................................................................................. 5

       Aggregate Supply ........................................................................................................................................ 5

       Out-of-State Physicians .............................................................................................................................. 6

       Full-Time Equivalents ................................................................................................................................8

       Specialty Distribution ............................................................................................................................... 10

       Geographic Distribution .......................................................................................................................... 13

   Demographics ............................................................................................................................................... 17

       Age ............................................................................................................................................................. 17

       Race and Ethnicity.................................................................................................................................... 18

       Gender ...................................................................................................................................................... 20

   Financial Data ............................................................................................................................................... 22

       Income....................................................................................................................................................... 22

       Debt ...........................................................................................................................................................24

   Career Satisfaction and Burnout ..................................................................................................................26

       Career Satisfaction ...................................................................................................................................26

       Recommendations on Pursuing Medicine as a Career ........................................................................... 27

       Burnout .................................................................................................................................................... 30

   Utah Ties: Medical Education and Upbringing ........................................................................................... 31

                                                                                   vi
Practice Characteristics...................................................................................................... 33

   Practice Setting ............................................................................................................................................. 33

   Work Hours ...................................................................................................................................................38

   Practice Status .............................................................................................................................................. 40

   Patient Wait Times ........................................................................................................................................ 43

   Technology Utilization ..................................................................................................................................44

Projections ......................................................................................................................... 46

   Physician-to-Population Ratio Projections .................................................................................................46

   UMEC Supply and Demand Projections ......................................................................................................49

       Projected Demand for Physicians ............................................................................................................ 51

       Projected Supply of Physicians ................................................................................................................ 52

       Impact of Advanced Practice Providers .................................................................................................. 53

   Utah Hot Spots .............................................................................................................................................. 54

Conclusion ......................................................................................................................... 55

Specialty Profiles ................................................................................................................ 57

   Guide .............................................................................................................................................................. 57

   Specialty Profiles Table of Contents............................................................................................................. 59

   Primary Care ................................................................................................................................................. 61

   Specialty Care ................................................................................................................................................69

Appendices ........................................................................................................................ 145

   Previous UMEC Projection Models ............................................................................................................ 145

   Methodology ................................................................................................................................................ 146

       Data Collection ....................................................................................................................................... 146

       Data Verification ..................................................................................................................................... 146

       Survey Instrument .................................................................................................................................. 148

   Individual Item Response Rates ................................................................................................................ 155

References ......................................................................................................................... 157

                                                                                  vii
LIST OF FIGURES

Figure 1: Utah-licensed Physician Status ......................................................................................................... 5

Figure 2: Physician Practice Status                       5-Year Change .................................................................................... 6

Figure 3: Reasons for Maintaining Utah Licensure ........................................................................................ 7

Figure 4: FTEs              5-Year Change ..................................................................................................................... 9

Figure 5: Average FTEs per Physician                          5-Year Change ................................................................................. 9

Figure 6: Specialty Distribution ..................................................................................................................... 10

Figure 7: Specialty Distribution                     DOs ......................................................................................................... 10

Figure 8: Age Distribution of Utah Physicians (2010-2020) ....................................................................... 17

Figure 9: Racial/Ethnic Makeup of Physician Workforce ............................................................................ 18

Figure 10: Minority Status by Age Cohort ..................................................................................................... 18

Figure 11: Workforce Diversity (1998-2020)................................................................................................. 19

Figure 12: Representation Factor ................................................................................................................... 19

Figure 13: Gender (Overall) ........................................................................................................................... 20

Figure 14: Gender (Age Groups) ................................................................................................................... 20

Figure 15: Growth in Female Share of Utah Workforce ............................................................................... 21

Figure 16: Gender                Utah vs. U.S. ................................................................................................................. 21

Figure 17: Physician Income Distribution ..................................................................................................... 23

Figure 18: Divergence in Income Growth ...................................................................................................... 23

Figure 19: Inflation-Adjusted Debt at Graduation, by Years Since Graduation Cohort ............................. 25

Figure 20: Current Debt, by Years Since Graduation Cohort ...................................................................... 25

Figure 21: Inflation-Adjusted Debt at Graduation                                 Primary Care vs. Specialist ...................................... 25

Figure 22: Current Debt                   Primary Care vs. Specialist ................................................................................26

Figure 23: Career Satisfaction ........................................................................................................................26

Figure 24: Recommendation of Medical Career ...........................................................................................28

Figure 25: Reasons for Not Recommending Medicine .................................................................................29

Figure 26: Contributions to Feelings of Burnout .......................................................................................... 31

Figure 27: Number and Type of Utah Ties .................................................................................................... 32

Figure 28: Number of Utah Ties Since 2010 ................................................................................................. 32

                                                                              viii
Figure 29: Reasons for Setting Move ............................................................................................................. 37

Figure 30: Average Hours Worked by Age Group ........................................................................................38

Figure 31: Average Hours Worked in Non-Patient Care Activities .............................................................. 39

Figure 32: Hours Spent in Non-Patient Care Activities................................................................................ 39

Figure 33: Practice Status 2003-2020 .......................................................................................................... 40

Figure 34: Technology Use                  Change Since 2015 ........................................................................................ 45

Figure 35: Technology Use                  Current and Future Use ................................................................................ 45

Figure 36: Physician-to-Population Ratio Projections ................................................................................. 47

Figure 37: Primary Care Physician-to-Population Ratio Projections ......................................................... 48

Figure 38: UMEC Projection Model, 2020 ...................................................................................................50

Figure 39: UMEC Projection Model, 2015 .................................................................................................. 145

Figure 40: UMEC Projection Model, 2010 .................................................................................................. 145

                                                                         ix
LIST OF TABLES
Table 1: Ratings on Importance of Various Factors for Working Outside of Utah ........................................ 7
Table 2: FTEs .....................................................................................................................................................8
Table 3: Detailed Specialty Distribution .........................................................................................................11
Table 4: County Classification as Urban or Rural .......................................................................................... 16
Table 5: Rural/Urban Divide Primary Care vs. Specialists ....................................................................... 16
Table 6: Rural/Urban Divide Age ............................................................................................................... 16
Table 7: Physician Income .............................................................................................................................. 22
Table 8: Physician Debt...................................................................................................................................24
Table 9: Satisfaction in Top 7 Settings, Past 12 Months ................................................................................ 27
Table 10: Recommendation of Medical Career, by Top 7 Settings ...............................................................28
Table 11: Burnout by Top 7 Settings .............................................................................................................. 30
Table 12: Workforce Setting Distribution by Care Type ............................................................................... 33
Table 13: Workforce Setting Distribution by Care Type Combined Settings ........................................... 34
Table 14: Workforce Setting Distribution by Location.................................................................................. 35
Table 15: Workforce Setting Distribution by Care Type and Location Share of FTEs ............................ 36
Table 16: Practice Status Primary Care and General Surgery .................................................................. 41
Table 17: Practice Status Urban/Rural....................................................................................................... 41
Table 18: Share of Practices Limiting New Patients ......................................................................................42
Table 19: Patient Wait Times .......................................................................................................................... 43
Table 20: Technology Use Change Since 2015 by Care Type and Location .............................................44
Table 21: CDC Visit Rates by Age Group ........................................................................................................ 52
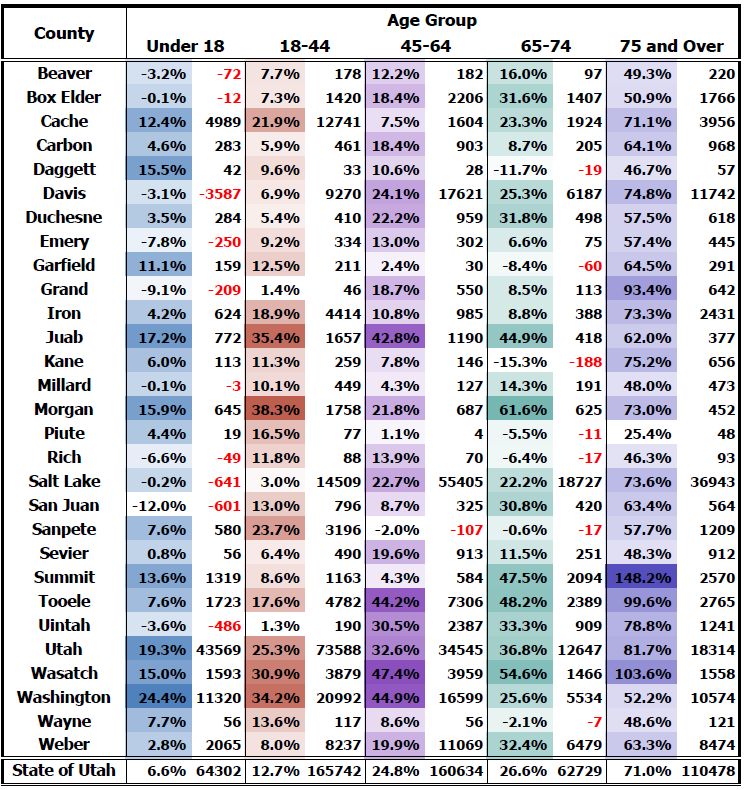
Table 22: 10-Year Population Growth by County and Age Group ................................................................ 54
Table 23: Age and Gender Weights .............................................................................................................. 147
Table 24: Individual Item Response Rates .................................................................................................. 155
xxi
U ah Ph ician Wo kfo ce, 2020

                         EXECUTIVE SUMMARY

As of September 2019, there were 12,318 physicians licensed in the state of Utah, an increase of
23.3% since 2015.
The share of licensed physicians reporting that they actively practice in Utah stands at 65.8%
(8,101 physicians).
Of physicians practicing in the state, 7,161 (88.4%) spend more than 50% of their time in direct
patient care, higher than what was reported in both 2015 (75.1%) and 2010 (82.9%).
The distribution of physicians across primary or specialty care has remained constant. Similar to
the 2010 and 2015 surveys, roughly one-third (34.5%) of physicians provide primary care (Family
Practice, General Internal Medicine, General OB/GYN, and General Pediatrics) and
approximately two-thirds (64.3%) provide specialty care. Over half of DOs in Utah provide
primary care.
The median age of Utah physicians is 48.
Utah physicians remain disproportionately non-Hispanic white (89.6% vs. 78% of the overall
Utah population), but the younger cohorts are more diverse. The under 35 cohort is 80.7% non-
Hispanic white, compared to 95.3% of the over 65 cohort.
Women now represent 27% of Utah's physician workforce, continuing the trend toward gender
parity seen both in the state and in the nation. Looking at the workforce by age cohorts, the
younger the physician cohort, the closer to gender parity, with the youngest cohort nearly
achieving that status.
A primary care physician's median income, adjusting to a standard 40-hour workweek, is
$194,415 ($244,533 unadjusted). A specialist, on the other hand, makes an adjusted $262,436
($325,362 unadjusted).
The Association of American Medical Colleges (AAMC) reports that the cost of medical training
continues to grow: the 4-year cost of attendance has risen to $255,517 for public institutions and
$337,584 for private institutions (AAMC, 2019b). The median inflation-adjusted debt for Utah
physicians graduating from a public institution is $108,254, while physicians graduating from a
private institution report a median of $215,756.
60.6% of physicians report that they have experienced burnout, and of that share, 51.2% say their
burnout has led them to either reduce the number of hours worked or years until retirement.
Administrative burden, work-life balance issues, and health information technology are the top
contributors to feelings of burnout.
Although there have been significant increases in telemedicine use since 2015 (13.1% of providers
reporting its use then and 50.2% in 2020), this growth is likely understated as most survey
responses were collected before the COVID-19 public health emergency, which has led to rapid
uptake of this technology.

                                             1
U ah Ph ician Wo kfo ce, 2020
U ah c en a io of p o ide o 100,000 people i 243.6 ph ician , hich fall belo he
national ratio of 277.8. In order to maintain the current ratio of 243.6 physicians per 100,000
population, Utah needs to add 137 physicians to the workforce per year.
An average of 413.2 physicians are added to the Utah workforce each year, equivalent to 478.1
FTEs at the average FTE of 1.157.
Profiles of every specialty are found in the Appendix. These profiles include FTEs, demographics,
geographic distribution, recommendations on the pursuit of a specialty, hours, income, debt,
practice information, and factors influencing specialty choice.
2U ah Ph ician Wo kfo ce, 2020
POLICY RECOMMENDATIONS
In keeping with the mission of the UMEC, the 2020 update to the report on Utah's Physician Workforce
continues to provide decision-makers with timely healthcare workforce research and advice on Utah's
healthcare training needs and graduate medical education (GME) policies. In this role, the UMEC
facilitates communication and collaboration between the stakeholders of Utah's medical workforce. As
such, the UMEC recommends supporting the following policies to develop and maintain a sustainable,
efficient, and adequate medical workforce supply for the state.
1. Research the Impact of Telemedicine
To fully and accurately assess Utah's physician capacity, a more detailed understanding of the
ocntributions of telehealth providers working outside Utah is needed. Additionally, the rapid
growth of telemedicine as a method of care delivery in the wake of the COVID-19 public health
emergency and what it means for meeting the health needs of the state should be explored.
2. Support for Pipeline Development for Medical Careers
It is crucial to introduce medicine as a career choice early in the educational pipeline and mentor
students through their educational experience. Focus placed on geographic and ethnic diversity,
along with gender parity, will result in a workforce that reflects the culture and needs of the state's
population. The Area Health Education Centers in Utah and the Southern Utah University's
Center for Rural Health are two agencies that are actively engaged in this process. The UMEC
recommends continued support for these agencies to strengthen their efforts.
3. Workforce Training Development
Utah faces a maldistribution, in terms of both specialty and geographic location, of physician
practices. Efforts must be maintained to train not just more physicians but the right types of
physicians to meet the needs of the population. According to the American Association of Medical
Colleges (AAMC)'s most recent rankings, Utah is ranked 44th in the nation in physician-per-
100,000 population ratio and last for primary care physician-per-100,000 population ratio. The
UMEC recommends the following:
a. Research into Interprofessional Care
Health care is changing rapidly to achieve better health, better quality, controlled
cost, and a sustainable workforce. One fundamental change is interprofessional team
care development, including diverse professionals such as physicians, nurses, nurse
practitioners, physician assistants, clinical pharmacists, medical assistants, social
workers, care managers, psychologists, educators, and others. Preparing and
deploying the right number and mix of these team members to serve the needs of the
3U ah Ph ician Wo kfo ce, 2020
population is complicated, costly, and requires long lead times. However, old models
of estimating the need for different professionals, based on simple ratios of individual
disciplines to population (e.g., physicians per 100,000 population) do not account for
the emergence of team care and changing organizational and payment models for
health care.
The UMEC recommends conducting further research into the delivery of
interprofessional care. Certainly, considerable growth in the Nurse Practitioner and
Physician Assistant workforces over the last five years will influence future physician
requirements to meet the needs of the population.
4. Collect and Update Core Workforce Data More Frequently
Access to timely information is critical for policymakers and industry leaders to make effective
decisions. Improvement of data collection will allow for a more complete picture of the workforce
when it is gathered at more regular intervals. The collection of basic demographic data from the
entire physician workforce would enable more accurate reporting, especially for smaller
specialties.
The UMEC continues to collect demographic and practice information from healthcare providers
in Utah through periodic paper surveys. While this method has historically resulted in high
response rates and statistically sound data, response rates are declining over time and paper
surveys are time-intensive, requiring multiple surveys sent out to each provider to increase
response rates and manual data entry. It is also more prone to the introduction of human error in
the handling of surveys and processing of data. Based on national minimum data set
recommendations for what is important to track about the workforce, a core set of questions
could be added to the license and renewal process. This change would require a sponsor from the
medical professional community to call for legislative direction to change the rules governing
what data is collected by DOPL at the time of licensure and renewal and to direct that the UMEC
manage this data. Automating the data collection process would allow the UMEC to produce
analysis on a two-year cycle rather than the current five-year cycle. It would also allow UMEC
staff more time to focus work on advanced analytics such as workforce optimization modeling,
machine learning-based predictive modeling, and incorporation of other existing government
datasets into analyses of the medical workforce.
4U ah Ph ician Wo kfo ce, 2020
PHYSICIAN CHARACTERISTICS
SUPPLY AND DISTRIBUTION
AGGREGATE SUPPLY
As of September 2019, there were 12,318 physicians licensed in Utah, an increase of 23.3% since 2015,
representing a significantly increased growth rate compared to the previous iteration of this report, which
saw only an 11.8% increase over five years. The share of licensed physicians reporting that they actively
practice1 in Utah stands at 65.8%, up from 60.4% in 2015 and similar to the 67.1% reported in 2010.
Figure 1: Utah-licensed Physician Status
MoE +/- 1.5%
Of the 8,101 physicians actively practicing in Utah, 7,161 (88.4%) spend more than 50% of their time in
direct patient care, higher than what was reported in both 2015 (75.1%) and 2010 (82.9%). The five-year
growth numbers can be seen in Figure 2 on page 6 and specialty-specific numbers can be seen in the
"Specialty Profiles" section beginning on page 57.
1 An actively practicing physician includes all activities: patient care, teaching, research, etc.
5U ah Ph ician Wo kfo ce, 2020
Figure 2: Physician Practice Status — 5-Year Change
OUT-OF-STATE PHYSICIANS
Roughly a quarter of physicians licensed in Utah report actively practicing in another state. A thematic
analysis was done on this group to gauge their reasons for maintaining Utah licensure (Figure 3 on page
7), along with an analysis of the relative importance of factors that led to practicing outside of Utah.
Reasons for Maintaining Utah Licensure
The possibility of relocating to or working in Utah was the most frequently mentioned response, with
roughly 35% of respondents citing it. In conjunction, 5.4% said they were planning to relocate to or
work in Utah, while another 0.7% reported actively looking to relocate to or work in Utah. If applied to
the entire population of physicians working outside of Utah, this would represent 1,104, 169, and 22
physicians, respectively. The other significant response came from those reporting working either in
telehealth, remotely, 2 or on a locum tenens basis (27% of responses). The remaining coded responses
could be classified as the following: physician has ties to Utah (e.g., family, former residence), does a
limited amount of work in Utah, is keeping options open, 3 works for the federal government, 4 is required
to by an employer, 5 simply finds it easier to maintain their Utah license, and will be letting the Utah
license expire at the end of the cycle.
The reasons for maintaining licensure numbers presented in Figure 3 reflect the results of UMEC staff
coding a free-response question. Thus, they should not be interpreted as representative of all possible
2 Radiology and pathology services are frequently provided by remote physicians
3 Re pon e coded a keeping op ion open a e likel keeping open he po ibili of o king in U ah, b ince he
language used was not confirmatory coding was done conservatively
4 Federal employment (e.g., VA) allows for any state license to ensure eligibility for employment
5 One example would be an employer who also runs clinics in Utah and requires employees be available to work in
those clinics if needed
6U ah Ph ician Wo kfo ce, 2020
reasons physicians may have given if they had instead been presented with a list of responses to choose
from. They should only be viewed as insight into the relative importance of various factors and as
preliminary research into any future efforts at a more quantitatively based approach to researching this
topic. Comments were also analyzed by age but did not produce any notable difference in results.
Figure 3: Reasons for Maintaining Utah Licensure
Note: Total adds up to more than 100% since respondents could list multiple reasons for maintaining licensure
Ratings of Factors Influencing Work Outside Utah
Physicians working outside Utah were also asked to rate the importance of various factors in their
decision to work outside Utah. A ranking of 5 indicated a highly influential factor, while a ranking of 1
indicated the opposite. While health systems trying to attract physician talent may not have much control
over family, lifestyle, or climate, they do have control over wages and working environment, which both
rank right after family.6
Table 1: Ratings on Importance of Various Factors for Working Outside of Utah
1 Family 3.52
2 Wage/Payscale 3.17
2 Work Environment 3.15
4 Lifestyle 2.89
5 Climate 2.5
MoE: +/- 0.12
6 Wage/payscale and work environment are statistically equivalent
7U ah Ph ician Wo kfo ce, 2020
FULL-TIME EQUIVALENTS
There are an estimated 8,101 physicians currently practicing in Utah, although not all work the same
number of hours each week (see "Work Hours" on page 38). Full-time-equivalent (FTE) calculations allow
for a better understanding of actual physician capacity in the state. UMEC reports three FTE calculations,
shown in Table 2.
Total Hour FTE: This calculation simply adds up hours across primary and, if applicable,
secondary sites and divides by a "standard" 40-hour workweek (e.g., 60 hours would equate to 1.5
FTEs, 20 hours would be 0.5 FTEs)
Standardized FTE: Used by the Health Resources and Services Administration (HRSA), this
calculation counts anything over 40 hours as 1 FTE and anything less than 40 hours in the same
manner as the Total Hour FTE (e.g., 60 hours equates to 1 FTE, 20 hours equates to 0.5 FTEs)
Adjusted Standardized FTE: Operates like the Standardized FTE, but when a physician
reports only a secondary location in Utah, they are assigned .33 FTEs, regardless of hours
reported
Table 2: FTEs
Total Hour FTEs 9,332
Standardized FTEs 7,230
Adjusted Standardized FTEs 7,234
The numbers reported in Table 2 are based on work hours, as reported by survey respondents. However,
some respondents chose not to respond to the relevant questions, meaning that FTEs are undercounted.
To account for this, when respondents reported a location but no work hours, values were imputed based
on averages for their age and gender. In total, hours were imputed for 85 primary sites and 13 secondary
sites. When taking these imputed values into account, the Total Hour FTE increases to 9,514.
8U ah Ph ician Wo kfo ce, 2020
Figure 4: FTEs — 5-Year Change
Figure 5: Average FTEs per Physician— 5-Year Change
Figure 4 shows the absolute increase in FTEs since 2015, mostly driven by the increase in physicians
practicing in the state. However, Figure 5 shows the average FTEs worked per physician, which indicates
that some of the growth seen in Figure 4 is due to an increase in the number of hours physicians work. If
these numbers had stayed constant between 2015 and 2020, there would be 746 fewer Total Hour FTEs or
781 fewer Standardized FTEs.
9U ah Ph ician Wo kfo ce, 2020
SPECIALTY DISTRIBUTION
The distribution of physicians in primary or specialty care has remained constant. Similar to the 2010 and
2015 surveys, roughly one-third of physicians provide primary care (Family Practice, General Internal
Medicine, General OB/GYN, and General Pediatrics), while approximately two-thirds provide specialty
care.
Figure 6: Specialty Distribution
MoE: +/- 2%
However, when looking only at physicians with a DO degree, the pattern changes significantly from the
overall makeup shown in Figure 6; over half of DOs in Utah provide primary care. With the addition of
Rocky Vista University in Ivins and the soon-to-be-completed Noorda College of Osteopathic Medicine in
Provo, more primary care physicians will be trained in Utah; this may, in time, lead to a greater
proportion of Utah physicians practicing primary care.
Figure 7: Specialty Distribution — DOs
MoE: +/- 6.5%
10U ah Ph ician Wo kfo ce, 2020
Table 3: Detailed Specialty Distribution
Specialty 2020 Estimate Lower Est. Upper Est.
Addiction Medicine 22 9 38
Allergy & Immunology 47 23 71
Anesthesiology - General 659 570 748
Anesthesiology - Pain Management 44 20 68
Anesthesiology - Other subspecialties 23 7 39
Cardiology 119 78 160
Critical Care Medicine 83 51 115
Dermatology 216 167 265
Emergency Medicine 467 394 540
Endocrinology 32 8 56
Family Medicine - General 1,383 1,261 1,505
Family Medicine - Geriatrics 41 17 65
Family Medicine - Sports Medicine 61 37 85
Gastroenterology 63 39 87
Hematology/Oncology 74 42 106
Hospice and Palliative Medicine 12 5 28
Hospitalist - Internal Medicine 240 183 297
Hospitalist - Pediatrics 47 23 71
Hyperbaric Medicine 12 5 28
Infectious Diseases 54 30 78
Internal Medicine - General 419 346 492
Internal Medicine - Pediatrics 67 35 99
Internal Medicine - Other subspecialties 17 6 33
Medical Genetics 11 5 19
Nephrology 35 11 59
Neurology 154 113 195
OB/GYN - General 357 292 422
OB/GYN subspecialties 76 44 108
Occupational Health 64 32 96
Ophthalmology 246 189 303
Otolaryngology 123 82 164
Pathology - General 129 88 170
11U ah Ph ician Wo kfo ce, 2020
Specialty 2020 Estimate Lower Est. Upper Est.
Pathology subspecialties 94 62 126
Pediatrics - General 532 451 613
Pediatrics subspecialties 191 142 240
Physical Medicine and Rehabilitation 128 87 169
Preventive Medicine/Public Health 13 5 29
Psychiatry - General 198 149 247
Psychiatry - Child and Adolescent 109 68 150
Psychiatry - Other subspecialties 10 5 18
Pulmonology 49 25 73
Radiology - Diagnostic 189 140 238
Radiology - Interventional 26 10 42
Radiology - Therapeutic/Radiation Oncology 31 15 47
Rheumatology 18 4 34
Sleep Medicine 9 3 17
Surgery - Cardiothoracic/Thoracic 28 12 44
Surgery - Colon and Rectal 10 3 26
Surgery - General 202 153 251
Surgery - Neurological 60 36 84
Surgery - Orthopaedic 240 183 297
Surgery - Other subspecialties 56 32 80
Surgery - Plastic 105 64 146
Surgery - Vascular 29 13 45
Urgent Care Medicine 107 66 148
Urology 112 71 153
Other specialty 56 32 80
Note: Upper and lower-bound estimates are based on a 95% confidence interval with a design effect of 1.2 to
account for disproportionate response rates among age groups. In instances where a lower bound estimate was
below the number of surveys received, the actual count was used instead (Addiction Medicine, Hospice and
Palliative Medicine, Hyperbaric Medicine, Internal Medicine – Other subspecialties, Medical Genetics, Preventive
Medicine/Public Health, Psychiatry – Other subspecialties, Rheumatology, Sleep Medicine, Surgery – Colon and
Rectal)
12U ah Ph ician Wo kfo ce, 2020
GEOGRAPHIC DISTRIBUTION
Physicians are not evenly distributed throughout the state. The following pages detail how that
distribution looks overall and by primary and specialty care in each of Utah's 13 Local Health Districts
(LHDs). The Total Hour FTE calculation was used as it provides the best understanding of total physician
capacity and is measured in two ways:
FTE Count and Share of Total
FTE Physicians per 100,000
A small number of respondents indicated work hours but no location. In these instances, the ZIP code was
imputed from license data. Only 49 primary sites and ten secondary sites required this imputation.
All Physicians
FTE Count (Share) FTE Physicians per 100,000
Salt Lake County and Summit County have the highest number of FTE physicians per 100,000
population while Wasatch and Tooele have the lowest ratio. However, since both these low ratio counties
border the highest ratio counties, it can be assumed that care remains accessible.
13U ah Ph ician Wo kfo ce, 2020
Primary Care Physicians
FTE Count (Share) FTE Physicians per 100,000 Population
There are more primary care physician (PCP) FTEs than
County Makeup of Multi-County
specialist FTEs in more rural LHDs:
LHDs
Central Utah
Bear River: Cache, Box Elder, Rich San Juan
Southeast
Central Utah: Juab, Millard, Piute, TriCounty
Sanpete, Sevier, Wayne Tooele
With the relatively small number of survey responses for rural
Southeast: Carbon, Emery, Grand
LHDs, a single survey response creates more dramatic changes
Southwest: Beaver, Garfield, Iron, in the numbers. For example, San Juan County shows a high
Kane, Washington
PCP ratio, but the Utah Department of Health reports San
TriCounty: Daggett, Duchesne, Juan County being about average on this measure. However,
Uintah UMEC data is not directly comparable due to inclusion of
OB/GYNs as PCPs and reporting of FTE ratios.
14U ah Ph ician Wo kfo ce, 2020
Specialty Care Physicians
FTE Count (Share) FTE Physicians per 100,000 Population
There are more specialist FTEs than primary care physician
County Makeup of Multi-County
FTEs in more urbanized LHDs:
LHDs
Salt Lake
Bear River: Cache, Box Elder, Rich Southwest
Utah
Central Utah: Juab, Millard, Piute,
Sanpete, Sevier, Wayne Wasatch
Summit
Southeast: Carbon, Emery, Grand
Bear River
Southwest: Beaver, Garfield, Iron, Davis
Kane, Washington
Weber-Morgan
TriCounty: Daggett, Duchesne,
Uintah
15U ah Ph ician Wo kfo ce, 2020
Rural/Urban Divide
9.1% of physicians spend some amount of practice time in a rural county (see Table 4); however, rural
Utahns make up 15.4% of the population (Kem C. Gardner Policy Institute, 2017). As shown in Table 5
and
Table 6 below, primary care physicians are more likely than specialists to practice in a rural county (13.5%
vs. 6.8%). Physicians over the age of 65 are also more likely than the youngest cohort of physicians to
practice in a rural area (10.4% vs. 5.9%).
Table 4: County Classification as Urban or Rural
Urban Counties Rural Counties
Cache Utah Beaver Duchesne Iron Morgan Sanpete Uintah
Davis Washington Box Elder Emery Juab Piute Sevier Wasatch
Salt Lake Weber Carbon Garfield Kane Rich Summit Wayne
Daggett Grand Millard San Juan Tooele
Table 5: Rural/Urban Divide — Primary Care vs. Specialists
Rural Rural Primary Urban Primary Urban Any Any
Only Urban Secondary Rural Secondary Only Rural7 Urban8
Primary Care 10.7% 0.8% 1.2% 87.3% 13.5% 88.8%
Specialty Care 4.4% 0.6% 1.4% 93.6% 6.8% 95.3%
MoE: +/- 2%
Table 6: Rural/Urban Divide — Age
Rural Rural Primary Urban Primary Urban Any Any
Only Urban Secondary Rural Secondary Only Rural7 Urban8
Under 35 4.5% 0% 1.3% 94.2% 5.9% 95.3%
35-44 5.9% 0.5% 1.4% 92.2% 7.8% 94.1%
45-54 7.2% 1% 1.0% 90.9% 9.1% 92.8%
55-64 7.6% 0.8% 1.5% 90.1% 9.9% 92.4%
65 and Older 7.8% 0.9% 1.7% 89.6% 10.4% 92.2%
MoE: +/- 2%
7 Rural practice only, rural primary site with an urban secondary site, or a rural secondary site
8 Urban practice only, urban primary site with a rural secondary site, or an urban secondary site
16U ah Ph ician Wo kfo ce, 2020
DEMOGRAPHICS
The information in this section reflects physician demographics in the aggregate. For specialty-specific
information, see Special P ofile on page 57.
AGE
The median age of Utah physicians is 48, lower than reported in the previous report, but this is likely due
to the inclusion of first-year residents (see note under Figure 8). AAMC (2019a) reports that Utah has the
lowest share of active physicians over the age of 60 (26.5%) in the country. The median share nationwide
is 31.4%.
Figure 8: Age Distribution of Utah Physicians (2010-2020)
Note: 2020 data are from licensing data rather than survey data. In addition, data from the University of Utah
were added to the 2020 numbers to include first-year residents who are physicians but have not yet shown up in
DOPL licensing data – 150 residents thus had their ages imputed and were assumed to fit into the Under 35
category.
17U ah Ph ician Wo kfo ce, 2020
RACE AND ETHNICITY
Utah physicians remain disproportionately non-Hispanic white (89.6% vs. 78% of the overall Utah
population), but the younger cohorts are more diverse. The under 35 cohort is 80.7% non-Hispanic white,
compared to 95.3% of the over 65 cohort.
Figure 9: Racial/Ethnic Makeup of Physician Workforce
MoE: +/- 2%
Figure 10: Minority Status by Age Cohort
MoE: +/- 2%
Figure 11 shows that the racial diversity of the workforce has grown over time, though it has stagnated 9
since 2015. As younger, more diverse cohorts become a larger share of the workforce, Utah should expect
to see the minority share of the workforce grow. Still, efforts must be made to attract minority students to
the profession. Of particular importance is the large and growing share of Hispanic Utahns, who are
dramatically underrepresented in the physician workforce.
9 The apparent decline is within the margin of error
18U ah Ph ician Wo kfo ce, 2020
Figure 11: Workforce Diversity (1998-2020)
MoE: +/- 2%
Figure 12 details a "representation factor." This is a tool for quickly seeing how over- or under-
represented various groups are. A factor of 1 means that the share of physicians reflects the share in the
population at large (e.g., group X makes up 10% of the Utah population and 10% of the physician
workforce). Asian Utahns are highly over-represented, while white Utahns are slightly over-represented,
mixed-race Utahns are somewhat under-represented, and all other groups are dramatically under-
represented.
Figure 12: Representation Factor
19U ah Ph ician Wo kfo ce, 2020
GENDER
Figure 13: Gender (Overall)
Figure 14: Gender (Age Groups)
20U ah Ph ician Wo kfo ce, 2020
Women now represent 27% of Utah's physician workforce, continuing the trend toward gender parity seen
both in the state and in the nation. As evidenced by Figure 14, the younger the physician cohort, the closer
to gender parity, with the youngest cohort nearly achieving that status.
Figure 15: Growth in Female Share of Utah Workforce
Figure 16: Gender — Utah vs. U.S.
The growth in the female share of the workforce has been a long-term trend, rising from 18% in 2003 to
27% in 2020, representing an average yearly increase of roughly half a percentage point per year. This
diversification mirrors the trend seen across the nation, with Utah diversifying its workforce at roughly
the same pace as the nation. However, Utah remains well behind the country in terms of gender diversity.
The only state with a lower share of women in the physician workforce is Idaho (25%). Utah shares the
second to last position with Mississippi and Wyoming (Kaiser Family Foundation, 2020).
21U ah Ph ician Wo kfo ce, 2020
FINANCIAL DATA
The information in this section reflects physician income and debt in the aggregate. For specialty-specific
information, see Special P ofile on page 57.
INCOME
A primary care physician's median income, adjusting to a standard 40-hour workweek, is $194,415
($244,533 unadjusted). A specialist, on the other hand, makes an adjusted $262,436 ($325,362
unadjusted). These figures and the absolute increase since 2015 can be seen in Table 7. The median
incomes Utah physicians report remain below the most recent national median reported data UMEC was
able to gain access to from five years ago ($263,207 for primary care physicians, $360,367 for specialists)
(MGMA, 2016). As will be discussed in more detail under Figure 36 on page 47, the nationwide landscape
for recruiting physicians may become more competitive over the next 15 years and pay can be a significant
factor in attracting physician talent.
Table 7: Physician Income
Primary Specialty
Care Care
Median Unadjusted $244,533 $325,362
Absolute increase since 2015 $47,783 $60,931
Median FTE Adjusted $194,415 $262,436
Absolute increase since 2015 $18,812 $40,879
22U ah Ph ician Wo kfo ce, 2020
Figure 17: Physician Income Distribution
Figure 18: Divergence in Income Growth
The absolute increases in compensation in Table 7 appear compelling, but they are a bit misleading. A
proper comparison should look at changes in income adjusted for inflation. Figure 18 does just that with
FTE-adjusted and inflation-adjusted median income. Under this apples-to-apples comparison, primary
care saw a real increase of only $1,779 over five years (0.18% increase per year) versus a specialty care
23U ah Ph ician Wo kfo ce, 2020
increase of $19,388 over five years (1.6% increase per year). Income growth for specialists increased at
nearly eight times the pace of primary care physicians.
The Centers for Medicare and Medicaid Services (CMS) is aware of the disparity between the pay for
primary care physicians and specialists and has proposed that the 2021 Medicare Physician Fee Schedule
(MPFS) "reallocate Medicare dollars, benefiting general medicine at the expense of some specialists"
(Pifer 2020). As research indicates, private payers will likely follow CMS's lead (Clemens & Gottlieb,
2017).
DEBT
The burden of student debt continues to climb and is a frequently mentioned issue by physicians who
would not recommend that a young person pursue medicine (see "Recommendations on Pursuing
Medicine as a Career" on page 27). The most recent AAMC numbers for the graduating class of 2019
indicate that of the 73% of students who graduate with debt, the median stands at $200,000 (AAMC,
2019b). Even when not adjusted for inflation, as the numbers in Table 8 do, the median debt at
graduation for Utah graduates with debt from the past decade is higher ($215,819) and fewer Utah
graduates report having graduated with no medical debt (11.3%).
AAMC also reports that the cost of medical training continues to grow: the 4-year cost of attendance has
risen to $255,517 for public institutions and $337,584 for private institutions (AAMC, 2019b). That gap is
reflected in the data collected by UMEC. The median inflation-adjusted debt for Utah physicians
graduating from a public institution is $108,254, while physicians graduating from a private institution
report a median of $215,756, nearly double that of public institution graduates.
Table 8: Physician Debt
All Physicians with Debt
Physicians at Time of Graduation
Median All Physician Experience Cohorts $135,474 $175,889
Debt at
Physicians Graduating in Past 10 $228,763 $239,879
Graduation*
Years
Median All Physicians Experience Cohorts $0 $0
Current
Physicians Graduating in Past 10 $138,056 $164,371
Debt
Years
*adjusted to 2020 dollars
The debt burden faced by physicians continues to grow, as evidenced by Figure 19 and Figure 20. Only a
tenth of physicians graduating in the past 20 years report no debt at graduation while over half of
physicians graduating 50 years ago do.
24U ah Ph ician Wo kfo ce, 2020
Figure 19: Inflation-Adjusted Debt at Graduation, by Years Since Graduation Cohort
MoE: +/- 2%
Figure 20: Current Debt, by Years Since Graduation Cohort
MoE: +/- 2%
Primary care physicians continue to report higher median debt at graduation than specialists $147,935
compared to $129,021 or $186,878 compared to $171,654 when only looking at physicians who report
having debt. Both, however, report a current median debt of $0.
Figure 21: Inflation-Adjusted Debt at Graduation — Primary Care vs. Specialist
MoE: +/- 2%
25U ah Ph ician Wo kfo ce, 2020
Figure 22: Current Debt — Primary Care vs. Specialist
MoE: +/- 2%
CAREER SATISFACTION AND BURNOUT
CAREER SATISFACTION
The vast majority (88.7%) of physicians report feeling satisfied or very satisfied with their careers overall,
but a smaller majority (80.6%) say the same of the last 12 months.
Figure 23: Career Satisfaction
MoE: +/- 2%
26U ah Ph ician Wo kfo ce, 2020
When looking at 12-month satisfaction for the seven10 most frequent work settings, only two settings were
statistically different than the average. Physicians working at academic institutions reported higher
satisfaction (83.4% satisfied or very satisfied) and physicians working at a single-specialty office/clinic
reported lower satisfaction (77.9%). However, when looking at either satisfied or very satisfied in
isolation, there are a few more significant differences.
Table 9: Satisfaction in Top 7 Settings, Past 12 Months
Setting Very Satisfied Satisfied Total
Academic Institution 36.7%* 46.7% 83.4%*
Emergency Department 33.6% 47.5% 81.1%
Inpatient Hospital 35.3%* 47.3% 82.6%
Outpatient Hospital 28.9%* 50.5%* 79.4%
Multi-Specialty Office/Clinic 25.8%* 53.2%* 79%
Single-Specialty Office/Clinic 31%* 46.9% 77.9%*
Solo Practice 35.8%* 44.4%* 80.2%
MoE: +/- 2%
* Significant at .05 level; arrow indicates whether the percentage is higher (↑) or lower (↓) than the
overall average
RECOMMENDATIONS ON P URSUING MEDICINE AS A CAREER
Most physicians (62.6%) would recommend pursuing medicine as a career, while another 15.6% said no,
and the remainder were unsure. If a physician responded with "no" or "unsure," they could leave a
response on their reason(s) for the lack of recommendation. These responses were then coded into
themes, which are presented in Figure 25 on page 29.
Data on whether or not physicians would recommend their specialty can be found in the Special
P ofile beginning on page 57.
10Academic institution, emergency department, inpatient hospital, outpatient hospital, solo practice, multi-specialty
office/clinic, and single-specialty office/clinic. These seven had at least 5% of the workforce present in either a
primary or secondary capacity.
27U ah Ph ician Wo kfo ce, 2020
Figure 24: Recommendation of Medical Career
MoE: +/- 2%
Table 10: Recommendation of Medical Career, by Top 7 Settings
Would Recommend
Setting Medicine
Academic Institution 67.2%*
Emergency Department 59.3%*
Inpatient Hospital 61%
Outpatient Hospital 58.8%*
Multi-Specialty Office/Clinic 63.3%
Single-Specialty Office/Clinic 64.9%*
Solo Practice 52.7%*
MoE: +/- 2%
* Significant at .05 level; arrow indicates whether the percentage is higher (↑) or lower (↓)
than the overall average
Physicians working in an academic institution or a single-specialty office/clinic are more likely to
recommend medicine. In contrast, physicians in an emergency department or outpatient hospital are less
likely to. Only about half of physicians working in a solo practice would recommend the pursuit of
medicine.
28You can also read