Deep Decarbonization in the Northeastern United States and Expanded Coordination with Hydro-Québec - April 2018
←
→
Page content transcription
If your browser does not render page correctly, please read the page content below

Deep Decarbonization in the
Northeastern United States
and Expanded Coordination
    with Hydro-Québec

          April 2018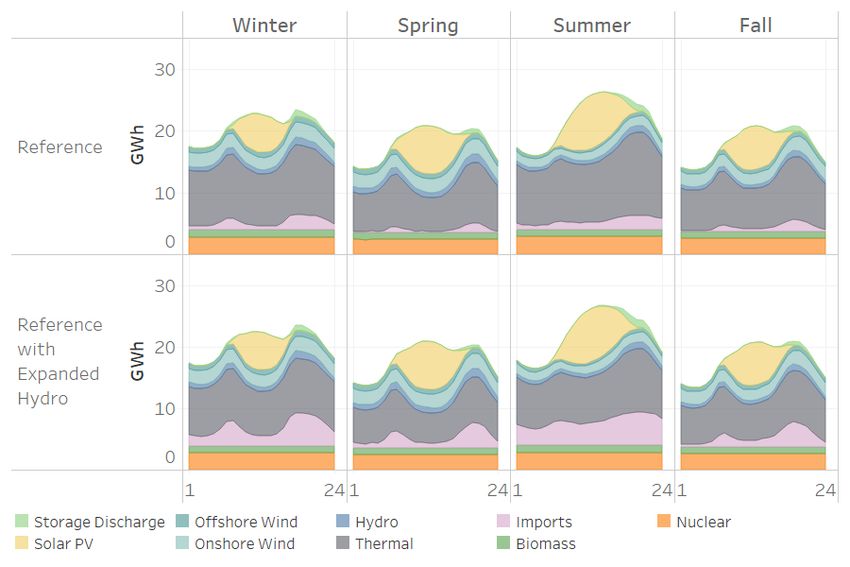
Deep Decarbonization in the Northeastern United States and
Expanded Coordination with Hydro-Québec

Deep Decarbonization in the Northeastern United States and Expanded Coordination with
Hydro-Québec is published by the Sustainable Development Solutions Network (SDSN) in
collaboration with Evolved Energy Research (EER) and Hydro-Québec (HQ).

Publication date: April 2018

Principal Authors:

Dr. James H. Williams, Director, Deep Decarbonization Pathways Project and Associate
Professor, University of San Francisco

Ryan Jones, Gabe Kwok, Benjamin Haley, Evolved Energy Research

Contributors:

SDSN: Dr. Jeffrey Sachs, Elena Crete

HQ: Gary Sutherland, Debbie Gray, Dr. Maurice Huneault, Dr. Innocent Kamwa, Alain
Forcione

Cite this report as:

Williams, J.H., Jones, R., Kwok, G., and B. Haley, (2018). Deep Decarbonization in the
Northeastern United States and Expanded Coordination with Hydro-Québec. A report of the
Sustainable Development Solutions Network in cooperation with Evolved Energy Research
and Hydro-Québec. April 8, 2018.

A PDF version of this report may be downloaded from:

 U.S. Deep Decarbonization Pathways Project
 http://usddpp.org/

 or

 Evolved Energy Research
 https://www.evolved.energy/
DEEP DECARBONIZATION IN THE
   NORTHEASTERN UNITED STATES
 AND EXPANDED COORDINATION WITH
          HYDRO-QUÉBEC

Sustainable Development Solutions Network
         Evolved Energy Research
              Hydro-Québec

               April 2018
ACKNOWLEDGMENT

The authors would like to gratefully acknowledge the contributions of the distinguished
advisory committee who agreed to review the initial design and final results of this study, and
provided many helpful comments and suggestions. The report does not represent the positions
of the advisory committee members or their organizations. The members of the advisory
committee included:

Steve Clemmer, Director of Energy Research and Analysis, Union of Concerned Scientists

Dr. Anthony Fiore, Director of Energy Regulatory Affairs, New York City Mayor’s Office of
Sustainability

Ken Kimmel, President, Union of Concerned Scientists

Dr. Trieu Mai, National Renewable Energy Laboratory

Carl Mas, Director, Energy and Environmental Analysis, New York State Energy Research and
Development Authority (NYSERDA)

                                                                                                  4
Table of Contents
Executive Summary ......................................................................................................................... 9
Introduction .................................................................................................................................. 17
Methodology................................................................................................................................. 20
   EnergyPATHWAYS Overview..................................................................................................... 20
   Electricity Representation ......................................................................................................... 22
Scenarios ....................................................................................................................................... 25
Deep Decarbonization Scenario Results ....................................................................................... 32
   Emissions................................................................................................................................... 32
   Energy Demand ......................................................................................................................... 33
   Electricity................................................................................................................................... 37
       Load ....................................................................................................................................... 37
       Resources .............................................................................................................................. 40
       Operations ............................................................................................................................ 41
Expanded Coordination Scenario Results ..................................................................................... 44
   Overview ................................................................................................................................... 44
   Electricity Sector ....................................................................................................................... 45
   Economic Costs and Benefits .................................................................................................... 50
       Region-wide Costs ................................................................................................................. 50
       Region-wide Benefits ............................................................................................................ 51
       Region-wide Net Benefits ..................................................................................................... 52
   Reference Case with Increased Coordination........................................................................... 54
Conclusions ................................................................................................................................... 57
References .................................................................................................................................... 61

                                                                                                                                                         5
Table of Figures
Figure 1. Northeast generation mix in 2050 reference case and DDP case ................................. 11
Figure 2. Annual costs and benefits in 2050 of expanded wind case relative to base DDP case. 13
Figure 3. Base DDP Case Monthly Electricity Consumption for the Northeast ............................ 14
Figure 4 Expanded Wind Case: HQ-Northeast Net Interchange .................................................. 15
Figure 5. EnergyPATHWAYS model flow diagram for a calculation of energy system emissions. 22
Figure 6 Process for constructing load shapes bottom-up to reflect underlying changes in the
patterns for energy service demand. ........................................................................................... 22
Figure 7 Network topology in the EnergyPATHWAYS electricity dispatch optimization. ............ 23
Figure 8 Scenarios to assess the costs and benefits of Northeast U.S. coordination with Québec
under a variety of sensitivities including deep decarbonization pathways (DDPs)...................... 25
Figure 9. Expanded HQ-Northeast coordination transmission build. Existing transmission capacity
is increased by a factor of 3.2 by 2050, starting in 2025. ............................................................. 27
Figure 10 Assumed offshore wind cost through 2050 vintage ..................................................... 31
Figure 11. Energy-related CO2 Emissions by Scenario in 2050 .................................................... 32
Figure 12. Northeast Energy-related CO2 Emissions by Fuel Type .............................................. 33
Figure 13. Northeast Final Energy Demand .................................................................................. 34
Figure 14. Northeast Final Energy Demand by Fuel Type............................................................. 35
Figure 15 Base DDP Case Residential Space Heating Transition .................................................. 36
Figure 16. Base DDP Case Light-Duty Vehicle Transition .............................................................. 36
Figure 17. Northeast Retail Electricity Sales ................................................................................. 37
Figure 18. Base DDP Case Monthly Electricity Consumption for the Northeast .......................... 38
Figure 19. Annual Peak Demand ................................................................................................... 39
Figure 20. Northeast Hourly Load, Primary DDP .......................................................................... 39
Figure 21. Northeast Electricity Generation by Technology in 2050 ............................................ 40
Figure 22. Northeast Installed Generation Capacity, 2050 .......................................................... 41
Figure 23. New England, Base DDP Case, 2050 ............................................................................ 42
Figure 24. New York, Base DDP Case, 2050 .................................................................................. 42
Figure 25. Québec, Base DDP Case, 2050 ..................................................................................... 43
Figure 26. Energy-related CO2 Emissions in 2050 (MMTCO2) ..................................................... 44
Figure 27. Northeast Electricity Generation by Technology in 2050 ............................................ 45
Figure 28. Northeast Curtailment in 2050 .................................................................................... 46
Figure 29. Northeast Installed Capacity in 2050 ........................................................................... 46
Figure 30. New England, Expanded Wind Case, 2050 .................................................................. 47
Figure 31. New York, Expanded Wind Case, 2050 ........................................................................ 48
Figure 32. Québec, DDP with Expanded Wind-Hydro, 2050 ........................................................ 48
Figure 33. Expanded Wind Case: HQ-Northeast Net Interchange ............................................... 49
Figure 34. Distribution of Output from HQ Dispatchable Hydro Fleet in 2050 ............................ 50
Figure 35. Annual Net Benefits in 2050: Expanded Wind Case .................................................... 52
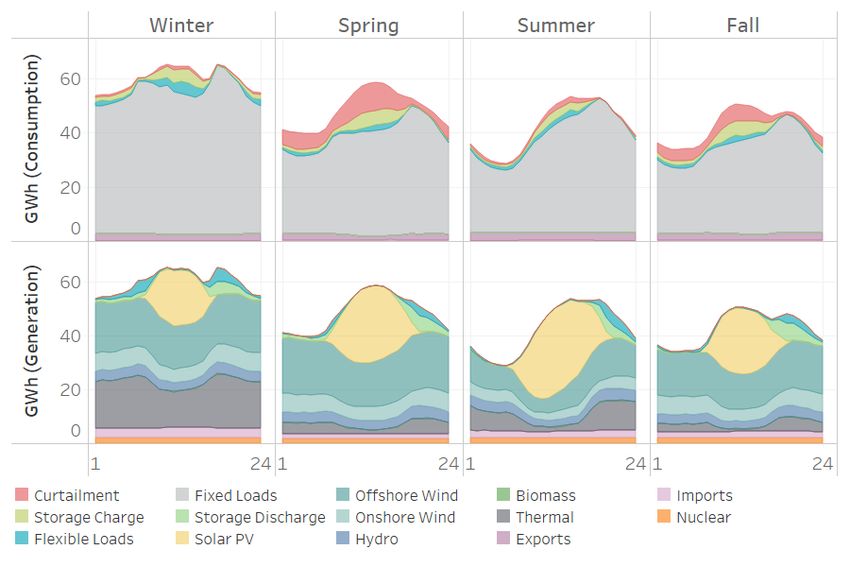
Figure 36. New England Seasonal Dispatch in 2050 ..................................................................... 55
6
Table of Tables
Table 1. Mid-century greenhouse gas emission reduction goals in the northeastern U.S. ........... 9
Table 2. Metrics for “three pillars” of deep decarbonization, comparing current values to DDP
base case ....................................................................................................................................... 10
Table 3. Net benefits in 2050 of four increased coordination scenarios relative to deep
decarbonization base case. ........................................................................................................... 12
Table 4 Contrasting similarities and difference between scenarios............................................. 26
Table 5 Summary of assumptions for the scenarios representing current U.S. climate policy. .. 27
Table 6 Assumed dispatchable hydro potential and cost in Québec ........................................... 28
Table 7 Summary of assumptions for the deep decarbonization pathways scenarios. ............... 30
Table 8. Transmission component cost assumptions (2005 dollars)............................................ 31
Table 9. Summary of Region-Wide Gross Costs in 2050 for Expanded Wind Case ...................... 51
Table 10. Summary of Region-Wide Gross Benefits in 2050 for Expanded Wind Case ............... 52
Table 11. 2050 Net Benefits for Deep Decarbonization with Increased Coordination Cases ...... 53
Table 12. Cost Sensitivity Table: Expanded Wind Case ($billion/yr.) ........................................... 53
Table 13. Cost Sensitivity Table: Expanded Hydro Case ($billion/yr.) .......................................... 54
Table 14. 2050 Net Benefits for Reference with Expanded Hydro Case ...................................... 56

                                                                                                                                                       7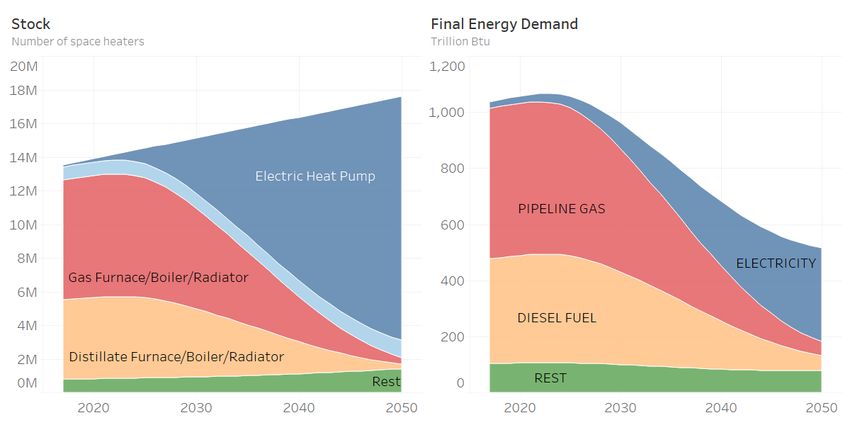
(This page intentionally left blank)

                                       8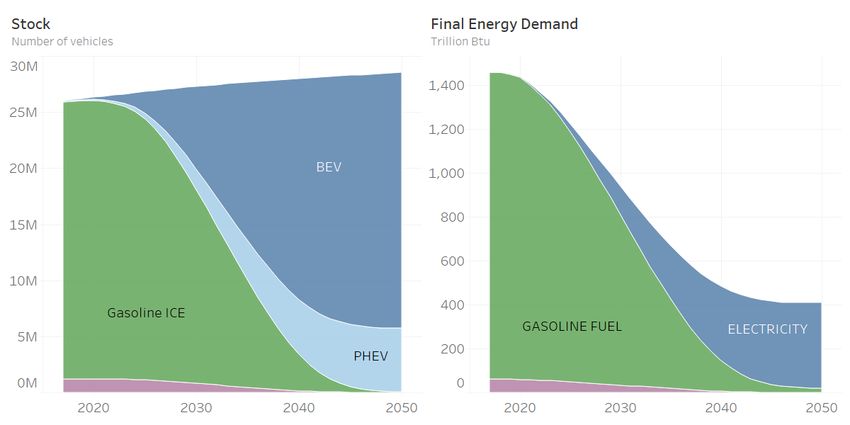
Executive Summary
The states of the northeastern United States – New York, Massachusetts, Connecticut, Rhode
Island, New Hampshire, Vermont, and Maine – have declared their intention to dramatically
reduce their greenhouse gas emissions by mid-century, to levels consistent with the Paris
Agreement’s call to limit human-caused global warming to 2˚C or less. The emission reductions
objectives adopted generally fall in the “80 x 50” range, or 80% below 1990 levels by the year
2050 (Table 1).

Table 1. Mid-century greenhouse gas emission reduction goals in the northeastern U.S.

   State                 2050 Goal

   New York              80% below 1990 levels

   Connecticut           80% below 2001 levels

   Rhode Island          80% below 1990 levels

   Massachusetts         80% below 1990 levels

   Vermont               80-95% below 1990 levels

   New Hampshire         80% below 1990 levels

   Maine                 75-80% below 2003 levels

This study analyzes what achieving an 80 x 50 goal throughout the region (hereafter referred to
as the “Northeast”) implies for the way that energy is supplied and used. It builds upon the 2015
study Pathways to Deep Decarbonization in the United States by the Deep Decarbonization
Pathways Project. The research was sponsored by the Sustainable Development Solutions
Network (SDSN) in collaboration with Hydro-Québec (HQ), and conducted by Evolved Energy
Research (Evolved) using the EnergyPATHWAYS energy system model, with contributions from
SDSN and HQ’s research institute, IREQ.

The analysis has three main objectives:
   1. To understand what changes in energy system infrastructure and technology are required
       to achieve the 80 x 50 goal in the Northeast
   2. To understand the potential effect of expanded Northeast-HQ coordination on the cost
       of achieving the 80 x 50 goal in the Northeast
   3. To determine if potential benefits warrant examination in greater depth, and if so what
       are the right questions, tools, and stakeholders for a Phase 2 study

What changes in energy system infrastructure and technology are required to achieve the 80 x
50 goal in the Northeast?

This question is addressed through the comparison of two scenarios developed for the Northeast.
The first is a reference case, based on the Department of Energy’s Annual Energy Outlook 2017,

                                                                                                    9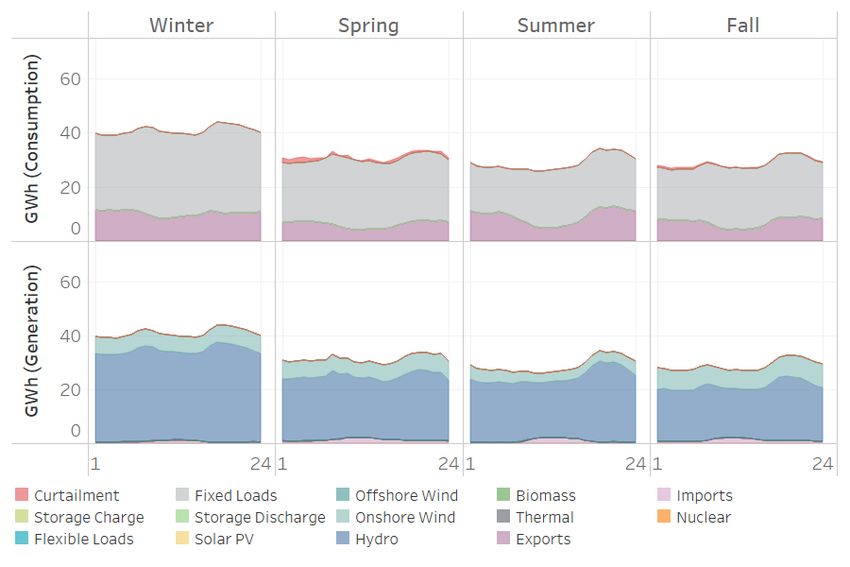
a business-as-usual forecast out to mid-century with a highly detailed representation of energy
service demand, supply infrastructure, and end-use technology, adapted to incorporate currently
implemented policies in the Northeast. This scenario results in emissions that far exceed the 80
x 50 goals. The second scenario is a deep decarbonization pathway (DDP) – a technical blueprint
of sector by sector and year by year changes in the energy system – that achieves the 80 x 50
goal.

The results show that the deeply decarbonized energy system can provide the same energy
services to the economy and daily life – mobility, lighting, heating, cooling, etc. – as the business-
as-usual case. It can be achieved through the ongoing deployment of efficient, low-carbon
technologies that are already commercial, combined with the steady retirement of low-
efficiency, high-carbon technologies. While this transition does not have to be accomplished
overnight, it also cannot be delayed if the mid-century target is to be met. The changes required
are not incremental improvements over the status quo. They are unprecedented and
transformational.

The extent of the transformation is shown by three metrics that represent the three principal
measures needed to reach that 80 x 50 target (Table 2). First, greatly increased efficiency of
energy end use, as indicated by a 40% decrease in energy use per capita between today and mid-
century while maintaining all existing energy services. Second, reaching a very low carbon
intensity of electricity, 29 grams of CO2 per kilowatt-hour, an 87% decrease from current levels.
Third, switching of end uses in buildings, industry, and transportation from direct combustion of
fossil fuels to electricity, represented by a tripling of the electricity share, to 55% of final energy
consumption from 18% today.

Table 2. Metrics for “three pillars” of deep decarbonization, comparing current values to DDP base case

  Pillar                Unit                             2015 value      2050 DDP         % change

  Energy efficiency     Annual per capita energy use     168              101              -40%
                        (MMBtu/person)

  Carbon intensity of Carbon emissions per unit of       228              29               -87%
  electricity         electricity (kg CO2/MWh)

  Electrification of    Electricity share of end use     18%              55%              +210%
  end uses              energy consumption (%)

These changes are sometimes called the three pillars of deep decarbonization, because the
outcome rests on having all three at the same time. When they occur together, there is a
multiplicative effect on emissions reductions. For example, in the case of electric vehicles, electric
drive trains are both more energy efficient than those with internal combustion engines and
displace fossil fuels with near-zero carbon electricity. The same logic holds for the replacement
of natural gas and oil furnaces and water heaters with efficient electric heat pumps. The most
formidable policy challenge on the demand side of the energy system will be attaining the rapid
electrification of end uses.

                                                                                                          10
For the electricity sector, there are two simultaneous requirements. First, there must be a major
increase in electric load, roughly doubling current levels by mid-century. In the DDP base case for
the Northeast, load in 2050 is 86% higher than the reference case, due primarily to electrification
of virtually all light-duty vehicles, plus meeting two-thirds of building space and water heating
demand. Second, there must be a vast increase in low carbon generation. Given current policy
preferences in the Northeast, the DDP base case achieves this with renewable energy rather than
new nuclear or fossil generation with carbon capture and storage. In 2050, two-thirds of all
generation comes from solar PV and wind power, while thermal power plants burn a mixture of
natural gas and biomass-based renewable natural gas to stay within carbon constraints (Figure 1).
Figure 1. Northeast generation mix in 2050 reference case and DDP case
These requirements pose three serious challenges for electricity provision in a Northeast 80 x 50
scenario. First, electricity systems with very high shares of wind and solar generation can have
imbalances between energy supply and demand that are of larger magnitude than can be
addressed with natural gas generation constrained by carbon emission limits. These imbalances
are also on longer time scales (weekly to seasonal) than can be addressed by hourly-to-diurnal
storage technologies such as batteries. Second, an unprecedented buildout of renewable
resources is required to decarbonize electricity generation. This includes a high proportion of
offshore wind in increasingly remote locations to supplement onshore wind and solar PV, as the
best sites for these are utilized or high daytime curtailment makes it difficult to reach higher
penetrations. Third, the cost of generation increases steeply for remote offshore wind, as
transmission costs exceed generation costs, and the cost of balancing resources also increase
steeply when scarce biomass is used as a low-carbon fuel in thermal generation.
11What are the potential effects of expanded Northeast-HQ coordination on the cost of achieving
the 80 x 50 goal in the Northeast?
This question is posed as a response to the electricity sector challenges described above. HQ
already plays an important role in Northeast electricity, exporting 22 terawatt-hours per year of
carbon-free electricity over more than 4000 megawatts of interconnection. This transmission
capacity benefits both the Northeast and Québec as it allows south to north exports at certain
times during the year in combination with the predominantly north to south flow, keeping
transmission utilization rates high. Several factors make expanded coordination an option worth
investigating. First, within Québec there is significant new resource potential for onshore wind
and hydro at relatively low cost within close geographic proximity to the Northeast. Second, the
HQ system, with its large reservoir capacity, has the latent flexibility to provide balancing on both
a daily and seasonal scale.
To analyze potential costs and benefits, the DDP base case was compared to four different
scenarios of expanded Northeast-HQ coordination that also reach the 80 x 50 target. These
scenarios vary along different axes of what “increased coordination” could mean: (i) expanded
exports and transmission capacity between Canada and the Northeast, versus no expansion; (ii)
new hydro resources versus new wind resources, in both cases developed within Québec for
export; and (iii) including the PJM balancing area as a U.S. participant in expanded coordination,
versus including the Northeast only.
These scenarios were compared to the DDP base case in terms of net costs and benefits,
investment requirements, transmission requirements, generation mix, and operational changes
(Table 3). The cases with expanded hydro and expanded wind resources in Québec both show a
net benefit of more than $4.2 billion (current US$) per year. The case with expanded hydro plus
PJM involvement shows a net benefit of almost $5 billion per year, but $1.9 billion of that is
realized within PJM as production cost savings rather than the Northeast as a consequence of
avoided renewable curtailment. The case with expanded transmission capacity has a relatively
small net benefit of $130 million per year.
Table 3. Net benefits in 2050 of four increased coordination scenarios relative to deep decarbonization
base case.
Scenario New New New HQ New HQ Net Benefits
HQ/Northeast NYISO/PJM Hydro for Wind for ($mil/yr.)
Ties Ties Export Export
Expanded Wind +9,090 MW n/a n/a +30 TWh $4,209
Expanded Hydro +9,090 MW n/a +30 TWh n/a $4,380
Transmission Only +9,090 MW n/a n/a n/a $132
PJM Coordination +9,090 MW +3,000 MW +30 TWh n/a $3,099
*$4,993
*Including production cost savings realized in PJM.
12The costs and benefits of coordination are illustrated by the expanded wind case (Figure 2). The
benefits come from replacement of the costliest offshore wind resources that would otherwise
be required with less costly Canadian onshore wind, and from utilization of the HQ system for
balancing, allowing south-north flows of excess solar generation that would otherwise be
curtailed in the Northeast, and avoiding the high cost thermal biomass balancing resource. The
gross benefits of $8.3 billion per year from these savings are partially offset by increased resource
costs (in Québec) and transmission costs (between Québec and the Northeast) of $4.1 billion per
year, resulting in a net benefit of $4.2 billion per year.
Figure 2. Annual costs and benefits in 2050 of expanded wind case relative to base DDP case.
$10,000
$9,000
$8,000 $1,655
$7,000
$914
$6,000 $(2,033)
2014$mil/yr
$5,000
$4,000 $(2,045)
$3,000 $5,718
$2,000 $4,209
$1,000
$-
Avoided OSW Avoided Thermal Avoided Thermal Incremental Incremental Net Benefits
Resource Costs Capital Costs Production Costs Québec Transmission
Wind/Hydro Costs
Resource Costs
Net benefits of more than $4.2 billion per year represent a reduction of more than 6.5% of the
annual incremental cost of electricity generation in the Northeast in the DDP base case. A
sensitivity analysis with offshore wind at 50% of its projected cost in the base case, and HQ wind
at 50% higher cost, reduces net benefits to $300 million per year, while the opposite sensitivity
(50% lower HQ wind cost, 50% higher offshore wind cost) increases them to $8.4 billion per year.
For offshore wind and HQ incremental hydro, the sensitivity results are similar.
The scenario results indicate several potential operational challenges for the HQ system. The
economic benefits of expanded coordination derive primarily from operating HQ’s system as a
regional battery with extensive south-north as well as north-south flows. This takes greater
advantage of the flexibility of the HQ reservoir system, but is a departure from the longstanding
model of fixed schedule electricity exports. These challenges derive partly from changes in the
seasonal timing of peak load in the Northeast under deep decarbonization due to the
13electrification of heating loads, so that peak loads occur in January, coincident rather than
complementary with the HQ system peak, also in the winter. (Figure 3).
Figure 3. Base DDP Case Monthly Electricity Consumption for the Northeast
In addition to a new seasonal operating regime, the daily operating regime also changes
dramatically. Figure 4 shows transmission flows between HQ and the Northeast, illustrating the
evolving nature of imports and exports over time as the Northeast’s generation mix becomes
increasingly inflexible due to higher wind and solar penetrations, and the transfer capability
between the two regions increases. From 2020 to 2050, overall exports from HQ to the Northeast
increase, but the daily pattern becomes more dynamic, with exports ramping down during
sunrise and ramping up during sunset. This pattern reflects the high levels of solar PV generation
in the Northeast, with HQ importing electricity from the Northeast during daylight hours,
particularly during the spring and summer, decreasing HQ hydro generation and increasing
reservoir storage.
14Figure 4 Expanded Wind Case: HQ-Northeast Net Interchange
Note: positive values reflect net exports from HQ to Northeast, while negative values reflect energy flows south-to-
north.
A consequence of increased diurnal swings in imports and exports is potentially much faster
ramping (the rate of increased or decreased generation in MW per hour) of the HQ system than
at present.
Do the potential benefits warrant examination in greater depth, and if so what are the right
questions, tools, and stakeholders for a Phase 2 study?
The scale of potential benefits shown by this analysis – greater than 6.5% of the incremental
generation cost of deep decarbonization – indicates that a deeper investigation is warranted. The
key topics and analytical needs of a prospective Phase 2 study are suggested by the findings, and
the limitations, of this initial analysis. The main issues pertain to scenario design, cost, operations,
and environment.
(1) The DDP base case used in this study is not the only or best DDP for the Northeast. It was
designed to illustrate general features of DDPs that have proven to be robust in similar studies,
such as the “three pillars,” and provide boundary conditions for the expanded coordination
analysis. It reflects current policy preferences in the region, but not necessarily the best possible
resource mix. A Phase 2 study should develop a wider set of technology pathways and ranges of
assumptions about cost and performance, with inputs from regional stakeholders and experts.
15(2) The expanded coordination scenarios developed for this study are not optimized for cost. The
resource builds, export levels, and transmission additions were selected to illustrate a range of
options for expansion of Northeast-HQ coordination, but were not meant to represent the best
possible economic outcome. Potential benefits could be larger than these scenarios show. In
addition, stability and contingency assessments are needed to understand the implications of
tripling interties between the Northeast and HQ. A follow-on study should feature optimal
capacity expansion, and greater transmission representation in production cost and power-flow
modeling, accompanied by extensive sensitivity and uncertainty analysis.
(3) The implications of the operational challenges for the hydro system described above – major
changes in the seasonal and diurnal timing and ramp rates for the filling and emptying of
reservoirs - will require extensive hydrological and hydro system operations modeling. Potential
impacts of climate change on hydrologic flows should also be factored in.
(4) The siting and development of new hydro or wind resources and transmission upgrades will
require environmental assessment on both sides of the border. Prior to assessment of actual
proposed projects, an initial scoping of potential environmental limitations can help provide
constraints and cost estimates needed for Phase 2 modeling and scenario design.
A Phase 2 study would aim to inform the discussions among key regional stakeholders that would
be required before any concrete steps toward expanded coordination are made. A central issue
is how system-wide benefits, costs, and risk would be allocated among the parties, and what
changes in current wholesale market and RTO rules and procedures would be necessary to allow
greater cross-border integration of planning, procurement, and operations.
It should be acknowledged that the vision of expanded coordination in the present study is
narrower than what could be imagined in an urgent mobilization to rapidly reduce greenhouse
gas emissions. A larger vision could include fully integrated regional planning and resource
markets, and possibly synchronization and full AC interconnection. However, given the limits of
historical levels of coordination – including among the states and regional transmission
organizations (RTOs) of the Northeast, as well as across the international border – the objective
of a limited expansion makes sense as an initial Phase 2 focus. A key to success will be the
participation of regional stakeholders and experts from government, utilities, RTOs, labor, and
environmental organizations, both in technical discussions and in creating a shared vision of how
to achieve a low carbon future.
16Introduction The Paris Agreement, signed by 195 countries, calls on the international community to limit human-caused global warming to “well below 2˚C” (
technically rigorous scenario analysis that compares a deep decarbonization pathway (DDP) to a
business-as-usual reference case, in terms of energy mix, infrastructure, and technology. The
reference case is based on the Department of Energy’s Annual Energy Outlook 2017, the
authoritative long-term projection of the U.S. government. The DDP base case for the Northeast
was developed based on the U.S.-wide scenarios in Pathways to Deep Decarbonization in the
United States. Both the reference case and DDP base case were modified to include current
policies of the Northeast states, ranging from clean energy standards to nuclear power plant
retirements (see Table 5). These scenarios assume a status quo role for Canadian hydro, meaning
that they include existing transmission capacity and exports plus currently approved expansion
plans.

The second objective is to understand the potential advantages and challenges of greater
coordination between the Northeast and Canada, in particular the Hydro-Québec system, in
achieving the deep decarbonization goal. This is addressed by comparing the DDP base case to
different scenarios of expanded Northeast-Hydro-Québec coordination that also reach the 80 x
50 emissions target. These scenarios vary along several different dimensions of what “increased
coordination” might include:
    1. expanded exports and transmission capacity between Canada and the Northeast, versus
        no expansion;
    2. development of incremental hydro versus incremental wind resources in Canada for
        export; and
    3. inclusion of the PJM balancing area as U.S. participants in expanded coordination, versus
        inclusion of the Northeast only.
These scenarios are compared to the DDP base case in terms of net cost/benefits, investment
requirements, infrastructure changes, energy mix, and operational changes.

Hydro-Québec already plays an important role in Northeast electricity, exporting 22 TWh
annually over more than 4000 MW of interconnection. This transmission capacity allows south
to north exports at certain times to go with the predominantly north to south flow, which has
kept transmission utilization high and costs low. Several factors make increased coordination an
interesting option. First, within Québec there is significant new resource potential within close
geographic proximity to the Northeast. Second, electricity systems with very high levels of wind
and solar can have energy imbalances on both short and long (seasonal) time scales, while the
Hydro-Québec system, with its large reservoir capacity, has the latent flexibility to provide such
balancing. However, expanding coordination between the Northeast and Canadian hydro is a
complex issue, which requires in-depth consideration of appropriate boundary conditions,
stakeholders, objectives, assumptions, and constraints, touching on such sensitive topics as
operational changes, transmission expansion, wholesale market rules, environmental
sustainability, cross-border and cross-state jurisdiction, and allocation of costs and benefits
among parties. Accordingly, the study is divided into two phases, which approach these issues
sequentially.

In the first phase, which the current study describes, the research question is: what are the
changes in energy, emissions, and system-wide costs and benefits of four different increased-
coordination scenarios versus the base DDP scenario? The first phase analysis has been
conducted using an energy system model called EnergyPATHWAYS. EnergyPATHWAYS has a track

                                                                                                     18
record in developing other national and state-level DDPs, and its features – rigorous energy balance across all sectors and fuel types, extensive performance and vintage detail on both supply and demand side equipment stocks, and an hourly electricity dispatch – make it an appropriate tool for addressing the first phase research questions. A key outcome of this research is determining whether the potential benefits of increased coordination warrant further study in a second phase which could address the more complex questions mentioned above regarding the specifics of increased coordination. Because the changes from the status quo could be large, the analyses needed may include, but are not limited to, optimal capacity expansion modeling, power flow modeling, production-cost modeling, hydrology and hydro operations modeling, and environmental impact modeling, along with forward-looking analyses of wholesale market rules, cross-border law and regulation, and energy policies. While this might sound daunting, if Northeast states’ commitment to
Methodology
Electricity is at the center of economy wide decarbonization and undergoes transformation both
in electricity supply and in demand due to newly electrified loads1. While questions of increased
coordination primarily deal with the electric power sector, the overall context and goal of
exploring the broader implications of decarbonization in the Northeast required an economy
wide model.

To provide both the energy system breadth and needed detail in electricity, a model called
EnergyPATHWAYS was used [8]. EnergyPATHWAYS is an open-source, bottom-up energy sector
model with stock-level accounting of all consuming, producing, delivering, and converting energy
infrastructure and was specifically built to investigate energy system transformations. The model
leaves most energy system infrastructure deployment decisions to the user; thus, it is
appropriate to think of EnergyPATHWAYS as a complex accounting system or simulation model
that keeps track of and determines the implications of detailed user decisions.

EnergyPATHWAYS and similar bottom up models have a rich history in scenario planning
exercises. A progenitor to EnergyPATHWAYS implemented on a different platform but with a
similar conceptual approach was first used in California to explore energy system transformation
[9, 10] and to analyze the U.S. in the Deep Decarbonization Pathways Project [1]. Since then,
EnergyPATHWAYS has been used in the Risky Business Reports [4], studies for Washington State
[11], Portland [12], the U.S. Midwest Region (RE-AMP), and Mexico [13], and in NREL’s
Electrification Futures Study [14], as well as multiple private studies in the U.S. and Europe. What
all of these studies have in common is the use of user-driven scenarios to explore the cost,
energy, and emissions implications of different energy system decisions.

EnergyPATHWAYS Overview
Broadly speaking, EnergyPATHWAYS can be divided into a demand side and supply side, the
former calculating energy demanded (E.g. kWh electricity and MMBtu natural gas) by different
services (e.g. water heating and passenger vehicle travel), the later determining how each energy
demand is met (e.g. natural gas extraction, power plants, transmission wires, and gas pipelines).
Operationally this distinction is important in the model because the demand and supply sides are
calculated in sequence.

Beginning on the demand side, the model starts with a set of inputs termed demand drivers.
These are variables such as population or the value of industrial shipments and can be thought
of as the skeleton upon which the rest of the model calculations depend. Ideally, demand driver

1
  The importance of setting appropriate boundary conditions for electricity in this study can be most clearly seen
when considering electrification of heating and the impact this has on hourly load shapes. Buildings in Québec are
today primarily all electric due to a history of low-cost hydro and encouraged load growth making the system strongly
winter peaking. Today the Northeast has summer peaking systems and complements loads in Québec well. This
synergy; however, does not last when considering what must happen in the Northeast to meet carbon goals. To miss
the fact that the Northeast will also become winter peaking when decarbonizing is to potentially overstate the value
of coordination due to incorrect assumptions about load complementarity.

                                                                                                                        20
projections for future years are given, but if only historical data is available, EnergyPATHWAYS
will use different regression techniques to project each variable across all model years.
Demand drivers are the basis for forecasting future demand for energy services. For example, if
calculating the weight of laundry washed in residential households annually, a 10% increase in
the demand driver, number of households, will result in a similar increase in the service demand,
weight of laundry. Along with service demand, technology stocks that satisfy each service
demand are tracked and projected into the future. The efficiency of each stock type for providing
services is referred to as the service efficiency, fuel economy being a classic example. Total energy
demand can be calculated by dividing service demand by service efficiency and summing across
each service demand category, referred to in the model as demand subsectors. The demanded
energy will be in one of many different fuel types (e.g. electricity or natural gas) depending on
the technologies deployed and will be specific to a geography, customer category, and even hour
of the year, as is the case with electricity.
Once energy use is calculated, the supply-side calculations of the EnergyPATHWAYS model begin.
Mathematically supply-side calculations are done with an energy input output matrix that
connects the flows of energy between supply nodes that produce or deliver energy. Input-output
tables are frequently used by economists and in life-cycle assessment (LCA) work, and
fundamentally calculations in EnergyPATHWAYS are no different though with several unique
characteristics. First, the supply-side of the EnergyPATHWAYS proceeds one year at a time and
the coefficients in the input-output matrix are updated annually as parameters in each supply
node change. Second, in each calculation year, a detailed electricity dispatch is used to inform
how much of each supply node goes into producing one unit of electricity (e.g. how much coal
vs. gas) and how much new generation, transmission, and distribution capacity is needed for a
reliable system. The inputs for electricity dispatch are derived from the rest of the supply side
(e.g. heat rates of different power plants) and from the demand-side where hourly (8760)
electricity profiles are produced. The electricity dispatch includes the ability to model long and
short duration energy storage, thermal resources, hydroelectric plants, renewable resources,
must-run generation, transmission, flexible load, and electric fuel production, such as hydrogen
from electrolysis.
With the updated coefficients from the electricity dispatch and change in supply technology
stocks, emissions factors [15] from each fuel type by location are calculated and combined with
final energy demand to estimate emissions for future years. All renewable energy sources (solar,
wind and hydro) are assumed to have an emissions factor of zero.
21Figure 5. EnergyPATHWAYS model flow diagram for a calculation of energy system emissions.
Emissions
Demand Side Energy Use
Embodied Emission Supply Side
Factors
IO Matrix
Electricity
Linking Supply
Service Demands Service Efficiency Dispatch
Nodes
Technology Technology Technology Technology
Demand Drivers
Efficiency Stocks Efficiency Stocks
The above description of methodology gives a description of the supply and demand sides of
EnergyPATHWAYS at a high level. The following section gives more detail on the electricity system
representation that was used to evaluate the benefits of Northeast-HQ coordination.
Electricity Representation
The electricity dispatch starts on the demand-side of EnergyPATHWAYS with the buildup of
subsector and technology-level load shapes, calibrated in a historical year to match a known top-
down load shape. In future years, as the relative contributions of different end-uses change, the
model will produce different end-use load shapes. So, for example, increases in electric space
heating will cause larger winter peaks given the contribution of heating in winter hours. Likewise,
the penetration of LED lighting will reduce the night-time peak due to their higher efficiency, as
shown in Figure 6.
Figure 6 Process for constructing load shapes bottom-up to reflect underlying changes in the patterns for
energy service demand.
Unitized Lighting
0.7 Shape
0.6
Total Residential
X =
0.5 Projected
0.4 Final Energy for Lighting
lighting shape
+
EJ
0.3
0.2
0.1
0
Projected EV
2014
2016
2018
2020
2022
2024
2026
2028
2030
2032
2034
2036
2038
2040
2042
2044
2046
2048
2050
shape
+
Projected
heating shape System
+
Projected dryer
Load
shape
+
80 demand
subsectors =
22These subsector loads are aggregated to sectors and mapped to distribution feeder types, which
are stylized representations of distribution equipment stocks that have both a revenue
requirement and a marginal cost for increasing simultaneous peak load. In addition to these
feeder-level loads, distributed generation such as combined heat and power (CHP) and
distributed solar PV resources is included at the feeder-level.
The distribution feeder loads and resources are combined with a representation of the bulk
transmission system that has loads, generators, and transmission ties between zones. The zonal
topology used for this work is shown in Figure 7. Losses and hurdle rates between zones were
used to more accurately represent transmission flows. Because Québec is its own
interconnection and DC links are necessary for power flow to New York or New England, a loss
rate of 6% was used, higher than the 4% assumed between New York and New England.
Loads and resources in Ontario were not explicitly modeled. Historically, Québec exports net
energy to Ontario and Ontario exports net energy to New York. These net energy flows were
maintained in future modeled years and scheduled endogenously, respecting existing
transmission constraints.
Figure 7 Network topology in the EnergyPATHWAYS electricity dispatch optimization.
Quebec
[HQ]
Ontario New
[IESO]
England
[ISO-NE]
New York
[NYISO]
Capabilities between zones
PJM/MISO varies by year and scenario
The dispatch of generators (including hydro), energy storage, flexible load, and transmission
flows is solved in a linear optimization with a dispatch window of approximately one week. The
23optimization minimizes the operational cost to serve load across all zones and includes penalties
on setting new distribution, transmission, or system generation peak loads2.
The weekly energy budgets for long duration energy storage and hydro resources with inter-
seasonal flexibility are solved in an initial optimization. Because of the size of the hydro reservoirs
in Québec and operational flexibility, the resource was allowed to shift between months subject
to an annual water budget and a seasonally specific minimum generation requirement3. Hydro
in the U.S. was constrained by monthly budgets based on historical operations and minimum and
maximum capacity constraints tied to this budget. Run-of-river hydro in the U.S. and Québec
were modeled with a fixed profile shape.
Outputs from the electricity dispatch in EnergyPATHWAYS include hourly dispatch for all
generators (thermal & storage), production costs, transmission flows, renewable curtailment,
infrastructure requirements to maintain reliability, and updates to the input-outwork framework
discussed prior.
2
One purpose for separating feeder loads from the bulk power system is to realistically constrain the behavior of
distributed resources such as flexible load to provide balancing at the system level since such loads may be
constrained on the distribution level.
3
50% of nameplate minimum generation requirement for Québec dispatchable hydro in May and June, and 30% in
all other months
24Scenarios
Seven scenarios are used to explore the implications of deep decarbonization and then the
costs and benefits of increased coordination, shown in Figure 8. The scenarios are organized into
four quadrants (shown in different colors). The two axes that create the quadrants are the
degree to which the energy economy is decarbonized, and the degree of coordination between
the Northeast and Hydro-Québec (NE-HQ). Costs and benefits are calculated by comparing one
quadrant to another, with each comparison answering a different set of questions. As noted
previously, the term coordination is used broadly to refer to both an increase in coordinated
infrastructure (new transmission or resources in Québec to serve U.S. load) and changes to
operations to reduce total system cost.
Figure 8 Scenarios to assess the costs and benefits of Northeast U.S. coordination with Québec under a
variety of sensitivities including deep decarbonization pathways (DDPs)
Low decarbonization Deep decarbonization
Carbon saved with current Cost saved with ambitious U.S.
U.S. climate policy. climate policy.
With expanded HQ coordination
With expanded HQ coordination (e) Expanded (f) Transmission
Hydro Only
(b) Reference
with Expanded
Coordination
Hydro (d) Expanded (g) PJM
Wind Coordination
With present-day With present-day
HQ hydro imports HQ hydro imports
(a) Reference (c) Base DDP
Decarbonization
Within the scenario matrix shown in Figure 8, the natural place to begin descriptions is with the
Reference scenario (a), which is based on the EIA’s 2017 Annual Energy Outlook (AEO) [16] with
select updates as described in Table 5. The Reference scenario is designed to represent current
energy policy in the U.S. All other study scenarios start with the Reference scenario (a) and then
introduce changes on both the supply and demand sides of the energy system that get tracked
using EnergyPATHWAYS. Table 4 lists the similarities and differences between scenarios by
category. Most inputs and assumptions are common across all scenarios, only the deployment of
technology and infrastructure differ.
25Table 4 Contrasting similarities and difference between scenarios
Constant Differs
across across
scenarios scenarios
Drivers of energy consumption (e.g. population)
Energy services (e.g. vehicle miles traveled)4
Technology cost and performance
Initial infrastructure & initial technology stocks
Electricity dispatch settings (e.g. hurdle rates)
Technology sales shares (e.g. heat pump sales)
New energy infrastructure (e.g. new transmission)
A summary of assumptions for the Reference scenario and the Reference with Expanded hydro
scenarios is shown in Table 5. In Scenario (b) Northeast-HQ transmission ties are increased by 9
GW and an additional 30 TWh/year of hydro is built in Québec for export. The increase in
resources for export start in 2025 and grow linearly to 2050, shown in Figure 9. By comparing
scenario (a) with scenario (b) the GHG reduction from coordination under current policy is
calculated. These values are input assumptions to the modeling and are not a result themselves.
Each was selected after soliciting input from external advisors and after some modeling iteration
to ensure the transmission ties were appropriate for the quantity and pattern of energy exports
in a high renewables scenario.
4
Equal energy services between all scenarios is a design principle used in the original U.S. DDPP scenarios to show
that deep decarbonization is technically achievable without relying on conservation measures that are difficult to
cost or validate in a modeling context.
26Table 5 Summary of assumptions for the scenarios representing current U.S. climate policy.
Current U.S. Climate Policy
(a) Reference (b) Reference with Expanded Hydro
HQ exports to Northeast 2015: Hydro = 22.4 Hydro = 22.4
(TWh/yr) 2050: Hydro = 22.4 Hydro = 52.4
Existing capacity: 4,115 MW Expanded capacity:
2015 = 4,115; Post 2025 =
HQ interconnection capacity to 6,115; Post 2030 = 7,205; Post
Northeast (MW) 2035 = 9,205; Post 2040 =
11,205; Post 2045 = 13,20
+9,000 MW export capability
Northeast inter-connection cap. Existing 3,075 imports, 1,500 exports – consistent with NY long-term
to PJM & MISO (MW) planning assumptions
Nuclear Fleet (MW) AEO 2017 projections* reflect Indian Point 2 & 3 retirements in 2020 &
2021. Capacity of 9,500 MW in 2015 decreases to 5,100 MW by 2050.
* U.S. Department of Energy’, Annual Energy Outlook 2017.
Northeast non-hydro renewable -NY’s Clean Energy Standard (50% of generation by 2030)
energy (% of total generation) -NY and Mass. Offshore Wind Mandates (2,400 and 1,600 MW, respectively)
Eight-hour bulk battery storage
None
(MW)
Figure 9. Expanded HQ-Northeast coordination transmission build. Existing transmission capacity is
increased by a factor of 3.2 by 2050, starting in 2025.
Load in Québec was assumed in all scenarios to grow by 0.42% per year for a total increase of
28.7 TWh between 2015 and 2050 [17]. Hydro-Québec was assumed in the modeling to build
resources in the Reference and Base DDP scenarios to both satisfy internal loads and to maintain
net exports to the region at present day levels (22.4 TWh). It was assumed through a combination
27of efficiency improvements on existing hydro generators and expected rainfall increase by 2050,
due to climate change, a total of 15 TWh new hydro energy was possible at low cost and with no
new impoundments [18]. In scenarios a, c, d, & f the remainder of energy to serve internal load
came from onshore wind, and thus none of these scenarios were assumed to require new
impoundments. Scenarios b, e, & g require new hydro from bins 2-4, as shown in Table 6.
Table 6 Assumed dispatchable hydro potential and cost in Québec5
Hydro Bin Potential Levelized Fixed Cost Levelized Cost of
(TWh) ($/kW-yr) Electricity ($/kWh)
1 157 Current: 106 Current: 0.02
Post-2030: 133 Post 2030: 0.025
2 10 372 0.07
3 10 531 0.10
4 15+ 690 0.13
The Deep Decarbonization Pathways (DDPs), which make up the bulk of the scenarios match the
stated GHG reduction ambition for most Northeastern states shown in Table 1. As noted, the
steps for decarbonizing the economy are colloquially known as the three pillars and have been
well documented in past studies [11, 9, 1, 12]. In brief, these pillars are: (1) using energy more
efficiently; (2) switching energy end-uses from fossil fuels to electricity or electricity derived fuels
(3) switching to zero-carbon electricity sources. Each pillar is mutually supporting – energy
efficiency reduces costs and the scale of infrastructure build that would otherwise be required –
fuel switching reduces direct GHGs from transportation, buildings, and industry that are large in
aggregate – and carbon free energy in electricity eliminates upstream emissions from
electrification. Together they create a cohesive strategy to meet 2050 (and beyond) GHG
reduction goals, and based on this and past studies, without need for early retirements and with
reasonable cost [1].
Within the three-pillar framework, multiple different technology pathways exist that reach
carbon reduction targets [1]. For this study, a single technology pathway is highlighted and
sensitivities with respect to Northeast-HQ coordination conducted. The Base DDP was designed
to be the technological and political frontrunner among stakeholders and is characterized by high
wind and solar penetrations with energy storage, battery electric vehicles in transportation, and
electrification of heating in buildings using heat pumps. Biomass supplies are used to partially6
decarbonize the pipeline to provide a low carbon fuel for industry & electricity and to create
biodiesel for heavy duty transportation. We note here that this represents one of many possible
technology pathways to deep decarbonization and each will show a different set of benefits from
5
Current dispatchable hydro is 144 TWh. The remainder of hydro bin one requires no new impoundments but
instead comes from efficiency improvements and a wetter climate by 2050.
6
Pipeline gas and diesel fuel usage remains too large for available biomass to completely displace.
28Northeast-HQ coordination. A further phase of this work could be used to explore these in more
detail7.
The detailed summary of DDP scenario assumptions are shown in Table 7. Scenarios (d) through
(g) are Northeast-HQ coordination sensitivities on the Base DDP scenario (C). For all DDP
scenarios, the steps taken to decarbonize the demand-side are identical with benchmarks for the
most important subsectors shown below and discussed in the Deep Decarbonization Scenario
Results.
All expanded coordination scenarios (d) through (g) include 9 GW of expanded transmission by
2050, matching the magnitude and timing of expansion in the Reference with Expanded Hydro
scenario and shown in Figure 9. Each coordination sensitivity instead differs with respect to the
type of resources built in Québec.
The Expanded Wind scenario includes 30 TWh of new wind exports. The Expanded Hydro and
PJM Coordination scenarios both involve an equal amount of energy exports, but from new
dispatchable hydro. The Transmission Only scenario instead keeps existing net energy exports
from Hydro-Québec (matching the Base DDP) but still adds the new transmission, the purpose of
which is to determine the value of balancing high levels of renewables using both imports from
and exports to HQ absent any additional energy.
The PJM Coordination scenario is distinguished through an additional 3 GW of import/export
capability between NY and PJM. The purpose of this scenario is to show how the benefits of
increased Northeast-HQ coordination change as competing transmission ties between the
Northeast and the rest of the U.S. are strengthened.
7
Alternatives that maintained more electricity supply flexibility (nuclear or carbon capture and storage) or
introduced higher demand for seasonally flexible loads (hydrogen electrolysis) would help reduce the need for or fill
the niche that Hydro-Québec coordination plays in scenarios d-g. Such scenarios could be more costly, risky, or
deemed worse for other reasons, and thus, may be less optimal overall.
29Table 7 Summary of assumptions for the deep decarbonization pathways scenarios.
DDP reaches 80% Reduction in CO2 Emissions by 2050
(c) Base DDP (d) Expanded Wind (e) Expanded Hydro (f) Transmission Only (g) PJM Coordination
HQ exports to Hydro = 22.4 Hydro = 22.4 Hydro = 22.4 Hydro = 22.4 Hydro = 22.4
2015:
Northeast Hydro = 22.4 Hydro = 22.4 Hydro = 52.4 Hydro = 22.4 Hydro = 52.4
2050:
(TWh/yr) Wind = 30
HQ Existing capacity: Expanded capacity:
interconnection 4,115 MW 2015 = 4,115; Post 2025 = 6,115; Post 2030 = 7,205; Post 2035 = 9,205; Post
capacity to 2040 = 11,205; Post 2045 = 13,20
Northeast (MW) +9,000 MW export capability
Northeast inter- Existing 3,075 imports, 1,500 exports – consistent with NY long-term planning Additional 3,000
connection cap. to assumptions MW of
PJM & MISO (MW) import/export
Nuclear Fleet AEO 2017 projections* reflect Indian Point 2 & 3 retirements in 2020 & 2021. Capacity of 9,500 MW in 2015
(MW) decreases to 5,100 MW by 2050.
* U.S. Department of Energy’, Annual Energy Outlook 2017.
Wind : Wind : Wind : Wind :
Northeast non-
Onshore = 15% Onshore = 15% Onshore = 15% Onshore = 15%
hydro renewable
Offshore = 48% Offshore = 40% Offshore = 48% Offshore = 40%
energy (% of total
Solar PV = 15% Solar PV = 15% Solar PV = 15% Solar PV = 15%
generation)
Subtotal = 78% Subtotal = 70% Subtotal = 78% Subtotal = 70%
Eight-hour bulk NYISO = 15,000 MW
battery storage ISO-NE = 15,000 MW
(MW) Total = 30,000 MW
Commercial space heating 59% of 2050 service met with electricity vs 45% in scenario (a) reference
Space heating
Residential space heating 42% of 2050 service met with electricity vs 14% in scenario (a) reference
Commercial water heating 90% of 2050 service met with electricity vs 7% in scenario (a) reference
Water heating
Residential water heating 92% of 2050 service met with electricity vs 32% in scenario (a) reference
80% battery electric vehicles (BEV), 20% plug in hybrid electric vehicles (PHEV) for 2050 LDV stock
Vehicles 59% BEV for 2050 MDV stock
57% BEV for 2050 HDV stock
The final feature of DDP scenarios with expanded Québec resources for exports (d, e, and g) is
the reduction in offshore wind in New England and New York that is displaced (reduced from 48%
to 40% of the total generation mix), which represents the most expensive portion (further along
the supply curve) of offshore wind resources in the Atlantic. The quantity of onshore wind is at
its achievable potential [19] and remains constant, as does solar PV. Even after being reduced,
offshore wind is the largest source of electrical energy, and could present a major deployment
challenge across all scenarios.
The cost of offshore wind has two components in the modeled scenarios. First is the base cost of
the turbines themselves and second is the cost to provide interconnection with load. The source
of cost estimates for the base capital costs is the NREL Baseline Cost and Performance Data for
Electricity Generation Technologies shown in Figure 10 [20].
30You can also read