NATURAL GAS INFRASTRUCTURE AND ELECTRIC GENERATION: PROPOSED SOLUTIONS FOR NEW ENGLAND
←
→
Page content transcription
If your browser does not render page correctly, please read the page content below
NATURAL GAS INFRASTRUCTURE
                                                  2012. All rights reserved.©Black & Veatch Holding Company 2012. All .

                                                                                                                          AND ELECTRIC GENERATION:
                                                                                                                          PROPOSED SOLUTIONS FOR NEW
                                                                                                                          ENGLAND

                                                                                                                          B&V PROJECT NO. 178511

                                                                                                                          PREPARED FOR
                                          rights reserved.

                                                                                                                          The New England States Committee on
                                       Company

                                                                                                                          Electricity
                                2013. All
                        Veatch Holding

                                                                                                                          26 AUGUST 2013
                Holding&Company
©Black & Veatch©Black

                                                                                                                                                                ®

                                                                                                                                                           ®
The New England States Committee on Electricity I NATURAL GAS INFRASTRUCTURE AND ELECTRIC GENERATION

 Table of Contents
 1.0   Executive Summary ....................................................................................................... 8
       Key Observations and Analysis Results ............................................................................... 8
       Conclusions and Recommendations .................................................................................. 13
 2.0   Introduction .................................................................................................................. 15
       Purpose .......................................................................................................................................... 15
       Scenarios for Evaluating Alternative Outcomes ........................................................... 16
       Solutions for Infrastructure Deficiencies and Sensitivites ....................................... 17
 3.0   Model Approach ........................................................................................................... 19
       Overview ....................................................................................................................................... 19
       Integrated Market Modeling ................................................................................................. 19
       Estimation of Benefits .............................................................................................................. 20
       Benefits to Natural Gas Customers ..................................................................................... 21
       Benefits to Electric Customers ............................................................................................. 21
       Benefits from Reduced Daily Gas Price Volatility ......................................................... 22
 4.0   Base Case Assumptions: Most Likely Drivers of Outcomes .......................... 24
       Natural Gas Demand ................................................................................................................. 24
       Natural Gas Supply .................................................................................................................... 26
       Natural Gas Infrastructure Assumptions ......................................................................... 29
 5.0   Base Case Results: Constraints and Price Impacts........................................... 31
 6.0   Long-Term Solutions .................................................................................................. 34
       Cross-Regional Natural Gas Pipeline ................................................................................. 34
       Economic-Based Canadian Energy Imports ................................................................... 36
       Firm-Based Canadian Energy Imports .............................................................................. 37
       Price Impacts ............................................................................................................................... 38
       Economic Benefits ..................................................................................................................... 42
 7.0   Short-Term Solutions ................................................................................................. 46
       Price Impacts ............................................................................................................................... 47
       Benefits .......................................................................................................................................... 49
 8.0   High Demand Scenario .............................................................................................. 51
       Assumptions ................................................................................................................................ 51
       Price Impacts ............................................................................................................................... 52
       Infrastructure Solutions .......................................................................................................... 54
       Design Day Sensitivity ............................................................................................................. 56
 9.0   Low Demand Scenario ............................................................................................... 60
       Assumptions ................................................................................................................................ 60

 BLACK & VEATCH | Table of Contents                                                                                                                             2
The New England States Committee on Electricity I NATURAL GAS INFRASTRUCTURE AND ELECTRIC GENERATION
Price Impacts ............................................................................................................................... 60
Infrastructure solutions .......................................................................................................... 62
Negative Demand Growth Sensitivity ............................................................................... 63
10.0 Conclusions and Recommendations ..................................................................... 66
Observations and Conclusions ............................................................................................. 66
Recommendations ..................................................................................................................... 68
BLACK & VEATCH | Table of Contents 3The New England States Committee on Electricity I NATURAL GAS INFRASTRUCTURE AND ELECTRIC GENERATION
LIST OF FIGURES
Figure 1 Net Benefits for the Short-Term Solutions................................................................ 11
Figure 2 Net Benefits for the Long-Term Solutions................................................................. 12
Figure 3 Organization of the Three-Phase Study ..................................................................... 15
Figure 4 Map of Solutions Evaluated Under All Three Scenarios ...................................... 18
Figure 5 Integrated Market Modeling Process .......................................................................... 20
Figure 6 Analytical Process used to Assess Market Benefits ............................................... 20
Figure 7 Historical New England Electric and Natural Gas Prices .................................... 22
Figure 8 New England Natural Gas Demand: Base Case........................................................ 25
Figure 9 Lower 48 Natural Gas Demand: Base Case ............................................................... 25
Figure 10 Marcellus Shale Natural Gas Production: Base Case .......................................... 26
Figure 11 Eastern Canadian Production of Natural Gas ........................................................ 27
Figure 12 LNG Imports at Canaport LNG Compared with Henry Hub
Gas Price ............................................................................................................................ 27
Figure 13 LNG Imports at Everett, MA Compared with Henry Hub
Gas Price ............................................................................................................................ 28
Figure 14 Projected North American Natural Gas Supply .................................................... 28
Figure 15 Algonquin Incremental Market Expansion ............................................................ 30
Figure 16 Constitution Pipeline ....................................................................................................... 30
Figure 17 Monthly Algonquin City-Gates Basis to Henry Hub: Base
Case Forecast ................................................................................................................... 32
Figure 18 Daily Algonquin City-Gates Basis to Henry Hub: Base Case
Forecast .............................................................................................................................. 32
Figure 19 Boston Electric Prices: Base Case Forecast ............................................................ 33
Figure 20 Cross-Regional Natural Gas Pipeline Route ........................................................... 35
Figure 21 Projected New England Imports of Canadian Hydro Power:
Economic-Based Energy Imports ............................................................................ 37
Figure 22 Projected New England Imports of Canadian Hydro Power:
Firm Canadian Electric Imports Sensitivity ........................................................ 38
Figure 23 Monthly Algonquin City-Gates Basis to Henry Hub: Base
Case vs. Cross-Regional Natural Gas Pipeline .................................................... 39
Figure 24 Boston Electric Prices: Base Case vs. Cross-Regional
Pipeline Solution ............................................................................................................ 40
Figure 25 Monthly Algonquin City-Gates Basis to Henry Hub: Base
Case vs. Economic- and Firm-Based Energy Imports ..................................... 41
Figure 26 Boston Electric Prices: Base Case vs. Economic- and Firm-
Based Energy Imports .................................................................................................. 42
Figure 27 Cross-Regional Natural Gas Pipeline: Long-Term Benefits
by Consumer Group ...................................................................................................... 43
BLACK & VEATCH | Table of Contents 4The New England States Committee on Electricity I NATURAL GAS INFRASTRUCTURE AND ELECTRIC GENERATION
Figure 28 Net Benefits of Long-Term Solutions........................................................................ 45
Figure 29 Monthly Algonquin City-Gates Basis to Henry Hub: Base
Case vs. Short-Term Solutions .................................................................................. 48
Figure 30 Boston Electric Prices: Base Case vs. Short-Term Solutions ........................... 48
Figure 31 Net Benefits of Short-Term Solutions....................................................................... 50
Figure 32 New England Natural Gas Demand: High Demand Scenario .......................... 52
Figure 33 Monthly Algonquin City-Gates Basis to Henry Hub: Base
Case vs. High Demand Scenario ............................................................................... 53
Figure 34 Boston Electric Prices: Base Case vs. High Demand
Scenario.............................................................................................................................. 53
Figure 35 Monthly Algonquin City-Gates Basis to Henry Hub: High
Demand Scenario ........................................................................................................... 55
Figure 36 Boston Electric Prices: Base Case vs. High Demand
Scenario.............................................................................................................................. 55
Figure 37 Projected January Design-Day Demand .................................................................. 57
Figure 38 Daily Algonquin City-Gates Basis to Henry Hub: Base Case
vs. Design Day .................................................................................................................. 58
Figure 39 Boston Electric Prices: Base Case vs. High Demand Design
Day Scenario .................................................................................................................... 59
Figure 40 New England Natural Gas Demand: Low Demand Scenario ........................... 60
Figure 41 Monthly Algonquin City-Gates Basis to Henry Hub: Low
Demand Scenario ........................................................................................................... 61
Figure 42 Historical and Projected Boston Electric Prices ................................................... 61
Figure 43 New England Gas Demand for Power Generation: Scenario
Comparison ...................................................................................................................... 64
Figure 44 Monthly Algonquin City-Gates Basis: Low Demand
Scenario vs. Negative Demand Scenario............................................................... 64
Figure 45 Boston Electric Prices: Low Demand vs. Negative Demand
Growth Scenario ............................................................................................................. 65
LIST OF TABLES
Table 1 Key Assumptions in Natural Gas Planning Scenarios............................................ 16
Table 2 Solutions Evaluated for Resolving Natural Gas Infrastructure
Deficiencies and Sensitivities .................................................................................... 18
Table 3 New England Gas Supply Infrastructure and Capacities ....................................... 29
Table 4 Base Case Long-Term Solution Cost Benefit Summary ......................................... 44
Table 5 Base Case Short-term Solution Cost Benefit Summary ......................................... 50
Table 6 High Demand Scenario Cost-Benefit Summary ........................................................ 56
Table 7 January Design Day Weather Cost Summary ............................................................. 59
Table 8 Low Demand Cost Benefit Summary ............................................................................. 63
BLACK & VEATCH | Table of Contents 5The New England States Committee on Electricity I NATURAL GAS INFRASTRUCTURE AND ELECTRIC GENERATION Table 9 Total Benefits of the Negative Demand Growth Scenario .................................... 65 BLACK & VEATCH | Table of Contents 6
The New England States Committee on Electricity I NATURAL GAS INFRASTRUCTURE AND ELECTRIC GENERATION

 BLACK & VEATCH STATEMENT
 This report was prepared for the New England States Committee on Electricity (“Client”) by
 Black & Veatch Corporation (“Black & Veatch”) and is based in part on information not
 within the control of Black & Veatch.

 In conducting our analysis, Black & Veatch has made certain assumptions with respect to
 conditions, events, and circumstances that may occur in the future. The methodologies
 Black & Veatch utilized in performing the analysis and making these projections follow
 generally accepted industry practices. While Black & Veatch believes that such assumptions
 and methodologies as summarized in this report are reasonable and appropriate for the
 purpose for which they are used; depending upon conditions, events, and circumstances
 that actually occur but are unknown at this time, actual results may materially differ from
 those projected.

 Readers of this report are advised that any projected or forecast price levels and price
 impacts, reflects the reasonable judgment of Black & Veatch at the time of the preparation of
 such information and is based on a number of factors and circumstances beyond our
 control. Accordingly, Black & Veatch makes no assurances that the projections or forecasts
 will be consistent with actual results or performance. To better reflect more current trends
 and reduce the chance of forecast error, Black & Veatch recommends that periodic updates
 of the forecasts contained in this report should be conducted so recent historical trends can
 be recognized and taken into account.

 Neither this report, nor any information contained herein or otherwise supplied by Black &
 Veatch in connection with the services, shall be released or used in connection with any
 proxy, proxy statement, and proxy soliciting material, prospectus, Securities Registration
 Statement, or similar document without the written consent of Black & Veatch.

 Use of this report, or any information contained therein, shall constitute the user’s waiver
 and release of Black & Veatch from and against all claims and liability, including, but not
 limited to, any liability for special, incidental, indirect or consequential damages, in
 connection with such use. In addition, use of this report or any information contained
 therein shall constitute an agreement by the user to defend and indemnify Black & Veatch
 from and against any claims and liability, including, but not limited to, liability for special,
 incidental, indirect or consequential damages, in connection with such use. To the fullest
 extent permitted by law, such waiver and release, and indemnification shall apply
 notwithstanding the negligence, strict liability, fault, or breach of warranty or contract of
 Black & Veatch. The benefit of such releases, waivers or limitations of liability shall extend
 to Black &Veatch’s related companies, and subcontractors, and the directors, officers,
 partners, employees, and agents of all released or indemnified parties. USE OF THIS
 REPORT SHALL CONSTITUTE AGREEMENT BY THE USER THAT ITS RIGHTS, IF ANY, IN
 RELATION TO THIS REPORT SHALL NOT EXCEED, OR BE IN ADDITION TO, THE RIGHTS OF
 THE CLIENT.

 BLACK & VEATCH | Executive Summary                                                                    7
The New England States Committee on Electricity I NATURAL GAS INFRASTRUCTURE AND ELECTRIC GENERATION

 1.0 Executive Summary
 KEY OBSERVATIONS AND ANALYSIS RESULTS
 Black & Veatch completed a three-phase study to evaluate sufficiency of gas
 infrastructure to support electric-power generation in New England for the years
 2014-2029
 Phase I reviewed published studies on New England’s natural gas infrastructure to identify
 any information gaps leftover from work by other analysts. In Phase I, Black & Veatch
 concluded that New England’s natural gas infrastructure will become increasingly stressed as
 regional demand for natural gas grows, leading to infrastructure inadequacy at key locations.
 Phase II developed scenarios for further analysis based on historical gas demand, electric-
 generation responses and anticipated supply and demand growth for next 15 years.
 Phase III, as delivered in this report, analyzed alternative scenarios to establish cost-benefit
 relationships.

 In the absence of infrastructure and demand reduction / energy efficiency / non-
 natural gas-powered distributed generation solutions, New England will experience
 capacity constraints that will result in high natural gas and electric prices; as noted
 below, in a Low Demand Scenario, no long-term infrastructure solutions are necessary
 Quantitative analyses by Black & Veatch confirmed findings reached previously from review
 of published reports regarding insufficiency of natural gas infrastructure to support reliable
 and affordable electric-power generation in New England. Using integrated modeling of
 natural gas and electric-power markets, separate analyses of a Base Case (most likely
 outcome from current outlooks), a High Demand Scenario (increased gas use through
 market and policy drivers) and a Low Demand Scenario (flat or declining gas use across all
 sectors) provided indications of future price and price-volatility trends in the absence of
 solutions to infrastructure deficiencies.

 Because most natural gas-fired power generation capacity in New England is not supported
 by firm transportation contracts on natural gas pipelines, the cost of gas-fired power
 generation is closely tied to wholesale natural gas prices. Therefore, New England’s
 electricity prices across all ISO New England (ISO-NE) zones are highly correlated with
 regional wholesale natural gas prices that are represented by distribution points known as
 Algonquin Pipeline City-Gates. Traditionally, gas price movements in New England have
 been tracked as the “basis” difference between the Algonquin City-Gates price and the
 national benchmark price defined at the Henry Hub in Louisiana. Black & Veatch adopted
 the Algonquin City-Gates basis as the principal measurement of price movements in
 analyses of the Base Case, High Demand Scenario, Low Demand Scenario and for selected
 short-term and long-term solutions to infrastructure constraints.

 In the Base Case, which assumes electric load growth as projected by ISO-NE and 1.2% gas-
 demand growth annually across all user sectors, the Algonquin City-Gates basis is projected
 to continue winter peaks averaging $3.00 per million British Thermal Units (“MMBtu”) on a
 monthly timeframe and could exceed $9.00-$10.00/MMBtu on a daily basis through the
 winter of 2015-2016. Additional capacity provided by the Algonquin Incremental Market

 BLACK & VEATCH | Executive Summary                                                                    8
The New England States Committee on Electricity I NATURAL GAS INFRASTRUCTURE AND ELECTRIC GENERATION

 (“AIM”) pipeline expansion, to be in service in 2016, is expected to moderate the basis for 5-
 6 years; monthly average basis with AIM in service falls below $2.50/MMBtu (and toward
 $1.00/MMBtu) and daily volatility is greatly reduced from 2017-2022. Significant basis
 increases (in the range of $3.00-$4.00/MMBtu) and highly volatile daily pricing during
 winter months are projected to return in the winter of 2022-2023 as demand grows to
 outpace natural gas delivery capacity serving the region. Monthly average electricity prices
 range from $40 to $60 per megawatt-hour (“MWh”) when the natural gas market is not
 constrained but rise to $70 to $80/MWh during the constrained months. Those high and
 volatile price outcomes are implied even though it was further assumed in the Base Case
 that renewable portfolio standard (“RPS”) targets are fully met and energy-efficiency
 initiatives are successful.

 The High Demand Scenario adopts most of the Base Case assumptions but adds stress to the
 system by assuming a 1.7% per year growth of gas demand, shortfalls in achieving RPS
 targets and early retirement (by five years) of nuclear power plants. In the High Demand
 Scenario, natural gas basis and electricity prices exhibit a pattern similar to the Base Case
 but with higher gas prices. Specifically, the monthly basis is expected to be $2.00-
 $4.00/MMBtu higher and daily prices $3.00-$5.00/MMBtu higher than in the Base Case.
 Likewise, monthly average electricity prices are expected to be $15-$20/MWh higher than
 in the Base Case. Elevated prices are anticipated even though a further assumption makes
 the Maritimes & Northeast Pipeline (“M&NP”) capable of reverse flow on an economic basis
 to meet demand growth from Maine and Maritimes Canada.

 Both in the Base Case and High Demand Scenario, New England could face significant
 reliability issues when natural gas-fired power generators are not able to dispatch as a
 result of the gas pipeline capacity constraints. The interim capacity relief expected from the
 expanded AIM and reversible M&NP pipelines, along with RPS and energy-efficiency
 achievements, will be overwhelmed by demand growth on or about the year 2022, and
 higher-priced supply source from Eastern Canada are introduced.

 In the Low Demand Scenario, infrastructure solutions are not needed or justified. The Low
 Demand Scenario is predicated largely on substantial, ongoing gains in natural gas and
 energy efficiency, and other demand-side management programs, non-natural gas-powered
 distributed resources, and RPS, which result in retreat from expanded use of natural gas
 across all sectors.

 Gas-supply requirements driven by episodes of extremely cold weather can be very
 costly and create significant reliability risks – they aggravate infrastructure
 deficiencies
 Black & Veatch confirmed through analysis that gas demand is highly sensitive to
 requirements placed on reliable delivery of gas to customers, including any prescriptions
 for firm deliverability under highly stressful winter weather conditions. To simulate on a
 broad scale the deliverability requirements faced by local distribution companies (“LDCs”),
 Black & Veatch structured a design-day scenario to mimic the potential impact of an episode
 of extremely cold weather in New England. Model analysis of the hypothetical cold event,
 based on statistically extreme days in winter weather records for New England, indicated

 BLACK & VEATCH | Executive Summary                                                                    9
The New England States Committee on Electricity I NATURAL GAS INFRASTRUCTURE AND ELECTRIC GENERATION

 that higher natural gas and electricity prices would cost New England consumers an
 additional $21 million per day compared with the High Demand Scenario and $24 million a
 day more when compared with the Base Case. Both the Base Case and the High Demand
 Scenario assumed normal (long-term average) winter weather.

 In addition, under the design-day criteria, New England could face a supply deficiency of
 approximately 500 million cubic feet per day (“MMcf/d”) of natural gas in the absence of
 infrastructure resiliency and capacity/delivery-related solutions, thereby creating serious
 reliability concerns for the regional electric power supply.

 Short-term solutions (2014-2016) provide net benefits to New England customers
 Although long-term solutions are required to satisfy needs for gas-fired power reliability
 through 2029, more immediate relief is available from short-term solutions. Dual-fuel
 generation (involving fuel oil as the second fuel) and demand response, as well as short-
 term purchases of liquefied natural gas (“LNG”), could offer sizeable benefits in the near-
 term, considering that infrastructure constraints are expected to occur throughout New
 England until AIM commences service in late 2016.1

 Dual-Fuel and Demand Response together would add 2.3 million MWh of dual-fuel, fuel-oil-
 fired generation coupled with demand response across New England. LNG Imports would
 add 300 MMcf/d of gas imports to existing LNG receiving terminals in Saint John, New
 Brunswick, Canada (Canaport) and Everett, Massachusetts, during the peak winter months
 of January and February.

 Short-term solutions represent an option that could be executed on a year-to-year basis.
 Under the Base Case, the LNG imports solution provides an average benefit of $96-$138
 million per year depending on the contract terms with LNG suppliers while the dual-fuel
 generation and demand response solution provides a net benefit of $101 million per year.
 The chart shown below summarizes year-by-year performance of benefits for the short-
 term solutions.

 1
  Dual-fuel, oil-fired generators must comply with increasingly stringent emission standards in order to be
 permitted, which may influence the extent and duration of some dual-fuel units’ ability to contribute to a
 short-term solution.

 BLACK & VEATCH | Executive Summary                                                                           10
The New England States Committee on Electricity I NATURAL GAS INFRASTRUCTURE AND ELECTRIC GENERATION

                                             Short-term LNG Imports                        Dual Fuel & Demand Response
                $300

                $250

                $200

                $150

                $100
   $ Millions

                 $50

                 $-

                $(50)

          $(100)

          $(150)

          $(200)
                        2014   2015   2016    2017   2018   2019      2020   2021   2022   2023   2024   2025   2026   2027   2028   2029

 Figure 1 Net Benefits for the Short-Term Solutions

 In the absence of greater demand reduction / energy efficiency/ non-natural gas-
 powered distributed generation solutions, a Cross-Regional Natural Gas Pipeline
 solution presents higher net benefits to New England consumers than do alternative
 long-term solutions (2017-2029)
 Black & Veatch examined three different long-term solutions for natural gas infrastructure
 deficiencies, including a major new gas pipeline across New England and two different
 approaches to importing electricity from eastern Canada. The pipeline solution would
 address the needs of direct gas users as well as gas-fired generators whereas the imported-
 electricity options would address deficiencies in electricity supplies and provide relief to
 gas users as a result of demand reduction from gas-fired generators.

 A Cross-Regional Natural Gas Pipeline, with new capacity of 1,200 MMcf/d with a projected
 in-service date of 2017, would originate at the existing Tennessee Gas Pipeline and Iroquois
 Pipeline interconnect in Schoharie County, New York, and terminate at Tennessee Gas
 Pipeline’s interconnect with Maritimes & Northeast Pipeline in Middlesex County,
 Massachusetts. This pipeline is assumed to access gas supplies from existing capacity on
 the Tennessee and Iroquois pipelines as well as from the proposed Constitution pipeline
 which is expected to commence service in early 2015. Gas production is expected to come
 principally from the Marcellus Shale. Black & Veatch estimates that the Cross-Regional
 Natural Gas Pipeline could be constructed for approximately $1.2 billion. Assuming that
 100% of its capacity is contracted, the pipeline could potentially offer a 100% load factor
 transportation rate of $0.45/MMBtu/day.

 An Economic-Based Canadian Energy Imports solution would involve construction of a new
 electric transmission line capable of importing 1,200 megawatts (“MW”) of mainly hydro-
 electric energy from eastern Canada beginning in 2018. The energy imported by New

 BLACK & VEATCH | Executive Summary                                                                                                         11
The New England States Committee on Electricity I NATURAL GAS INFRASTRUCTURE AND ELECTRIC GENERATION
England would be based upon the energy needs and price differentials between New
England and alternative markets. Black & Veatch estimates a construction cost of $1.1
billion for this new transmission line. Levelized over 20 years, the annual cost of service for
this project is estimated to range from $180 to $219 million.
A Firm-Based Canadian Energy Imports solution also would employ a new 1,200-MW
electric transmission line from eastern Canada but coupled with energy sales in New
England through firm contracts (rather than variable spot markets) that would incent
development of additional generation capacity. The construction of power-generation
facilities in Hydro Quebec would cost $170 million per year in addition to the previously
stated cost of the transmission line.
In the long-term, both the Cross-Regional Natural Gas Pipeline and the Economic-Based
Energy Imports solutions offer significant benefits in eliminating market constraints even
though they incur near-term losses from capital investments in new infrastructure.
However, the benefits offered by the Cross-Regional Natural Gas Pipeline solution are
substantial and increase significantly over time. In the Base Case, the Cross-Regional
Natural Gas Pipeline offers an average annual net benefit of $118 million per year, almost
twice the net benefits contributed by the Firm-Based Canadian Energy Imports solution. In
the High Demand Scenario, the Cross-Regional Natural Gas Pipeline can provide an average
annual net benefit of $340 million per year compared to the $123 million per year average
annual net benefit that could be obtained with the Firm-Based Energy Imports solution.
The chart shown below summarizes year-by-year performance of benefits for the long-term
solutions under the Base Case.
Cross-Region Pipeline Economic-Based Canadian Electric Imports
Firm Contract-Based Canadian Energy Imports
$400
$300
$200
$ Millions
$100
$-
$(100)
$(200)
2014 2015 2016 2017 2018 2019 2020 2021 2022 2023 2024 2025 2026 2027 2028 2029
Figure 2 Net Benefits for the Long-Term Solutions
BLACK & VEATCH | Executive Summary 12The New England States Committee on Electricity I NATURAL GAS INFRASTRUCTURE AND ELECTRIC GENERATION Under the Low Demand Scenario, the AIM project is able to successfully eliminate the short- term infrastructure constraints in New England and regional natural gas and electricity prices remain stable after AIM commences service. This scenario offers New England customers’ average cost savings of $411 million per year compared with the Base Case. As no significant infrastructure constraints are observed under the Low Demand Scenario, none of the infrastructure solutions applied in other scenarios yielded a positive net benefit for the analysis period. For most or all prospective solutions, the majority of the benefits apply to New England electric customers Black & Veatch separately calculated the benefits to New England natural gas and electric customers as a result of infrastructure additions. For the Base Case, with the Cross-Regional Natural Gas Pipeline solution, $281 Million (95%) of the averaged benefits realized each year can be attributed to electric customers and $14 million (5%) to natural gas end-use customers. These results would follow from the general practice that LDCs typically contract for gas supplies at production basins and have firm pipeline capacity to transport supplies into New England while only limited amounts of gas are purchased at monthly or daily prices near or within New England. On the other hand, a majority of electric generators typically make fuel purchase and dispatch decisions based on regional daily prices and generally purchase gas delivered to a city-gate distribution point. CONCLUSIONS AND RECOMMENDATIONS Short-term and long-term solutions are needed to relieve the natural gas market constraints in New England under the Base Case and High Demand Scenario Black & Veatch recommends that a combination of short-term (2014-2016) and long-term (2017 and later) solutions are necessary to address natural gas infrastructure deficiencies that place future reliability of electric-power generation at risk in New England. Based on the findings of this report under the Base Case and High Demand Scenario, and assuming the study assumptions reasonably reflect future market conditions, Black & Veatch recommends the construction of a Cross-Regional Natural Gas Pipeline as a long- term solution. Through the construction of incremental pipeline capacity, this project has the potential relieve New England’s gas-electric reliability issues through at least 2029. As for short-term measures, Black & Veatch recommends a strategy that includes immediate deployment of dual-fuel generation, demand response measures and the seasonal purchase of LNG cargoes. Even after long-term solutions are in place, short-term solutions can be deployed to mitigate infrastructure constraints that occur from year-to- year and in specific New England sub-regions as a result of shifting demand loads and changes in area growth rates and weather. No long-term infrastructure solutions are necessary under the Low Demand Scenario Black & Veatch recommends that no long-term infrastructure solutions should be implemented should the Low Demand Scenario manifest. BLACK & VEATCH | Executive Summary 13
The New England States Committee on Electricity I NATURAL GAS INFRASTRUCTURE AND ELECTRIC GENERATION

 Black & Veatch further recommends that the implementation of short-term solutions at a
 smaller scale than presented in this report should be considered to mitigate potential
 infrastructure constraints in the near term.

 BLACK & VEATCH | Executive Summary                                                                    14
The New England States Committee on Electricity I NATURAL GAS INFRASTRUCTURE AND ELECTRIC GENERATION

 2.0 Introduction
 PURPOSE
 This report concludes the final phase of a three-phase study commissioned by the New
 England States Committee on Electricity (“NESCOE”) to assess the adequacy of New
 England’s natural gas infrastructure to serve the region’s growing electric generation needs
 (Figure 3). This report was developed from key findings in the earlier two phases:

     •   Phase I (December 2012): Black & Veatch concluded from review of available
         analyses that New England’s natural gas infrastructure is not adequate to serve the
         electric sector, and identified information gaps that should be filled to better inform
         policymakers.

     •   Phase II (April 2013): Black & Veatch assessed the natural gas infrastructure
         adequacy of fourteen New England sub-regions, estimated the duration and
         magnitude of potential capacity constraints for each sub-region and defined three
         scenarios for analysis of future supply and infrastructure stresses. Summary-level
         estimates of costs were presented for a range of potential solutions to supply and
         infrastructure deficiencies.

 This report presents Black & Veatch’s findings regarding the cost and benefits of potential
 infrastructure solutions.

 Figure 3 Organization of the Three-Phase Study

 BLACK & VEATCH | Introduction                                                                         15
The New England States Committee on Electricity I NATURAL GAS INFRASTRUCTURE AND ELECTRIC GENERATION
The analysis methodology (Section 3.0) and major assumptions (Section 4.0) are explained
before results are presented (Sections 5.0, 6.0, 7.0, 8.0, and 9.0). Section 10.0 summarizes
conclusions and recommendations.
SCENARIOS FOR EVALUATING ALTERNATIVE OUTCOMES
Black & Veatch found in Phase I that New England’s natural gas infrastructure will
become increasingly stressed as regional demand for natural gas grows, leading to
infrastructure inadequacy at key locations. Therefore, in Phase II scenarios were
developed to support quantitative elaboration of future stresses on the supply and
infrastructure to deliver natural gas to electric-power generators (Table 1). Phase III
presents results of detailed modeling regarding these scenarios.
All scenarios addressed combined effects of the respective drivers in the electric-power and
natural gas market segments. The Base Case represents Black & Veatch’s view of the most
likely development scenario given current demand growth, economic and regulatory
outlooks. It forms the basis for crafting solutions for the supply and infrastructure
deficiencies. For comparison, a High Demand Scenario accommodates higher than current
demand growth, especially for gas, along with lags in other types of power sources. Lastly, a
Low Demand Scenario examines overall weak growth in power and gas demand.
Table 1 Key Assumptions in Natural Gas Planning Scenarios
FUNDAMENTAL BASE CASE HIGH DEMAND LOW DEMAND
FACTOR SCENARIO SCENARIO
Electric Power Drivers
Load Growth As projected by the 2013 Same as Base Case Limited demand
ISO-NE Forecast Report of growth
Capacity, Energy, Loads and
Transmission 2013 – 2022
(CELT)
Energy Efficiency As projected by the 2013 Energy Efficiency Completely offsets
ISO-NE Forecast Report of declines slightly from load growth
Capacity, Energy, Loads and the Base Case, leading
Transmission 2013 – 2022 to slightly higher load
(CELT) growth
Renewable Each New England state Each New England state Same as Base Case
Portfolio Standards meets 100% of its RPS target meets 75% of its RPS
(RPS) target
Environmental No stricter regulations on Same as Base Case Same as Base Case
Policy hydraulic fracturing; Federal
GHG emissions program in
2020
New England Nuclear deactivation occurs Nuclear deactivation Same as Base Case
Generation between 2032-2035; Later occurs between 2027-
Capacity Changes period capacity additions 2030
BLACK & VEATCH | Introduction 16The New England States Committee on Electricity I NATURAL GAS INFRASTRUCTURE AND ELECTRIC GENERATION
FUNDAMENTAL BASE CASE HIGH DEMAND LOW DEMAND
FACTOR SCENARIO SCENARIO
Natural Gas Drivers
Demand Growth Residential, Commercial and High R-C-I demand No demand growth
Industrial (R-C-I) demand growth, at 2.2%, with
growth of 1.6% per year policy incentives
LNG Exports Exports from Gulf Coast and Additional 4 Bcf/d of Same as Base Case
West Coast export from the Gulf
Coast and West Coast
Pipeline Algonquin Incremental AIM in-service by 2016 Same as Base Case
Infrastructure Market (AIM) expansion in-
service by 2016 Maritimes & Northeast
Pipeline (M&NP) can
reverse flow on an
economic basis to meet
demand growth from
Maine and Maritimes
Canada
Natural Gas Supply Marcellus grows at 6% per Same as Base Case Same as Base Case
year; Eastern Canadian
production increases sharply
in 2014 to >350 MMcf/d and
then gradually declines
through 2020
LNG Imports Everett MA (Distrigas) Same as Base Case Same as Base Case
supplies will sharply decline
relative to 2011 but
gradually increase starting in
2019
Saint John NB Canada
(Canaport) supplies will
decline after firm supply
contract expires in Oct 2013
SOLUTIONS FOR INFRASTRUCTURE DEFICIENCIES AND SENSITIVITES
In Phase III, Black & Veatch tested infrastructure solutions associated with each scenario
and selective sensitivities related to weather and demand growth. Both short-term and
long-term solutions were considered. Some prospective solutions involved increases in
natural gas supply while other solutions involved reductions to natural gas demand. An
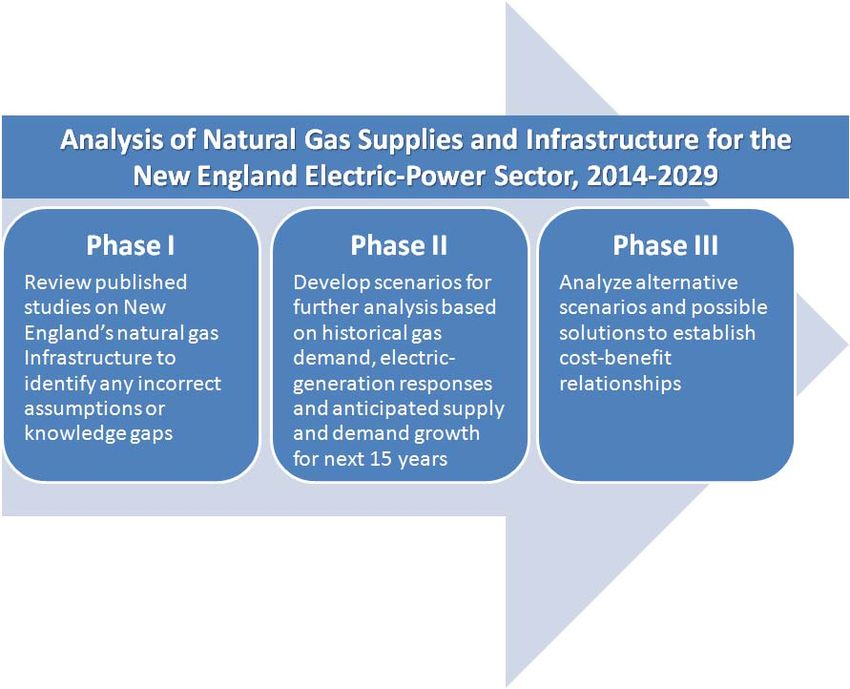
overview of these solutions is presented in Figure 4 and Table 2.
BLACK & VEATCH | Introduction 17The New England States Committee on Electricity I NATURAL GAS INFRASTRUCTURE AND ELECTRIC GENERATION
Canaport
Tennessee Gas Pipeline
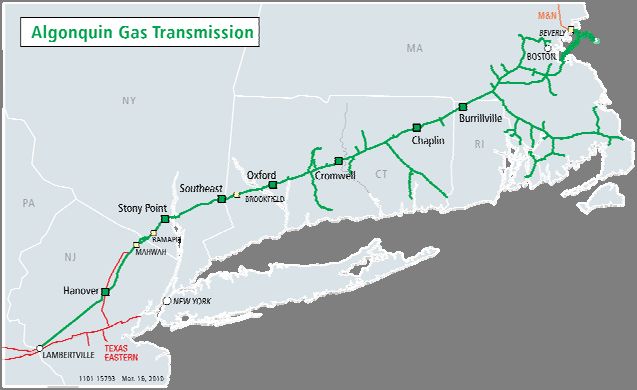
Algonquin Gas Transmission
Maritimes & Northeast Pipeline
Iroquois Gas Transmission
Dracut Cross-regional Pipeline Route
Wright Other Natural Gas Pipelines
Everett Energy Imports Transmission Line Route
Dual-fired Generation:
10 – 350 MW
350 – 600 MW
600+ MW
LNG Import Terminal
Figure 4 Map of Solutions Evaluated Under All Three Scenarios
Table 2 Solutions Evaluated for Resolving Natural Gas Infrastructure Deficiencies and Sensitivities
BASE CASE HIGH DEMAND LOW DEMAND
SCENARIO SCENARIO
Long-Term Cross-Regional Natural Gas Pipeline Cross-Regional Natural LNG Peak Shaving
Solutions Gas Pipeline Facilities
Firm-Based Energy Imports (firm- Firm-Based Energy Firm-Based Energy
contracted electricity from eastern Imports Imports
Canada)
Economic-Based Energy Imports
(market-driven electricity from
eastern Canada)
Short-Term LNG Imports LNG Imports
Solutions
Dual-Fuel Generation and Demand Dual-Fuel Generation
Response and Demand Response
Additional Design Day Negative Demand
Sensitivities Growth
BLACK & VEATCH | Introduction 18The New England States Committee on Electricity I NATURAL GAS INFRASTRUCTURE AND ELECTRIC GENERATION 3.0 Model Approach OVERVIEW In Phases I and II, Black & Veatch concluded that, in the absence of infrastructure solutions, natural gas infrastructure constraints are expected to occur across New England for significant periods of time, sometimes exceeding 60 days per year for some sub-regions. These findings are based on reviews of existing literature2 on this topic and analyses of historical data on pipeline flows and natural gas prices. Phase III analyses were structured to further confirm those findings. Market simulation models were used to understand effects of constraints on natural gas and electricity prices as well as costs and benefits of alternative solutions. Understanding the economic relationships between the electric and natural gas markets in New England requires application of models that address a large number of factors. The modeling process has to be executed in a fashion that considers supply and demand fundamentals for one commodity will affect fundamentals and price of the other. INTEGRATED MARKET MODELING Black & Veatch utilized an Integrated Market Modeling (“IMM”) process to generate wholesale market prices for natural gas3, and wholesale Locational Marginal Price (“LMP”) at eleven New England transmission zones. GPCM™ was used to model the natural gas market while PROMOD, was used to model the electric market. Model runs were executed in an iterative fashion to ensure consistent results, as illustrated in Figure 5. Black & Veatch used this IMM process to estimate the price impact of natural gas infrastructure constraints on natural gas and electric markets. As modeled, natural gas infrastructure constraints result in acute natural gas price increases during winter months, which are then reflected in the assumptions of the electric market model, leading to increased electric prices. The IMM process involves detailed market projections across the North American energy market to take into account any market activity that could affect New England. For example, high growth in demand across North America could increase the cost of New England supplies or even divert supplies away from New England. A fundamental model that only simulates the New England Energy market would not incorporate such issues. 2 In Phase I, Black & Veatch reviewed 35 publicly-available reports: 18 by natural gas companies or gas industry associations; 4 by natural gas suppliers (producers, LNG importers); 4 by electric-power generation companies; 5 by the New England Independent System Operator (ISO-NE); 2 by the Federal Energy Regulatory Commission (FERC); 2 by the National Electric Reliability Corporation (NERC) and the Midcontinent Independent System Operator (MISO). 3 This report focuses on natural gas prices reported at the Algonquin City-Gates pricing point. This point represents the wholesale price of natural gas delivered by Algonquin Gas Transmission to city-gate distribution points in Connecticut, Massachusetts, and Rhode Island, and is representative of wholesale prices across New England. BLACK & VEATCH | Model Approach 19
The New England States Committee on Electricity I NATURAL GAS INFRASTRUCTURE AND ELECTRIC GENERATION

                                Infrastructure        Supply
                                 Assumptions       Assumptions

                                                                             GPCM                   Natural Gas
                                                                             Model                  Price View
                    Residential, Commercial,         Electric Sector               Iterations between GPCM and
                       Industrial Demand                Demand                     PROMOD ensure consistent results

                                                                           PROMOD                    Electric
                                                                            Model                   Price View
   Environmental             Transmission           Regional
       Costs                   Costs and             Issues
                               Additions
           Near-Term                              Demand                     Market
             Entry                    Capital
                                       Costs      Forecast                   Power
                                                                             Model
 Figure 5 Integrated Market Modeling Process

 ESTIMATION OF BENEFITS
 The economic benefits offered by each solution were assessed from two perspectives:
 1) benefits to natural gas end users and 2) benefits to electric customers. Figure 6 provides
 an overview of the analytical process used to assess these benefits. Again, the market
 interrelationships between power-generation economics and the economics of gas as a
 generation fuel make the estimation of benefits mutually interdependent for gas and power
 customers.

                                                    Benchmark                                         Benchmark
                                                   GPCM Model                                       PROMOD Model

                                                   Benchmark                                          Benchmark
                                                 Natural Gas Price                                  Electricity Price
       Incremental
     Gas Infrastructure                                            Derived Price subtracted from
                                                                         Benchmark Price
                                 GPCM                Derived                  PROMOD                    Derived
                                 Model           Natural Gas Price             Model                Electricity Price
                                                                       Market benefits calculated
                                PROMOD                                  with price differentials
                                 Model             Natural Gas                                          Electric
                                                  Market Benefit                                     Market Benefit
        Incremental
   Electric Infrastructure
                                                 Statistical           Benefit from Reduction
                                                  Analysis               in Daily Volatility

 Figure 6 Analytical Process used to Assess Market Benefits

 BLACK & VEATCH | Model Approach                                                                                        20
The New England States Committee on Electricity I NATURAL GAS INFRASTRUCTURE AND ELECTRIC GENERATION BENEFITS TO NATURAL GAS CUSTOMERS Benefits to natural gas end-users, including residential, commercial, and industrial customers, are calculated by multiplying anticipated reductions in wholesale natural gas prices by consumption volumes affected by this price reduction. In general, most residential, commercial and industrial customers receive gas from local distribution companies (“LDCs”). LDCs are required to support their ultimate deliverability by contracting firm transportation capacity on natural gas pipelines and long-term supply purchases, so only limited amounts of “swing” supplies are purchased by New England LDCs at the region’s prevailing wholesale market price as measured by Black & Veatch in this analysis using Algonquin City-Gates price point. Given that infrastructure solutions are expected to have an immediate impact on wholesale natural gas prices, only the residential, commercial, and industrial consumption anticipated to be met with “swing” supplies was included in the calculation of benefits. Based on the estimates of Black & Veatch professionals, some of whom have managed LDC supply portfolios, this analysis assumes that 10% of industrial4 and 3% of both residential and commercial winter demand are purchased as “swing” supplies at wholesale market prices. Under the Base Case, these volumes make up 19 to 25 billion cubic feet (“Bcf”) per year. BENEFITS TO ELECTRIC CUSTOMERS Because most natural gas-fired power generation capacity in New England is not supported by firm transportation contracts on natural gas pipelines, the cost of gas-fired power generation is closely tied to wholesale natural gas prices. Therefore, New England’s electricity prices across all ISO-NE zones are highly correlated with regional wholesale natural gas prices. Figure 7 illustrates the close historical connection between New England’s electricity and natural gas wholesale prices at the Algonquin City-Gates, especially during winter months. 4 This number is expected to vary from state to state. Results presented here in the report were calculated based on 10% of industrial demand. Separately, Black & Veatch calculated the benefits assuming 50% of industrial demand is priced at the regional pricing point, which would have the effect of increasing the benefits to natural gas end customers by less than $1 million per year. BLACK & VEATCH | Model Approach 21
The New England States Committee on Electricity I NATURAL GAS INFRASTRUCTURE AND ELECTRIC GENERATION

                                                Boston Day Ahead Energy Price    Algonquin, City-Gates Basis to Henry Hub
                                   $300                                                                                     $35

                                                                                                                            $30
                                   $250
  Day Ahead Energy Price ($/MWh)

                                                                                                                                  Natural Gas Basis ($/Mmbtu)
                                                                                                                            $25
                                   $200

                                                                                                                            $20
                                   $150
                                                                                                                            $15

                                   $100
                                                                                                                            $10

                                   $50
                                                                                                                            $5

                                    $0                                                                                      $0
                                    Jan-2009 Jul-2009 Jan-2010 Jul-2010 Jan-2011 Jul-2011 Jan-2012 Jul-2012 Jan-2013

 Figure 7 Historical New England Electric and Natural Gas Prices
 Source: ISO-NE, Platts

 Given that a majority of New England power generators purchase natural gas supplies at
 wholesale spot prices, Black & Veatch assumed for this study that reductions in electricity
 prices provided by infrastructure solutions benefit all New England electric customers.
 Benefits to electric customers are calculated as the reduction in market energy prices in
 each ISO-NE zone multiplied by total energy consumption in that zone.

 BENEFITS FROM REDUCED DAILY GAS PRICE VOLATILITY
 In addition to the overall price decreases modeled above, natural gas end-users and electric
 customers also benefit from reductions in daily natural gas price volatility. Incremental gas
 infrastructure additions, increased gas supply, or reduced power-sector demand all provide
 relief from supply constraints and will also reduce daily price volatility. For example, New
 England winter basis could increase to more than $20/MMBtu in a single day, while
 increase in summer daily basis never exceeds $1/MMBtu, given the absence of capacity
 constraints. Because power generators make dispatch decisions based on daily gas prices,
 daily price volatility for gas has a very significant impact on electric customers.

 Because the price estimates were calculated using monthly forecasts5, the benefits of
 reduced price volatility were separately calculated using a statistical modeling approach.
 First, Black & Veatch examined the historical relationship between wholesale daily spot and
 first-of-month natural gas prices6 reported at Algonquin City-Gates in order to determine

 5
   Forecasts of gas prices made with monthly granularity reflect a limitation of the electric market model,
 which must utilize a monthly natural gas price forecast to develop electricity price projections.
 6
   First-of-month prices usually are indicators of prices paid by gas users seeking to meet baseload
 requirements on monthly or longer-term contracts.

 BLACK & VEATCH | Model Approach                                                                                                                                22
The New England States Committee on Electricity I NATURAL GAS INFRASTRUCTURE AND ELECTRIC GENERATION how often, and by how much, daily spot prices exceed first-of-month prices in peak winter months. That relationship was then used to derive daily price projections using the monthly model output. Reductions in daily volatility provided by infrastructure solutions were then estimated by comparing daily price projections. BLACK & VEATCH | Model Approach 23
The New England States Committee on Electricity I NATURAL GAS INFRASTRUCTURE AND ELECTRIC GENERATION

 4.0 Base Case Assumptions: Most Likely Drivers of
     Outcomes
 NATURAL GAS DEMAND
 In the Base Case, Black & Veatch projected New England natural gas demand from the
 residential, commercial, industrial, and power sectors using the following key assumptions:

     1. Normal weather conditions.7
     2. Demand from residential, commercial and industrial sectors in New England states
        (except for Connecticut) grows at the average pace of 1.6% per annum.
     3. For the state of Connecticut, the goal laid out in the state’s Comprehensive Energy
        Strategy is met, increasing Connecticut’s residential and commercial natural gas
        penetration rate to 50% by 2020.
     4. Gross New England electric load grows approximately 1.1% per year as projected in
        the 2012 Capacity, Energy, Load and Transmission (“CELT”) report. Net electric
        energy load, which incorporates the effect of energy efficiency programs, grows
        approximately 0.3% per year over the same period. Longer term growth over the
        study period (2013-2029) shows a growth rate of 0.18% per year incorporating the
        effect of energy efficiency.
     5. Environmental policies and competitive economic pressure trigger significant
        retirements of coal and oil-fired electric generation.8
     6. A federal cap-and-trade program on carbon emissions is in effect by 2020, which
        results in later-period capacity additions that are, separate from renewable
        resources discussed below, assumed to be exclusively gas-fired.
     7. Growth in renewable generation capacity dominates capacity additions in the early
        years to allow each New England state to meet its Renewable Portfolio Standards
        (“RPS”) goals.
 Black & Veatch anticipates moderate growth in New England natural gas demand
 throughout the analysis period, with growth of 360 million cubic feet per day (MMcf/d)
 expected from 2014 to 2029 (Figure 8). Overall demand growth is expected to be driven by
 the residential, commercial, and industrial sectors as a result of economic recovery and
 market penetration in the residential and commercial sectors. Growth in residential and
 commercial demand is concentrated in Connecticut, as a result of the state’s Comprehensive
 Energy Strategy.

 7
   Normal weather conditions were defined as monthly-average winter heating-degree days (“HDDs”) and
 monthly-average summer cooling-degree days (“CDDs”) for the 20-year period of 1993-2012 as
 documented for weather stations in Boston MA, Concord VT and Hartford CT.
 8
   Nuclear power generators were assumed to remain in service consistent with the terms of their Nuclear
 Regulatory Commission operating licenses. Notably, the Vermont Yankee station was assumed to remain
 in service for the entire study period in the Base Case and Low Demand Scenarios.

 BLACK & VEATCH | Base Case Assumptions: Most Likely Drivers of Outcomes                                   24
The New England States Committee on Electricity I NATURAL GAS INFRASTRUCTURE AND ELECTRIC GENERATION
Growth in electric sector demand for natural gas is driven by increased dispatch of natural
gas generation units. However, efficiency gains, demand response programs and renewable
resources offset much of the customer load growth in New England, in contrast to the much
more robust electric sector demand growth expected throughout the Lower 48 states
(Figure 9).
Residential Commercial Industrial Electric
3.5
2014-2030 Compound Annual Growth
Residential Commercial Industrial Electric
3.0 0.99% 2.22% 1.54% 0.06%
Projection
2.5
2.0
Bcf/d
1.5
1.0
0.5
0.0
2011 2013 2015 2017 2019 2021 2023 2025 2027 2029
Figure 8 New England Natural Gas Demand: Base Case
Source: Energy Information Administration historical data, Black & Veatch Projection
Residential Commercial Industrial Electric
90
2014-2030 Compound Annual Growth
Residential Commercial Industrial Electric
80
0.86% 1.36% 0.59% 2.90%
70
60
50
Bcf/d
40
30
20
10
0
2011 2013 2015 2017 2019 2021 2023 2025 2027 2029
Figure 9 Lower 48 Natural Gas Demand: Base Case
Source: Energy Information Administration historical data, Black & Veatch Projection
BLACK & VEATCH | Base Case Assumptions: Most Likely Drivers of Outcomes 25You can also read