Serum Tau Proteins as Potential Biomarkers for the Assessment of Alzheimer's Disease Progression - MDPI
←
→
Page content transcription
If your browser does not render page correctly, please read the page content below
International Journal of
            Molecular Sciences

Article
Serum Tau Proteins as Potential Biomarkers for the
Assessment of Alzheimer’s Disease Progression
Eunjoo Nam 1,2 , Yeong-Bae Lee 2,3 , Cheil Moon 4             and Keun-A Chang 1,2,5, *
 1    Department of Pharmacology, College of Medicine, Gachon University, Incheon 21936, Korea;
      ej0817@hanmail.net
 2    Neuroscience Research Institute, Gachon University, Incheon 21565, Korea; yeongbaelee@gachon.ac.kr
 3    Department of Neurology, Gil Medical Center, Gachon University, Incheon 21565, Korea
 4    Department of Brain Science, Graduate School, Daegu Gyeungbuk Institute of Science and Technology,
      Daegu 42988, Korea; cmoon@dgist.ac.kr
 5    Department of Health Sciences and Technology, GAIHST, Gachon University, Incheon 21936, Korea
 *    Correspondence: keuna705@gachon.ac.kr

 Received: 22 June 2020; Accepted: 13 July 2020; Published: 15 July 2020

 Abstract: Total tau (t-tau) and phosphorylated tau (p-tau) protein elevations in cerebrospinal fluid
 (CFS) are well-established hallmarks of Alzheimer’s disease (AD), while the associations of serum
 t-tau and p-tau levels with AD have been inconsistent across studies. To identify more accessible
 non-invasive AD biomarkers, we measured serum tau proteins and associations with cognitive
 function in age-matched controls (AMC, n = 26), mild cognitive impairment group (MCI, n = 30),
 and mild-AD group (n = 20) according to the Mini-mental State Examination (MMSE), Clinical
 Dementia Rating (CDR), and Global Deterioration Scale (GDS) scores. Serum t-tau, but not p-tau,
 was significantly higher in the mild-AD group than AMC subjects (p < 0.05), and there were
 significant correlations of serum t-tau with MMSE and GDS scores. Receiver operating characteristic
 (ROC) analysis distinguished mild-AD from AMC subjects with moderate sensitivity and specificity
 (AUC = 0.675). We speculated that tau proteins in neuronal cell-derived exosomes (NEX) isolated
 from serum would be more strongly associated with brain tau levels and disease characteristics, as
 these exosomes can penetrate the blood-brain barrier. Indeed, ELISA and Western blotting indicated
 that both NEX t-tau and p-tau (S202) were significantly higher in the mild-AD group compared to
 AMC (p < 0.05) and MCI groups (p < 0.01). In contrast, serum amyloid β (Aβ1–42 ) was lower in the
 mild-AD group compared to MCI groups (p < 0.001). During the 4-year follow-up, NEX t-tau and
 p-tau (S202) levels were correlated with the changes in GDS and MMSE scores. In JNPL3 transgenic
 (Tg) mice expressing a human tau mutation, t-tau and p-tau expression levels in NEX increased
 with neuropathological progression, and NEX tau was correlated with tau in brain tissue exosomes
 (tEX), suggesting that tau proteins reach the circulation via exosomes. Taken together, our data
 suggest that serum tau proteins, especially NEX tau proteins, are useful biomarkers for monitoring
 AD progression.

 Keywords: tau protein; serum; Alzheimer’s disease; biomarker; exosome

1. Introduction
     Alzheimer’s disease (AD) is the most common neurodegenerative disorder, currently afflicting
over 35.6 million individuals worldwide [1,2]. The disease is characterized behaviorally by progressive
dementia and pathologically by local accumulations of amyloid β (Aβ) peptide and neurofibrillary
tangles (NFTs) composed of tau protein in the brain [3]. Both Aβ accumulation and aggregation of
tau in NFTs are believed to contribute directly to AD neurodegeneration and the associated cognitive

Int. J. Mol. Sci. 2020, 21, 5007; doi:10.3390/ijms21145007                         www.mdpi.com/journal/ijms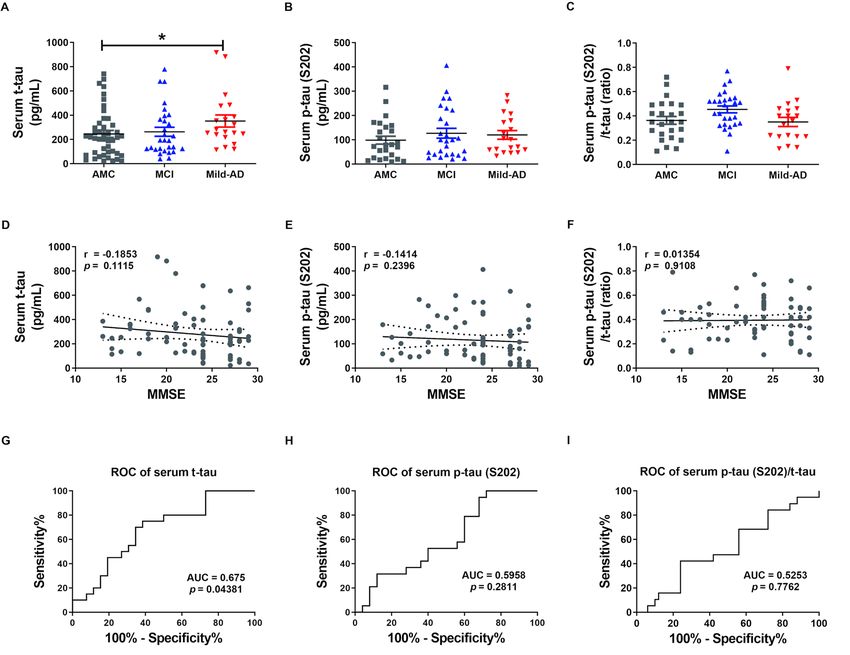
Int. J. Mol. Sci. 2020, 21, 5007                                                                     2 of 20

deterioration [4]. Tau is a microtubule-associated protein that serves to stabilize axonal microtubule
bundles, which are essential structural elements in the axonal cytoskeleton [5]. Tau expression
is abundant in the central nervous system, particularly in distal axons. Tau contains multiple
phosphorylation sites, and phosphorylation status influences microtubule stability, distribution,
and function in neurons [6]. If the tau protein is phosphorylated excessively (hyper-phosphorylated),
it detaches from the microtubule, resulting in destabilization and disruption of axonal morphology
and dynamic transport function [7,8].
      At present, a definitive AD diagnosis is possible only by postmortem verification of Aβ deposits
(plaques) and NFTs, thus clinicians rely on clinical diagnostic criteria, such as the National Institute of
Neurological and Communicative Disorders and Stroke-Alzheimer’s Disease and Related Disorders
Association (NINCDS-ADRDA) guidelines, the Diagnostic and Statistical Manual of Mental Disorders,
4th Edition (DSM-IV), and the 10th revision of the International Statistical Classification of Diseases and
Related Health Problems (ICD-10); however, the diagnostic accuracy of these AD criteria is poor [9,10].
Therefore, reliable biomarkers capable of detecting AD pathologies are required. Currently, available
biomarkers for AD are based on either cerebrospinal fluid (CSF) or neuroimaging. According to a
2016 meta-analysis of fluid AD biomarkers [11], CSF Aβ1–42 , total tau (t-tau), and phosphorylated tau
(p-tau) can distinguish AD patients from controls [12]. Indeed, elevated CSF levels of t-tau, p-tau, and
a decreased level of the Aβ1-42 are a core sign of AD [12]. However, CSF sampling and analysis are
invasive, painful, time-consuming, and expensive [13,14]. Blood is, therefore, a more desirable target
for AD biomarker analyses, and several authors have investigated t-tau and p-tau protein levels in the
blood of AD patients, but the results are controversial [15,16]. A few previous studies have reported
that plasma tau reflects brain tau levels [17,18] and that plasma tau levels are specifically elevated in
AD patients [19]. Further, another study reported an association between plasma tau level and CSF
t-tau or p-tau (T181) level [20], suggesting the utility of serum tau measures for AD diagnosis. A recent
study also reported that t-tau/Aβ1-42 in plasma was highly predictive of brain tau deposition and
associated with the longitudinal changes in cerebral amyloid deposition, brain glucose metabolism,
and hippocampal volume change [21]. However, variation was large across the few available studies
on AD serum markers, necessitating further examination for diagnostic reliability and association with
clinical features such as cognitive dysfunction.
      Exosomes (EX) are endosome-derived membrane vesicles containing proteins and other
constituents of cellular origin that act as biological barrier-permeable carriers for local endocrine
signaling [22,23]. Exosomes found in blood demonstrate protein expression profiles that reflect
pathological changes within disease-specific brain regions, suggesting that analysis of circulating EX
protein expression may be an effective non-invasive strategy for monitoring brain pathogenesis [24,25].
For instance, one study reported that levels of p-tau in brain-derived blood EX predicted the
development of AD before clinical onset [26], but no subsequent study has examined if EX protein
expression can reflect AD severity.
      Therefore, in this study, we measured serum tau proteins, including tau proteins within the
circulating EX fraction, in AD patients and age-matched controls at baseline and over disease
progression to evaluate both the diagnostic efficacy of tau and the association with the severity of
cognitive dysfunction. In addition, we measured EX tau in both the serum and brain tissue of JNPL3
mice expressing mutant human tau mutation (MAPT) to verify the EX-mediated transport of brain
pathogenic proteins into the blood.

2. Results

2.1. Serum t-tau and p-tau Protein Levels in Controls, Mild Cognitive Impairments, and Mild-AD Patients
    Table 1 summarizes the clinical and demographic characteristics of the study population.
We divided subjects into an age-matched control group (AMC, n = 26), a mild cognitive impairment
(MCI) group (n = 30), and a mild-AD (Mild-AD) group (n = 20) according to neurocognitive test scores.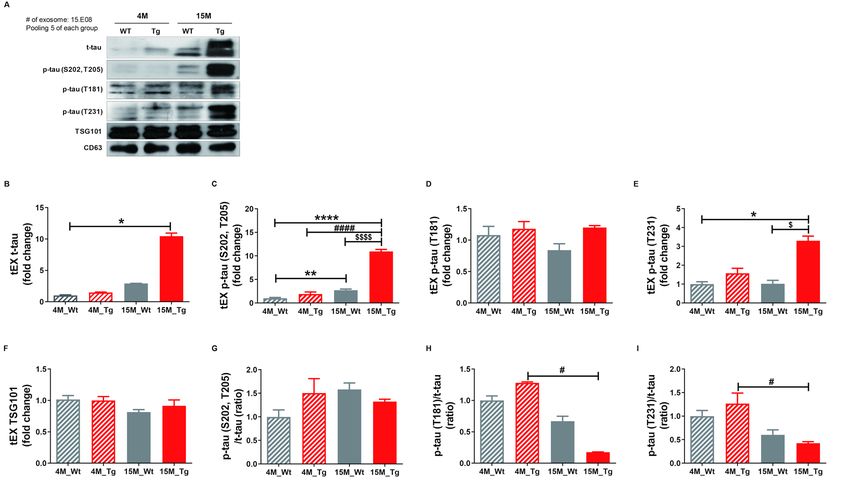
Int. J. Mol. Sci. 2020, 21, 5007                                                                                      3 of 20

We compared the average age of the group to exclude the effects of age, one of risk factor in AD, and
it showed similar distribution among the groups (AMC, 73.92 ± 0.88 years; MCI, 75.13 ± 0.99 years;
Mild-AD, 76.55 ± 1.33 years). As shown in Table 1, disease severity was significantly greater in the
Mild-AD group compared to the MCI group as indicated by the significantly lower MMSE scores
(AMC, 27.69 ± 0.16; MCI, 23.17 ± 0.20; Mild-AD, 16.55 ± 0.52, p < 0.01 vs. MCI), higher CDR-SOB
scores (AMC, 0.75 ± 0.07; MCI, 2.55 ± 0.03; Mild-AD, 4.48 ± 0.28, p < 0.1 vs. MCI), and higher GDS
scores (AMC, 2.00 ± 0.00; MCI, 3.00 ± 0.00; Mild-AD, 3.75 ± 0.14).

                             Table 1. Demographic and clinical parameters of studied groups.

                        VARIABLES                 AMC                  MCI                  Mild-AD
                   Number of subjects               26                  30                      20
                   Female (F)/Male (M)         9 (F)/17 (M)       18 (F)/12 (M)            17 (F)/3 (M)
                       Age (years)
                                               73.92 ± 0.88        75.13 ± 0.99            76.55 ± 1.33
                     (mean ± SEM)
                         MMSE
                                               27.69 ± 0.16      23.17 ± 0.20 ***      16.55 ± 0.52 ****,##
                     (mean ± SEM)
                       CDR-SOB
                                                0.75 ± 0.07      2.55 ± 0.03 ****       4.48 ± 0.28 ****,#
                     (mean ± SEM)
                          GDS
                                                2.00 ± 0.00      3.00 ± 0.00 ****        3.75 ± 0.14 ****
                     (mean ± SEM)
      AMC, age-matched control; MCI, mild cognitive impairment; Mild-AD, mild dementia in Alzheimer’s disease;
      MMSE, Mini-Mental Status Examination; CDR-SOB, Clinical Dementia Rating-Sum of Box; GDS, Global Deterioration
      Scale. *** p < 0.001 and **** p < 0.0001 compared with the AMC subjects, # p < 0.05 and ## p < 0.01 compared with
      the MCI subjects, using One-way ANOVA and Dunn’s Multiple comparison test.

      We first measured serum concentrations of t-tau and p-tau in all subjects by enzyme-linked
immunosorbent assays (ELISAs) to examine the potential of the proteins as non-invasive biomarkers
for AD (Figure 1). Indeed, serum t-tau was significantly higher in the Mild-AD group compared to
AMCs (351.9 ± 50.04 pg/mL vs. 245.6 ± 33.76 pg/mL; p < 0.05, Figure 1A), while concentration in the
MCI group did not differ from AMCs (263.0 ± 37.12 pg/mL). Serum p-tau (pSer202: S202) was also
slightly higher in the MCI and Mild-AD groups compared to the AMCs, but the differences did not
reach significance (AMC, 98.60 ± 16.23; MCI, 127.0 ± 20.07; Mild-AD, 120.1 ± 17.84, p = 0.38, Figure 1B).
The serum p-tau (S202)/t-tau protein ratio also did not differ among groups (AMC, 0.36 ± 0.03; MCI,
0.45 ± 0.03; Mild-AD, 0.35 ± 0.04, p = 0.799, Figure 1C). These results suggest that serum t-tau may
distinguish Mild-AD but not MCI from age-matched health subjects.
      Next, we evaluated the correlations between serum t-tau levels and neurocognitive test scores
because only serum t-tau was significantly higher in the AD groups according to ELISA results. Serum
t-tau concentration exhibited a weak negative correlation with MMSE score (r = −0.19, p = 0.11,
Figure 1D) and positive correlation with GDS score (r = 0.22, p = 0.06, Figure S1A) but no correlation
with CDR-SOB score (r = 0.13, p = 0.27, Figure S1D). There were also no significant correlations between
serum p-tau (S202) levels or p-tau (S202)/t-tau ratio and neurocognitive test scores (Figure 1E,F and
Figure S1B,C,E,F). Moreover, there was no correlation between serum t-tau or p-tau (S202) and age
(t-tau, r = 0.05, p = 0.66, Figure S1G; p-tau, r = 0.02, p = 0.88, Figure S1H) despite the strong influence of
age on AD risk.
      We also performed Receiver operating characteristic (ROC) analysis to evaluate the diagnostic
utility of serum t-tau and p-tau. Serum t-tau elevation above 234.4 pg/mL distinguished Mild-AD from
AMC group subjects with 75% sensitivity and 61.54% specificity (area under the curve (AUC) = 0.675,
p = 0.044, Figure 1G), while serum p-tau (S202) above 58.34 pg/mL distinguished Mild-AD from AMC
subjects with 78.95% sensitivity and but only 40% specificity (AUC = 0.5958, p = 0.281, Figure 1H).
Serum p-tau (S202)/t-tau ratio also was not a reliable marker, distinguishing Mild-AD from AMC group
subjects with 42.11% sensitivity and 76% specificity using a cut-off of 0.245 (AUC = 0.525, p = 0.78,
Figure 1I). Therefore, a rise in t-tau or p-tau distinguished mild-AD from healthy age-matched controls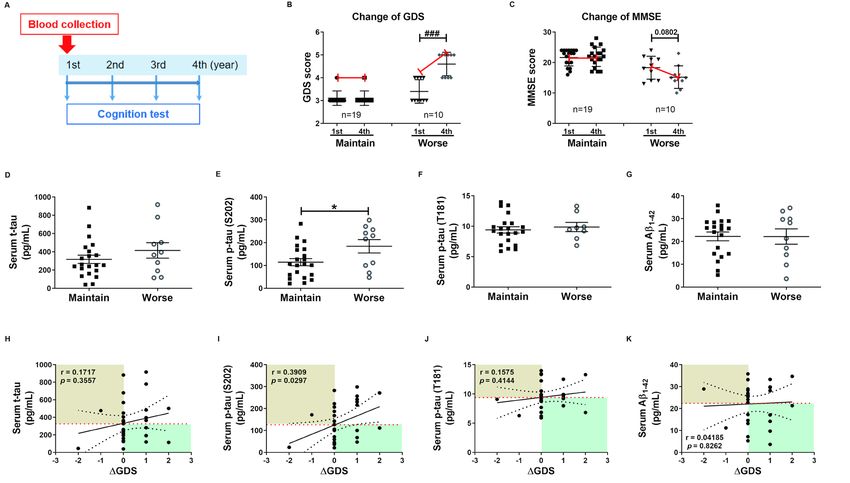
Int. J. Mol. Sci. 2020, 21, 5007 4 of 20
with only moderate accuracy. However, we speculated that tau proteins in brain-derived exosomes
more accurately reflect current disease status that total serum proteins.
Int. J. Mol. Sci. 2018, 19, x FOR PEER REVIEW 4 of 21
Figure1.1.Elevated
Figure Elevatedserum
serum total
total tau (t-tau) protein
protein in
in patients
patientswith
withmild
mildAlzheimer’s
Alzheimer’sdisease
disease(AD).
(AD). A)
(A) Total tau (t-tau), (B) phosphorylated (p)-tau (S202), and (C) p-tau (S202)/t-tau
Total tau (t-tau), B) phosphorylated (p)-tau (S202), and C) p-tau (S202)/t-tau ratio in human serum ratio in human
serum
were were quantified
quantified usingusing ELISA.
ELISA. Serum Serum
t-taut-tau
was was higher
higher in Mild-AD
in the the Mild-AD group
group compared
compared to the
to the age-
age-matched control
matched control (AMC)
(AMC) group.
group. All data
All data werewere
shownshown as means
as means ± SEM.± *SEM.
p < 0.05 < 0.05 compared
* pcompared to the AMCto
the AMC group by one-way ANOVA and post hoc Dunn’s multiple comparison
group by one-way ANOVA and post hoc Dunn’s multiple comparison test. Correlations of serum D) test. Correlations
oft-tau,
serumE)(D) t-tau,
p-tau (E) p-tau
(S202), and F)(S202),
p-tau and (F) p-tauwith
(S202)/t-tau (S202)/t-tau
Mini-mentalwithstate
Mini-mental state(MMSE)
examination examination
scores
(MMSE) scores were assessed by the nonparametric Spearman’s rank correlation
were assessed by the nonparametric Spearman’s rank correlation test. Graphs show regression test. Graphs show
lines
regression
with 95%lines with 95%
confidence confidence
intervals. Serumintervals.
t-tau was Serum t-tau was
significantly significantly
correlated withcorrelated with Receiver
MMSE scores. MMSE
scores. Receiver
operating operating(ROC)
characteristic characteristic
analyses(ROC) analyses
of serum of serum
G) t-tau, (G)(S202),
H) p-tau t-tau, (H)
andp-tau (S202),
I) p-tau and (I)
(S202)/t-tau.
p-tau (S202)/t-tau. ROC analysis revealed moderate diagnostic accuracy of elevated
ROC analysis revealed moderate diagnostic accuracy of elevated serum t-tau. AUC, area under serum t-tau. AUC, the
area under
curve. the curve.
2.2. Characteristics of Neuronal Cell-Derived Exosomes (NEX)
Next, we evaluated the correlations between serum t-tau levels and neurocognitive test scores
To
becausedetermine
only serumwhether
t-tauserum tau proteins higher
was significantly originatein from
the ADneuronal
groups cells and enter
according tothe circulation
ELISA results.
via neuronal-derived
Serum exosomes
t-tau concentration (NEX),
exhibited we isolated
a weak negativeexosomes
correlation from
withserum
MMSE using
scorethe
(r =ExoQuick EX
−0.19, p = 0.11,
precipitation
Figure 1D) andsolution according
positive to Perez-Gonzalez
correlation with GDS score [27]
(r =with
0.22,minor modifications
p = 0.06, Figure S1A)and butthen enriched
no correlation
(NEX) by immunochemical
with CDR-SOB methods
score (r = 0.13, (Figure
p = 0.27, S2A).
Figure To ensure
S1D). the identity
There were also noand quality of
significant EX and
correlations
NEX, we characterized
between the microvesicles
serum p-tau (S202) by NanoSight,
levels or p-tau (S202)/t-tauWestern
ratio andblotting, and transmission
neurocognitive test scoreselectron
(Figure
microscopy
1E,F and Figure S1B,C,E,F). Moreover, there was no correlation between serum t-tau or p-tau(total
(TEM). NanoSight results showed that particles in the ExoQuick precipitates (S202)
serum EX)(t-tau,
and age rangedr =in diameter
0.05, p = 0.66,from 83 to
Figure 159p-tau,
S1G; nm, consistent
r = 0.02, p with
= 0.88,expected EX size
Figure S1H) (Figure
despite S2C).
the strong
Further, EXof
influence identity
age onand
ADNEXrisk. enrichment were confirmed by Western blot detection of the EX-specific
proteinWemarker CD63 and the neuronal
also performed Receiver marker
operating NCAM-L1 (ROC)
characteristic (Figure S2D). Both
analysis CD63 and
to evaluate NCAM-L1
the diagnostic
utility of serum t-tau and p-tau. Serum t-tau elevation above 234.4 pg/mL distinguished Mild-AD
from AMC group subjects with 75% sensitivity and 61.54% specificity (area under the curve (AUC) =
0.675, p = 0.044, Figure 1G), while serum p-tau (S202) above 58.34 pg/mL distinguished Mild-AD from
AMC subjects with 78.95% sensitivity and but only 40% specificity (AUC = 0.5958, p = 0.281, Figure
1H). Serum p-tau (S202)/t-tau ratio also was not a reliable marker, distinguishing Mild-AD from AMC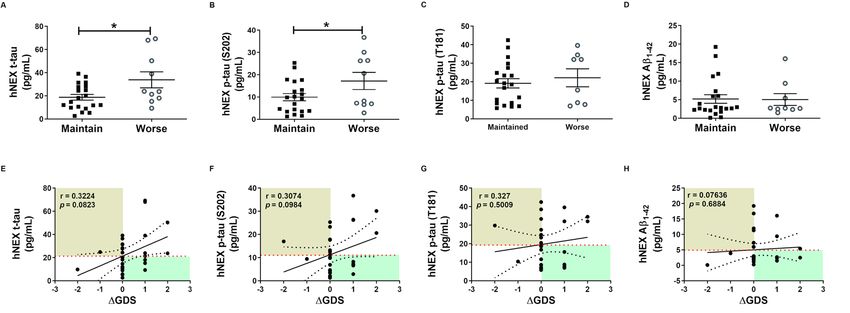
To determine whether serum tau proteins originate from neuronal cells and enter the circulation
via neuronal-derived exosomes (NEX), we isolated exosomes from serum using the ExoQuick EX
precipitation solution according to Perez-Gonzalez [27] with minor modifications and then enriched
(NEX) by immunochemical methods (Figure S2A). To ensure the identity and quality of EX and NEX,
we characterized the microvesicles by NanoSight, Western blotting, and transmission electron
Int. microscopy
J. Mol. Sci. 2020, 21, 5007
(TEM). 5 of 20
NanoSight results showed that particles in the ExoQuick precipitates (total serum
EX) ranged in diameter from 83 to 159 nm, consistent with expected EX size (Figure S2C). Further,
EX identity and NEX enrichment were confirmed by Western blot detection of the EX-specific protein
were expressed in the total EX fraction (initial ExoQuick precipitate) and the NEX fraction (after
marker CD63 and the neuronal marker NCAM-L1 (Figure S2D). Both CD63 and NCAM-L1 were
immuno-enrichment) from the serum of AD patients and CTL subjects (Figure S2D). Expression of
expressed in the total EX fraction (initial ExoQuick precipitate) and the NEX fraction (after immuno-
NCAM-LI was higher in the NEX fraction, consistent with a neuronal origin, whereas CD63 expression
enrichment) from the serum of AD patients and CTL subjects (Figure S2D). Expression of NCAM-LI
was lower than in the total EX faction (EX + NEX), consistent with enrichment (Figure S2D). In addition,
was higher in the NEX fraction, consistent with a neuronal origin, whereas CD63 expression was
consistent with a brain origin of NEX isolated from serum, TEM analysis of both exosomes isolated from
lower than in the total EX faction (EX + NEX), consistent with enrichment (Figure S2D). In addition,
serum and brain tissue samples revealed similar circular structures within the same diameter range
consistent with a brain origin of NEX isolated from serum, TEM analysis of both exosomes isolated
of 50from 150
to serum nmand(Figure
brainS2E). These
tissue combined
samples morphometric
revealed andstructures
similar circular immunolabeling results
within the sameconfirmed
diameter
therange
successful isolation of exosomes from brain and serum as well as the neural origin
of 50 to 150 nm (Figure S2E). These combined morphometric and immunolabeling results of the serum
NEX fraction.
confirmed the successful isolation of exosomes from brain and serum as well as the neural origin of
the serum NEX fraction.
2.3. NEX t-tau and p-tau Protein Levels in Controls, Mild Cognitive Impairments, and Mild-AD Patients
2.3.
ToNEX t-tau andwhether
investigate p-tau Protein
serumLevels
NEXintau
Controls, Mild
proteins Cognitive
more Impairments,
accurately and severity
reflect the Mild-ADofPatients
AD than
total serum tau proteins, we measured t-tau and p-tau levels in suspensions of human neural
To investigate whether serum NEX tau proteins more accurately reflect the severity of AD than exosomes
(hNEX)
total from
serumthetauAMC (n = 23),
proteins, we MCI (n = 29),
measured andand
t-tau Mild-AD
p-tau (n = 18)ingroups
levels by ELISA.
suspensions The variation
of human neural
in exosomes
EX yield was(hNEX)controlled by normalizing hNEX number to EX marker CD63 immunoreactivity.
The number of hNEX in the Mild-AD group was significantly lower than in the MCI group (1.38 × 10⁹
± 2.87 × 10⁸ vs. 4.32 × 10⁹ ± 7.67 × 10⁸ ; p < 0.05, Figure 2A) but did not differ from the AMC group
(2.39 × 10⁹ ± 4.04 × 10⁸ ).
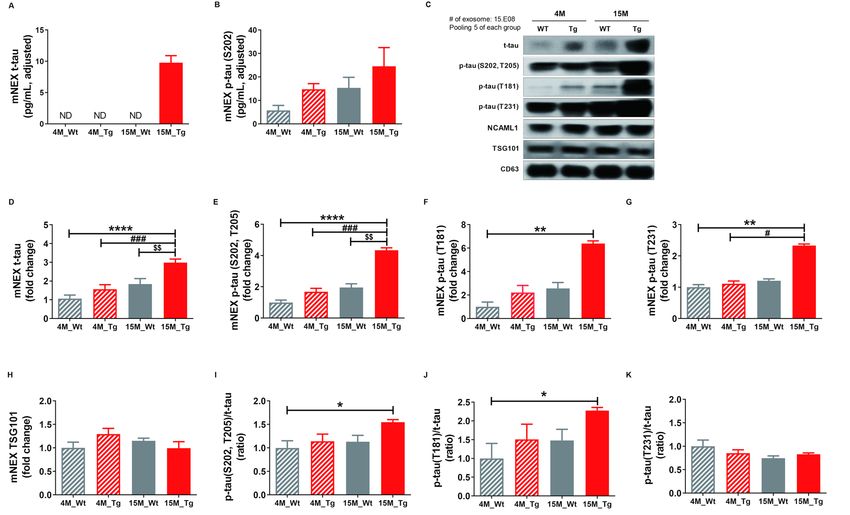
Figure 2. Serum total tau and phosphorylated tau in neuronal cell-derived exosomes are elevated
according to the severity of Alzheimer’s disease. (A) The number of human neuronal cell-derived
exosomes (hNEX) was quantified by ELISA for the exosome marker CD63. The number of hNEX was
lower in the Mild-AD group than the MCI group. (B) Total tau (t-tau), (C) p-tau (S202), and (D) p-tau
(S202)/t-tau ratio in human neuronal cell-derived exosomes (hNEX) were quantified using ELISA.
hNEX t-tau and p-tau (S202) were higher in the Mild-AD group than the AMC and MCI groups. All
data were shown as means ± SEM. * p < 0.05 and ** p < 0.01 compared to the AMC group and # p < 0.05
compared to the MCI group by one-way ANOVA and Holm-Sidak’s or Dunn’s multiple comparison
test. Correlations of hNEX (E) t-tau, (F) p-tau (S202), and (G) p-tau (S202)/t-tau with MMSE scores were
assessed using the nonparametric Spearman’s rank correlation test. Graphs show regression lines with
95% confidence intervals. hNEX p-tau (S202) and p-tau (S202)/t-tau were significantly correlated with
MMSE scores. ROC analyses of hNEX (H) t-tau, (I) p-tau (S202), and (J) p-tau (S202)/t-tau indicating
moderate diagnostic accuracy of elevated hNEX p-tau (S202). AUC, area under the curve.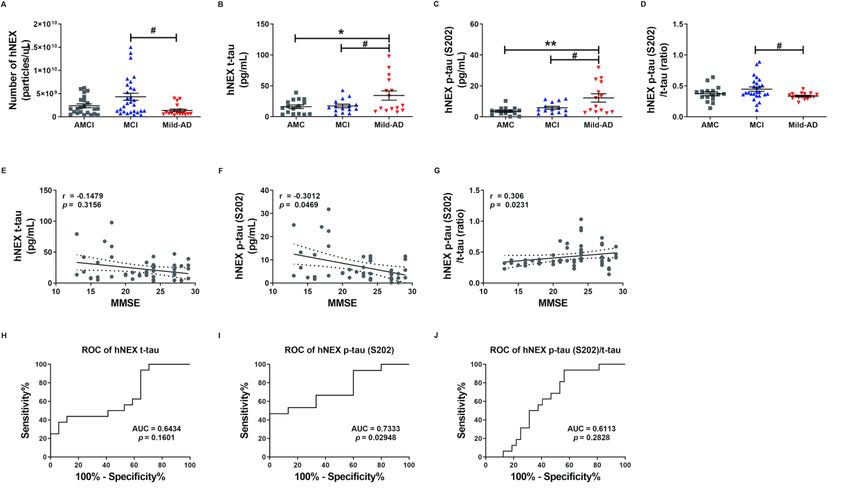
Int. J. Mol. Sci. 2020, 21, 5007                                                                     6 of 20

      The expression profile of these EX proteins was distinct in AD patients compared to the AMC
group. The hNEX t-tau level was significantly higher in the Mild-AD group than the AMC and MCI
groups (AMC, 16.16 ± 2.81; MCI, 17.45 ± 2.84; Mild-AD, 34.28 ± 7.58, both p < 0.05, Figure 2B). Similarly,
the hNEX p-tau (S202) level was significantly higher in the Mild-AD group than the MCI and AMC
groups (AMC, 3.63 ± 0.70; MCI, 5.85 ± 0.96; Mild-AD, 12.24 ± 2.69, p < 0.01 vs. AMC, p < 0.05 vs.
MCI, Figure 2C). In addition, the hNEX p-tau (S202)/t-tau ratio was significantly higher in the MCI
compared to the AMC group (AMC, 0.37 ± 0.03; MCI, 0.45 ± 0.036; Mild-AD, 0.34 ± 0.01, p < 0.05 vs.
MCI, Figure 2D).
      Next, we evaluated the correlations between hNEX tau levels and neurocognitive test scores and
found that hNEX p-tau (S202) levels were negatively correlated with MMSE scores (r = −0.30, p = 0.05,
Figure 2F) and demonstrated weak positive correlations with GDS scores (r = 0.27, p = 0.07, Figure S3B)
and CDR-SOB scores (r = 0.27, p = 0.07, Figure S3E). In contrast, there were no correlations between
hNEX t-tau levels and neurocognitive test scores (Figure 1E and Figure S3A,D). However, the hNEX
p-tau (S202)/t-tau ratio was positively correlated with MMSE scores (r = 0.30, p = 0.02, Figure 2G)
and demonstrated a weak negative correlation with CDR-SOB scores (r = −0.26, p = 0.06, Figure S3F),
but no correlation with GDS scores (r = −0.19, p = 0.19, Figure S3C). No correlation between hNEX
t-tau level or p-tau and age was detected (t-tau, r = 0.08903, p = 0.5025, Figure S3G; p-tau, r = −0.02038,
p = 0.8720, Figure S3H).
      We then performed ROC analysis to evaluate the diagnostic accuracy of hNEX t-tau and found that
a level higher than 30.94 pg/mL distinguished Mild-AD from AMC group subjects with a sensitivity
of 43.75% and specificity of 88.24% (AUC = 0.6434, p = 0.16, Figure 2H). Notable, however, hNEX
p-tau (S202) above 11.85 pg/mL distinguished Mild-AD from AMC subjects with 46.67% sensitivity but
100% specificity (AUC = 0.73, p = 0.03, Figure 2I), and a hNEX p-tau (S202)/t-tau of 0.39 distinguished
Mild-AD from AMC subjects with 93.75% sensitivity and 43.75% specificity (AUC = 0.6113, p = 0.28,
Figure 2J). These findings suggest that hNEX p-tau (S202)/t-tau ratio may serve as reliable biomarkers
for Mild-AD.
      We also evaluated p-tau (pThr181: T181) and Aβ levels in hNEX and serum as these proteins
are strongly implicated in AD pathogenesis. There were no significant differences in p-tau (T181)
among groups (serum: AMC, 9.59 ± 0.40; MCI, 9.68 ± 0.39; Mild-AD, 9.86 ± 0.69, Figure S4A; hNEX:
AMC, 14.11 ± 2.68; MCI, 14.06 ± 3.04; Mild-AD, 22.05 ± 4.04, Figure S4D). Alternatively, serum Aβ was
significantly lower in the Mild-AD group compared to the MCI group, while hNEX Aβ was slightly
greater in the Mild-AD group compared to both MCI and AMC groups (serum: AMC, 23.10 ± 1.29;
MCI, 27.14 ± 0.88; Mild-AD, 19.22 ± 2.24, p < 0.001 vs. MCI, Figure S4B; hNEX: AMC, 4.25 ± 0.64;
MCI, 4.08 ± 1.07; Mild-AD, 6.18 ± 0.94, Figure S4E). We also evaluated the serum and hNEX p-tau
(T181)/Aβ1-42 ratio level, but found no significant differences among groups (serum: AMC, 0.44 ± 0.04;
MCI, 0.37 ± 0.02; Mild-AD, 0.52 ± 0.06, Figure S4C; hNEX: AMC, 4.70 ± 0.64; MCI, 4.37 ± 0.40; Mild-AD,
3.62 ± 0.43, Figure S4F). Next, we evaluated the correlation between serum Aβ levels and neurocognitive
test scores but found no significant correlations with MMSE scores (r = 0.12, p = 0.30, Figure S4G), GDS
scores (r = −0.13, p = 0.27, Figure S4H), or CDR-SOB scores (r = −0.04, p = 0.72, Figure S4I).
      Females are known to have a higher incidence of AD than males, but there were no significant
sex differences in serum t-tau (Male, 251.7 ± 32.40; Female, 301.1 ± 31.97, Figure S5A), p-tau (S202)
(Male, 117.8 ± 16.43; Female, 113.3 ± 14.08, Figure S5B), and p-tau (T181) (Male, 9.65 ± 0.48; Female,
9.73 ± 0.33, Figure S5C). Similarly, there were no significance sex differences in hNEX t-tau (Male,
22.84 ± 2.79; Female, 19.39 ± 1.99, Figure S5E) and p-tau (T181) level (Male, 22.52 ± 2.76; Female,
17.67 ± 1.84, Figure S5G), but hNEX p-tau (S202) was significantly lower in females (Male, 14.85 ± 2.07;
Female, 9.84 ± 1.42, p < 0.05, Figure S5F). We also evaluated Aβ levels in serum and hNEX of males
and females but found no significant sex differences (serum: Male, 25.15 ± 1.14; Female, 23.14 ± 1.20,
Figure S5D; hNEX: Male, 5.11 ± 0.85; Female, 4.03 ± 0.52, Figure S5H).
Int. J. Mol. Sci. 2020, 21, 5007 7 of 20
2.4. Phosphorylated tau Protein Levels in Serum and hNEX Predict Cognitive Deterioration
These tau protein measures and correlations with AD severity are from patients at different stages
of AD, and thus associations with diagnostic significance may be overlooked. Therefore, we examined
these associations prospectively during patient follow-up. Blood samples were collected only in the
first year, and cognitive function tests were performed annually for 4 years. Changes in GDS and MMSE
scores were used for the evaluation of cognitive deterioration. Based on these results, patients were
divided into a slow progression group showing no significant increase in mean GDS score or a significant
decrease in mean MMSE score, and a cognitive deterioration group demonstrating significantly higher
mean GDS scores (1st, 3.40 ± 0.16; 4th, 4.60 ± 0.16, p < 0.01, Figure 3B) and numerically lower mean
MMSE score (1st, 18.30 ± 1.19; 4th, 15.20 ± 1.17, p = 0.08, Figure 3C). Serum p-tau (S202) levels
were higher in the cognitive deterioration group than the slow progression group (184.2 ± 29.29 vs.
114.6 ± 15.64 pg/mL, p < 0.05, Figure 3E), and there was a significant positive correlation between serum
p-tau (S202) and the change in GDS score (∆GDS) (r = 0.3909, p = 0.0297, Figure 3I). Alternatively, there
were no group differences in t-tau, p-tau (T181), and Aβ1-42 or correlations of these factors with ∆GDS
(Figure 3H–K). Baseline hNEX t-tau level was also greater in the cognitive deterioration group than the
slow progression group (33.83 ± 6.90 vs. 18.78 ± 2.46 pg/mL, p < 0.05, Figure 4A). Similarly, hNEX
p-tau (S202) level was higher in the cognitive deterioration group compared to the slow progression
group (17.20 ± 3.84 vs. 9.94 ± 1.63; p < 0.05, Figure 4B). Thus, elevated hNEX t-tau, hNEX p-tau (S202),
and serum p-tau (S202) are predictive of cognitive deterioration. In contrast, hNEX t-tau, p-tau (S202),
p-tau (T181), and Aβ1-42 were not correlated with ∆GDS (Figure 4E–H). In addition, t-tau, p-tau (T181),
and Aβ1-42 in human serum and neuronal cell-derived exosomes were not correlated with ∆MMSE
score (Figure S6), but serum p-tau (S202) was negatively correlated with ∆MMSE score (r = −0.35,
p = 0.05, Figure S6B).
Int. J. Mol. Sci. 2018, 19, x FOR PEER REVIEW 8 of 21
Figure 3. High
Figure 3. High baseline
baselinep-tau
p-tauininserum
serumpredicts
predicts long-term cognitivedeterioration.
long-term cognitive deterioration.A)(A) Timeline
Timeline of
of the
thefollow-up
follow-upstudy.
study. Blood
Bloodwaswascollected
collectedonce
once during
during thethe first
first year, and cognitive function tests were
performed
performedannually for for
annually 4 years. Changes
4 years. in in
Changes (B)B)GDS
GDSscore
score(∆GDS)
(ΔGDS)andand(C)C) ∆MMSE
ΔMMSE score are indicative
of cognitive deterioration.
of cognitive All All
deterioration. datadata
were shown
were as means
shown ± SEM.
as means ± SEM.p < 0.001
### ### compared
p < 0.001 to the
compared to first-year
the first-
score in score
year the cognitive deterioration
in the cognitive group using
deterioration grouptheusing
Mann–Whitney test. Comparisons
the Mann–Whitney of baseline
test. Comparisons of
serum (D) t-tau,
baseline serum(E)D) p-tau (S202),
t-tau, E) p-tau (F) p-tau
(S202), (T181),
F) p-tau and (G)
(T181), and Aβ Aβ1–between
G) 1–42 42 between slow
slowprogression
progression andand
cognitive deterioration
cognitive deterioration groups.
groups. Serum
Serump-tau
p-tau(S202)
(S202)levels
levelswere
werehigher
higherininthe
thecognitive
cognitivedeterioration
deterioration
group than the slow progression group. All data were shown as means ± SEM. * p < 0.05 compared to
the slow progression group using the Mann–Whitney test. Correlations of serum H) t-tau, I) p-tau
(S202), J) p-tau (T181), and K) Aβ1–42 with ΔGDS were assessed using the nonparametric Spearman’s
rank correlation test. Serum p-tau (S202) levels were significantly correlated with ΔGDS scores.Figure 3. High baseline p-tau in serum predicts long-term cognitive deterioration. A) Timeline of the
follow-up study. Blood was collected once during the first year, and cognitive function tests were
performed annually for 4 years. Changes in B) GDS score (ΔGDS) and C) ΔMMSE score are indicative
of cognitive deterioration. All data were shown as means ± SEM. ### p < 0.001 compared to the first-
Int. J. Mol.year
Sci. 2020,
score21,in5007
the cognitive deterioration group using the Mann–Whitney test. Comparisons of8 of 20
baseline serum D) t-tau, E) p-tau (S202), F) p-tau (T181), and G) Aβ1–42 between slow progression and
cognitive deterioration groups. Serum p-tau (S202) levels were higher in the cognitive deterioration
group
group than than
thethe
slowslow progression
progression group.
group. AllAll data
data were
were shown
shown asas means
means SEM.* *ppInt. J. Mol. Sci. 2020, 21, 5007 9 of 20
progression of AD. Similarly, tEX p-tau (S202, T205) was significantly higher in 15M-Tg mice compared
to 4M-WT, 4M-Tg, and 15M-WT mice (4M-WT, 1.01 ± 0.16; 4M-Tg, 1.90 ± 0.44; 15M-WT, 2.72 ± 0.23;
15M-Tg, 10.96 ± 0.42, p < 0.0001 and p < 0.01 vs. 4M-WT, p < 0.0001 vs. 4M-Tg, p < 0.0001 vs. 15M-WT,
Figure 5C), while tEX p-tau (T231) was higher in 15M-Tg mice compared to 4M-WT and 15M-WT mice
(4M-WT, 1.00 ± 0.13; 4M-Tg, 1.58 ± 0.27; 15M-WT, 1.03 ± 0.18; 15M-Tg, 3.30 ± 0.25, p < 0.05 vs. 4M-WT,
p < 0.05 vs. 15M-WT, Figure 5E). Alternatively, 15M-Tg mice exhibited the lowest tEX p-tau (T181)/t-tau
ratio (4M-WT, 1.00 ± 0.07; 4M-Tg, 1.28 ± 0.02; 15M-WT, 0.67 ± 0.08; 15M-Tg, 0.18 ± 0.00, p < 0.05 vs.
4M-Tg, Figure 5H) and a lower p-tau (T231)/t-tau ratio compared to 4M-Tg mice (4M-WT, 1.00 ± 0.12;
4M-Tg, 1.27 ± 0.23; 15M-WT, 0.60 ± 0.10; 15M-Tg, 0.42 ± 0.032, p < 0.05 vs. 4M-Tg, Figure 5I). 10 of 21
Int. J. Mol. Sci. 2018, 19, x FOR PEER REVIEW
Figure5.5.Total
Figure Totaltau tauandandphosphorylated
phosphorylatedtau tauexpression
expressionlevels
levelsininbrain
braintissue
tissueexosomes
exosomesofofJNPL3JNPL3mice
mice
increase
increase with the progression of pathology. Total tau and phosphorylated tau protein expressioninin
with the progression of pathology. Total tau and phosphorylated tau protein expression
brain
braintissue
tissueexosomes
exosomes(tEX) (tEX)were
werevalidated
validatedbybyWestern
Western blot.
blot. (A)
A)Representative
RepresentativeWestern
Westernblot.
blot.Relative
Relative
expression
expressionlevelslevelsof of(B) t-tau, C)
B) t-tau, (C)hyperphosphorylated
hyperphosphorylated tautau (p-tau
(p-tau (S202,
(S202, T205)),
T205)), D) (D)
p-taup-tau (T181),
(T181), E) p-
(E) p-tau (T231), and (F) TSG101 as well as the (G) p-tau (S202, T205)/t-tau ratio,
tau (T231), and F) TSG101 as well as the G) p-tau (S202, T205)/t-tau ratio, H) p-tau (T181)/t-tau ratio, (H) p-tau (T181)/t-tau
ratio, and
and I) (I) p-tau
p-tau (T231)/t-tau
(T231)/t-tau ratio ratio
in tEX.in tEX
tEX.t-tau
tEX t-tau was higher
was higher in 15-month-old
in 15-month-old JNPL3 JNPL3
micemice (15M-Tg)
(15M-Tg) than
than 4-month-old
4-month-old wildwildtypetypemicemice (4M-WT).
(4M-WT). tEX tEXp-taup-tau (S202,
(S202, T205) T205)
waswas higher
higher in 15M-Tg
in 15M-Tg mice mice
thanthan
4M-
4M-WT,
WT, 4M-Tg,4M-Tg, andand 15M-WT
15M-WT mice.
mice. tEXtEX p-tau
p-tau (T231)(T231)
waswashigherhigher in 15M-Tg
in 15M-Tg micemice
thanthan
4M-WT4M-WT and and
15M-
15M-WT
WT mice. mice.
tEX tEX
p-tau p-tau (T181)/t-tau
(T181)/t-tau and and
p-taup-tau (T231)/t-tau
(T231)/t-tau werewerelower lower in 15M-Tg
in 15M-Tg micemice
thanthan
4M-Tg 4M-Tg
mice.
mice. All data were shown as means ± SEM. * p < 0.05, ** p < 0.01, and ****
All data were shown as means ± SEM. * p < 0.05, ** p < 0.01, and **** p < 0.0001 compared to 4M-WT, p < 0.0001 compared to #
4M-WT, # p < 0.05 and #### p < 0.0001 compared to 4M-Tg, $ p < 0.05 and $$$$ p < 0.0001 compared to
p < 0.05 and #### p < 0.0001 compared to 4M-Tg, p < 0.05 and $ $$$$ p < 0.0001 compared to 15M-WT mice
15M-WT
by one-way miceANOVA
by one-way and ANOVA and Dunn’s
Dunn’s multiple multipletest.
comparison comparison
4M-WT (ntest. 4M-Tg(n(n== 10),
4M-WT
= 10), 4M-Tg
8), 15M-WT
(n(n==8), 15M-WT (n =
8), and 15M-Tg (n = 7). 8), and 15M-Tg (n = 7).
2.6. Total Tau and Phosphorylated Tau Protein Levels in Blood NEX from JNPL3 Mice Increased with The
2.6. Total Tau
Progression and PhosphorylatedTtau Protein Levels in Blood NEX from JNPL3 Mice Increased with The
of Pathology
Progression of Pathology
Finally, we quantified total tau (t-tau) and p-tau (S202) in mouse neuronal cell-derived exosomes
(mNEX) Finally,
from we quantified
4- or total tau
15-month-old WT(t-tau)
and Tgand p-tau
mice (S202)
using in mouse
ELISA. mNEX neuronal
t-tau andcell-derived exosomes
p-tau (S202) were
(mNEX) from 4- or 15-month-old WT and Tg mice using ELISA. mNEX t-tau and p-tau
significantly higher in 15M-Tg mice than all other groups (Figure 6A,B) and these differences were (S202) were
significantly
validated higher in
by Western 15M-Tg
blot mice
(Figure 6C).than all other
Relative groups levels
expression (Figureof6A,B)
t-tau,and these
p-tau differences
(S202, were
T205), p-tau
validated by Western blot (Figure 6C). Relative expression levels of t-tau, p-tau (S202, T205),
(T181), p-tau (T231), and TSG101, as well as p-tau (S202, T205)/t-tau, J) p-tau (T181)/t-tau, and K) p-tau p-tau
(T181), p-tau
(T231)/t-tau (T231),
ratios and TSG101,
in mNEX as well
were also as p-tau(Figure
examined (S202, 6D–K).
T205)/t-tau, J) p-tau (T181)/t-tau,
The 15M-Tg and K) p-
group demonstrated
tau (T231)/t-tau ratios in mNEX were also examined (Figure 6D-K). The 15M-Tg group demonstrated
highest mNEX expression levels of t-tau (4M-WT, 1.06 ± 0.19; 4M-Tg, 1.57 ± 0.24; 15M-WT, 1.84 ± 0.29;
15M-Tg, 2.98 ± 0.19, p < 0.0001 vs. 4M-WT, p < 0.001 vs. 4M-Tg, p < 0.01 vs. 15M-WT, Figure 6D) and
p-tau (S202, T205) (4M-WT, 1.00 ± 0.15; 4M-Tg, 1.68 ± 0.22; 15M-WT, 1.96 ± 0.24; 15M-Tg, 4.34 ± 0.15,
p < 0.0001 vs. 4M-WT, p < 0.001 vs. 4M-Tg, p < 0.01 vs. 15M-WT, Figure 6E). The 15M-Tg group also
exhibited greater expression of mNEX p-tau (T181) compared to 4M-WT mice (4M-WT, 1.00 ± 0.40;Int. J. Mol. Sci. 2020, 21, 5007 10 of 20
highest mNEX expression levels of t-tau (4M-WT, 1.06 ± 0.19; 4M-Tg, 1.57 ± 0.24; 15M-WT, 1.84 ± 0.29;
15M-Tg, 2.98 ± 0.19, p < 0.0001 vs. 4M-WT, p < 0.001 vs. 4M-Tg, p < 0.01 vs. 15M-WT, Figure 6D) and
p-tau (S202, T205) (4M-WT, 1.00 ± 0.15; 4M-Tg, 1.68 ± 0.22; 15M-WT, 1.96 ± 0.24; 15M-Tg, 4.34 ± 0.15,
p < 0.0001 vs. 4M-WT, p < 0.001 vs. 4M-Tg, p < 0.01 vs. 15M-WT, Figure 6E). The 15M-Tg group also
exhibited greater expression of mNEX p-tau (T181) compared to 4M-WT mice (4M-WT, 1.00 ± 0.40;
4M-Tg, 2.22 ± 0.60; 15M-WT, 2.56 ± 0.51; 15M-Tg, 6.39 ± 0.23, p < 0.01 vs. 4M-WT, Figure 6F) and
greater mNEX p-tau (T231) expression compared to 4M-WT and 4M-Tg mice (4M-WT, 1.00 ± 0.08;
4M-Tg, 1.11 ± 0.09; 15M-WT, 1.21 ± 0.06; 15M-Tg, 2.33 ± 0.05, p < 0.01 vs. 4M-WT, p < 0.05 vs. 4M-Tg,
Figure 6G). Ratios of p-tau (S202, T205)/t-tau (4M-WT, 1.00 ± 0.15; 4M-Tg, 1.14 ± 0.15; 15M-WT,
1.13 ± 0.14; 15M-Tg, 1.55 ± 0.05, p < 0.05 vs. 4M-WT, Figure 6I) and p-tau (T181)/t-tau were also higher
in the 15M-Tg group compared to the 4M-WT group (4M-WT, 1.00 ± 0.40; 4M-Tg, 1.51 ± 0.41; 15M-WT,
1.48 ± 0.29; 15M-Tg, 2.28 ± 0.08, p < 0.05 vs. 4M-WT, Figure 6J).
Int. J. Mol. Sci. 2018, 19, x FOR PEER REVIEW 11 of 21
Figure6.6. Total
Figure Totaltautauand
andphosphorylated
phosphorylatedtau tauprotein
proteinlevels
levelsininNEXNEXfrom fromthe theblood
bloodofofJNPL3
JNPL3micemice
increase
increasewith
withthe
theprogression
progression ofof
pathology.
pathology. (A)A)Total
Totaltautau(t-tau)
(t-tau)and
and(B)B)p-tau
p-tau(S202)
(S202)ininmouse
mouseneuronal
neuronal
cell-derived
cell-derivedexosomes
exosomes(mNEX)
(mNEX) were quantified
were quantified using
usingELISA.
ELISA.4M-WT
4M-WT (n =(n5),=4M-Tg (n = (n
5), 4M-Tg 10),= 15M-WT
10), 15M-
(nWT= 11), and 15M-Tg (n = 17). (C–K) mNEX t-tau and p-tau (S202) were higher
(n = 11), and 15M-Tg (n = 17). C–K) mNEX t-tau and p-tau (S202) were higher in 15M-Tg in 15M-Tg mice. mNEX mice.
t-tau
mNEX andt-tau
p-tauand
expression were validated
p-tau expression by Western
were validated byblot.
WesternC) Representative Western blot.
blot. C) Representative Relative
Western blot.
expression levels of (D)
Relative expression t-tau,
levels of (E) hyperphosphorylated
D) t-tau, E) hyperphosphorylatedtau (p-tau tau(S202,
(p-tauT205)),
(S202,(F) p-tau F)
T205)), (T181),
p-tau
(G) p-tauG)
(T181), (T231),
p-tauand (H) TSG101
(T231), and H) as well asas(I)well
TSG101 p-tau
as (S202,
I) p-tauT205)/t-tau ratio, (J) p-tau
(S202, T205)/t-tau ratio,(T181)/t-tau ratio,
J) p-tau (T181)/t-
and (K) p-tau (T231)/t-tau ratio in mouse NEX (mNEX). mNEX t-tau and p-tau
tau ratio, and K) p-tau (T231)/t-tau ratio in mouse NEX (mNEX). mNEX t-tau and p-tau (S202, T205) (S202, T205) were higher
inwere
15M-Tg
highermicein compared
15M-Tg mice to 4M-WT,
compared15M-WT,
to 4M-WT, and 15M-WT,
15M-Tg mice. mNEX p-tau
and 15M-Tg mice. (T181),
mNEX p-tau (S202,
p-tau (T181),
T205)/t-tau
p-tau (S202, ratio, and p-tau
T205)/t-tau (T181)/t-tau
ratio, ratio
and p-tau were higher
(T181)/t-tau ratioinwere
15M-Tg mice
higher incompared
15M-Tg mice to 4M-WT
compared mice.to
mNEX p-tau (T231) was higher in 15M-Tg mice compared to 4M-WT and
4M-WT mice. mNEX p-tau (T231) was higher in 15M-Tg mice compared to 4M-WT and 4M-Tg mice. 4M-Tg mice. All data were
shown as were
All data ± SEM
meansshown = 14 per
as(nmeans group).
± SEM (n = 14 < 0.05,
* p per ** p <
group). * p0.01, and******
< 0.05, < 0.0001
pInt. J. Mol. Sci. 2020, 21, 5007 11 of 20
108 ; 15M-Tg, 1.03 × 10⁹ ± 1.46 × 10⁸ , p < 0.05 vs. 15M-WT, Figure 7B). These results suggest that the
number of hNEX decreases during the progression from MCI to mild-AD (Figure 2A). As expected,
both tEX and mNEX were also significantly correlated with total particle number (r = 0.39, p < 0.05,
Figure 7C) and p-tau (S202, T205) expression (r = 0.75, p < 0.0001, Figure 7D).
Int. J. Mol. Sci. 2018, 19, x FOR PEER REVIEW 12 of 21
Figure 7. Correlations
Figure of neural
7. Correlations exosome
of neural exosomeandand
brain tissue
brain exosome
tissue exosomenumbersnumbersandandprotein
proteincontents
contents in
in
JNPL3 JNPL3 mice. Number of A) tEX and B) mNEX were quantified by ELISA for CD63. The number of
mice. Number of (A) tEX and (B) mNEX were quantified by ELISA for CD63. The number of
mNEX was lower
mNEX in 15M-Tg
was lower in 15M-Tg micemice
thanthan
15M-WT
15M-WT mice. AllAll
mice. data
datawere
wereshown means±±SEM.
shownasasmeans SEM. 4M-WT
4M-WT
(n = 10),
(n = 4M-Tg (n =(n8),= 15M-WT
10), 4M-Tg 8), 15M-WT = 8),
(n (n and
= 8), 15M-Tg(n(n== 7)
and15M-Tg 7) in
in tEX 4M-WT(n(n= =
analysis.4M-WT
tEX analysis. 8),8), 4M-Tg
4M-Tg (n
(n = 10), 15M-WT
= 10), 15M-WT = =11),
(n(n 11),and 15M-Tg(n(n==17)
and15M-Tg 17)ininmNEX analysis. $ ppInt. J. Mol. Sci. 2020, 21, 5007 12 of 20
correlations with other disease markers. In addition to the low-to-moderate accuracy, sensitivity,
and specificity of serum t-tau for AD diagnosis, we found no changes in serum Aβ or correlations with
neurocognitive test scores. In summary, there were significant differences in serum tau between AMC
and Mild-AD, although there was no clear difference between MCI and Mild-AD groups. However,
serum Aβ levels decreased with disease progression from MCI to mild-AD. Until now, there have
been numerous studies searching for useful blood-based AD-biomarkers, including plasma Aβ or tau.
A recent study using ultrasensitive methods showed that plasma Aβ was associated with cognitive
status and CSF biomarkers and plasma Aβ42 and Aβ40 were lower in AD than in amnestic MCI than
in non-amnestic MCI [29], whereas others reported the opposite [30–34]. These equivocal findings
yield conflicting results concerning the predictive value of AD diagnosis and cognitive decline in the
AD group. Recent reports regarding tau levels revealed that plasma tau reflected brain tau levels [17],
and plasma tau levels were specifically elevated in AD patients [19]. At the same time, other studies
concluded that t-tau were not suitable as AD biomarkers because of the large overlap of plasma
t-tau levels between normal aging and AD [19,20]. A more recent study quantifying plasma p-tau
(T181) showed that the plasma p-tau (T181) in the AD group was significantly higher than that in the
age-matched control group, but showed a too low cut-off value (0.0921 pg/mL) of plasma p-tau181 [20]
This result with plasma p-tau (T181) differs from our ELISA results that serum p-tau (T181) did not
differ between AMC, MCI, and Mild-AD. In addition, the scale of the measured value fo p-tau was
different. Perhaps this discrepancy is due to differences in the experimental scheme, including blood
samples and measurement methods. However, our WB results for p-tau (T181) levels show that p-tau
(T181) protein in Mild-AD was significantly increased compared to both the MCI and AMC groups.
P-tau (T181)/t-tau ratio of the Mild-AD group also significantly higher than that of the AMC group.
Since the results seem to differ depending on the experiment method, the potential for AD biomarkers
of plasma t-tau and p-tau requires further examination for diagnostic reliability, including correlation
with clinical features such as cognitive dysfunction.
In contrast to total serum tau proteins, we found that serum exosome tau was more strongly
predictive of disease status according to ROC, presumably as these vesicle-associated proteins better
reflect the pathological status of the brain. Tau proteins are abundant in the brain, especially in distal
axons [7]. We hypothesized that pathological proteins such as t-tau and p-tau can be delivered to the
circulation by exosomes, which can act as biological barrier-permeable carriers. Therefore, we isolated
human neural exosomes (hNEX) in serum samples from the AMC, MCI, and Mild-AD group subjects
and measured expression levels of tau protein by ELISA and Western blot. Although the level of
tau protein in NEX was about one-tenth that in serum, group differences were more pronounced.
For instance, while serum p-tau did not differ among groups (Figure 1), serum hNEX p-tau was
significantly higher in the Mild-AD group than the MCI and AMC groups, while the hNEX p-tau/t-tau
ratio was higher in the Mild-AD group than the AMC group, respectively. Further, both NEX t-tau
and p-tau (S202) protein levels distinguished MCI from mild-AD with high specificity or sensitivity
according to ROC analysis. NEX p-tau (S202) was also significantly correlated with MMSE scores,
further suggesting a strong association with disease progression.
As the variability of cross-sectional data can overlook clinically useful associations, enrolled
subjects were also followed for 4 years with annual cognitive function testing following a single blood
test. Both serum and NEX p-tau (S202) during the first year were correlated with the changes in GSD
and MMSE scores after 4 years, indicating that high baseline serum or NEX p-tau protein is predictive
of faster disease progression and cognitive decline. Alternatively, p-tau (T181) and Aβ levels did not
correlate with these changes in GSD and MMSE scores during follow-up.
Both t-tau and p-tau proteins were significantly elevated in the Mild-AD group, as confirmed by
Western blotting. In particular, PHF (pSer202 + pThr205) and pThr181 were significantly higher in the
Mild-AD group. These results clearly show that at least some pathogenic proteins in the brain tissue
can enter the circulation via exosomes, thus reflecting the current state of brain pathology. It has been
reported that tau protein is difficult to measure in blood because of its short half-life [35,36]. However,Int. J. Mol. Sci. 2020, 21, 5007 13 of 20
pathogenic proteins in blood may be protected from enzymatic damage if contained within vesicles
such as exosomes. Although NEX tau proteins can distinguish between MCI and mild-AD more
accurately than the corresponding free serum proteins, there are several drawbacks. First, the isolation
process is complex. Further, individual proteins only partially reflect the complex pathology of AD.
A combination of NEX proteins may provide a more accurate and reliable diagnosis, disease staging,
and prognosis.
Since NEX isolated from blood is derived from brain tissue exosomes, we hypothesized that the
changes in NEX proteins would reflect pathogenic changes in the brain. There was a significant decrease
in the number of hNEX in the Mild-AD group compared to the MCI group as well as in aged AD model
mice compared to younger WT and Tg mice, suggesting reduced tau protein clearance in the brain with
disease progression and that exosomal egress serves a protective function. In addition to pathogenic
effects, tau proteins remaining in the brain may facilitate further accumulation. This possibility was
confirmed using JNPL3 Tg mice, in which p-tau accumulation was greater in the brains of 15-month-old
than 4-month-old animals. In accord with human blood NEX, the number of mouse neural exosomes
(mNEX) was significantly lower in 15-month-old Tg JNPL3 mice compared to age-matched WT mice.
We also found that the number of neural exosomes was significantly correlated with the number of
brain tissue exosomes. Expression levels of t-tau and p-tau proteins in blood NEX as well as brain
tissue exosomes increased with pathological progression in JNPL3 mice. Moreover, the expression
of NEX p-tau protein was significantly correlated with p-tau protein in brain exosomes. Collectively,
these findings indicate that tau proteins in blood exosomes reflect the level of tau proteins in the brain,
and thus may be useful markers for monitoring the progression of AD.
In this study, we demonstrate that total tau and phospho-tau (S202) associated with brain-derived
serum exosomes can distinguish mild AD from MCI and healthy controls with greater accuracy than
free serum proteins. Further, we show that elevated levels of these serum exosome-associated proteins
at baseline can predict long-term cognitive decline. Finally, we provide compelling evidence from AD
model mice that AD-related proteins in serum exosomes are indeed derived from brain exosomes.
4. Materials and Methods
4.1. Patients, Controls, and Methods
A total of 76 subjects aged 65–90 years were recruited from Gachon University Gil Medical Center,
Incheon, Korea, including 26 healthy age-matched control subjects and 50 cognitive impairment
confirmed according to the criteria described in our previous report [37]. Briefly, individuals with
subjective cognitive complaints were first screened for cognitive impairment using a cut-off score
of > 26 of 30 on the Mini-Mental State Examination (MMSE) [38]. Subjects scoring below 26 were
subjected to detailed neuropsychological testing, including the Clinical Dementia Rating-Sum of
Box (CDR-SOB; scores > 2.5) and Global Deterioration Scale (GDS; scores > 3), which are broadly
accepted measures for dementia [39]. Patients with comorbidities were excluded. Patients were
diagnosed according to American Psychiatric Association DSM-IV criteria. All clinical tests were
performed by investigators blinded to the subjects’ genetic status; however, the blinded condition
could not realistically be maintained for overtly demented subjects. Table 1 summarizes the clinical
and demographic characteristics of the study population. The study was conducted according to the
guidelines of the Ethics Committee of Gachon University Gil Medical Center and with the approval of
the institutional review board of Gachon University Gil Medical Center (GAIRB2013-264, 23 October
2013, GCIRB2016-015, 21 January 2016). All the subjects provided written informed consent before
participating via self-referral or referral from a family member.
4.2. Serum Separation
Ten milliliters (mL) of blood was collected from each participant by vein puncture into sterile
vacutainers under strict aseptic conditions. The samples were kept at room temperature (RT) forInt. J. Mol. Sci. 2020, 21, 5007 14 of 20
30–40 min to clot, and then centrifuged for 20 min at 1000× g to separate the serum. Serum was collected
carefully, and a protease inhibitor cocktail (535140; EMD Biosciences, Inc., Darmstadt, Germany)
and phosphatase inhibitor cocktail (P5726 and P0044; Sigma-Aldrich, Inc., St. Louis, Missouri, USA)
were added. Serum samples were aliquoted and immediately stored at −80 ◦ C until further analysis.
Aliquots were thawed on the day of analysis.
4.3. Animals
JNPL3 mice expressing mutant human tau mutation (MAPT) were obtained from Taconic Farms
(Germantown, NY, USA). All mice were genotyped by polymerase chain reaction analysis of tail DNA.
Four- and 15-month-old WT and JNPL3 mice were used in this study. All animal procedures were
approved by the Institutional Animal Care and Use Committee of the Lee Gil Ya Cancer and Diabetes
Institute, Gachon University (IACUC No. LCDI-2019-0114, 24 June 2019, LCDI-2020-0033, 4 June 2020).
4.4. Isolation of NEX from Serum
From each patient group, 16 serum samples were selected randomly for NEX isolation. Briefly,
0.5 mL of serum was mixed with 252 µL of ExoQuick EX precipitation solution (EXOQ5A-1; System
Biosciences, Inc., Palo Alto, CA, USA) and incubated for 1 h at 4 ◦ C. After centrifugation at 1500× g
for 30 min at 4 ◦ C, the pellet was resuspended in 250 µL of calcium- and magnesium-free Dulbecco’s
balanced salt solution (DPBS; Thermo Fisher Scientific, Waltham, MA, USA) with inhibitor cocktails.
The NEX fraction was then enriched according to a previous report [26]. Each sample was mixed
with 100 µL of 3% bovine serum albumin (BSA) and incubated for 1 h at 4 ◦ C, followed by the addition
of 1 mg rabbit anti-human CD171/NCAM-L1 (L1 cell adhesion molecule [L1CAM]) biotin-conjugated
antibody (bs-1996R-Biotin; Bioss Antibodies Inc., Woburn, MA, USA) and 25 µL streptavidin-agarose
resin (53116, Thermo Fisher Scientific) plus 50 µL of 3% BSA. After centrifugation at 200× g for 10 min
at 4 ◦ C and removal of the supernatant, the pellet was resuspended in 50 µL of 0.05 M glycine-HCl
(pH 3.0) by vortexing for 10 s. The suspension was then mixed with 0.45 mL of M-PER mammalian
protein extraction reagent (78501, Thermo Fisher Scientific) and incubated for 10 min at 37 ◦ C with
vortex mixing. Extracted proteins were immediately stored at −80 ◦ C until further analysis.
4.5. Isolation of TEX from Brain Tissue
Exosomes were extracted from brain tissue according to the methods of Perez-Gonzalez and
colleagues [27] with minor modifications. Frozen (−80 ◦ C) mouse brain (one hemisphere) was chopped
in trypsin solution prewarmed to 37 ◦ C at 0.1 g/mL. The tissue was then transferred to 15 mL tubes
containing 1 × trypsin (Gibco BRL., Thermo Fisher Scientific) and incubated for 20 min at 37 ◦ C
with gentle shaking. Ice-cold DMEM (with protease inhibitor (PI), Gibco BRL) was added to stop
digestion. The suspension was then mixed by being gently pipetted twice, filtered through 40 µm
mesh, and centrifuged at 300 × g for 10 min at 4 ◦ C to remove brain cells and tissue. The supernatant
was transferred to a fresh tube and centrifuged at 2000 × g for 10 min at 4 ◦ C. The second supernatant
was then centrifuged at 10,000 × g for 30 min at 4 ◦ C and sequentially filtered with 0.45 µm filter and
0.2 µm filter. Each filtrate was diluted with ice-cold phosphate-buffered saline (PBS) and centrifuged
3 times, each time at 100,000 × g for 70 min at 4 ◦ C using an ultracentrifuge (SW28, Beckman, Miami,
FL, USA) to pellet the vesicles. The final extracellular vesicle pellet was resuspended in 0.95 M sucrose
solution, and centrifuged through a 6-layer sucrose gradient (0.25 M, 0.6 M, 0.95 M, 1.3 M, 1.65 M, and
2 M sucrose solution in 20 mM HEPES) at 200,000× g for 16 h at 4 ◦ C using an ultracentrifuge (SW41,
Beckman). Each fraction was diluted with ice-cold PBS and centrifuged at 100,000 × g (average) for
1 h at 4 ◦ C (SW41, Beckman) to pellet the vesicles. The supernatant was discarded and pellets were
collected in ice-cold PBS (with PI). The vesicles in fractions 1–3 were then characterized by a suite of
techniques including transmission electron microscopy to confirm enrichment of exosomes.Int. J. Mol. Sci. 2020, 21, 5007 15 of 20
4.6. Electron Microscopy
Analysis of exosomes by TEM was conducted with the support of the Brain Research Core Facilities
at the Korea Brain Research Institute (KBRI, Daegu, Korea). Glow discharge Formvar-carbon coated
grids were prepared using the PELCO easiBlow Glow Discharge system (Ted Pella Inc., Redding, CA,
USA). Grids were glow discharged for 30 s at 15 mA. Exosome pellets were suspended in 0.15 M
cacodylate buffer (pH 7.4), applied onto glow discharged Formvar-carbon coated EM grids (Ted Pella
Inc.), and left for 1 min in the air to allow the membranes to absorb on the surface. The excess sample
liquid was then blotted off using filter paper (3M, Maplewood, MN, USA). The grid surface was floated
on the surface of a 4% uranyl acetate staining solution (EMS-CHEMIE, Eftec North America, Taylor, MI,
USA) for 1 min and then the excess solution was blotted off using 3M filter paper. The grid surface was
then floated on the surface of a water droplet, and the water blotted off with filter paper. This latter
procedure was repeated 5 times, and the grid was then dried in the air. Grids were then examined using
a Tecnai G2 transmission electron microscope (Thermo Fisher Scientific). Vesicle size was measured
using ImageJ between groups, we measured the density of the band using ImageJ (National Institutes
of Health [NIH], Bethesda, Maryland, USA, https://imagej.nih.gov/ij/, 1997-2016).
4.7. Nanoparticle Tracking Analysis
Exosome pellets were resuspended in 60 µL PBS. Sucrose gradient fractions SN0, SN∆1, and SN∆2
were concentrated in Amicon® Ultra-4 10 kDa nominal molecular weight centrifugal filter units to a
final volume of 60 µL and a 10 µL of each prepared fraction diluted to 1:100 in PBS. Pellets obtained
from 2 mL of media with Exo-quick were resuspended in 1 mL of PBS for nanoparticle tracking analysis
(NTA) (particle concentrations were corrected for this concentration factor). Samples were analyzed in
the range of 3–15 × 108 /mL by NTA using the NanoSight NS500 (Malvern Panalytical, Worcestershire,
UK) equipped with a 405 nm laser. Videos were acquired and analyzed using the accompanying NTA
software (version 3.1, Malvern Panalytical). The number of vesicles in each sample was presented as
particles/mL media (mean ± S.D., n = 6).
4.8. Measurements of t-tau and p-tau Protein Levels
Serum concentrations of t-tau, p-tau, and amyloid-beta (Aβ42 ) were detected using the following
ELISA kits: Human tau protein ELISA kit, human phospho-tau (S202, T205) protein ELISA kit, human
phosphor-tau (T181) protein ELISA kit, human phosphor-tau (S231) protein ELISA kit, and human
Aβ42 ultrasensitive ELISA kit (Table 2). We used 50 µL of the sample according to the manufacturer’s
instructions and diluted it 1:5 if necessary.
Table 2. Antibodies and ELISA kits used in this study.
Target Species Dilution Company (Catalog)
For Western blot analysis
System Biosciences
Anti-CD63 IgG Rabbit 1:1000
(EXOAB-CD63A-1)
Anti-TSG101 IgG Rabbit 1:1000 Abcam (AB125011)
Anti-NCAM-L1 IgG Goat 1:1000 Santa Cruz Biotechnology (SC-1508)
Anti-Total tau (C-17) Goat 1:500 Santa Cruz Biotechnology (SC-1995)
Anti-Phospho tau (S202, T205) (AT8) Mouse 1:500 Thermo Fisher Scientific (MN1020)
Anti-Phospho tau (T181) (AT270) Mouse 1:500 Thermo Fisher Scientific (MN1050)
Anti-Phospho tau (T231) (AT180) Mouse 1:500 Thermo Fisher Scientific (MN1040)
Anti-mouse IgG HRP 1:3000 Biorad (170-6516)
Anti-rabbit IgG HRP 1:5000 Biorad (170-6515)
Anti-goat IgG HRP 1:5000 Santa cruz (SC-2020)You can also read