Transcriptome Analysis of Watermelon Leaves Reveals Candidate Genes Responsive to Cucumber green mottle mosaic virus Infection - MDPI
←
→
Page content transcription
If your browser does not render page correctly, please read the page content below
International Journal of
           Molecular Sciences

Article
Transcriptome Analysis of Watermelon Leaves
Reveals Candidate Genes Responsive to
Cucumber green mottle mosaic virus Infection
Yuyan Sun 1,2 , Min Fan 1, * and Yanjun He 1
 1    Institute of Vegetables, Zhejiang Academy of Agricultural Sciences, Hangzhou 310021, China;
      syy1111@126.com (Y.S.); hyj1009@163.com (Y.H.)
 2    Key Laboratory of Biology and Genetic Improvement of Horticultural Crops, Ministry of Agriculture,
      Beijing 100081, China
 *    Correspondence: fanminfm@sina.com

 Received: 11 January 2019; Accepted: 28 January 2019; Published: 31 January 2019

 Abstract: Cucumber green mottle mosaic virus (CGMMV) is a member of the genus Tobamovirus, which
 cause diseases in cucurbits, especially watermelon. In watermelon, symptoms develop on the
 whole plant, including leaves, stems, peduncles, and fruit. To better understand the molecular
 mechanisms of watermelon early responses to CGMMV infection, a comparative transcriptome
 analysis of 24 h CGMMV-infected and mock-inoculated watermelon leaves was performed. A total
 of 1641 differently expressed genes (DEGs) were identified, with 886 DEGs upregulated and 755
 DEGs downregulated after CGMMV infection. A functional analysis indicated that the DEGs were
 involved in photosynthesis, plant–pathogen interactions, secondary metabolism, and plant hormone
 signal transduction. In addition, a few transcription factor families, including WRKY, MYB, HLH,
 bZIP and NAC, were responsive to the CGMMV-induced stress. To confirm the high-throughput
 sequencing results, 15 DEGs were validated by qRT-PCR analysis. The results provide insights into
 the identification of candidate genes or pathways involved in the responses of watermelon leaves to
 CGMMV infection.

 Keywords: watermelon; Cucumber green mottle mosaic virus; transcriptome; qRT-PCR

1. Introduction
     Watermelon [Citrullus lanatus (Thunb.) Matsum. & Nakai] is an important cucurbit crop grown
worldwide. Watermelon fruit provide glucose, fructose, malic acid, lycopene, vitamins, and amino
acids, which are desired by consumers. In 2016, approximately 117 million tons of watermelon were
produced, accounting for 10.9% of total global vegetable production (available online: http://www.fao.
org/faostat). China was the leading country, producing approximately 79 million tons of watermelon,
which constituted 67.7% of the worldwide production (available online: http://www.fao.org/faostat).
Currently, watermelon production is threatened by the Cucumber green mottle mosaic virus (CGMMV).
     CGMMV is a member of the genus Tobamovirus in the Virgaviridae family. It has a 6.4-kb
single-stranded, positive-sense RNA genome, which produces a stiff, rod-shaped 300 × 18-nm
particle [1]. CGMMV is readily spread by contact, and pollen and seed transmission [2]. Since
it was first report in 1935 in England, where it was found to cause diseases in cucumber [3,4], CGMMV
has achieved a global distribution, being present in more than 30 countries, and has become a major
threat to cucurbit-based industries [5–8]. In CGMMV-infected watermelon, mottling and mosaic
develop on the leaves, brown necrotic lesions develop on the stems and peduncles, and the flesh
becomes spongy and rotting, with dirty red discolorations [9].

Int. J. Mol. Sci. 2019, 20, 610; doi:10.3390/ijms20030610                           www.mdpi.com/journal/ijms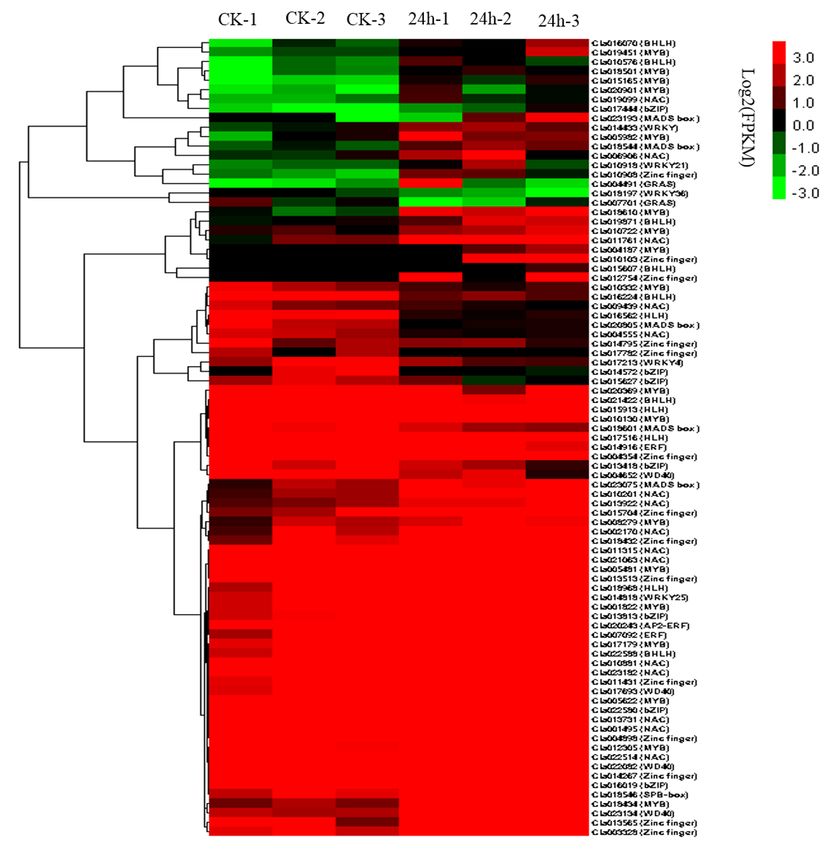
Int.
Int. J.J. Mol.
Mol. Sci. 2019, 20,
Sci. 2019, 20, 610
x FOR PEER REVIEW 22 of
of19
18
Several investigations of plant–virus interactions have focused on transcriptional or post-
Several investigations
transcriptional of plant–virus
responses to CGMMV infectionsinteractions have focused
[10–15]. For instance, miRNAon transcriptional
sequencing analysisor of
post-transcriptional responses to CGMMV infections [10–15]. For instance,
cucumber and watermelon leaves infected by CGMMV revealed potential miRNAs and target genes miRNA sequencing
analysis
involvedofincucumber
responsesand to watermelon
CGMMV-induced leavesstress
infected by CGMMV
[10,14]. Profiles revealed potential miRNAs
of CGMMV-derived siRNAs and
in
target genes involved in responses to CGMMV-induced stress [10,14]. Profiles
infected cucumber [11], bottle gourd [12] and watermelon [15] indicated that vsiRNAs have of CGMMV-derived
siRNAs in infected
complicated cucumber
functions during[11], bottle gourd
host–virus [12] and watermelon
interactions. In addition,[15] indicated that
transcriptome vsiRNAs
analysis of
have complicated
watermelon functions during
fruit responding host–virus interactions.
to CGMMV-induced In addition,
stress revealed that some transcriptome
differentiallyanalysis
expressed of
watermelon
genes (DEGs) fruit responding
related to cell to CGMMV-induced
wall components andstress revealed that
photosynthesis may some
be differentially expressed
directly involved in the
genes
formation of diseased watermelon symptoms [13]. However, gene expression levels in leavesthe
(DEGs) related to cell wall components and photosynthesis may be directly involved in of
formation of diseased
CGMMV-infected watermelon
watermelons have symptoms
not been[13]. However,
studied. Here, wegene expression
analyzed the levels in leaves of
early responses of
CGMMV-infected
watermelon leaveswatermelons
to CGMMVhave not been
infection using studied. Here, we analyzed
RNA sequencing (RNA-Seq) theand
earlyinvestigated
responses
of watermelon
alterations leaves
in gene to CGMMV
expression levels infection using RNA
between healthy sequencing (RNA-Seq)
and CGMMV-infected plants. and investigated
A subset of DEGs
alterations in gene expression levels between healthy and CGMMV-infected plants.
involved in photosynthesis, plant–pathogen interactions, secondary metabolism and plant hormone A subset of DEGs
involved in photosynthesis,
signal transduction plant–pathogen
were identified. interactions,
The results secondary
provide insights intometabolism and plant
the identification hormone
of candidate
signal
genes transduction were identified.
or pathways associated The results
with responses of provide insights
watermelon into
leaves tothe identification
CGMMV of candidate
infection.
genes or pathways associated with responses of watermelon leaves to CGMMV infection.
2. Results
2. Results
2.1. Phenotypes
2.1. Phenotypes and
and Confirmation
Confirmation of
of CGMMV
CGMMV in
in Watermelon
Watermelon Post
Post Inoculation
Inoculation
At 24-h post-inoculation
post-inoculation (24 hpi), there werewere nono obvious
obvious disease
disease symptoms
symptoms exhibited
exhibited in
in the
the
watermelon
watermelon leaves compared
compared with
withthe
theckckplants
plants (Figure
(Figure 1a,b).
1a,b). TheThe accumulation
accumulation of CGMMV
of CGMMV in
in both
both ck and 24 hpi plants was confirmed by RT-PCR, the 24 hpi samples clearly amplified
ck and 24 hpi plants was confirmed by RT-PCR, the 24 hpi samples clearly amplified the specific 486- the
specific
bp CGMMV 486-bpCPCGMMV
fragment CP(Figure
fragment
1c).(Figure 1c). The
The results results
showed showed
that even that even
though nothough
obviousnosymtoms
obvious
symtoms developed in 24 hpi watermelon leaves, the virus has accumulated in the plants at
developed in 24 hpi watermelon leaves, the virus has accumulated in the plants at the early infectiousthe early
infectious
time. time.
Figure 1. Phenotypes and confirmation of Cucumber green mottle mosaic virus (CGMMV) in
Figure 1. Phenotypes and confirmation of Cucumber green mottle mosaic virus (CGMMV) in
watermelon leaves. (a) ck watermelon leaf; (b) 24-h post-inoculation (24 hpi) watermelon leaf;
watermelon leaves. a: ck watermelon leaf; b: 24-h post-inoculation (24 hpi) watermelon leaf; c: RT-
(c) RT-PCR confirmation of CGMMV accumulation in watermelon leaves.
PCR confirmation of CGMMV accumulation in watermelon leaves.
2.2. Overview of the RNA-Seq Results
2.2. Overview of the RNA-Seq Results
Here, triplicates of treatments for ck and 24 hpi samples were conducted, and six leaf samples
were Here, triplicates
prepared for RNAof treatments for ck
extraction and and 24sequencing.
Illumina hpi samplesA were
totalconducted, and raw
of 282,952,260 six leaf samples
reads were
were prepared for RNA extraction and Illumina sequencing. A total of 282,952,260 raw
generated, encompassing 42.44 Gb data, which were sufficient for the gene expression analysis. Afterreads were
generated,the
removing encompassing 42.44and
low-quality reads Gb data, which
adapter were sufficient
sequences, for (97.60%)
276,176,444 the gene clean
expression analysis.
reads were After
obtained.
removing the low-quality reads and adapter sequences, 276,176,444 (97.60%) clean
Using TopHat2 software, 266,058,279 (96.33%) clean reads were mapped to the watermelon genome, reads were
obtained. Using TopHat2 software, 266,058,279 (96.33%) clean reads were mapped to
and 200,211,479 (72.49%) unique reads were mapped the reference genome. The Q20 percentage wasthe watermelon
genome,
over andand
99.60%, 200,211,479 (72.49%) unique
the Q30 percentage was overreads
96.06%were mapped
(Table 1). the reference genome. The Q20
percentage was over 99.60%, and the Q30 percentage was over 96.06% (Table 1).
Int. J. Mol. Sci. 2019, 20, 610                                                                                 3 of 19
Int. J. Mol. Sci. 2019, 20, x FOR PEER REVIEW                                                                    3 of 18

                   Table 1.
                   Table    Overview of
                         1. Overview of the
                                         the watermelon
                                             watermelon leaf
                                                        leaf RNA
                                                             RNA sequencing
                                                                 sequencing (RNA-Seq) data.

                Raw          Raw                                                 Unique
                                                                                  UniqueMapped
                                                                                          Mapped
 Sample
  Sample     Raw Reads       Raw Base Clean
                                          Clean   Reads
                                               Reads        Mapped Reads
                                                            Mapped Reads                               Q20%
                                                                                                        Q20%    Q30%
                                                                                                                Q30%
               Reads         Base                                                     Reads
                                                                                       Reads
   ck_1
    ck_1      52659470
             52,659,470        7.90
                            7.90 G G 52,037,998
                                        52037998(98.82%)
                                                (98.82%)    50088200(96.25%)
                                                           50,088,200 (96.25%)   38860793(74.68%)
                                                                                 38,860,793 (74.68%)   99.75
                                                                                                        99.75   96.64
                                                                                                                 96.64
   ck_2
    ck_2      49566772
             49,566,772        7.44
                            7.44 G G 49,101,272
                                        49101272(99.06%)
                                                (99.06%)    46572421(94.85%)
                                                           46,572,421 (94.85%)   32009543(65.19%)
                                                                                 32,009,543 (65.19%)   99.67
                                                                                                        99.67   96.41
                                                                                                                 96.41
   ck_3
    ck_3      43812198
             43,812,198        6.57
                            6.57 G G 43,327,768
                                        43327768(98.89%)
                                                (98.89%)    41915065(96.74%)
                                                           41,915,065 (96.74%)   32382435(74.74%)
                                                                                 32,382,435 (74.74%)   99.71
                                                                                                        99.71   96.34
                                                                                                                 96.34
   24h_1
  24h_1      41,190,724
              41190724      6.18 G G 36,924,504
                               6.18             (89.64%)
                                        36924504(89.64%)   35,371,699 (95.79%)
                                                            35371699(95.79%)     27,425,778 (74.28%)
                                                                                 27425778(74.28%)       99.60
                                                                                                       99.60     96.56
                                                                                                                96.56
   24h_2
  24h_2      46,758,132
              46758132      7.01 G G 46,328,460
                               7.01             (99.08%)
                                        46328460(99.08%)   44,965,010 (97.06%)
                                                            44965010(97.06%)     3,3083,469 (71.41%)
                                                                                 33083469(71.41%)       99.83
                                                                                                       99.83     97.30
                                                                                                                97.30
   24h_3
  24h_3      48,964,964
              48964964      7.34 G G 48,456,442
                               7.34             (98.96%)
                                        48456442(98.96%)   47,145,884 (97.30%)
                                                            47145884(97.30%)     36,449,461 (75.22%)
                                                                                 36449461(75.22%)       99.71
                                                                                                       99.71     96.06
                                                                                                                96.06

2.3. Analysis
2.3. Analysis of
              of DEGs
                 DEGs in
                       in Response
                          Response to
                                    to CGMMV-Induced
                                       CGMMV-Induced Stress
                                                     Stress
      Genes with
      Genes   with aa false
                       false discovery
                             discovery rate
                                        rate (FDR)
                                             (FDR)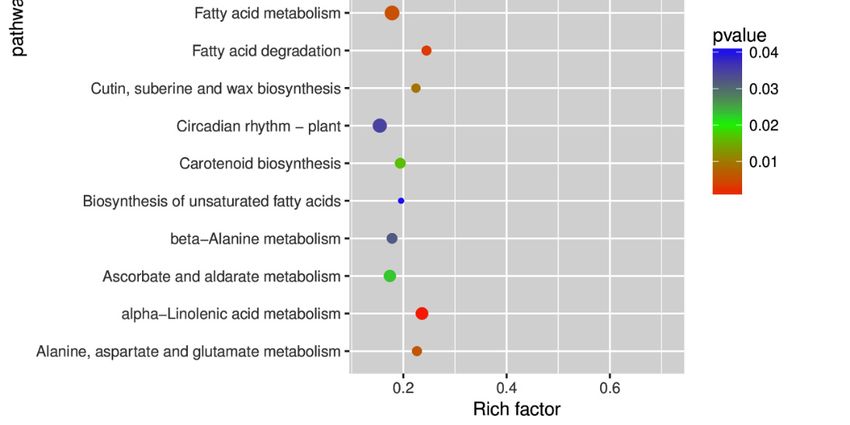
Int. J. Mol. Sci. 2019, 20, 610 4 of 19
Int. J. Mol. Sci. 2019, 20, x FOR PEER REVIEW 4 of 18
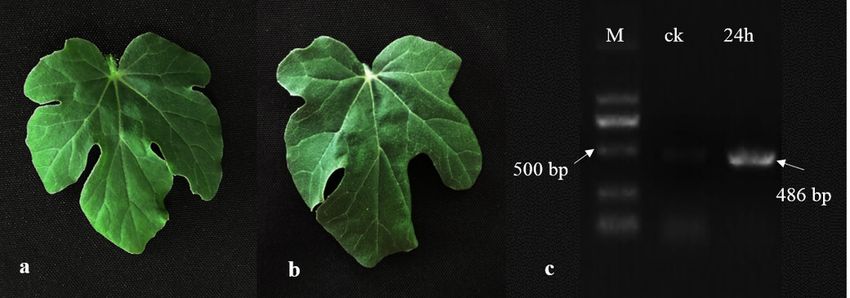
Figure 3. Hierarchical clustering of differential expression profiles for 1641 genes between the 24 hpi
Figure 3. Hierarchical clustering of differential expression profiles for 1641 genes between the 24 hpi
and ck watermelon leaf libraries (false discovery rate (FDR) ≥ 0.05 and absolute value of the log2
and ck watermelon leaf libraries (false discovery rate (FDR) ≥ 0.05 and absolute value of the log2 ratio > 1).
ratio > 1).
2.4.
2.4. Gene
GeneOntology
Ontology(GO)
(GO)and
andKyoto
Kyoto Encyclopedia
Encyclopedia of
of Genes
Genes and
and Genomes
Genomes (KEGG)
(KEGG) Pathway
Pathway Enrichment
Enrichment
Analyses of DEGs
Analyses of DEGs
On the
On the basis
basis of
of the
the GO
GO classifications,
classifications, DEGs
DEGs were separated
separated into three categories: molecular
molecular
function,cellular
function, cellularcomponent,
component,andandbiological
biologicalprocess
process(Table
(Table S2).
S2). In
Inthe
thecategory
categoryofofmolecular
molecularfunction,
function,
pigment binding,
pigment binding, chlorophyll
chlorophyllbinding,
binding,transcription
transcriptionfactor
factor(TF)(TF)activity,
activity, and
and sequence-specific
sequence-specificDNADNA
binding were significantly enriched (Figure 4; Table S2). In the category of cellular
binding were significantly enriched (Figure 4; Table S2). In the category of cellular component, component,
chloroplast thylakoid
chloroplast thylakoid membrane,
membrane, thylakoid,
thylakoid, chloroplast
chloroplaststroma,
stroma, chloroplast
chloroplast envelope,
envelope, chloroplast,
chloroplast,
chloroplast thylakoid lumen, plastoglobule, apoplast, chloroplast thylakoid, thylakoid
chloroplast thylakoid lumen, plastoglobule, apoplast, chloroplast thylakoid, thylakoid lumen, and lumen, and
cell wall
cell wall were
were significantly
significantly enriched
enriched (Figure
(Figure 4;
4; Table
Table S2). In In the
the category
category ofof biological
biological process,
process,
photosynthesis,light
photosynthesis, lightharvesting
harvestingin
inphotosystem
photosystem(PS)(PS)I,I, response
response to to abscisic
abscisic acid
acid (ABA),
(ABA), response
response toto
cold, response to heat, response to water deprivation, and photosynthesis were significantly
cold, response to heat, response to water deprivation, and photosynthesis were significantly enriched enriched
(Figure 4;
(Figure 4; Table
Table S2).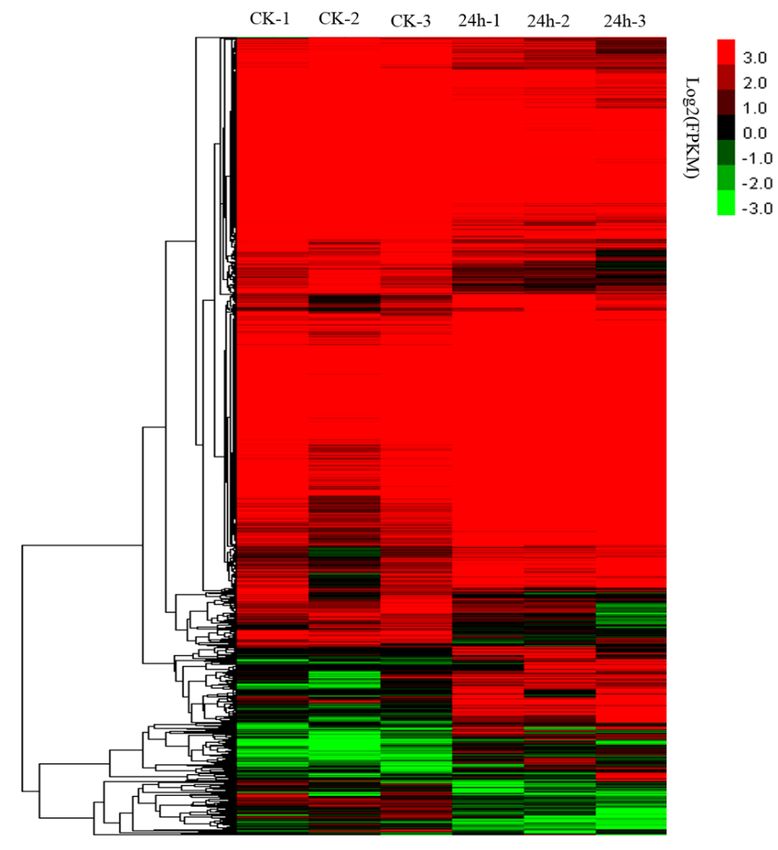
Int. J. Mol. Sci. 2019, 20, 610                                                                                      5 of 19
 Int. J. Mol. Sci. 2019, 20, x FOR PEER REVIEW                                                                        5 of 18

      Figure4.4.Top
     Figure      Top2020gene ontology
                          gene        (GO)
                               ontology     terms
                                          (GO)      enriched
                                                terms         for different
                                                       enriched             expressed
                                                                   for different        genes.genes.
                                                                                 expressed      The size
                                                                                                     Theofsize
                                                                                                           eachofcircle
                                                                                                                   each
     represents  the number    of significantly  differentially expressed    genes   enriched  in
      circle represents the number of significantly differentially expressed genes enriched in thethe corresponding
     term.  The enrichment
      corresponding     term. factor was calculated
                              The enrichment          using
                                                  factor  wasthe  number of
                                                               calculated     enriched
                                                                            using         genes divided
                                                                                    the number           by thegenes
                                                                                                   of enriched    total
     number
      divided of
               bybackground     genes of
                   the total number    in background
                                          the corresponding     pathway.
                                                         genes in           The p-valuepathway.
                                                                    the corresponding      was calculated   using was
                                                                                                     The p-value    the
     Benjamini–Hochberg      correction. A term with
      calculated using the Benjamini–Hochberg           p < 0.05 isAconsidered
                                                     correction.      term with psignificantly  overrepresented.
                                                                                   < 0.05 is considered  significantly
      overrepresented.
     In addition, 122 KEGG pathways for the DEGs were identified in watermelon leaves under
CGMMV-induced
      In addition, 122stress  (Table
                           KEGG      S3). Among
                                   pathways          them,
                                                for the      the plant
                                                          DEGs    were hormone
                                                                         identified signal   transduction
                                                                                      in watermelon     leavespathway
                                                                                                                 under
(68 DEGs)   was   the  largest  group,   followed   by   the  plant–pathogen      interaction
 CGMMV-induced stress (Table S3). Among them, the plant hormone signal transduction pathway     pathway    (56  DEGs)
and  the carbon
 (68 DEGs)       metabolic
            was the   largest pathway     (39 DEGs)
                               group, followed         (Figure
                                                  by the        5; Table S3).interaction
                                                           plant–pathogen      The top 20pathway
                                                                                              enrichment    pathways
                                                                                                       (56 DEGs)    and
(p-value  < 0.05)  were    photosynthesis     p-antenna    proteins   (ko00196),    glyoxylate
 the carbon metabolic pathway (39 DEGs) (Figure 5; Table S3). The top 20 enrichment pathways (p-  and  dicarboxylate
metabolism
 value < 0.05)(ko00630),    alpha-linolenicp-antenna
                 were photosynthesis          acid metabolism
                                                           proteins(ko00592),
                                                                      (ko00196),fatty  acid degradation
                                                                                    glyoxylate              (ko00071),
                                                                                                  and dicarboxylate
glycerolipid  metabolism      (ko00561),   photosynthesis    (ko00195),    galactose   metabolism
 metabolism (ko00630), alpha-linolenic acid metabolism (ko00592), fatty acid degradation (ko00071),  (ko00052),   fatty
acid metabolism    (ko01212),   alanine,  aspartate and   glutamate    metabolism    (ko00250),   valine,
 glycerolipid metabolism (ko00561), photosynthesis (ko00195), galactose metabolism (ko00052), fatty       leucine  and
isoleucine  degradation
 acid metabolism            (ko00280),
                     (ko01212),        cutin,
                                  alanine,     suberine,
                                            aspartate   andand  wax biosynthesis
                                                              glutamate    metabolism (ko00073),   phenylpropanoid
                                                                                          (ko00250),   valine, leucine
biosynthesis
 and isoleucine degradation (ko00280), cutin, suberine, and wax biosynthesis (ko00950),
              (ko00940),    carotenoid biosynthesis    (ko00906),   isoquinoline   alkaloid  biosynthesis    (ko00073),
tyrosine metabolismbiosynthesis
 phenylpropanoid        (ko00350), ascorbate
                                     (ko00940), and  aldarate metabolism
                                                   carotenoid     biosynthesis(ko00053),
                                                                                 (ko00906),beta-alanine   metabolism
                                                                                               isoquinoline    alkaloid
(ko00410),  circadian   rhythm–plant     (ko04712),   biosynthesis    of  unsaturated    fatty  acids
 biosynthesis (ko00950), tyrosine metabolism (ko00350), ascorbate and aldarate metabolism (ko00053),  (ko01040),   and
plant hormone    signal   transduction   (ko04075)   (Figure   5; Table  S3).
 beta-alanine metabolism (ko00410), circadian rhythm–plant (ko04712), biosynthesis of unsaturated
fatty acids (ko01040), and plant hormone signal transduction (ko04075) (Figure 5; Table S3).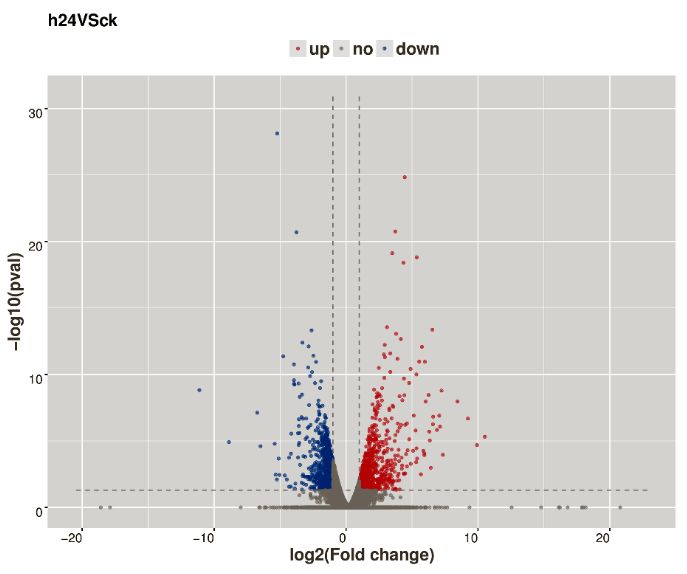
Int. J. Mol. Sci. 2019, 20, 610                                                                                       6 of 19
 Int. J. Mol. Sci. 2019, 20, x FOR PEER REVIEW                                                                         6 of 18

     Figure
      Figure5.   Statisticsofofthe
              5. Statistics      thetop
                                      top
                                        2020   pathways
                                           pathways       enriched
                                                       enriched      for differentially
                                                                 for differentially     expressed
                                                                                    expressed genes.genes.   The
                                                                                                      The size  of size
                                                                                                                   each
     of each represents
      circle  circle represents    the number
                             the number           of significantly
                                             of significantly      differentially
                                                                differentially     expressedgenes
                                                                                 expressed   genes enriched
                                                                                                     enriched in the the
     corresponding
      correspondingpathway.
                        pathway.The  Theenrichment
                                         enrichmentfactor
                                                       factorwas
                                                              wascalculated
                                                                   calculatedusing
                                                                                usingthe
                                                                                      thenumber
                                                                                          numberof ofenriched
                                                                                                      enrichedgenes
                                                                                                                 genes
     divided
      divided byby the         number of
                   the total number       of background
                                              backgroundgenes
                                                            genesininthe
                                                                       thecorresponding
                                                                            corresponding   pathway.
                                                                                         pathway.    TheThe   p-value
                                                                                                          p-value   was
     was  calculated
      calculated       using
                   using    thethe   Benjamini–Hochberg
                                 Benjamini–Hochberg          correction.A Apathway
                                                           correction.                  withpp
Int. J. Mol. Sci. 2019, 20, 610 7 of 19
Table 2. Differentially expressed genes in watermelon leaves involved in photosynthesis.
Gene
Description ck_1 ck_2 ck_3 24h_1 24h_2 24h_3 log2(fc) Regulation
Name
Cla000152 Sex-linked protein 9 (Fragment) 275.6 343.6 292.0 165.5 117.5 124.1 −1.16 down
Cla001715 PsbQ 23.4 41.5 27.0 17.7 13.2 10.5 −1.15 down
Oxygen-evolving enhancer protein 1 of
Cla001790 223.6 66.0 231.7 25.5 20.8 144.1 −1.45 down
photosystem II
Cla004698 PsbP 56.5 98.3 56.1 26.9 25.5 22.6 −1.49 down
Cla004704 PsbP 47.6 60.1 44.4 26.3 17.6 21.4 −1.22 down
Cla004703 PsbP 47.6 60.1 44.4 26.3 17.6 21.4 −1.22 down
Cla007741 Photosystem II protein Psb27 33.5 40.9 37.7 20.2 12.0 13.7 −1.29 down
Cla007940 Photosystem I reaction center subunit XI 13.9 17.2 15.0 6.4 6.5 7.3 −1.19 down
Cla008429 Photosystem I reaction center subunit N 230.9 231.3 221.6 128.3 92.9 105.8 −1.06 down
Cla008898 Ferredoxin–NADP reductase 607.9 870.4 595.8 381.3 298.7 291.4 −1.09 down
Cla019799 Photosystem II reaction center W protein 25.1 11.2 12.5 4.7 7.2 8.2 −1.27 down
Cla019798 Photosystem II reaction center W protein 25.1 11.2 12.5 4.7 7.2 8.2 −1.27 down
Cla004746 Chlorophyll a-b binding protein 6A 308.0 547.5 409.9 201.0 146.4 115.9 −1.45 down
Cla011145 Chlorophyll a-b binding protein 92.2 154.3 87.8 47.6 34.8 51.2 −1.32 down
Cla011748 Chlorophyll a-b binding protein 13 192.7 320.0 218.0 152.7 105.8 74.4 −1.13 down
Cla012368 Chlorophyll a-b binding protein 8 733.7 1294.7 799.6 545.9 441.2 373.9 −1.06 down
Cla013826 Chlorophyll a-b binding protein 208.0 246.4 260.1 90.2 85.7 95.0 −1.40 down
Cla018117 Chlorophyll a-b binding protein 6 34.1 31.5 36.9 13.9 11.8 15.4 −1.32 down
Cla019105 Chlorophyll a-b binding protein P4 903.5 1298.7 1142.1 647.1 447.7 408.2 −1.15 down
Cla019595 Chlorophyll a-b binding protein 21 4.7 20.2 6.3 4.2 1.6 2.5 −1.89 down
Cla022573 Chlorophyll a-b binding protein 4 21.1 41.4 26.2 10.8 8.9 10.0 −1.58 down
Cla022963 Chlorophyll a-b binding protein 7 1106.7 1615.0 1306.7 786.1 563.1 628.6 −1.03 down
2.6. DEGs Involved in Plant–Pathogen Interactions
Resistance to invading microorganisms is often governed by specific recognition between
plant and pathogen proteins. In the present study, 55 DEGs (20 down- and 35 upregulated)
were identified as participating in the pathway of plant–pathogen interaction (ko04626) (Table
S4). These DEGs mainly encoded a receptor-like protein kinase, serine/threonine-protein kinase,
disease resistance protein, calmodulin (CaM), CaM-like protein, and WRKY and MYB TFs. For
example, DEGs encoding two CaMs (Cla003404 and Cla021803), one disease resistance protein
(Cla020705), two WRKY TFs (Cla010918 and Cla014818), three MYB TFs (Cla005982, Cla015165, and
Cla018610), 16 receptor-like protein kinases (Cla001490, Cla005698, Cla008301, Cla008723, Cla010837,
Cla012567, Cla012568, Cla013903, Cla015191, Cla015419, Cla019852, Cla020279, Cla020764, Cla021452,
Cla022195, and Cla022527) were upregulated after CGMMV infection. However, a few DEGs
encoding receptor-like protein kinase, leucine-rich repeat-containing protein, and histone H2A were
downregulated after CGMMV infection. These DEGs might play crucial roles in the responses to the
CGMMV-induced stress.
2.7. DEGs Involved in Secondary Metabolism
Plant defense mechanisms against pathogens result in the differential regulation of various
processes of primary and secondary metabolism. In the present study, a subset of DEGs involved in
the pathways of secondary metabolism, such as phenylpropanoid biosynthesis (ko00940), carotenoid
biosynthesis (ko00906), galactose metabolism (ko00052), and ascorbate and aldarate metabolism
(ko00053), were significantly enriched (Table S5).
Pathogen infection often activates the phenylpropanoid pathway, leading to the production
of both phytoalexins and lignin/suberin precursors for cell wall strengthening [18]. In this study,
37 DEGs were associated with the pathway of phenylpropanoid biosynthesis. Among which,
26 DEGs, encoding proteins such as cinnamoyl-CoA reductase (Cla000214, Cla017205, Cla017206,
and Cla018764), cinnamyl alcohol dehydrogenase (Cla016048), caffeoyl-CoA O-methyltransferase
(Cla022971), 4-coumarate CoA ligase-like (Cla022956), peroxidase (Cla001825, Cla003187, Cla003188,
Cla003189, Cla003191, Cla003194, Cla013410, Cla014249, Cla017829, and Cla018276), were up-regulated
after CGMMV infection. In addition, 11 DEGs, encoding proteins such as phenylalanine ammonia-lyase
(Cla018297 and Cla018301), GDSL esterase/lipase (Cla018383 and Cla019629), and 4-coumarate-CoA
ligase (Cla006818), were downregulated under the CGMMV-induced stress.Int. J. Mol. Sci. 2019, 20, 610 8 of 19
Carotenoids or carotenoid catabolites can act as stress-signaling molecules [19]. In total,
13 DEGs were associated with the carotenoid biosynthetic pathway in this study, and seven,
which encoded an F-box protein (Cla005171), GDSL esterase/lipase (Cla010854), cytochrome
P450 (Cla015020, Cla016011, Cla020673, and Cla022574), and UDP glycosyltransferase (Cla016026),
showed up-regulated trends after CGMMV-induced stress. In contrast, six DEGs, encoding a
short-chain dehydrogenase/reductase (Cla001908), phytoene synthase (Cla005425), lycopene cyclase
(Cla016840), cytochrome P450 (Cla005457), GDSL esterase/lipase (Cla007748), and beta-hydroxysteroid
dehydrogenase (Cla018423), were down-regulated under CGMMV-induced stress.
Ascorbic acid accumulates as a defense response to Turnip mosaic virus in resistant Brassica rapa
cultivars [20]. In this study, 17 DEGs were involved in the ascorbate and aldarate metabolic pathway,
and six of them, encoding laccase (Cla006606 and Cla014164), aldehyde dehydrogenase (Cla015539 and
Cla019804), inositol oxygenase 1 (Cla016814), and mono dehydroascorbate reductase (Cla017711), were
up-regulated under the CGMMV-induced stress conditions. Furthermore, 11 DEGs, encoding laccase
(Cla001819, Cla008184, Cla011558, Cla015786, and Cla022385), GDSL esterase/lipase (Cla012640 and
Cla012639), ascorbate peroxidase (Cla013254), UDP-D-glucose dehydrogenase (Cla019072), inositol
oxygenase 1 (Cla011244), and inducer of CBF expression 1 (Cla002645), were down-regulated under
CGMMV-induced stress conditions.
In total, 20 DEGs associated with the galactose metabolic pathway were identified. Among them,
ten DEGs, encoding beta-galactosidase (Cla012613, Cla020797, Cla011211, and Cla011212), stachyose
synthase (Cla017113 and Cla015152), galactinol synthase (Cla009222), reductase 1 (Cla018029),
zinc finger (Cla014795), and alkaline alpha galactosidase I (Cla023372), were down-regulated.
However, the other ten DEGs, aldose 1-epimerase (Cla018918), galactinol synthase (Cla010080,
Cla010955, and Cla017336), NADP-dependent sorbitol 6-phosphate dehydrogenase (Cla015879
and Cla015878), stachyose synthase (Cla003446), beta-fructofuranosidase insoluble isoenzyme 2
(Cla015574), phosphofructokinase (Cla004847), and zinc finger (Cla018432), were up-regulated after
the CGMMV infection.
2.8. DEGs Involved in Plant Hormone Signal Transduction
During viral infections, the disruption of the plant’s normal developmental physiology has been
associated with alterations in phytohormone accumulation and signaling [21]. In this study, a few
DEGs were involved in the plant hormone signal transduction pathway (K04075), particularly the
accumulation and signaling of auxin and ABA (Table S6). For example, the expression levels of six
auxin-responsive proteins (Cla002975, Cla006021, Cla014808, Cla019806, Cla021571, and Cla022332)
increased under the CGMMV-induced stress conditions, whereas the expression of another five
auxin-responsive proteins (Cla005087, Cla012819, Cla015002, Cla017664, and Cla020817) decreased.
In addition, an auxin transporter-like protein (Cla004339) showed a decreased expression pattern. In
general, ABA is involved in the negative regulation of plant defenses against various biotrophic and
necrotrophic pathogens. In this study, ABA insensitive (Cla017696) and ABA receptor (Cla015009)
were down-regulated after CGMMV infection. MYC and MYB proteins function in an ABA-dependent
manner [22]. In the present study, genes encoding MYB (Cla012305) and MYC-like protein (Cla006058)
were downregulated, whereas a MYB-like protein gene (Cla020369) was upregulated under the
CGMMV-induced stress conditions, functioning in an ABA-dependent manner.
2.9. TFs Involved in CGMMV Stress Response
The invasion of plant viruses induces the expression of a variety of genes, which are usually
regulated by TFs [23]. In this study, we observed 85 TFs that were differentially expressed after
CGMMV infection (Figure 6; Table S7). These TFs included MYB (18 genes), NAC (15 genes), zinc
finger (14 genes), HLH (11 genes), BZIP (7 genes), WRKY (5 genes), MADS box (5 genes), WD-40
(4 genes), ERF (3 genes), GRAS (2 genes), and SBP-box (1 gene). The WRKY family members were
mainly associated with the plant–pathogen interaction pathway. The GRAS and SBP-box membersInt. J. Mol. Sci. 2019, 20, 610 9 of 19
were mainly involved in the plant hormone signal transduction pathway. The MYB family members
Int. J. Mol. Sci. 2019, 20, x FOR PEER REVIEW 9 of 18
were mainly involved in the plant hormone signal transduction, plant–pathogen interaction, oxidative
phosphorylation, and RNA transport pathways. The HLH and bZIP family members were mainly
oxidative phosphorylation, and RNA transport pathways. The HLH and bZIP family members were
involved in the plant hormone signal transduction and protein processing in the endoplasmic reticulum
mainly involved in the plant hormone signal transduction and protein processing in the endoplasmic
pathways.
reticulumThe NAC family
pathways. members
The NAC familywere involved
members were in RNA degradation
involved and glycerolipid
in RNA degradation metabolic
and glycerolipid
pathways.
metabolicThe MADS box
pathways. The family
MADS members
box familywere involved
members in involved
were the RNA intransport
the RNA and proteinand
transport export
pathways. The WD-40 genes were involved in the ubiquitin-mediated proteolysis
protein export pathways. The WD-40 genes were involved in the ubiquitin-mediated proteolysis and and ribosome
biogenesis
ribosomeinbiogenesis
eukaryotes in pathways.
eukaryotes The zinc finger
pathways. genes
The zinc weregenes
finger involved
were in the galactose
involved metabolism,
in the galactose
circadian
metabolism,rhythm, RNA rhythm,
circadian transport,
RNAandtransport,
ribosomeandpathways.
ribosome pathways.
Figure 6.6.Transcription
Figure Transcriptionfactors
factors involved in responses
involved in responsestotoCGMMV
CGMMVinfection
infection
in in watermelon
watermelon leaves.
leaves.
2.10. qRT-PCR Validation of DEGs
2.10. qRT-PCR Validation of DEGs
In In
total, 15 DEGs
total, 15 DEGs werewere
selected for qRT-PCR
selected validation
for qRT-PCR (Figure
validation 7). Cla010955
(Figure (galactinol
7). Cla010955 synthase
(galactinol
3) was gradually up-regulated during the CGMMV-infection process. Cla001822
synthase 3) was gradually up-regulated during the CGMMV-infection process. Cla001822 (MYB), (MYB), Cla016019
(bZIP), Cla016840
Cla016019 (lycopene
(bZIP), Cla016840 cyclase),
(lycopeneandcyclase),
Cla017696
and(ABA insensitive)
Cla017696 were continually
(ABA insensitive) up-regulated
were continually
at 0- (control, ck),
up-regulated 1-,(control,
at 0- and 6-h,ck),slightly down-regulated
1-, and at 18-h, and up-regulated
6-h, slightly down-regulated again at 24- and
at 18-h, and up-regulated again48-h
post-CGMMV
at 24- and 48-h infection. The expression
post-CGMMV infection.ofThe
Cla004746 (Chlorophyll
expression of Cla004746a-b (Chlorophyll
binding protein) decreased
a-b binding
at ck, 1-, and
protein) 6-h, sharply
decreased at ck, increased
1-, and 6-h,atsharply
18-h, and then decreased
increased again
at 18-h, and thenatdecreased
24- and 48-h
againpost-CGMMV
at 24- and
48-h post-CGMMV
infection. infection. Cla003187
Cla003187 (peroxidase) (peroxidase)
was continually was continually
up-regulated up-regulated
at ck, at ck,24-h
1-, 6-, 18-, and 1-, 6-,
and 18-,
then,
wasand 24-h and then, at
down-regulated was down-regulated
48-h post-CGMMVatinfection.
48-h post-CGMMV infection.
The expression The expression
patterns of Cla013731 patterns
(NAC)ofand
Cla013731 (NAC) and Cla017392 (sucrose synthase) were similar, remaining relatively stably
expressed at ck, 1-, and 6-h. They were then slightly down-regulated at 18-h and up-regulated at 24-Int. J. Mol. Sci. 2019, 20, 610 10 of 19
Cla017392 (sucrose synthase) were similar, remaining relatively stably expressed at ck, 1-, and 6-h.10They
Int. J. Mol. Sci. 2019, 20, x FOR PEER REVIEW of 18
were then slightly down-regulated at 18-h and up-regulated at 24- and 48-h post-CGMMV infection.
Cla008706 (XTH9) remained
and 48-h post-CGMMV at a Cla008706
infection. relatively stable
(XTH9) expression
remained level at ck, 1-, stable
at a relatively and 6-h, was sharply
expression level
up-regulated at 18-h and then down-regulated at 24- and 48-h post-CGMMV
at ck, 1-, and 6-h, was sharply up-regulated at 18-h and then down-regulated at 24- and 48-h post- infection. Cla009996
(HSP)
CGMMV remained
infection.relatively
Cla009996stably expressed
(HSP) remainedat ck, 1-, and 6-h
relatively post-CGMMV
stably expressed atinfection.
ck, 1-, andIt was then
6-h post-
sharply
CGMMVupregulated
infection. It at was18-h,
thendownregulated at 24-h,
sharply upregulated at and
18-h,upregulated
downregulatedagainat at 48-h
24-h, andpost-CGMMV
upregulated
infection. Cla009996 (disease resistance-responsive protein) was upregulated
again at 48-h post-CGMMV infection. Cla009996 (disease resistance-responsive protein) was at 1-h, downregulated at
6- and 18-h, sharply
upregulated at 1-h, upregulated
downregulated at 24-h and
at 6- downregulated
and 18-h, sharplyatupregulated
48-h post-CGMMV infection.
at 24-h and Cla011558
downregulated
(laccase 22) remained at
at 48-h post-CGMMV a stable expression
infection. level at ck,
Cla011558 (laccase 22)1-, and 6-h,atdecreased
remained at 18- and 24-h,
a stable expression level and
at ck,was
1-,
then upregulated at 48-h post-CGMMV infection. The expression of Cla012824
and 6-h, decreased at 18- and 24-h, and was then upregulated at 48-h post-CGMMV infection. The (cellulose synthase)
was stable atofck,
expression 1- and 6-h,
Cla012824 increased
(cellulose at 18-h, was
synthase) and then
stabledecreased to a 6-h,
at ck, 1- and relatively stable
increased atlevel
18-h,atand
24-then
and
48-h post-CGMMV infection. Cla016011 (cytochrome P450) was downregulated
decreased to a relatively stable level at 24- and 48-h post-CGMMV infection. Cla016011 (cytochrome at 1-h, upregulated
at 6-h,was
P450) thendownregulated
downregulatedatat1-h, 18-h, and upregulated
upregulated at 24-downregulated
at 6-h, then and 48-h post-CGMMV
at 18-h, and infection. The
upregulated
qRT-PCR
at 24- anddata 48-hwere generally consistent
post-CGMMV withqRT-PCR
infection. The the high-throughput transcriptome
data were generally results,
consistent withindicating
the high-
that the transcriptome sequencing data were reliable.
throughput transcriptome results, indicating that the transcriptome sequencing data were reliable.
Figure 7.7.qRT-PCR
Figure qRT-PCR analysis
analysis of expression
of the the expression of CGMMV
of CGMMV response-related
response-related genes. Thegenes.
y-axisThe y-axis
represents
the log2 values (CGMMV/ck). Analyses were completed in triplicate, and the error bars representbars
represents the log2 values (CGMMV/ck). Analyses were completed in triplicate, and the error the
representerrors.
standard the standard errors.Int. J. Mol. Sci. 2019, 20, 610 11 of 19
3. Discussion
First described in 1935 as infecting cucumber, CGMMV was one of the first plant viruses to be
studied [4]. In CGMMV-infected watermelon, mottling and mosaicism develop on the leaves, brown
necrotic lesions develop on the stems, and sponginess, rotting, and discolorations develop on the flesh.
In addition to causing marketable yield losses owing to poor fruit quality, CGMMV also causes gross
yield losses of > 50% in watermelon [24]. High-throughput sequencing technologies, such as RNA-Seq,
are widely used to investigate the transcriptional profiles of different plants under virus-induced
stress conditions [25,26]. RNA-Seq has also been utilized to identify the transcriptomic changes
that occur during CGMMV-induced stress in bottle gourd leaves and fruit [27] and in watermelon
fruit [13]. However, at present, there are no reports regarding the transcriptome early responses of
watermelon leaves to CGMMV infection. Here, we performed transcriptome sequencing to assess the
differences in gene expressions in the leaves of watermelon experiencing 24 h CGMMV-induced stress.
The transcriptome data presented in this study provide insights into the early responses of watermelon
leaves to CGMMV-induced stress and help us mine candidate genes or pathways to further illuminate
the molecular mechanisms of watermelon responses to CGMMV-induced stress.
3.1. DEGs in Watermelon Leaves and Fruit
Under CGMMV-induced stress conditions, 1641 DEGs were identified in watermelon leaves,
with 886 DEGs (53.99%) being upregulated and 755 DEGs (46.01%) being downregulated (Figure 3
and Table S1). These DEGs were mainly involved in photosynthesis, plant–pathogen interactions,
secondary metabolism (phenylpropanoid biosynthesis, carotenoid biosynthesis, ascorbate and aldarate
metabolism, and galactose metabolism), and plant hormone signal transduction pathways (Table S3).
In a previous study, transcriptome profiles of CGMMV-infected and mock-inoculated watermelon
fruit revealed 1621 DEGs, with 1052 up-regulated and 569 downregulated [13]. The DEG numbers
in watermelon fruit was similar to the numbers in watermelon leaves. Consistent with our results,
most of the DEGs in watermelon fruit were involved in metabolic processes, signal transduction, and
plant–pathogen interactions [13]. Thus, common pathways were induced in the watermelon fruit and
leaves by CGMMV infections.
3.2. Changes in Photosynthesis After CGMMV Infection
Changes in photosynthetic pathways after pathogen infection have been reported earlier [16,17].
Switching on the defense mechanisms and respiratory processes is a cost-intensive process, which
might occur at the expense of photosynthesis [16,17]. In this study, 22 DEGs involved in the
photosynthetic pathway were completely downregulated after CGMMV infection (Table 2). These
DEGs encoded PsbO, PsbP, PsbQ, Psb27, PsbW, PSI reaction center subunits, and chlorophyll a- and
b-binding proteins. The PSII of oxygenic organisms is a multi-subunit pigment–protein complex that
catalyzes the photo-oxidation of water with a concomitant reduction of the catalysis of plastoquinone
to plastoquinol [28]. PsbO, PsbP, and PsbQ proteins may perform alternative functions within PSII, and
all three of the extrinsic proteins were required for the accumulation of PSII reaction centers in higher
plants [29]. The PsbO component may exhibit carbonic anhydrase [30] and/or GTPase activity [31], the
PsbP protein may be involved in binding the manganese required for photoactivation [32] and, along
with PsbQ, participate in granal stack formation [33]. PsbW, a 6.1-kDa low-molecular-weight protein,
is located close to the minor antenna of the PSII complex and is important for the contact and stability
between several PSII–light harvesting complex II supercomplexes [34]. Psb27 plays a fundamental
role in enabling plants to adapt to changes in light intensity independently of the formation of PSII
supercomplexes and state transitions [35]. Chlorophyll a- and b-binding proteins are involved in the
light harvesting complex and serve as conduits of excitation energy to the reaction center of PSII [36].
These reduced photosynthetic gene activity levels might be associated with chlorosis or decreased
green-tissue surface areas after the systemic spread of a virus.Int. J. Mol. Sci. 2019, 20, 610 12 of 19
3.3. Changes in Plant–Pathogen Interactions After CGMMV Infection
Plants have evolved innate immune systems that recognize the presence of pathogens and initiate
effective defense responses, whereas pathogens have evolved effector proteins that can suppress host
immune responses. These form the so-called plant–pathogen interactions [37]. In the present study,
55 DEGs encoding receptor-like protein kinase, CaM-like protein, CaM, serine/threonine-protein
kinase, and WRKY and MYB TFs were involved in the plant–pathogen interaction pathway (Table S4).
In response to several biotic and abiotic stresses, CaM plays an important role in sensing and
transducing changes in cellular Ca2+ concentrations [38]. Several studies implicate CaMs in plant
defense [39,40]. Transgenic tobacco (Nicotiana benthamiana) plants over-expressing SCaM4 and SCaM5
showed spontaneous lesions, increased PR genes expression and enhanced resistance to pathogens.
The expression of tobacco NtCaM13, which is closely related to SCaM4 and SCaM5, was elevated at the
RNA and protein levels in TMV-infected leaves [40]. In this study, two genes encoding CaMs were
upregulated after the CGMMV infection, indicating these two CaMs were induced by the presence
of CGMMV.
Receptor-like kinases/proteins (RLKs/RLPs) are on the front lines of the battle between plants
and pathogens, because they are present at the plasma membrane and perceive signature molecules
from either the invading pathogen or damaged plant tissue. These RLKs and RLPs perceive PAMPs
from pathogens and initiate PAMP-triggered immunity, the first layer of plant innate immunity [41].
NbLRK1, a lectin RLK found in N. benthamiana, was identified as an interactor of the protein INF1,
an elicitin from Phytophthora infestans [42]. Another RLK, was discovered in Nicotiana glutinosa and
interacts directly with the fungal elicitin capsicein from Phytophthora capsici [43]. In this study, 26 RLKs
were identified, with 16 upregulated and 10 downregulated after CGMMV infection. These RLKs
might play crucial roles in watermelon’s innate immunity.
3.4. The Main TF Families Responding to CGMMV-Induced Stress
Briefly, TFs are composed of a DNA-binding domain that interacts with the cis-regulatory
elements of its target genes and a protein–protein interaction domain that facilitates oligomerization
between TFs and other regulators [44]. CGMMV-induced stress triggers extensive alterations in plant
transcriptomes [13,27]. In a previous report, TFs, including those of the WRKY, MYB, bHLH, DREB,
and ERF families, were significantly affected in watermelon fruit [13]. In our study, 85 differentially
expressed TFs were identified in watermelon leaves after CGMMV infection (Figure 6; Table S7). The
TF families identified in this study included MYB (18), NAC (15), zinc finger (14), HLH (11), BZIP (7),
WRKY (5), MADS box (5), WD-40 (4), ERF (3), GRAS (2), and SBP-box (1). These TF families play vital
roles in the transcriptional regulation of plants.
The plant-specific WRKY TFs form one of the largest TF families, and they are a class of
DNA-binding proteins primarily found in plants. The WRKY domain contains approximately 60
amino acids, comprising a highly conserved short peptide, WRKYGQK, at the N-terminus and a C2H2
or C2HC zinc-binding motif at the C-terminus [45]. WRKYs play important roles in plant–pathogen
interactions. WRKY27, a WRKY protein from pepper, positively regulates the stress-resistance response
to a Ralstonia solanacearum infection by modulating SA-, JA- and ET-mediated signaling pathways in
tobacco [46]. In tomato, six WRKY Group III TFs were identified, and these TFs respond to TYLCV
infection [47]. In this study, we observed that two WRKY TFs (Cla017213 and Cla018197) were
down-regulated and three WRKY TFs (Cla014433, Cla014818, and Cla010918) were up-regulated in
the leaf tissues of watermelon after CGMMV infection (Figure 6; Table S7). Thus, WRKY TFs are also
involved in CGMMV-induced stress responses.
NAC TFs belong to plant-specific TF family, and they have been identified in many plant species.
The NAC protein contains a highly conserved DNA-binding domain at the N-terminus and diverse
transcription activation or repression domains at the C-terminus [48,49]. In plants, the NAC TFs act
as nodes of a regulatory network that responds to biotic stresses [50,51]. NAC TFs also take part
in plant–pathogen interactions. Two wheat NAC TFs (TaNAC4 and TaNAC8) act as transcriptionalInt. J. Mol. Sci. 2019, 20, 610 13 of 19
activators in defense responses against strip rust pathogen infection [52,53]. The Arabidopsis NAC083
protein interacts with the Rep protein of Mungbean yellow mosaic India virus and plays important roles
in viral DNA replication [51]. In tomato, six NAC TFs involved in the response to TYLCV infection
were identified in resistant and susceptible cultivars [54]. In our study, 15 NAC TFs were affected by
CGMMV infection in watermelon leaves (Figure 6; Table S7). Among them, 13 and 2 NAC TFs were
up- and downregulated, respectively. The upregulated NAC TFs in leaf tissues might be involved in
the adaptation to CGMMV-induced stress.
The MYB TFs are characterized by a DNA-binding MYB domain. The MYB domain is composed
of approximately 52 amino acid residues that adopt a helix–turn–helix conformation that intercalates
into the major groove of DNA [55,56]. After the first plant MYB gene, COLORED1, which is involved in
anthocyanin biosynthesis, was identified in maize [57], a large number of MYB proteins were identified
in different plant species. For example, in Arabidopsis, BOTRYTIS-SUSCEPTIBLE1, an R2R3-MYB gene
(AtMYB108), is required for restricting the spread of two necrotrophic pathogens, Botrytis cinerea and
Alternaria brassicicola, and is involved in the tolerance to osmotic and oxidative stresses [58]. In barley,
the MYB TF MYB6 functions as positive regulator of basal and MLA-mediated immunity responses to
Blumeria graminis [59]. In this study, we observed that 3 MYB TFs were down-regulated and 15 MYB
TFs were up-regulated in the leaf tissues of watermelon after CGMMV infection (Figure 6; Table S7).
In addition, we compared these MYB TFs in watermelon leaves with those in watermelon fruit. A
MYB gene, Cla017179, was commonly up-regulated in both leaves and fruit after CGMMV infection,
indicating the important role of Cla017179 in responses to CGMMV infection.
The bZIP TFs are vital players in plant innate immunity owing to their ability to regulate genes
associated with PAMP-triggered immunity, effector-triggered immunity, and hormonal signaling
networks [60,61]. One bZIP member, G/HBF-1 from Glycine max, binds to G-box and H-box motifs that
have strong links to pathogen elicitors. These motifs have also been reported in the promoter of the
chs15 gene, which is involved in flavonoid production in response to pathogen infection [62]. In this
study, we observed that three bZIP TFs were down-regulated and four bZIP TFs were up-regulated in
the leaf tissues of watermelon after CGMMV infection (Figure 6; Table S7). These bZIPs in watermelon
act as positive or negative regulators and mediate the responses to CGMMV infection.
4. Materials and Methods
4.1. Plant Materials and the CGMMV Treatment
The seeds of the watermelon advanced inbred line ‘JJZ-M’, which is susceptive to CGMMV, were
planted in a greenhouse and maintained at 25 ◦ C. Seedlings at the two-true leaf stage were inoculated
with the CGMMV virus. Mock plants were inoculated with sodium phosphate buffer (pH 7.2).
Leaves were harvested at 24-h post-inoculation (24 hpi). The presence of CGMMV was confirmed by
RT-PCR using CGMMV coat protein specific primers (F: 50 -ATGGCTTACAATCCGATCACAC-30 ; R:
50 -CTAAGCTTTCGAGGTGGTAGCC-30 ). Leaves from three plants were mixed to form a biological
replicate, and three biological replicates for each treatment were used for the high-throughput RNA-Seq
and analysis.
4.2. mRNA Library Construction and Sequencing
Total RNA was extracted using TRIzol reagent (Invitrogen, Carlsbad, CA, USA) following the
manufacturer’s procedure. RNA quantity and purity were analyzed using a Bioanalyzer 2100 and RNA
6000 Nano Lab Chip Kit (Agilent, Santa Clara, CA, USA) with RIN number >7.0. Approximately 10 µg
total RNA, representing a specific adipose type, was subjected to Poly(A) mRNA isolation using poly-T
oligo-attached magnetic beads (Invitrogen, Carlsbad, CA, USA). Following purification, the mRNA
was fragmented into small pieces using divalent cations under an elevated temperature. Then, the
cleaved RNA fragments were reverse-transcribed to create the final cDNA library in accordance with
the protocol for the mRNA-Seq sample preparation kit (Illumina, San Diego, CA, USA). The averageInt. J. Mol. Sci. 2019, 20, 610 14 of 19
insert size for the paired-end libraries was 300 bp (± 50 bp). Then, we performed the paired-end
sequencing on an Illumina HiSeq 4000 at LC Sciences (Houston, TX, USA) following the vendor’s
recommended protocol. Prior to assembly, the low-quality reads ((1) reads containing sequencing
adaptors; (2) reads containing sequencing primers; and (3) nucleotides with q quality scores lower
than 20) were removed. The raw sequence data was submitted to the NCBI Short Read Archive.
4.3. RNA-Seq Read Mapping
We aligned reads to the watermelon genome [63] using hierarchical indexing for spliced alignment
of transcripts (HISAT) [64], which initially removed a portion of the reads based on the quality
information accompanying each read and then mapped the reads to the reference genome. HISAT
allowed multiple alignments per read (up to 20 by default) and a maximum of two mismatches when
mapping the reads to the watermelon genome.
4.4. Transcript Abundance Estimation and Differential Expression Analysis
The mapped reads of each sample were assembled using StringTie [65]. Then, the transcriptomes
from all the samples were merged to reconstruct a comprehensive transcriptome using perl scripts.
After the final transcriptome was generated, StringTie and Ballgown [66] were used to estimate the
expression levels of the transcripts. StringTie was used to determine expression levels for mRNAs by
calculating fragments per kilobase of exon per million reads [67].
A differential expression analysis between the treatments (three biological replicates per treatment)
was performed using the DESeq R package. DESeq provides statistical methods for determining
differential expression in digital gene expression data using a model based on the negative binomial
distribution. The differentially expressed mRNAs and genes were determined with log2 (fold
change) > 1 or log2 (fold change) ≤ 1 and with statistical significance (p-value < 0.05) using the
Ballgown R package.
4.5. GO and KEGG Enrichment Analyses of DEGs
The GO enrichment analysis of DEGs was performed using the GOseq R package in which gene
length bias was corrected. GO terms with corrected p values < 0.05 were considered significantly
enriched by DEGs. The KEGG database aids in understanding high-level functions and utilities of
biological systems, such as the cell, organism and ecosystem, using molecular-level information,
particularly large-scale datasets generated by genome sequencing and other high-throughput
experimental technologies. We used KOBAS software to test the statistical enrichment of DEGs
in KEGG pathways.
4.6. Validation of RNA-Seq Gene Expression Using qRT-PCR
To validate the gene expression levels revealed by the transcriptome data, leaves of watermelon
plants were collected at 0-, 1-, 6-, 12-, 24- and 48-h post-CGMMV inoculation and used for RNA
extraction. Total RNA (~2 µg) was reverse transcribed into cDNA using the TransScript One-Step
gDNA Removal and cDNA Synthesis SuperMix (TransGen Biotech, Beijing, China). cDNA was then
used as the template for qRT-PCR, which was completed in a 20-µL sample containing 10 µL 2×
TransStart Top Green qPCR SuperMix (TransGen Biotech, Beijing, China), 2.0 µL diluted cDNA, 0.4 µL
50× Passive Reference Dye I, and 0.4 µL each primer (10 mM). qRT-PCR was conducted using StepOne
Real-Time PCR System (ABI, Foster City, CA, USA) with the following program: 95 ◦ C for 30 s,
40 cycles of 95 ◦ C for 5 s, 55 ◦ C for 15 s, and 72 ◦ C for 10 s. Each experiment was run in triplicate. The
relative expression levels were calculated based on the expression of the housekeeping Tubulin gene.
The fold changes in gene expression were estimated in terms of threshold cycles using the 2−∆∆CT
method [68]. The primers designed for use in the qRT-PCR analysis are listed in Table S8.Int. J. Mol. Sci. 2019, 20, 610 15 of 19
5. Conclusions
In this study, we comparatively analyzed the gene expression profiles of 24 hpi and ck watermelon
leaves. The CGMMV infection affected the gene expression levels of 1641 DEGs, with 886 upregulated
and 755 downregulated. A functional analysis of DEGs based on a GO annotation and KEGG pathway
analysis showed that these DEGs were mainly involved in photosynthesis, plant–pathogen interactions,
secondary metabolism, and plant hormone signal transduction. The CGMMV infection also affected
the expression levels of several TF families, including WRKY, NAC, MYB, bZIP, and zinc finger. Our
genome-wide transcriptome analysis provides a basis for the further investigation of the molecular
mechanisms underlying CGMMV infection in watermelon.
Supplementary Materials: Supplementary materials can be found at http://www.mdpi.com/1422-0067/20/
3/610/s1. Table S1. Genes differentially expressed between mock- and CGMMV-infected watermelon leaf
libraries. Table S2. GO term enrichment for differentially expressed genes. Table S3. KEGG pathway enrichment
for differentially expressed genes. Table S4. Differentially expressed genes involved in the plant–pathogen
interaction pathway. Table S5. Differentially expressed genes involved in the secondary biosynthetic pathway.
Table S6. Differentially expressed genes involved in the plant hormone and signal transduction pathway. Table S7.
Transcription factors involved in responses to CGMMV infection in watermelon leaves. Table S8. Primers used for
qRT-PCR validation.
Availability of Sequencing Data: Sequencing data from this article were deposited at the sequence read archive
(SRA) of the National Center for Biotechnology Information (NCBI) under the accession number of PRJNA514378.
Author Contributions: Y.S. and M.F. conceived and designed the experiments; Y.S. carried out the bioinformatics
analysis and wrote the manuscript; M.F. and Y.H. gave insightful suggestions.
Acknowledgments: This work was funded by the Key Laboratory of Biology and Genetic Improvement of
Horticultural Crops, Ministry of Agriculture, P. R. China (IVF201801), the Zhejiang Provincial Natural Science
Foundation of China (LQ18C150002), the National Natural Science Foundation of China (31572145), and the
Zhejiang Major Science and Technology Project for New Vegetable Variety Breeding (2016C02051-4-2). We thank
Lesley Benyon, from Liwen Bianji, Edanz Group China (www.liwenbianji.cn/ac), for editing the English text of a
draft of this manuscript.
Conflicts of Interest: The authors declare no conflict of interest.
Compliance with Ethical Standards: This article does not contain any studies with human participants or animals
performed by any of the authors.
References
1. Tian, T.; Posis, K.; Maroon-Lango, C.J.; Mavrodieva, V.; Haymes, S.; Pitman, T.L.; Falk, W. First report of
cucumber green mottle mosaic virus on melon in the United States. Plant Dis. 2014, 98, 1163. [CrossRef]
2. Liu, H.W.; Luo, L.X.; Li, J.Q.; Liu, P.F.; Chen, X.Y.; Hao, J.J. Pollen and seed transmission of Cucumber green
mottle mosaic virus in cucumber. Plant Pathol. 2014, 63, 72–77. [CrossRef]
3. Mink, G.I. Pollen- and seed-transmitted viruses and viroids. Ann. Rev. Phytopathol. 1993, 31, 375–402.
[CrossRef] [PubMed]
4. Ainsworth, G.C. Mosaic disease of the cucumber. Ann. Appl. Biol. 1935, 22, 55–67. [CrossRef]
5. Pop, I.; Jilaveanu, A. Identification of cucumber green mottle virus in Romania. Analele Institutului de Cercetari
Pentru Protectia Plantelor 1985, 18, 43–47.
6. Varveri, C.; Vassilakos, N.; Bem, F. Characterization and detection of Cucumber green mottle mosaic virus in
Greece. Phytoparasitica 2002, 30, 493–501. [CrossRef]
7. Li, R.; Zheng, Y.; Fei, Z.; Ling, K.S. First complete genome sequence of an emerging cucumber green mottle
mosaic virus isolate in North America. Genome Announc. 2015, 3, e00452-15. [CrossRef]
8. Tesoriero, L.A.; Chambers, G.; Srivastava, M.; Smith, S.; Conde, B.; Tran-Nguyen, L.T.T. First report of
cucumber green mottle mosaic virus in Australia. Australas. Plant Dis. Notes 2016, 11, 1. [CrossRef]
9. Dombrovsky, A.; Tran-Nguyen, L.T.T.; Jones, R.A.C. Cucumber green mottle mosaic virus: Rapidly increasing
global distribution, etiology, epidemiology and management. Ann. Rev. Phytopathol. 2017, 55, 231–256.
[CrossRef]Int. J. Mol. Sci. 2019, 20, 610 16 of 19
10. Liu, H.W.; Luo, L.X.; Liang, C.Q.; Jiang, N.; Liu, P.F.; Li, J.Q. High-throughput sequencing identifies novel
and conserved cucumber (Cucumis sativus L.) microRNAs in response to Cucumber green mottle mosaic virus
infection. PLoS ONE 2015, 10, e0129002. [CrossRef]
11. Li, Y.; Deng, C.; Shang, Q.; Zhao, X.; Liu, X.; Zhou, Q. Characterization of siRNAs derived from cucumber
green mottle mosaic virus in infected cucumber plants. Arch. Virol. 2016, 161, 455–458. [CrossRef] [PubMed]
12. Li, J.; Zheng, H.; Zhang, C.; Han, K.; Wang, S.; Peng, J.; Lu, Y.; Zhao, J.; Xu, P.; Wu, X.; et al. Different
virus-derived siRNAs profiles between leaves and fruits in Cucumber green mottle mosaic virus-infected
Lagenaria siceraria plants. Front. Microbiol. 2016, 7, 1797. [CrossRef] [PubMed]
13. Li, X.; An, M.; Xia, Z.; Bai, X.; Wu, Y. Transcriptome analysis of watermelon (Citrullus lanatus) fruits in
response to Cucumber green mottle mosaic virus (CGMMV) infection. Sci. Rep. 2017, 7, 16747. [CrossRef]
[PubMed]
14. Sun, Y.; Niu, X.; Fan, M. Genome-wide identification of cucumber green mottle mosaic virus-responsive
microRNAs in watermelon. Arch. Virol. 2017, 162, 2591–2602. [CrossRef] [PubMed]
15. Sun, Y.; Niu, X.; Cui, D.; Fan, M. High-throughput sequencing reveals vsiRNAs derived from Cucumber
green mottle mosaic virus-infected watermelon. Hortic. Plant J. 2017, 3, 17–22. [CrossRef]
16. Rahoutei, J.; García-Luque, I.; Barón, M. Inhibition of photosynthesis by viral infection: Effect on PSII
structure and function. Physiol. Plant 2000, 110, 286–292. [CrossRef]
17. Scharte, J.; Schon, H.; Weis, E. Photosynthesis and carbohydrate metabolism in tobacco leaves during an
incompatible interaction with Phytophthora nicotianae. Plant Cell Environ. 2005, 28, 1421–1435. [CrossRef]
18. Parker, D.; Beckmann, M.; Zubair, H.; Enot, D.P.; Caracuel-Rios, Z.; Overy, D.P.; Snowdon, S.; Talbot, N.J.;
Draper, J. Metabolomic analysis reveals a common pattern of metabolic re-programming during invasion of
three host plant species by Magnaporthe grisea. Plant J. 2009, 59, 723–737. [CrossRef]
19. Fanciullino, A.L.; Bidel, L.P.R.; Urban, L. Carotenoid responses to environmental stimuli: Integrating redox
and carbon controls into a fruit model. Plant Cell Environ. 2014, 37, 273–289. [CrossRef]
20. Fujiwara, A.; Togawa, S.; Hikawa, T.; Matsuura, H.; Masuta, C.; Inukai, T. Ascorbic acid accumulates as a
defense response to Turnip mosaic virus in resistant Brassica rapa cultivars. J. Exp. Bot. 2016, 67, 4391–4402.
[CrossRef]
21. Collum, T.D.; Culver, J.N. The impact of phytohormones on virus infection and disease. Curr. Opin. Virol.
2016, 17, 25–31. [CrossRef] [PubMed]
22. Abe, H.; Urao, T.; Ito, T.; Seki, M.; Shinozaki, K.; Yamaguchi-Shinozaki, K. Arabidopsis AtMYC2 (bHLH) and
AtMYB2 (MYB) function as transcriptional activators in abscisic acid signaling. Plant Cell 2003, 15, 63–78.
[CrossRef] [PubMed]
23. Nakashima, K.; Ito, Y.; Yamaguchi-Shinozaki, K. Transcriptional regulatory networks in response to abiotic
stresses in Arabidopsis and grasses. Plant Physiol. 2009, 149, 88–95. [CrossRef] [PubMed]
24. Reingold, V.; Lachman, O.; Koren, A.; Dombrovsky, A. First report of Cucumber green mottle mosaic
virus (CGMMV) symptoms in watermelon used for the discrimination of non-marketable fruits in Israeli
commercial fields. Plant Pathol. 2013, 28, 11.
25. Fan, H.; Zhang, Y.; Sun, H.; Liu, J.; Wang, Y.; Wang, X.; Li, D.; Yu, J.; Han, C. Transcriptome analysis of beta
macrocarpa and identification of differentially expressed transcripts in response to Beet necrotic yellow vein
virus infection. PLoS ONE 2015, 10, e0132277. [CrossRef] [PubMed]
26. Martin, K.; Singh, J.; Hill, J.H.; Whitham, S.A.; Cannon, S.B. Dynamic transcriptome profiling of Bean Common
Mosaic Virus (BCMV) infection in Common Bean (Phaseolus vulgaris L.). BMC Genom. 2016, 17, 613. [CrossRef]
[PubMed]
27. Zhang, C.; Zheng, H.; Wu, X.; Xu, H.; Han, K.; Peng, J.; Lu, Y.; Lin, L.; Xu, P.; Wu, X.; et al. Genome-wide
identification of new reference genes for RT-qPCR normalization in CGMMV-infected Lagenaria siceraria.
Peer J. 2018, 6, e5642. [CrossRef] [PubMed]
28. Nelson, N.; Yocum, C.F. Structure and function of Photosystems I and II. Ann. Rev. Plant Biol. 2006, 57,
521–565. [CrossRef]
29. Bricker, T.M.; Frankel, L.K. Auxiliary functions of the PsbO, PsbP and PsbQ proteins of higher plant
photosystem II: A critical analysis. J. Photochem. Photobiol. B Biol. 2011, 104, 165–178. [CrossRef]You can also read