Evolution of the IRF Family in Salmonids - MDPI
←
→
Page content transcription
If your browser does not render page correctly, please read the page content below
G C A T
T A C G
G C A T
               genes
Article
Evolution of the IRF Family in Salmonids
Thomas C. Clark, Pierre Boudinot * and Bertrand Collet

                                          VIM, UVSQ, INRAE, Université Paris-Saclay, 78350 Jouy-En-Josas, France;
                                          thomas-campbell.clark@inrae.fr (T.C.C.); Bertrand.Collet@inrae.fr (B.C.)
                                          * Correspondence: Pierre.Boudinot@inrae.fr; Tel.: +33-1-34652585

                                          Abstract: Interferon regulatory factors (IRFs) as a family, are major regulators of the innate antiviral
                                          response in vertebrates principally involved in regulating the expression of interferons (IFNs) and
                                          interferon-stimulated genes (ISGs). To date, nine IRFs have been identified in mammals with a 10th
                                          member also found in several avian and fish species. Through genome mining and phylogenetic
                                          analysis, we identified and characterised 23 irf genes in 6 salmonid species. This larger repertoire of
                                          IRF in salmonids results from two additional whole-genome duplications which occurred in early
                                          teleosts and salmonids, respectively. Synteny analysis was then used to identify and confirm which
                                          paralogues belonged to each subgroup and a new nomenclature was assigned to the salmonid IRFs.
                                          Furthermore, we present a full set of Real-Time PCR primers for all rainbow trout IRFs, confirmed by
                                          sequencing to ensure paralogue specificity. RT PCR was then used to examine the response of all trout
                                          irf genes in vivo, following Vibrio anguillarum and poly I:C stimulation, indicating potential functional
                                          divergence between paralogues. Overall, this study presents a comprehensive overview of the IRF
                                          family in salmonids and highlights some novel roles for the salmonid-specific IRFs in immunity.

                                Keywords: teleost fish; type I interferon; paralogues; WGD; poly I:C; Vibrio; bacterin


Citation: Clark, T.C.; Boudinot, P.;
Collet, B. Evolution of the IRF Family
in Salmonids. Genes 2021, 12, 238.        1. Introduction
https://doi.org/10.3390/                        Interferon regulatory factors (IRFs) are an ancient family of transcription factors present
genes12020238                             in all main contemporary groups of metazoans from sponges to mammals, with common
                                          ancestors dating back to 600 million years ago [1]. All IRF members are structurally simi-
Academic Editors: Daniel Macqueen,
                                          lar, with each possessing a highly conserved N-terminal DNA binding domain (DBD) of
Manu Kumar Gundappa and
                                          around 115 amino acids characterised by 5 tryptophan rich repeats [2]. The DBD forms
Diego Robledo
                                          a helix-turn-helix structure allowing IRF proteins to recognise and bind to a DNA motif
Received: 18 January 2021
                                          known as interferon (IFN)-stimulated response element (ISRE) [3]. The C-terminal region
Accepted: 4 February 2021
                                          of these proteins is more variable, but in general, contains a nuclear export sequence, an
Published: 8 February 2021
                                          autoinhibitory region and an IRF association domain (IAD) responsible for interacting with
                                          other IRFs and other transcription factors [2]. Two types of IAD have been identified, with
Publisher’s Note: MDPI stays neutral
with regard to jurisdictional claims in
                                          IAD1 being present in all IRFs apart from IRF1 and IRF2 which instead contain the IAD2 [4].
published maps and institutional affil-
                                          IRF family members can both homo- or hetero-dimerise forming either transcriptionally
iations.
                                          active or repressive complexes [5]. Protein interactions within the IAD and other tran-
                                          scription factors likely determine whether the resulting complex acts as a transcriptional
                                          repressor or activator. The IRF family members can be grouped functionally by whether
                                          they are an activator (IRF1, IRF3, IRF5, IRF9 and IRF10), a repressor (IRF8), or whether
                                          they are multifunctional and can both repress and activate gene transcription (IRF2, IRF4
Copyright: © 2021 by the authors.
                                          and IRF7) [6]. However, generally within the family, IRF1, IRF3, IRF5 and IRF7 function as
Licensee MDPI, Basel, Switzerland.
                                          positive mediators of the hosts IFN response whereas IRF2 and IRF4 act as repressors [4,7].
This article is an open access article
distributed under the terms and
                                                The IRF family members are major regulators of the innate antiviral response in
conditions of the Creative Commons
                                          vertebrates principally involved in transcriptional induction of interferons (IFNs) and
Attribution (CC BY) license (https://     interferon-stimulated genes (ISGs) [8]. Additionally, IRFs are known to be involved in
creativecommons.org/licenses/by/          metabolism control [9] and have extensive roles within immune cell development and
4.0/).                                    maturation, reviewed in [10–12]. Viral infections are detected by animal cells through the

Genes 2021, 12, 238. https://doi.org/10.3390/genes12020238                                                    https://www.mdpi.com/journal/genes
Genes 2021, 12, 238                                                                                           2 of 17

                      recognition of virus-associated molecular patterns (PAMPs) via double stranded RNA by
                      pattern recognition receptors (PRRs) such as members of the toll-like receptors (TLRs) fam-
                      ily and retinoic acid-inducible gene I (RIG-I)-like receptors (RLRs) [13,14]. In vertebrates,
                      these receptors activate convergent signalling pathways involving in particular IRF1, IRF3
                      and IRF7, and leading to the induction of specialized cytokines, the type I IFNs. Type I
                      IFNs are secreted and have autocrine and paracrine actions after binding to their cognate
                      IFN membrane-bound receptors. In mammals, type I IFN signalling depends on this
                      interaction with the heterodimeric receptor complex comprised of IFNAR1 and IFNAR2
                      belonging to the class II cytokine receptor family [15,16]. These receptors are known as the
                      cytokine receptor family B (CRFB) in fish, with CRFB1, 2 and CRFB5 being homologous
                      to mammalian IFNAR2 and IFNAR1 [17]. Activation of type I IFN receptors induces a
                      signalling cascade initiated by the phosphorylation of JAK1 and TYK2 kinases (reviewed
                      in [18,19]), and leading to the association of IRF9 with the STAT1 and STAT2 molecules to
                      form the interferon-stimulated gene factor 3 (ISGF-3) [20–22]. After translocation into the
                      nucleus, ISGF-3 binds to specific motifs located in the promoters of more than a hundred
                      IFN-stimulated genes (ISGs) with effector and regulatory functions [23]. This complex
                      system is highly regulated and can produce diverse responses depending on viral detection
                      and subversion mechanisms, as well as cell type and activation state. Members of the IRF
                      family play crucial roles at multiple levels of the IFN signalling, and in its regulation.
                           To date, nine IRFs have been identified in mammals (1–9) with a 10th member in
                      several avian and fish species [24]. Phylogenetic analysis of the vertebrate IRF family,
                      reveals members can be subdivided into four subgroups reflecting their evolutionary
                      history: IRF1-G (IRF1, IRF2), IRF3-G (IRF3, IRF7), IRF4-G (IRF4, IRF8, IRF9, IRF10) and
                      IRF5-G (IRF5, IRF6) [1]. The repertoire of irf genes is larger in bony fishes, likely stemming
                      from the whole-genome duplications (WGD) this group was subjected to: the number of IRF
                      present in the last common ancestor of teleosts and tetrapods (LCATT) was doubled by the
                      teleost-specific WGD (tsWGD) that occurred at the root of this lineage about ~300 million
                      years (Myrs ago), then increased again by additional WGD events in particular groups
                      such as salmonids, and carps [25]. Many fish irf paralogs have been described, especially
                      in salmonids such as irf7a/b [26] and irf10a/b [27].
                           Based on high-quality genome assemblies, we present a comprehensive characterisa-
                      tion of 23 irf genes within 6 salmonid species (Oncorhynchus mykiss, Oncorhynchus nerka,
                      Oncorhynchus tshawytscha, Oncorhynchus kisutch, Salmo salar and Salmo trutta) with a fo-
                      cal point on rainbow trout (O. mykiss). Salmonids underwent a fourth round of genome
                      duplication 88–103 Myrs ago termed the salmonid-specific whole-genome duplication
                      (ssWGD) [25,28], leading to a large number of irf genes. We investigated their phyloge-
                      netic relationships and syntenies to understand their origin, i.e., whether paralogs were
                      produced by the tsWGD or by the ssWGD. We also present additional evidence for the
                      existence of an 11th member of fish IRF, often referred to as IRF1a, and an updated nomen-
                      clature of fish IRF. Finally, we have designed a paralogue-specific primer set for all IRFs
                      whose expression profiles were examined in rainbow trout spleen tissue after 24 h stimula-
                      tion with viral and bacterial PAMPs. Our data offers a novel insight into the evolution of
                      the IRF family in salmonids which is coupled with functional data that highlights potential
                      functional divergence within the salmonid-specific IRFs.

                      2. Materials and Methods
                      2.1. Phylogenetic and Gene Synteny Analysis
                            Protein sequences of IRF family genes for O. mykiss (GCF_002163495.1), O. nerka
                      (GCF_006149115.1), O. tshawytscha (GCF_002872995.1), O. kisutch (GCF_002021735.2), S. salar
                      (GCF_000233375.1) and S. trutta (GCF_901001165.1) were originally obtained from BLASTp
                      searches with known zebrafish and human orthologues of IRFs 1–10 as the query. Protein
                      sequences of all IRFs for all the salmonids, human, chicken, zebrafish, northern pike and
                      spotted gar were retrieved from NCBI or Ensembl if it could not be located on NCBI (for
                      full list of protein sequences, gene IDs and accession numbers, see Table S1). In situations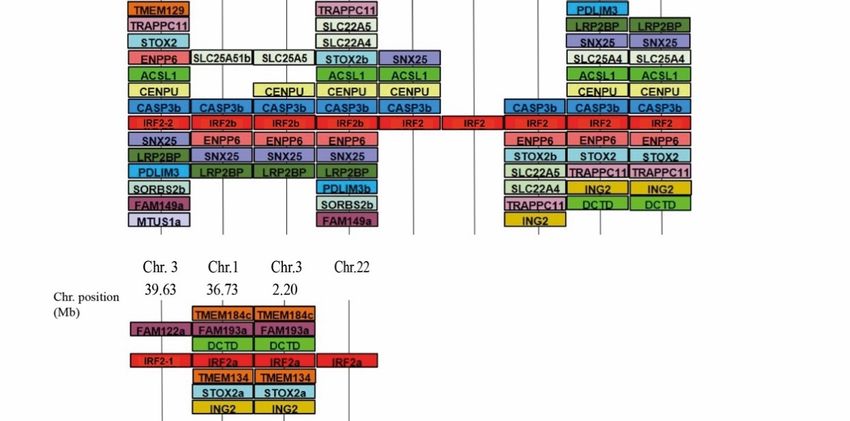
Genes 2021, 12, 238                                                                                              3 of 17

                      where several isoforms were found, the longest was chosen. Protein sequences were aligned
                      using the ClustalW method in the MEGA-X software [29]. The phylogenetic tree was
                      then constructed using the neighbour-joining and ML methods in MEGA X (ML trees can
                      be viewed in Figures S1 and S2), corrected using the Poisson model, and bootstrapped
                      2000 times. A second phylogenetic tree of only IRF1 and IRF2 subfamilies with IRF3 as an
                      outgroup was also constructed for more species with the same parameters. Gene synteny
                      analysis was carried out for all irf genes between salmonid and other relevant genomes. To
                      determine the genomic neighbourhood around candidate genes and the conservation of
                      gene order across species, genes were visually examined in NCBI’s genomic region browser.

                      2.2. IRF Primer Design
                           Due to the duplicated nature of salmonid genomes, care was taken to design paralogue-
                      specific primers. Nucleotide transcript sequences from all irf genes were aligned by
                      their IRF family (i.e., IRF1, IRF2) in Clustal Omega in order to identify divergent regions
                      suitable for specific primer design. Primers were designed to span 100–200 bps where
                      possible and the annealing temperature was identified using OligoCalc. Primer specificity
                      was confirmed through sequencing of the reverse and forward strands of PCR products
                      amplified from each experimental condition shown in Section 3.5, i.e., 1 PBS, Poly I:C and
                      Vibrio extract.

                      2.3. Animal Work
                            Adult rainbow trout were raised in the fish facilities of Institut National de la Recherche
                      en Agriculture et environnement (INRAE, Jouy en Josas, France). Fish (n = 4) were injected
                      intraperitoneally (IP) with 100 µL of either PBS, poly I:C (Sigma catalogue# P1530; 5 µg
                      per g of fish) or V. anguillarum extract (diluted 1/10). To prepare extracts, V. anguillarum
                      strain PO382 was grown in tryptic soy broth medium to OD600 (optical density at 600 nm)
                      1.5. Bacterial pellet (from 10 mL of full-grown culture) was resuspended in NaCl (9 g/L),
                      and the suspension was washed four times in NaCl (9 g/L) and resuspended in 1 mL of
                      the same isotonic solution and incubated 0.5 min at 100 ◦ C to kill bacteria, as described
                      in [30]. Fish were then kept for 24 h within 1 tank (300 L) supplied with recirculating
                      dechlorinated water with a flow rate of 1000 L/h, temperature of 10 ◦ C, and a photoperiod
                      of 10:14 light:dark. A computerised control system was used to monitor pH, ammonia
                      concentration and oxygen levels over the duration of the stimulation. Fish were sacrificed
                      by overexposure to benzocaine. Spleen tissue (100–200 mg) was extracted from each fish
                      and stored in RNA later at 4 ◦ C overnight before long term storage at −80 ◦ C.

                      2.4. RNA Extraction and Reverse Transcription
                            Total RNA was extracted from 100 mg of tissue homogenised with ceramic beads in
                      a FastPrep-24 5 G tissuelyser in 1 mL of Trizol following the manufacturer’s instructions.
                      Concentration and purity of RNA was estimated using a Nanodrop 2000 C Spectrophotome-
                      ter. First strand cDNA was synthesised from 1 µg RNA using a Biorad iScript advanced
                      cDNA kit with an integrated genomic DNA elimination step. First strand cDNA samples
                      were diluted 20-fold (working stock) with RNase/DNase free water (Sigma, St. Quentin
                      Fallavier, France) and stored at −20 ◦ C.

                      2.5. Quantitative Real-Time PCR
                            Real-time PCR (qPCR) analyses were performed with an Eppendorf Realplex2 Mas-
                      tercycler. All assays were carried out in 15 µL reactions on 96-well plates in duplicates.
                      Reaction mixes each contained 5 µL cDNA, 15 µL Biorad iTaq Universal SYBR Green
                      Supermix and 5 µL of reverse and forward primer (250 nm each). PCR cycling conditions
                      were 1 cycle of 95 ◦ C for 3 min, followed by 40 cycles of 95 ◦ C for 10 s then between 55 and
                      62 ◦ C for 20 s (two-step PCR). Melting curve analysis (thermal gradient from 55 to 95 ◦ C)
                      was then used to confirm the amplification of a single product. Each plate also included
                      “no template” negative controls in duplicate (cDNA replaced with water). Efficiency was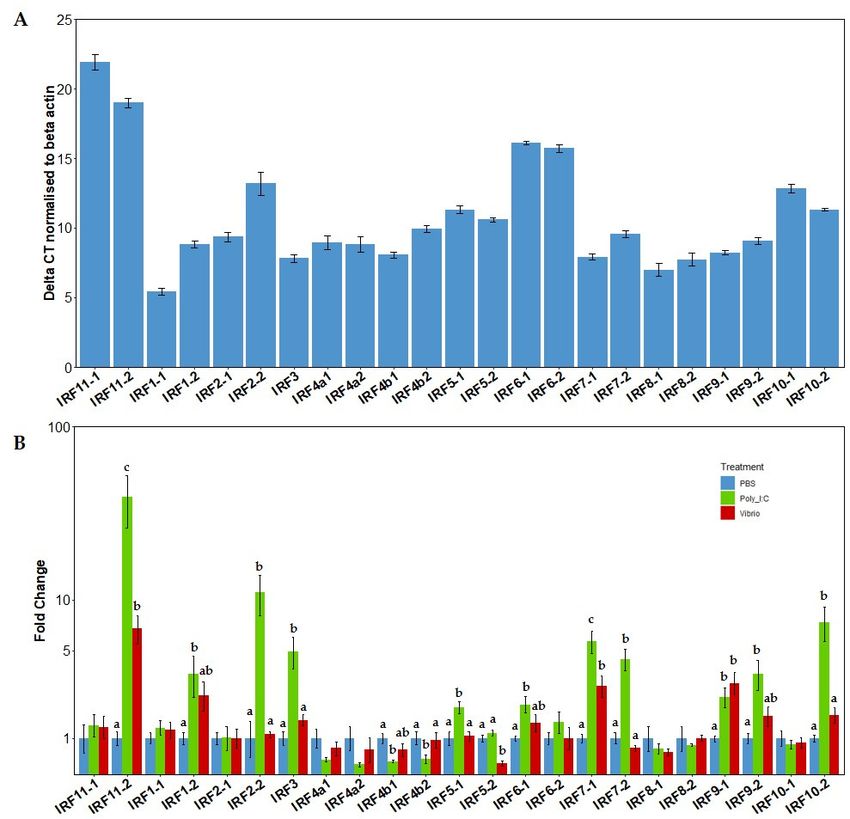
Genes 2021, 12, 238                                                                                             4 of 17

                      calculated for each primer from a serial dilution PCR ran alongside. Target gene expression
                      was normalised to β actin and then relative expression levels calculated. Full primer list,
                      sequence and annealing temperatures can be viewed below in Section 3.3.

                      2.6. Statistical Analysis
                            Statistical analysis of qPCR data was performed in R (v4.0.4) using expression data
                      calculated from ∆∆Ct method. A linear model (lm) was first made in R and the diagnostic
                      plots (qq plot and residuals versus fitted values) were assessed in order to ensure both nor-
                      mality and equal variance. If data met the assumptions, the one-way ANOVA results from
                      R’s linear model function could then be interpreted and a post-hoc Tukey test performed.

                      3. Results
                      3.1. Phylogenetic Analysis of Salmonid IRF Family
                            A total of 23 IRF family members in O. mykiss, O. kisutch, O. nerka, S. salar and S. trutta
                      were identified from genome data on NCBI, through BLASTp searches with human and
                      zebrafish orthologues as the query. Only 21 irf genes could be found from O. tshawytscha
                      (one irf5 and one irf10 were missing). Care was also taken to exclude irf -like genes which
                      share similar domains to IRFs, such as the sex-determining gene (sdY) in rainbow trout
                      which contains an IAD domain similar to IRF9 but no typical DBD [31]. Phylogenetic
                      analysis of sequences from salmonids, human (Homo sapiens), chicken (Gallus gallus), pike
                      (Esox Lucius), zebrafish (Danio rerio) and spotted gar (Lepisosteus oculatus) shows that they
                      can be grouped into four main groups: IRF-1G (irf1b, 1a/11 and irf2), IRF-3G (irf3 and 7),
                      IRF-4G (irf4, 8, 9 and 10) and IRF-5G (irf5 and 6) (Figure 1), as previously proposed [6,32,33].
                      All salmonid irf genes were orthologous to known human IRF and all but irf3 have retained
                      duplicated copies. In most cases (i.e., irf5, 6, 7, 8, 9, and 10), the presence of two salmonid
                      paralogues on distinct chromosomes and the branching of northern pike as a sister group
                      with a unique copy confirms these genes to be products from the ssWGD. The situation
                      was different for irf2, with two copies both in zebrafish and in salmonids, suggesting an
                      older origin. irf1 and irf4 were revealed to have also duplicated copies in the other fish
                      species analysed, suggesting they originated from the tsWGD. However, the structure of
                      the IRF-1G subtree revealed a potential issue with the existing nomenclature due to the
                      clustering of irf1b and irf2 leaving irf1a as a well-supported outgroup, both in neighbour-
                      joining and maximum likelihood phylogenetic analyses. The presence of both irf1a and
                      irf1b in the spotted gar, a species belonging to a fish lineage that diverged before the tsWGD,
                      indicates that these two genes did not originate from this WGD event. This is unlike the
                      situation with irf4, where only other teleosts have irf4a and irf4b while the spotted gar
                      only has one copy indicating irf4a and irf4b are products from the tsWGD. Gene synteny
                      analysis was then carried out for all irf genes using the genomic region browser in NCBI
                      in order to determine whether the chromosomic environment of irf genes across species
                      supports relationships inferred from phylogenetic trees; irf2 was used as a representative
                      example (Figure 2), the rest of the irf gene synteny can be viewed in Table S2. Detailed
                      analysis of the genomic environment of each copy supported the relationships inferred
                      from phylogenetic analyses for family members belonging to groups 2–4.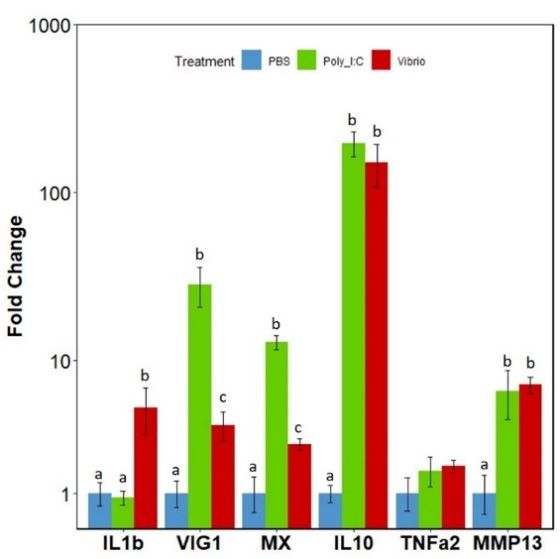
species supports relationships inferred from phylogenetic trees; irf2 was used as a repre-
                                    sentative example (Figure 2), the rest of the irf gene synteny can be viewed in Table S2.
                                    Detailed analysis of the genomic environment of each copy supported the relationships
Genes 2021, 12, 238                 inferred from phylogenetic analyses for family members belonging to groups 2–4. 5 of 17

      Figure 1. Phylogenetic tree showing the evolutionary relationship of interferon regulatory factor (IRF) transcription factors
      Figure
      in     1. Phylogenetic
         salmonids.           tree sequences
                     IRF protein   showing the evolutionary
                                              were            relationship
                                                    aligned using          of interferon
                                                                    ClustalW             regulatory
                                                                               in the MEGA-X           factor Following
                                                                                                  software.   (IRF) transcription  factors
                                                                                                                          alignment,    the
      in salmonids. IRF protein sequences were aligned using ClustalW in the MEGA-X software. Following alignment, the
      phylogenetic tree was constructed using the neighbour-joining method in MEGA X and corrected using the Poisson model.
      phylogenetic tree was constructed using the neighbour-joining method in MEGA X and corrected using the Poisson model.
      The branch support values were gained by non-parametric bootstrapping (2000 replicates). Branches have been coloured to
      The branch support values were gained by non-parametric bootstrapping (2000 replicates). Branches have been coloured
      represent evolutionary
      to represent evolutionarygroups; rainbow
                                  groups;       trout
                                          rainbow      sequences
                                                    trout         have
                                                          sequences    alsoalso
                                                                     have   been   coloured
                                                                                 been        in red
                                                                                      coloured       for ease
                                                                                                 in red       of visibility.
                                                                                                         for ease            The The
                                                                                                                  of visibility. scalescale
                                                                                                                                        bar
      represents the calculated
      bar represents             evolutionary
                     the calculated           distance.
                                     evolutionary        Genbank
                                                   distance.       accession
                                                             Genbank          numbers
                                                                       accession        for all
                                                                                   numbers  forspecies   can can
                                                                                                 all species  be viewed   in Table
                                                                                                                  be viewed        S1. S1.
                                                                                                                              in Table
Genes 2021,12,
Genes2021, 12,238
x FOR PEER REVIEW 6 of
6 of 1717
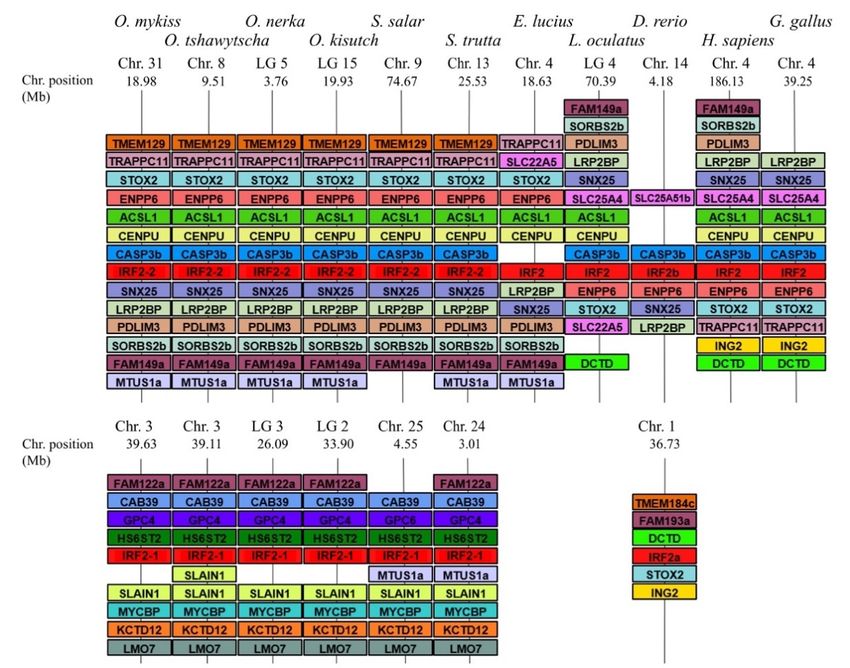
Figure2.2.IRF2
Figure IRF2gene
genesynteny
synteny in
in salmonids.
salmonids. The
The syntenically
syntenically conserved
conservedgene
geneblocks
blocksare
areshown
shownininmatching
matchingcolours.
colours.Gene
Gene
synteny was compiled from up- and down-stream locations relative to each species IRF2 taken from NCBI’s genome
synteny was compiled from up- and down-stream locations relative to each species IRF2 taken from NCBI’s genome browser.
browser. Species names are displayed at the top of the figure, IRF gene accession numbers are on Table S1, chromosome
Species names are displayed at the top of the figure, IRF gene accession numbers are on Table S1, chromosome number and
number and range (position) are shown above and below each species gene synteny.
range (position) are shown above and below each species gene synteny.
3.2. Comparative Phylogenetic and Synteny Analysis on the Case of Group 1 Salmonid Irfs
3.2. Comparative Phylogenetic and Synteny Analysis on the Case of Group 1 Salmonid Irfs
To further investigate the evolutionary relationship of irf1 and irf2 within fish species
To further investigate the evolutionary relationship of irf1 and irf2 within fish species
another phylogenetic (Figure 3) and synteny analysis (Figure 4) was performed with
another phylogenetic (Figure 3) and synteny analysis (Figure 4) was performed with
added species from more taxonomic groups: elephant shark (Callorhinchus milii), herring
added species from more taxonomic groups: elephant shark (Callorhinchus milii), herring
(Clupea harengus), channel catfish (Ictalurus punctatus), stickleback (Pungitius pungitius)
(Clupea harengus), channel catfish (Ictalurus punctatus), stickleback (Pungitius pungitius) and
and pufferfish (Takifugu rubripes).
pufferfish (Takifugu rubripes).
As with the initial analysis, irf1a/11 appears as a clear outgroup to irf1b/1 and irf2
As with the initial analysis, irf1a/11 appears as a clear outgroup to irf1b/1 and irf2
(Figure 3). The presence of irf1a/11 in cartilaginous fish (elephant shark) and spotted gar
(Figure 3). The presence of irf1a/11 in cartilaginous fish (elephant shark) and spotted gar
further confirms this IRF as its own sub-family in fish that was likely an ancestral IRF lost
further confirms this IRF as its own sub-family in fish that was likely an ancestral IRF lost
in tetrapods. The genomic neighbourhood of tetrapod irf1 and fish irf1b was found to be
in tetrapods. The genomic neighbourhood of tetrapod irf1 and fish irf1b was found to be
highly similar, while the genomic neighbourhood of fish irf1a was divergent (Figure 4).
highly similar, while the genomic neighbourhood of fish irf1a was divergent (Figure 4). The
The only possible similarity between irf1/1b in tetrapods and the fish-specific irf1a/irf11
only possible similarity between irf1/1b in tetrapods and the fish-specific irf1a/irf11 was the
was the presence of a gene belonging to the kinesin family: the kinesin-like kif3a was lo-
presence of a gene belonging to the kinesin family: the kinesin-like kif3a was located close
cated close to H. sapiens and G. gallus irf1, and the kifbp (Kinesin family binding protein)
to H. sapiens and G. gallus irf1, and the kifbp (Kinesin family binding protein) was observed
was observed close to teleost irf1a (Figure 4).
close to teleost irf1a (Figure 4).
In contrast, the genomic neighbourhood of the fish-specific irf1a/11 was not conserved
(Figure 4). Three separate groupings of synteny can be observed: salmonid irf1a1 (or
irf11-1) and irf1a2 (or irf11-2) were highly similar to elephant shark, likely representing the
primordial configuration (Figure 4, in which rainbow trout was used as a representative
of the salmonids). Zebrafish, catfish and herring irf1a regions all shared a high degree of
similarity amongst each other with a few shared genes (ddx, chs and mpc1) that are also
present in salmonids. Stickleback and pufferfish irf1a regions are very similar to each other,
but they had no marker in common with the other species analysed (Figure 4).Genes 2021, 12, 238 7 of 17
In the case of irf2 (Figure 3), two paralogs were found in additional fish species like
the channel catfish and herring, while most teleosts apparently retained only one copy.
This copy of irf2 (irf2-2 in salmonids) is well conserved throughout the fish species and is
orthologous to tetrapod irf2, as reflected in the phylogenetic tree.
There is significant conservation of the genomic context between species, although a high
degree of gene shuffling and variation has occurred among what is conserved. For example,
the pufferfish irf2 neighbourhood shared no similarity with any other species (Figure 4).
In contrast, the second copy (named irf2-1 in salmonids and irf2a in zebrafish) which
was only found within salmonids, zebrafish, catfish and herring, did not group as a
consistent set in the phylogenetic tree (Figure 3). Salmonid irf2-1 grouped with irf2-2, while
in other species irf2a were more divergent. Zebrafish and catfish irf2a regions shared an
identical gene order while both the rainbow trout and herring irf2a neighbourhoods shared
almost no similarity with the other irf2a. The lack of similarities between the irf2 copy
Genes 2021, 12, x FOR PEER REVIEWfrom different species may suggest these genes have arisen from different/independent 7 of 17
duplication events (not only WGD) or were subjected to further rearrangements.
Figure
Figure 3.
3. Phylogenetic
Phylogenetictreetreeshowing
showingthe evolutionary
the relationship
evolutionary of IRF1
relationship andand
of IRF1 IRF2 transcription
IRF2 transcription
factors
factors in
invertebrates
vertebrateswith
withIRF3
IRF3used
usedasas
anan
outgroup. IRFIRF
outgroup. protein sequences
protein werewere
sequences aligned usingusing
aligned
ClustalW
ClustalW in inthe
theMEGA
MEGAXXsoftware. Following
software. alignment,
Following the the
alignment, phylogenetic tree tree
phylogenetic was was
constructed
constructed
using the neighbour-joining method in MEGA X and corrected using the Poisson model. The
using the neighbour-joining method in MEGA X and corrected using the Poisson model. The
branch support values were gained by non-parametric bootstrapping (2000 replicates). The scale
branch support values were gained by non-parametric bootstrapping (2000 replicates). The scale bar
bar represents the calculated evolutionary distance. Genbank accession numbers for all species can
represents
be viewed in theTable
calculated
S1. evolutionary distance. Genbank accession numbers for all species can be
viewed in Table S1.
In contrast, the genomic neighbourhood of the fish-specific irf1a/11 was not con-
served (Figure 4). Three separate groupings of synteny can be observed: salmonid irf1a1
(or irf11-1) and irf1a2 (or irf11-2) were highly similar to elephant shark, likely representing
the primordial configuration (Figure 4, in which rainbow trout was used as a representa-
tive of the salmonids). Zebrafish, catfish and herring irf1a regions all shared a high degreeGenes 2021, 12, 238 Genes 2021, 12, x FOR PEER REVIEW 8 of 17
Figure 4.Figure
IRF1(A)
4. and IRF2and
IRF1(A) (B) comparative gene synteny
IRF2 (B) comparative gene in vertebrates.
synteny The syntenically
in vertebrates. conserved
The syntenically gene blocks are sh
conserved
in matching colours. Gene synteny was compiled from up and downstream locations relative to each species IRF t
gene blocks are shown in matching colours. Gene synteny was compiled from up and downstream
from NCBI’s genome browser. Species names are displayed at the top of the figure, irf gene accession numbers ar
locations relative to each species IRF taken from NCBI’s genome browser. Species names are displayed
Table S1, chromosome number and range (position) shown above and below each species gene synteny.
at the top of the figure, irf gene accession numbers are on Table S1, chromosome number and range
(position) shown above and below each species gene synteny.Genes 2021, 12, 238 9 of 17
Based on our genomic overview of salmonid irf genes, we then developed a com-
prehensive set of primers allowing specific amplification and quantification of mRNAs
encoding each rainbow trout paralog (Table 1).
Table 1. Rainbow trout primer sequences used for qPCR with gene IDs and NCBI accession numbers.
Gene ID Gene Name Direction Sequence Annealing Product Size (bps) Accession
100135845 β actin 1 Forward GGTGGTAGGCCAGAGGC 60 101 NM_001124235.1
Reverse GGGAGAAGATGACCCAGATCATG
100136024 IL1b 2 Forward GGAGAGGTTAAAGGGTGGCGA 60 121 XM_036979104
Reverse TGCCGACTCCAACTCCAACA
110494493 MX3 Forward CCTCCTGAAATCAGCGAAGAC 60 364 XM_021569609.2
Reverse GAGTCTGAAGCATCTCCCTCCTG
100136835 IL10 2 Forward CGACTTTAAATCTCCCATCGAC 60 70 NM_001245099.1
Reverse GCATTGGACGATCTCTTTCTTC
100135876 VIG1 3 Forward GGCAACTCCAAGCAGTGTCAA 60 187 XM_021582972.2
Reverse GTCGTGTATGAAAGGCTCTCCG
100136064 TNFa2 2 Forward GGAGGCTGTGTGGCGTTCT 60 73 NM_001124374.1
Reverse TGCTGACACCAGGCAAAGAG
100136017 MMP13 2 Forward GCACCTTCTCTCTGCCCCGC 60 235 XM_021618131.2
Reverse AGGCTCTGTTGTGGTTTGCTGC
110499402 IRF11-1 (a1) Forward TTGATGAGACAGCTCAAGTTTTC 55 146 XM_021576528.1
Reverse CTTAGGATCAGGTTCGTCTTTC
110502724 IRF11-2 (a2) Forward CCAGGGGTCACCTGGCG 62 169 XM_021580977.1
Reverse TCCATGTCTTCGGATCAGGC
110533376 IRF1-1 Forward TTACAAAATGCTGAGCGTCAG 55 237 XM_021617512.1
Reverse GTCTCCCCTACGTTGTCTGA
100135950 IRF1-2 Forward GATGAAGAACGTCCACTCC 55 231 NM_001124293.1
Reverse AAATCATCTAGGCTGTCTGT
110519953 IRF2-1 Forward ATGCGAATGCGACCATGGC 55 195 XM_021596860.1
Reverse GTATGAATGGCCCAGTTCTTG
100136151 IRF2-2 Forward TGGAACAGATAAACTCTTC 62 130 NM_001124438.1
Reverse ATAAATAAAGGAGCGTCTTTC
100750229 IRF3 Forward AGCAATGGTAGGGTTCAAGG 60 179 NM_001257262.1
Reverse CATCTGGCCACTGGAACAG
100499175 IRF4-a1 Forward CCCACATGAGCTCAGTCAATAG 60 139 XM_021613502.1
Reverse GGGTCGGCTGAGTGGCTG
100499174 IRF4-a2 Forward CGATCAGATTAACAGCAGTAG 60 130 NM_001310139.1
Reverse CATCCTCCTCTCGATTGTAG
110521762 IRF4-b1 Forward GCTCGTGCAGCGAAGTCAG 60 181 XM_021599601.1
Reverse AGGCATCTGTGTCTGCAGG
110524663 IRF4-b2 Forward TCCGGATTCGGACTACGGC 60 110 XM_021604510.1
Reverse TCTCCCACACGAGGCCTGC
110500261 IRF5-1 Forward AGCATTACCATGGCAGCGC 60 130 XM_021577521.1
Reverse TGTTGGAGGGTCCTACCG
110500261 IRF5-2 Forward AGCATTACCATGGCAGCGC 60 130 XM_021577521.1
Reverse TGTTGGAGGGTCCTACCG
110528098 IRF6-1 Forward GGATGAAGATGAATCAGATGGC 60 209 XM_021609915.1
Reverse GGGACGAAGGCTGCATCTC
110494340 IRF6-2 Forward AGACAACAAGCGCTTCAGGG 60 111 XM_021569306.1
Reverse TGGAACTTTCCTGTCTCCAC
100750228 IRF7-1 (a) Forward AGCAATACACTGGTTTGTTC 60 145 XM_021600499
Reverse GTGGGATGCTCATTGATTTTC
110497044 IRF7-2 (b) Forward GCCGGGTTGTGTTTTGTG 60 144 XM_021573049.1
Reverse CTTGTCATTGGGATGCGTG
110526480 IRF8-1 Forward TGGGAGGACGACAGTCGCAC 60 95 XM_021607480.1
Reverse GCCTTGAAGATAGAGGCGTCG
110506608 IRF8-2 Forward GTCTGGGAGGACGACAGC 60 98 XM_021586344.1
Reverse GCCTTGAAGATAGAAGCGTCT
110535315 IRF9-1 Forward TCCGATGGGGGTCGTGTG 60 160 XM_021620234.1
Reverse CCAACACTTGTTCATTCATC
110489699 IRF9-2 Forward TGTCTGAGGGGTGTCATGC 60 146 XM_021562471
Reverse GATGGGTACGAGGCGGTAG
110492403 IRF10-1 (a) Forward CTTACCTGGGAGAACGAAG 60 151 XM_021566691.1
Reverse GACGAGTCTTCCAGGTG
110532004 IRF10-2 (b) Forward ATCTGAATGAAGATGCAGCC 60 172 XM_021615574.1
Reverse CGCTCTGGGACCTCCTG
1 Ref [34], 2 Ref [35], 3 Ref [36].
3.3. A Consistent Nomenclature for Salmonid IRF Family
The combined phylogenetic and synteny analysis led us to propose a consolidated and
coherent nomenclature of salmonid irf genes similar to the one we recently reported for
stat genes [37]. The letter a/b corresponding to the tsWGD (and to genes generally present
in the zebrafish), and the subsequent number (1 or 2) identifying the copies produced by
the ssWGD, based upon chromosome number in rainbow trout. For most of the salmonidGenes 2021, 12, 238 10 of 17
IRFs here, this was the first time they have been characterised. However, in cases where
salmonid paralogues have been characterised previously (i.e., irf7a and irf7b, irf10a and
irf10b), we suggest that the “a” paralogues are now labelled as 1 and the “b” paralogues are
labelled as 2, respecting the original characterisation. For example, irf7a and irf7b would
now be called irf7-1 and irf7-2, respectively, acknowledging them as products of the ssWGD.
For the remaining results and discussion, we will now refer to the salmonid IRFs by their
proposed name. The full list of proposed IRF family gene names and paralogue-specific
primers is provided in Table 1 and Table S1.
3.4. Constitutive mRNA Expression Levels of the IRF Gene Family
The relative mRNA basal expression levels of the irf gene family repertoire were
initially analysed within spleen tissue of rainbow trout from the control (PBS) group
(Figure 5A). Gene expression of the irf were displayed as the delta Ct values after normal-
ization with β actin (Figure 5A). Several members of the irf family (irf 11-1, irf 11-2, irf 6-1
and irf 6-2) were very poorly expressed in the unstimulated spleen tissue. Following irf1-1,
Genes 2021, 12, x FOR PEER REVIEWirf8-1 was the second most expressed gene, which was then followed by irf8-2 and then 11 ofirf3,
17
although constitutive expression of irf8-2 was much more variable.
Figure
Figure 5.5. (A).
(A).Relative
Relativeconstitutive
constitutiveexpression of IRFs
expression in control
of IRFs (PBS)
in control fish spleen
(PBS) tissue.
fish spleen Bars rep-
tissue. Bars
resent the delta CT (DCT) of the IRFs when normalised to the house keeping gene β
represent the delta CT (DCT) of the IRFs when normalised to the house keeping gene β actin (±SEM),actin (±SEM),
n = 4. (B). Fold change expression of IRF family members in spleen tissue of rainbow trout. Fish
n = 4. (B). Fold change expression of IRF family members in spleen tissue of rainbow trout. Fish were
were injected i.p. with either PBS, V. anguillarum extract or poly I:C for 24 h. Expression was nor-
injected i.p. with either PBS, V. anguillarum extract or poly I:C for 24 h. Expression was normalised to
malised to the housekeeping gene β actin. A linear model was used for analysis of all genes. Bars
the housekeeping
represent gene
fold change β actin.
relative to A
thelinear model was
PBS control used
group for analysis
(±SEM), of all genes.
n = 4. Results Bars represent
of the Tukey post
fold change relative to the PBS control group ( ± SEM), n = 4. Results of the Tukey post
hoc test are displayed above the bars. Bars which do not share a letter are significantly different. hoc test are
displayed above the bars. Bars which do not share a letter are significantly different.
3.5. mRNA Expression Levels of the IRFs in Response to Poly I:C or Vibrio Extract
Expression of the complete irf family gene repertoire was then examined in adult
rainbow trout spleen tissue, following in vivo activation by intra-peritoneal injection of V.
anguillarum extract or poly I:C to elicit either an antibacterial or antiviral response, respec-
tively. Initially, to confirm fish were undergoing an inflammatory response to the stimu-
lations the expression of several marker genes for viral and bacterial responses were ex-
amined: interleukin 1 β (il1b), viperin (vig1/rsad2), interferon-induced GTP-binding pro-Genes 2021, 12, 238 11 of 17
3.5. mRNA Expression Levels of the IRFs in Response to Poly I:C or Vibrio Extract
Expression of the complete irf family gene repertoire was then examined in adult
rainbow trout spleen tissue, following in vivo activation by intra-peritoneal injection of
V. anguillarum extract or poly I:C to elicit either an antibacterial or antiviral response,
respectively. Initially, to confirm fish were undergoing an inflammatory response to the
stimulations the expression of several marker genes for viral and bacterial responses were
examined: interleukin 1 β (il1b), viperin (vig1/rsad2), interferon-induced GTP-binding
Genes 2021, 12, x FOR PEER REVIEW 12 of 17
protein 3 (mx3), interleukin 10 (il10) and matrix metalloproteinase 13 (mmp13) (Figure 6).
The Vibrio extract elicited a significant increase in expression of il1b, vig1/rsad2, mx3, il10 and
mmp13, while poly I:C elicited significant increases in expression of typical ISGs vig1/rsad2,
increase
mx, in mmp13.
il10 and expression, whereas irf5-2
The significant displayed
increases a significant
in expression decrease
compared in expression
to controls confirmed in
Vibrio-stimulated
that stimulated fishfish.
were undergoing a strong immune reaction.
Figure 6. Fold
Figure Foldchange expression
change of inflammation
expression markermarker
of inflammation genes: interleukin 1 β (IL1b), viperin
genes: interleukin 1 β (IL1b),
(vig1/rsad2),
viperin interferon-induced
(vig1/rsad2), GTP-binding
interferon-induced protein 3 (mx3),
GTP-binding interleukin
protein 3 (mx3), 10 interleukin
(il10) and matrix metallo-
10 (il10) and
proteinase 13 (mmp13) in spleen tissue of rainbow trout. Fish were injected i.p. with either
matrix metalloproteinase 13 (mmp13) in spleen tissue of rainbow trout. Fish were injected i.p. with PBS, V.
anguillarum extract or poly I:C for 24 h. Expression was normalised to the housekeeping gene β
either PBS, V. anguillarum extract or poly I:C for 24 h. Expression was normalised to the housekeeping
actin. A linear model was used for analysis of all genes. Bars represent fold change relative to the
gene β actin. A linear model was used for analysis of all genes. Bars represent fold change relative to
PBS control group (±SEM), n = 4. Results of the Tukey post hoc test are displayed above the bars.
the PBS
Bars control
which do group (±SEM),
not share n are
a letter = 4.significantly
Results of thedifferent.
Tukey post hoc test are displayed above the bars.
Bars which do not share a letter are significantly different.
4. Discussion
The 23 irf genes within salmonids displayed a wide range of diversity in their expres-
The IRFs
sion levels afterare an ancientwith
stimulation family of proteins
poly central
I:C or Vibrio to the(Figure
extract regulation5B). of interferon
More than halfac-
tivity. Despite the importance of this family, there are still gaps
of the IRFs examined (14 out of 23) displayed significant changes following stimulation, in the knowledge of the
fish-specific
indicating thatIRFs related
a large to evolution,
majority are involved nomenclature
in salmonidand function,
immunity whichway.
in some is then
IRF exacer-
family
bated within the salmonids due to the ssWGD. The aim of this work was
members: irf1-2, irf2-2, irf3, irf5-1, irf6-1, irf7-1, irf7-2, irf9-1, irf9-2, irf10-2 and irf11-2 were to address the
evolution of the IRF family within the salmonids and provide resources
all significantly upregulated in expression following poly I:C stimulation whereas irf4b1 to analyse expres-
sionirf4b2
and and functions
displayedfor the salmonid
a significant IRFs (PCR
decrease primers,
in their coherent
expression nomenclature).
levels following poly TheI:Cre-
cent availability of well-assembled genomes for six salmonid species
stimulation. After Vibrio stimulation, only irf11-2, irf7-1 and irf9-1 displayed a significant allowed a first ex-
haustivein
increase description
expression, of whereas
the irf gene repertoire.
irf5-2 displayed a significant decrease in expression in
We initially fish.
Vibrio-stimulated identified 23 IRF family members within 6 salmonid species which had
no apparent consensus on nomenclature. Two complementary approaches of phylogeny
4.and
Discussion
synteny were used to determine the sub-families each IRF belonged to and their evo-
lutionary
The IRFshistory
are in anregard
ancientto family
the various whole-genome
of proteins central to duplications
the regulation in fish. This initial
of interferon
approachDespite
activity. revealed thethat almost all of
importance of this
the salmonid
family, thereIRFsarewere stillproducts
gaps infrom the ssWGD
the knowledge
with
of thean exception IRFs
fish-specific in regard to irf4a/irf4b
related to evolution, which were likely aand
nomenclature result of the tsWGD.
function, which isWhile
then
there is onlywithin
exacerbated one copy of irf2 in most
the salmonids due to fish
thegroups,
ssWGD.we identified
The aim of this thework
presence
was to ofaddress
two irf2
copies
the within of
evolution zebrafish,
the IRF catfish
family and
within herring, in addition
the salmonids to Salmonids.
and In fact, the
provide resources two irf2
to analyse
expression
copies found andinfunctions
salmonids forhave
the salmonid
likely arisen IRFs (PCR
from theprimers,
ssWGD,coherent nomenclature).
independently from the
second copy in the above species. An additional copy of irf2 (named irf2a) has been gen-
erated in a few other fish groups. The irf2a genes found in catfish and zebrafish are true
loco-orthologs. These two species belong to evolutionarily related groups, and compara-
tive genomic studies have revealed that they show a high level of syntenic conservation
[38,39]. Due to no further WGDs within zebrafish or catfish, these extra irf2 genes may beGenes 2021, 12, 238 12 of 17
The recent availability of well-assembled genomes for six salmonid species allowed a first
exhaustive description of the irf gene repertoire.
We initially identified 23 IRF family members within 6 salmonid species which had
no apparent consensus on nomenclature. Two complementary approaches of phylogeny
and synteny were used to determine the sub-families each IRF belonged to and their
evolutionary history in regard to the various whole-genome duplications in fish. This
initial approach revealed that almost all of the salmonid IRFs were products from the
ssWGD with an exception in regard to irf4a/irf4b which were likely a result of the tsWGD.
While there is only one copy of irf2 in most fish groups, we identified the presence of two
irf2 copies within zebrafish, catfish and herring, in addition to Salmonids. In fact, the two
irf2 copies found in salmonids have likely arisen from the ssWGD, independently from
the second copy in the above species. An additional copy of irf2 (named irf2a) has been
generated in a few other fish groups. The irf2a genes found in catfish and zebrafish are true
loco-orthologs. These two species belong to evolutionarily related groups, and comparative
genomic studies have revealed that they show a high level of syntenic conservation [38,39].
Due to no further WGDs within zebrafish or catfish, these extra irf2 genes may be assumed
to have been retained from the tsWGD. In contrast, the second irf2 copy found in herring
was not in the same genomic context as in zebrafish and catfish. Thus, these different
“irf2a” genes found in non-salmonids may have been produced either at the tsWGD, or
independently by punctual gene duplication.
We also identified the presence of an 11th IRF member in fish species belonging to the
IRF-1G evolutionary group. Huang et al. [24] first recognised this fish-specific member in
their characterisation of the IRF family in vertebrates and named it irf11; however, the name
irf1a was mostly used in many species. As noted in our previous work in zebrafish [40], we
see here that irf11 was found to be an outgroup to the irf1 and irf2 clades within the IRF-1G
group. Further comparative synteny analysis of the irf1 and irf11 genes found no common
gene content/order between the genomic neighbourhood of these two groups of genes.
Interestingly, salmonid irf11 shared almost identical gene order with the elephant shark, a
cartilaginous species which diverged from bony fish 450 MYA [41]. While phylogenetic
analysis shows that these genes form a well-supported group, examination of the other
fish species genomic neighbourhoods would suggest that irf11 was subjected to multiple
rearrangements over the evolution of the various teleost groups. From the small subset of
fish species analysed in our study, the rearrangement rate of irf11 would appear to be quite
high, as three distinct gene neighbourhoods can be seen to be conserved across: salmonids
and elephant shark; zebrafish, catfish and herring; and stickleback and fugu.
Normally following a WGD event, the resultant genome eventually only retains a
fraction of duplicated genes, as the redundant genes are gradually inactivated through
a process known as “gene fractionation” [42]. In salmonids, this phenomenon is illus-
trated by the large percentage of duplicated genes still present within the genome (48%
of genes with retained ohnologues) which is likely due to the relatively recent ssWGD
(88–103 Myrs ago), compared to the genomes of other fish that retain much less pairs from
the tsWGD (~300 Myrs ago) [28,43]. Salmonid irf paralogs resultant from the ssWGD iden-
tified within this paper appeared to be almost all conserved bar irf3 (no duplicated copy
could be located in any salmonid species) with no pseudogenes and a clear assignation to
subgroups. Interestingly, this is in sharp contrast with the STAT family of transcription fac-
tors, in which the retention/loss rate is very variable across members [37]. While both STAT
and IRF are key transcription factors of the IFN signalling, these contrasted evolutionary
pathways suggest different dynamics of sub/neofunctionalization after the ssWGD [44,45].
Another possible factor in the selection pressure these families face is from viral subversion,
where viruses have evolved strategies to avoid detection from the immune response [46].
IRFs 3 and 7 are common targets from several viruses and accessory proteins from paramyx-
oviruses have been shown to mimic IRF3 in order to phosphorylate with TBK1 leading to
its degradation instead of the induction of the antiviral response [47]. Although this hasGenes 2021, 12, 238 13 of 17
been studied in mammals, it may be no coincidence that IRF3 is commonly targeted due to
the lack of a second paralog that could confer resistance.
While induction of a paralog by poly IC or bacterial extracts suggests it is somewhat
involved in the immune reaction, the lack of modulation does not imply a lack of a key
role. Thus, our recent KO experiment of stat1a gene, which was not inducible by type
I IFN or viral infection, established that it is required for a typical induction of ISG [48].
Hence, we are aware that further studies are necessary to evaluate the role of each paralog
in the IFN response. Depending on a whole host of factors, different IRFs are noted to be
positive or negative regulators (or even both) of the human/mouse interferon response,
however the major consensus is IRF1, IRF3, IRF5, IRF7 and IRF9 function as positive
mediators of the type I interferon response while IRF2 and IRF4 act as regulators [7,49,50].
The large repertoire of irf paralogs in salmonids offer a unique opportunity to test how
these functions are conserved or have quickly diversified.
The profile of up- and down-regulation of irf by following an in vivo challenge with
V. anguillarum extract or poly I:C suggests that most members of the IRF family are involved
in the immune reaction in salmonids. Within our results it can be seen that over half of the
salmonid IRFs (irf11-2, irf1-2, irf2-2, irf3, irf4b1, irf4b2, irf5-1, irf5-1, irf6-1, irf7-1, irf7-2, irf9-1
irf9-2 and irf10-2) are modulated in some way in response to bacterial or viral stimulation,
while only two subfamily’s irf paralogues showed no statistically significant changes
due to stimulation: irf4a and irf8. In mammals, IRF3 and IRF7 are directly involved in
the transcriptional induction of type I IFN-α/β genes following their activation while
IRF1, IRF5 and IRF9 (part of the ISGF3 complex with STAT) are involved with positive
regulation of the IFN response and stimulation of ISGs [51–55]. In our study, at least
one paralogue from each salmonid homolog of these genes was induced following poly
I:C stimulation. Salmonid irf homologs of the mammalian genes involved in regulation
of the IFN response (irf2 and irf4) [56,57] showed an increased (irf2-2) or a decreased
(irf4b1 and irf4b2) expression in poly I:C-stimulated fish. Modulation of these genes would
suggest that at least one paralog from each of these IRF sub-families was involved in
the viral immune response like their mammalian counterparts which have key roles in
IFN signalling. Similarities between both mammalians and salmonids can be seen in the
large repertoire of type I IFN genes in both classes [16,58] which then converges upon
their interaction with a relatively small number of IFN receptors. Mammalian type I IFN
signalling occurs through the IFNAR1/R2 receptor while fish signal through homologues
of type I IFN receptors made of CRFB1/2 and CRFB5, of which salmonids possess several
paralogues that their various type I IFNs subtypes can signal through [17,59–61]. This
difference in the number of retained irf genes and IFN receptors in fish (and especially in
salmonids) compared to mammals would indicate regulation of the IFN response likely
differs, offering a large set of possibility for irf sub-functionalization.
The difference in knowledge of IRF function in fish is further exemplified by the
additional IRFs 11 and 10 whose function is not well understood due to their absence
in mammals. The salmonid-specific irf11-2 within our study was strongly induced fol-
lowing poly I:C stimulation, with the largest fold change of all the IRFs examined and
the lowest constitutive expression in the unstimulated control fish. This low constitutive
expression of IRF11 in relation to the other IRFs has also been observed in mandarin fish
(Siniperca chuatsi) [62]. In zebrafish, the unique IRF11 has been shown to restrict viral
reproduction through the induction of IFN and ISGs indicating it as a positive mediator of
IFN [63]. Taken together, these observations infer salmonid irf11-2 as likely playing some
role in activating the IFN response similar to zebrafish. However, there are various contra-
dicting reports on IRF11 expression in various fish species: poly I:C but not actual viral
infection increased expression of IRF11 in some tissues of mandarin fish [62]. Poly I:C, LPS,
V. anguillarum, and S. aureus all caused a significant decrease in IRF11 expression in spleen
tissue of miiuy croaker 24 h following stimulation, although there were increases observed
in some tissues 6 h after [64]. In addition, a significant contribution of the non-induced
salmonid irf11-1/irf1a-1 is also possible but was not seen in our expression data. IRF10 hasGenes 2021, 12, 238 14 of 17
been shown to have a regulatory role in the induction of IFN and ISGs. Over-expression
of IRF10 in common carp induced a downregulation of ISGs after poly I:C stimulation
while in zebrafish over-expression of IRF10 blocked the induction of type I IFNs IFN1 and
IFN3 [65,66]. A previous characterisation of the two irf10 paralogues in rainbow trout
revealed that irf10-2 may be more important in the antiviral response which is in agreement
with our results showing only one irf10 paralogue was significantly modulated [27].
5. Conclusions
The high stability of the IRF repertoire in salmonids calls for a detailed functional
characterization, which will require loss and gain of function experiments. The data
presented here will certainly contribute to disentangling the remarkable complexity of
the IFN system in this fish group. Interestingly, several of the paralogs (i.e., irf5, irf7, irf9)
characterised here have shown differential responses to viral or bacterial stimulation which
could indicate the evolution of new phenotypes within these genes, however the answers
to this require future research and the use of gene knockout.
Supplementary Materials: The following are available online at https://www.mdpi.com/2073-442
5/12/2/238/s1, Table S1. Full repertoire of Salmonid irf genes. Table S2. Genomic Neighbourhood
of all Salmonid irf genes. Figure S1 Maximum likelihood phylogenetic tree of all IRF. Figure S2
Maximum likelihood phylogenetic tree of IRF1 and IRF2.
Author Contributions: Conceptualization and analysis, T.C.C., P.B. and B.C.; formal analysis, T.C.C.;
writing—original draft preparation, T.C.C.; writing—review and editing, T.C.C., P.B. and B.C.;
supervision, P.B. and B.C.; funding acquisition, P.B. and B.C. All authors have read and agreed to the
published version of the manuscript.
Funding: This research was funded by the European Union’s Horizon 2020 research and innovation
program under grant agreement No 817923, and by institutional grants from INRAE.
Institutional Review Board Statement: All animals were handled in strict accordance with good
animal practice as defined by the European Union guidelines for the handling of laboratory animals
(http://ec.europa.eu/environment/chemicals/lab_animals/home_en.htm (accessed on 28 January
2021)). The fish facilities at INRAE, Jouy en Josas, were approved by the Direction of the Veterinary
Services of Versailles (authorization B78-720). Experimental protocols were approved by the INRAE
institutional ethical committee “Comethea” (permit license number #15-60).
Informed Consent Statement: Not applicable.
Data Availability Statement: All data reported in this work are shown in Figures, Tables and
Supplementary Material.
Acknowledgments: We would like to thank the staff of the fish facilities at INRAE, Jouy-en-Josas,
for great technical support.
Conflicts of Interest: The authors declare no conflict of interest.
References
1. Nehyba, J.; Hrdličková, R.; Bose, H.R. Dynamic Evolution of Immune System Regulators: The History of the Interferon Regulatory
Factor Family. Mol. Biol. Evol. 2009, 26, 2539–2550. [CrossRef]
2. Yanai, H.; Negishi, H.; Taniguchi, T. The IRF Family of Transcription Factors Inception, Impact and Implications in Oncogenesis.
OncoImmunology 2012, 1376–1386. [CrossRef] [PubMed]
3. Chen, W.; Royer William, E.J.E. Structural Insights into Interferon Regulatory Factor Activation. Cell. Signal. 2010, 22, 883–887.
[CrossRef] [PubMed]
4. Ikushima, H.; Negishi, H.; Taniguchi, T. The IRF Family Transcription Factors at the Interface of Innate and Adaptive Immune
Responses. Cold Spring Harb. Symp. Quant. Biol. 2013, 78, 105–116. [CrossRef] [PubMed]
5. Jefferies, C.A. Regulating IRFs in IFN Driven Disease. In Frontiers in Immunology; Frontiers Media: Lausanne, Switzerland, 2019;
p. 325. [CrossRef]
6. Antonczyk, A.; Krist, B.; Sajek, M.; Michalska, A.; Piaszyk-Borychowska, A.; Plens-Galaska, M.; Wesoly, J.; Bluyssen, H.A.R.
Direct Inhibition of IRF-Dependent Transcriptional Regulatory Mechanisms Associated with Disease. Front. Immunol. 2019, 10,
1176. [CrossRef]Genes 2021, 12, 238 15 of 17
7. Honda, K.; Takaoka, A.; Taniguchi, T. Type I Inteferon Gene Induction by the Interferon Regulatory Factor Family of Transcription
Factors. Immunity 2006, 25, 349–360. [CrossRef]
8. Paun, A.; Pitha, P.M. The IRF Family, Revisited. Biochimie 2007, 89, 744–753. [CrossRef]
9. Eguchi, J.; Yan, Q.W.; Schones, D.E.; Kamal, M.; Hsu, C.H.; Zhang, M.Q.; Crawford, G.E.; Rosen, E.D. Interferon Regulatory
Factors Are Transcriptional Regulators of Adipogenesis. Cell Metab. 2008, 7, 86–94. [CrossRef]
10. Gabriele, L.; Ozato, K. The Role of the Interferon Regulatory Factor (IRF) Family in Dendritic Cell Development and Function.
Cytokine Growth Factor Rev. 2007, 18, 503–510. [CrossRef]
11. Zhang, R.; Chen, K.; Peng, L.; Xiong, H. Regulation of T Helper Cell Differentiation by Interferon Regulatory Factor Family
Members. Immunol. Res. 2012, 54, 169–176. [CrossRef]
12. Chistiakov, D.A.; Myasoedova, V.A.; Revin, V.V.; Orekhov, A.N.; Bobryshev, Y.V. The Impact of Interferon-Regulatory Factors to
Macrophage Differentiation and Polarization into M1 and M2. Immunobiology 2018, 223, 101–111. [CrossRef]
13. Medzhitov, R.; Janeway, C. The Toll Receptor Family and Microbial Recognition. Trends Microbiol. 2000, 8, 452–456. [CrossRef]
14. Yoneyama, M.; Kikuchi, M.; Natsukawa, T.; Shinobu, N.; Imaizumi, T.; Miyagishi, M.; Taira, K.; Akira, S.; Fujita, T. The RNA
Helicase RIG-I Has an Essential Function in Double-Stranded RNA-Induced Innate Antiviral Responses. Nat. Immunol. 2004, 5,
730–737. [CrossRef] [PubMed]
15. Langer, J.A.; Cutrone, E.C.; Kotenko, S. The Class II Cytokine Receptor (CRF2) Family: Overview and Patterns of Receptor-Ligand
Interactions. Cytokine Growth Factor Rev. 2004, 15, 33–48. [CrossRef]
16. Pestka, S.; Krause, C.D.; Walter, M.R. Interferons, Interferon-like Cytokines, and Their Receptors. Immunol. Rev. Immunol. Rev. Dec.
2004, 202, 8–32. [CrossRef]
17. Levraud, J.-P.; Boudinot, P.; Colin, I.; Benmansour, A.; Peyrieras, N.; Herbomel, P.; Lutfalla, G. Identification of the Zebrafish IFN
Receptor: Implications for the Origin of the Vertebrate IFN System. J. Immunol. 2007, 178, 4385–4394. [CrossRef] [PubMed]
18. Takeuchi, O.; Akira, S. Innate Immunity to Virus Infection. Immunol. Rev. 2009, 227, 75–86. [CrossRef] [PubMed]
19. Mogensen, T.H. IRF and STAT Transcription Factors—From Basic Biology to Roles in Infection, Protective Immunity, and Primary
Immunodeficiencies. Front. Immunol. 2019, 9, 3047. [CrossRef] [PubMed]
20. Darnell, J.E.; Kerr, I.M.; Stark, G.R. Jak-STAT Pathways and Transcriptional Activation in Response to IFNs and Other Extracellular
Signaling Proteins. Science 1994, 264, 1415–1421. [CrossRef] [PubMed]
21. Bluyssen, H.A.R.; Durbin, J.E.; Levy, D.E. ISGF3γ P48, a Specificity Switch for Interferon Activated Transcription Factors.
Cytokine Growth Factor Rev. 1996, 7, 11–17. [CrossRef]
22. Taniguchi, T.; Ogasawara, K.; Takaoka, A.; Tanaka, N. IRF Family of Transcription Factors as Regulators of Host Defense.
Annu. Rev. Immunol. 2001, 19, 623–655. [CrossRef] [PubMed]
23. Collet, B. Innate Immune Responses of Salmonid Fish to Viral Infections. Dev. Comp. Immunol. 2014, 43, 160–173. [CrossRef] [PubMed]
24. Huang, B.; Qi, Z.T.; Xu, Z.; Nie, P. Global Characterization of Interferon Regulatory Factor (IRF) Genes in Vertebrates: Glimpse of
the Diversification in Evolution. BMC Immunol. 2010, 5, 11–22. [CrossRef] [PubMed]
25. Lien, S.; Koop, B.F.; Sandve, S.R.; Miller, J.R.; Kent, M.P.; Nome, T.; Hvidsten, T.R.; Leong, J.S.; Minkley, D.R.; Zimin, A.; et al. The
Atlantic Salmon Genome Provides Insights into Rediploidization. Nature 2016, 533, 200–205. [CrossRef]
26. Bergan, V.; Kileng, Ø.; Sun, B.; Robertsen, B. Regulation and Function of Interferon Regulatory Factors of Atlantic Salmon.
Mol. Immunol. 2010, 47, 2005–2014. [CrossRef]
27. Xu, Q.; Jiang, Y.; Wangkahart, E.; Zou, J.; Chang, M.; Yang, D.; Secombes, C.J.; Nie, P.; Wang, T. Sequence and Expression Analysis
of Interferon Regulatory Factor 10 (IRF10) in Three Diverse Teleost Fish Reveals Its Role in Antiviral Defense. PLoS ONE 2016, 11,
e0147181. [CrossRef]
28. Macqueen, D.J.; Johnston, I.A. A Well-Constrained Estimate for the Timing of the Salmonid Whole Genome Duplication Reveals
Major Decoupling from Species Diversification. Proc. R. Soc. B Biol. Sci. 2014, 281, 1778. [CrossRef] [PubMed]
29. Kumar, S.; Stecher, G.; Li, M.; Knyaz, C.; Tamura, K. MEGA X: Molecular Evolutionary Genetics Analysis across Computing
Platforms. Mol. Biol. Evol. 2018, 35, 1547–1549. [CrossRef]
30. Hernández, P.P.; Strzelecka, P.M.; Athanasiadis, E.I.; Hall, D.; Robalo, A.F.; Collins, C.M.; Boudinot, P.; Levraud, J.P.; Cvejic, A.
Single-Cell Transcriptional Analysis Reveals ILC-like Cells in Zebrafish. Sci. Immunol. 2018, 3, eaau5265. [CrossRef]
31. Yano, A.; Guyomard, R.; Nicol, B.; Jouanno, E.; Quillet, E.; Klopp, C.; Cabau, C.; Bouchez, O.; Fostier, A.; Guiguen, Y. An
Immune-Related Gene Evolved into the Master Sex-Determining Gene in Rainbow Trout, Oncorhynchus Mykiss. Curr. Biol. 2012,
22, 1423–1428. [CrossRef]
32. Inkpen, S.M.; Solbakken, M.H.; Jentoft, S.; Eslamloo, K.; Rise, M.L. Full Characterization and Transcript Expression Profiling of
the Interferon Regulatory Factor (IRF) Gene Family in Atlantic Cod (Gadus Morhua). Dev. Comp. Immunol. 2019, 98, 166–180.
[CrossRef] [PubMed]
33. Zhu, Y.; Qi, C.; Shan, S.; Zhang, F.; Li, H.; An, L.; Yang, G. Characterization of Common Carp (Cyprinus Carpio L.) Interferon Regulatory
Factor 5 (IRF5) and Its Expression in Response to Viral and Bacterial Challenges. BMC Vet. Res 2016, 12, 127. [CrossRef] [PubMed]
34. Castro, R.; Takizawa, F.; Chaara, W.; Lunazzi, A.; Dang, T.H.; Koellner, B.; Quillet, E.; Six, A.; Fischer, U.; Boudinot, P. Contrasted
TCRβ Diversity of CD8+ and CD8− T Cells in Rainbow Trout. PLoS ONE 2013, 8, e60175. [CrossRef]
35. Langevin, C.; Blanco, M.; Martin, S.A.M.; Jouneau, L.; Bernardet, J.-F.; Houel, A.; Lunazzi, A.; Duchaud, E.; Michel, C.; Quillet, E.;
et al. Transcriptional Responses of Resistant and Susceptible Fish Clones to the Bacterial Pathogen Flavobacterium Psychrophilum.
PLoS ONE 2012, 7, e39126. [CrossRef]You can also read