ABCE1 Regulates RNase L-Induced Autophagy during Viral Infections - MDPI

Page created by Ricardo Parks
 
CONTINUE READING
ABCE1 Regulates RNase L-Induced Autophagy during Viral Infections - MDPI
viruses
Article
ABCE1 Regulates RNase L-Induced Autophagy during Viral
Infections
Barkha Ramnani, Praveen Manivannan, Sarah Jaggernauth and Krishnamurthy Malathi *

                                          Department of Biological Sciences, University of Toledo, 2801 West Bancroft Street, Toledo, OH 43606, USA;
                                          Barkha.Ramnani@rockets.utoledo.edu (B.R.); Praveen.Manivannan@rockets.utoledo.edu (P.M.);
                                          Sarah.Jaggernauth@rockets.utoledo.edu (S.J.)
                                          * Correspondence: Malathi.Krishnamurthy@utoledo.edu

                                          Abstract: Host response to a viral infection includes the production of type I interferon (IFN) and the
                                          induction of interferon-stimulated genes that have broad antiviral effects. One of the key antiviral
                                          effectors is the IFN-inducible oligoadenylate synthetase/ribonuclease L (OAS/RNase L) pathway,
                                          which is activated by double-stranded RNA to synthesize unique oligoadenylates, 2-5A, to activate
                                          RNase L. RNase L exerts an antiviral effect by cleaving diverse RNA substrates, limiting viral
                                          replication; many viruses have evolved mechanisms to counteract the OAS/RNase L pathway. Here,
                                          we show that the ATP-binding cassette E1 (ABCE1) transporter, identified as an inhibitor of RNase
                                          L, regulates RNase L activity and RNase L-induced autophagy during viral infections. ABCE1
                                          knockdown cells show increased RNase L activity when activated by 2-5A. Compared to parental
                                          cells, the autophagy-inducing activity of RNase L in ABCE1-depleted cells is enhanced with early
                                          onset. RNase L activation in ABCE1-depleted cells inhibits cellular proliferation and sensitizes
                                          cells to apoptosis. Increased activity of caspase-3 causes premature cleavage of autophagy protein,
                                Beclin-1, promoting a switch from autophagy to apoptosis. ABCE1 regulates autophagy during
                                   EMCV infection, and enhanced autophagy in ABCE1 knockdown cells promotes EMCV replication.
Citation: Ramnani, B.; Manivannan,        We identify ABCE1 as a host protein that inhibits the OAS/RNase L pathway by regulating RNase L
P.; Jaggernauth, S.; Malathi, K. ABCE1    activity, potentially affecting antiviral effects.
Regulates RNase L-Induced
Autophagy during Viral Infections.        Keywords: RNase L; ABCE1; RLI; autophagy; interferon; apoptosis
Viruses 2021, 13, 315. https://doi.org/
10.3390/v13020315

Academic Editor: Craig McCormick          1. Introduction
                                               Degrading viral and cellular RNAs required for viral replication is an evolutionar-
Received: 22 January 2021
Accepted: 16 February 2021
                                          ily conserved antiviral mechanism. In higher vertebrates, this process is regulated by
Published: 18 February 2021
                                          interferon (IFN), produced during a viral infection through the activation of the ubiqui-
                                          tous cellular latent endoribonuclease, ribonuclease L (RNase L). The 20 ,50 -oligoadenylate
Publisher’s Note: MDPI stays neutral
                                          synthetase (OAS)/RNase L system is an innate immune pathway that responds to the
with regard to jurisdictional claims in
                                          double-stranded RNAs (dsRNAs) that serve as pathogen-associated molecular patterns
published maps and institutional affil-   (PAMPs) to induce the degradation of viral and cellular RNAs, thereby blocking the
iations.                                  viral infection [1–3]. Type I IFN, produced and secreted by a virus-infected cell signal
                                          through the type I IFN receptor, activates JAK-STAT signaling and induces the expression
                                          of interferon-stimulated genes (ISGs), including oligoadenylate synthetases (OAS), that
                                          together establish the antiviral state [4,5]. OAS1–3 isoforms are expressed at varying levels
Copyright: © 2021 by the authors.
                                          in different cell types, and on activation by dsRNA PAMPs, certain OAS proteins produce
Licensee MDPI, Basel, Switzerland.
                                          2-5A from cellular ATP [6–8]. 2-5A is a unique ligand that binds monomeric and latent
This article is an open access article
                                          RNase L with high affinity, causing RNase L dimerization and activation. Active RNase
distributed under the terms and           L cleaves diverse single-stranded RNA substrates, including viral genomes and cellular
conditions of the Creative Commons        RNAs, directly impacting protein synthesis and limiting viral replication [3]. Activation of
Attribution (CC BY) license (https://     RNase L, through the generation of dsRNA cleavage products, amplifies IFN production,
creativecommons.org/licenses/by/          activates inflammasome, leads to autophagy, and promotes a switch from autophagy to
4.0/).                                    apoptosis, affecting viral replication in cells [9–13].

Viruses 2021, 13, 315. https://doi.org/10.3390/v13020315                                                      https://www.mdpi.com/journal/viruses
ABCE1 Regulates RNase L-Induced Autophagy during Viral Infections - MDPI
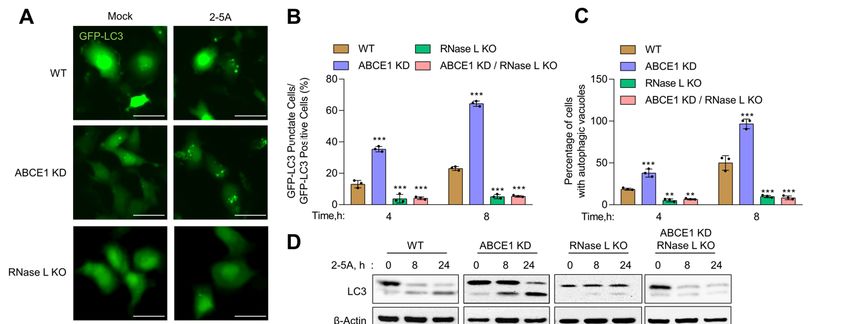
Viruses 2021, 13, 315                                                                                         2 of 16

                              Autophagy may function as an antiviral mechanism by activating signaling pathways
                        to promote the elimination of viruses, or it may provide a platform to enhance viral repli-
                        cation [14]. Accumulation of dsRNA PAMPs during a viral infection and the expression
                        of antiviral proteins induce apoptosis in virus-infected cells. Both autophagy and apop-
                        tosis share regulatory molecules, and cross-talk between these two pathways dictates the
                        outcome of the viral infection [15,16]. Our previous studies show that the activation of
                        RNase L by 2-5A induces autophagy and the small dsRNAs generated by RNase L enzyme
                        activity promote a switch from autophagy to apoptosis by the caspase-mediated cleavage
                        of the key autophagy protein, Beclin-1. The cleavage of Beclin-1 results in the termination
                        of autophagy, and the cleaved Beclin-1 fragment translocates to the mitochondria and
                        induces apoptosis [12,13].
                              The OAS/RNase L pathway exerts an antiviral effect against a wide range of viruses.
                        Consequently, viruses have evolved mechanisms to counteract the antiviral activity of the
                        OAS/RNase L pathway by antagonizing or inhibiting the activation of RNase L [17,18].
                        The evasion strategies target all steps of the OAS/RNase L pathway. The influenza A virus
                        NS1 protein, vaccinia virus E3L, and the herpes simplex virus type 1 US11 protein sequester
                        dsRNA, thereby preventing the activation of OAS and 2-5A synthesis [19–21]. DNA viruses
                        like vaccinia virus, herpes simplex virus, and SV40 produce inactive or inhibitory 2-5A-like
                        molecules that are unable to activate RNase L [22–24]. Theiler’s murine encephalomyelitis
                        virus (TMEV) encodes an L* protein that directly binds to the ankyrin repeat domain of
                        RNase L, inhibiting the binding of 2-5A to RNase L [25,26]. A highly structured region
                        of the poliovirus genomic RNA acts as a cleavage-resistant substrate for RNase L and
                        competitively inhibits RNase L [27]. Murine hepatitis virus (MHV) ns2, Middle East
                        respiratory syndrome coronavirus (MERS-CoV) NS4b, and rotaviruses (RV) VP3 encode
                        for phosphodiesterases, which degrade 2-5A and thus prevent RNase L activation [28–31].
                        Host cells also express phosphodiesterases PDE12, ENPP1, and AKAP7, which can degrade
                        and regulate the turnover of 2-5A in cells [32–37]. In addition, ATP-binding cassette E1
                        (ABCE1), also known as RNase L inhibitor (RLI), was identified as an RNase L-interacting
                        protein that modulates RNase L activity by preventing 2-5A binding [38].
                              ABCE1 (RNase L inhibitor (RLI)) is a member of the superfamily of ABC transporters
                        but lacks a membrane-spanning domain necessary for transporter function. RLI was
                        initially identified as a negative regulator of RNase L by directly binding to RNase L
                        and inhibiting the binding of 2-5A [38,39]. In contrast, a recent study showed that the
                        interaction of ABCE1 with RNase L accelerates dimerization and acts as a positive regulator
                        of exogenous RNA decay [40]. ABCE1 is induced by EMCV and HIV and may serve
                        as a mechanism to evade the antiviral effects of RNase L [41,42]. In addition, ABCE1
                        interacts with the HIV gag protein to mediate capsid assembly [43,44]. A genome-wide
                        siRNA screen identified ABCE1 as an essential host factor that is required for the efficient
                        translation of measles and mumps viral proteins. In that context, ABCE1 knockdown
                        only inhibited the translation of measles virus mRNAs and not that of cellular RNAs,
                        demonstrating an important role for ABCE1 in measles virus pathogenesis [45]. ABCE1
                        is conserved evolutionarily from lower eukaryotes, while RNase L function is restricted
                        to higher vertebrates, suggesting additional cellular roles of ABCE1. Accordingly, studies
                        have shown the role of ABCE1 in the regulation of translation, ribosome recycling, and
                        homeostasis by interacting with translation initiation and release factors and ribosomal
                        subunits [46–51]. ABCE1 dissociates ribosomes during translation termination and mRNA
                        surveillance on stalled ribosomes [49,52]. Knockdown of ABCE1 inhibits proliferation and
                        migration and induces apoptosis in small cell lung cancer, breast cancer, and esophageal
                        cancer cells [53–55]. Here, we show that ABCE1 inhibits RNase L activity; cells with reduced
                        ABCE1 levels transfected with 2-5A show increased RNase L activity that corresponds
                        with early onset of autophagy. Enhanced RNase L activity in ABCE1 knockdown cells
                        inhibits proliferation and induces apoptosis by the caspase-3-mediated cleavage of Beclin-1,
                        terminating autophagy. Furthermore, ABCE1 promotes EMCV pathogenesis by regulating
Viruses 2021, 13, 315                                                                                          3 of 16

                        autophagy. These studies identify a novel role of ABCE1 in regulating RNase L-induced
                        autophagy during viral infections.

                        2. Materials and Methods
                        2.1. Chemicals, Reagents, and Antibodies
                             The chemicals, unless indicated otherwise, were from Sigma-Aldrich (St. Louis, MO,
                        USA). The antibodies to LC3, SQSTM1/p62, cleaved PARP, cleaved caspase-3, β-actin, and
                        Beclin-1 were purchased from Cell Signaling Technology (Danvers, MA, USA); the ABCE1
                        (RLI) antibody was purchased from Abcam (Cambridge, MA, USA), and 3D Pol was pur-
                        chased from Santa Cruz Biotechnology (Santa Cruz, Dallas, TX, USA). Anti-mouse IgG
                        and anti-rabbit IgG HRP-linked secondary antibodies were from Cell Signaling. The ECL
                        reagents were from Boston Bioproducts (Ashland, MA, USA) and Bio-Rad Labs (Hercules,
                        CA, USA). Puromycin was purchased from Thermo Fisher Scientific (Waltham, MA, USA)
                        and used as described. Bafilomycin A1 was from Enzo Life Sciences (Farmingdale, NY,
                        USA), and 3-methyladenine was from Sigma-Aldrich (St. Louis, MO, USA). The GFP-LC3
                        plasmid was provided by Isei Tanida (via Addgene, Watertown, MA, USA) [56]. The
                        encephalomyocarditis virus (EMCV K strain) and the monoclonal antibody to human
                        RNase L were a kind gift from Robert Silverman (Cleveland Clinic, Cleveland, OH, USA).
                        Poly I:C was purchased from Calbiochem (San Diego, CA, USA). 2-5A (p3 (A20 p)n A, where
                        n = 1 to >3) was prepared enzymatically from ATP and recombinant 2-5A synthetase (a
                        generous gift from Rune Hartmann, University of Aarhus, Aarhus, Denmark) as described
                        previously [57]. Briefly, poly I:C-agarose was bound with recombinant OAS1 and incu-
                        bated with a buffer containing ATP for 20 h at 37 ◦ C. The reaction mix was clarified by
                        centrifugation and passed through a 3 kDa centriprep filter (Millipore Sigma, MO, USA),
                        and the 2-5A preparation obtained was applied to cells complexed with Lipofectamine
                        2000 (Invitrogen, Carlsbad, CA, USA) [58].

                        2.2. Cell Culture and Transfections
                              The human fibrosarcoma cell line HT1080 (a gift from Ganes Sen, Cleveland Clinic,
                        Cleveland, OH, USA), RNase L KO, ABCE1 KD, ABCE1 KD/RNase L KO, and the mouse
                        fibroblast cell line L929 (a gift from Douglas Leaman, Wright State University) were cultured
                        in Dulbecco’s modified minimal essential medium with 10% fetal bovine serum (Sigma-
                        Aldrich, St. Louis, MO, USA), 100 µg/mL penicillin/streptomycin, 2 mM L-glutamine,
                        and nonessential amino acids. RNase L KO cells were generated with CRISPR/Cas9 gene
                        editing as described previously [59]. The cells were maintained in 95% air, 5% CO2 at 37 ◦ C.
                        Transfection of 2-5A (10 µM) or poly I:C (2 µg/mL) was performed using Lipofectamine
                        2000 (Invitrogen, Carlsbad, CA, USA) according to the manufacturer’s protocol. Briefly,
                        the cells were plated one day before transfection so that the cells were 80–90% confluent at
                        the time of transfection. Poly I:C or 2-5A was diluted into a serum-free medium and then
                        mixed with Lipofectamine 2000 reagent for 20 min before being added to cells in growth
                        media and incubated for indicated times.

                        2.3. Generation of ABCE1 Knockdown Cells
                             ABCE1 (RLI) was knocked down in HT1080 WT by transfecting pSUPER plasmid
                        with short hairpin RNA homologous to ABCE1 (RLI) along with pBabe-puro as previously
                        described [60]. Individual clones were generated by limiting dilution in a puromycin
                        (1 µg/mL) containing medium, and gene knockdown was verified by immunoblot analysis
                        using ABCE1 antibodies and normalized to β-actin levels for comparison. Two indepen-
                        dent clones (clone 1 and clone 2) were used to determine RNase L activity, induction of
                        autophagy, and cell viability assays to rule out clone-specific artifacts. The data obtained
                        with clone 2 compared to clone 1 are shown in Figure S1. ABCE1 knockdown cells from
                        early passages were used in this study as later passages showed reduced proliferation
                        and viability, as observed in other studies [45]. To generate ABCE1 KD/RNase L KO cells,
                        RNase L KO CRISPR/Cas9 gene edited cells were co-transfected with ABCE1 short hairpin
Viruses 2021, 13, 315                                                                                         4 of 16

                        RNA (shRNA) and pEGFP plasmid. GFP-positive individual clones obtained by limiting
                        dilution were verified by immunoblot analysis as described above and used.

                        2.4. Measuring RNase L Activity in Intact Cells
                             Cells were transfected with poly I:C (2 µg/mL) or 2-5A (10 µM) using Lipofectamine
                        2000 reagent and after 6 h, total RNA was isolated using Trizol reagent (Invitrogen, Thermo
                        Fisher Scientific, Waltham, MA, USA). Total RNA was resolved on RNA chips and ana-
                        lyzed with Bioanalyzer 2100 (Agilent Technologies, Santa Clara, CA, USA) as described
                        previously [12]. RNase L activity was measured as the cleavage of total RNA by estimating
                        the integrity by the RNA integrity number (RIN) [61].

                        2.5. Quantification of Autophagy
                              Cells were transfected with GFP-LC3 and 24 h later with 2-5A (1 0µM) using Lipofec-
                        tamine 2000 and imaged at indicated times using an Olympus IX81 inverted fluorescence
                        microscope. Cytoplasmic GFP-LC3 puncta (>10 puncta/cell) were considered autophagic
                        and manually counted for at least 100 randomly selected cells per preparation from three
                        independent experiments. Autophagy was quantified as a percent of GFP-LC3-positive
                        cells showing puncta (>10 puncta/cell). The kinetics of the induction of autophagy in
                        live cells was determined using the CYTO-ID autophagy detection kit (Enzo Life Sciences,
                        Farmingdale, NY, USA) under a confocal microscope. Briefly, cells (1 × 10⁵ ) were seeded
                        on coverslips in a 12-well plate and transfected with 2-5A (10 µM) using Lipofectamine
                        2000 reagent. The Cyto-ID Green Autophagy Detection Reagent, which is excitable at
                        488 nm in autophagic vacuoles produced during autophagy, was added and imaged at
                        indicated times. The percent of cells showing autophagic vacuoles from three random
                        fields was counted. A minimum of 100 cells per preparation were quantified in three
                        independent experiments.

                        2.6. Cell Viability and Caspase 3/7 Assays
                              The viability of cells was determined using the colorimetric CellTiter 96 Aqueous Cell
                        Proliferation Assay (Promega, Madison, WI, USA). Briefly, cells (8 × 10³ ) were seeded into
                        96-well plates and transfected with 2-5A (10 µM). At indicated times, 20 µL of tetrazolium
                        salt (MTS reagent) was added and incubated at 37 ◦ C. Absorbance was measured at 490 nm
                        with a 96-well plate reader (model Spectra Max iD5; Molecular Devices, Menlo Park, CA,
                        USA). Cell viability was normalized against mock-treated cells. The percent of viable cells
                        was determined by staining in a 0.4% trypan blue solution (Life Technologies, Carlsbad,
                        CA, USA) and estimating viable cells that exclude dye uptake using a hemocytometer and
                        normalized to mock-treated cells. For caspase 3/7 assay, cells were grown in black-walled
                        96-well plates with transparent bottoms (Costar) and transfected with 2-5A (10 µM) using
                        Lipofectamine 2000. At indicated times, caspase3/7 activity in lysates was measured using
                        the ApoONE homogenous caspase-3 and -7 assay kit (Promega, Madison, WI, USA) and
                        normalized to control mock-treated cells. Experiments were performed in triplicate and
                        shown as mean ± SD.

                        2.7. Cell Death Assays
                             Cell death was analyzed in real time using dual dyes and an IncuCyte S3 Live-Cell
                        imaging system (Essen BioScience, Ann Arbor, MI, USA). Cells (8 × 10³ ) were seeded into
                        a 96-well plate and transfected with 2-5A (10 µM) using Lipofectamine 2000 reagent. Cells
                        were incubated with 250 nM Sytox-Green cell-impermeable nucleic acid dye (ThermoFisher
                        Scientific, Waltham, MA, USA) that indicates dead cells and 250 nM of SytoTM 60-Red cell-
                        permeable dye (ThermoFisher scientific, Waltham, MA, USA), which quantifies the total
                        number of cells present in each field, and images were obtained in real time as indicated.
                        Cell death was quantified as the percent of Sytox-Green-positive dead cells normalized
                        to the total number of cells that were stained Sytox-Red positive at each time point using
Viruses 2021, 13, 315                                                                                              5 of 16

                        IncuCyte S3 software. Results shown are representative of four values per well performed
                        in triplicate from three experimental samples and shown as mean ± SD.

                        2.8. Immunoblotting
                              Cells were washed in ice-cold PBS and lysed in an NP-40 lysis buffer containing 0.5%
                        NP-40, 90 mM KCl, 5 mM magnesium acetate, 20 mM Tris (pH 7.5), 5 mM β-mercaptoethanol,
                        0.1 M phenylmethylsulfonyl fluoride (PMSF), 0.2 mM sodium orthovanadate, 50 mM NaF,
                        10 mM glycerophosphate, and a protease inhibitor (Roche Diagnostics). The lysates were
                        clarified by centrifugation at 10,000× g (4 ◦ C for 20 min). Proteins (15–60 µg per lane) were
                        separated in polyacrylamide gels containing SDS and transferred to a nitrocellulose membrane
                        (Bio-Rad, Hercules, CA, USA) and probed with different primary antibodies according to
                        the manufacturer’s protocols. Membranes were washed and incubated with goat anti-
                        mouse or goat anti-rabbit antibody tagged with horseradish peroxidase (Cell Signaling,
                        Danvers, MA, USA) for 2 h. Immunoreactive bands were visualized using enhanced
                        chemiluminescence reagents (Boston BioProducts, Ashland, MA, USA; Bio-Rad, Hercules,
                        CA, USA). For determining the ratios of LC3-II/β-actin, P62/β-actin, and 3D Pol/β-actin,
                        the intensity of each band was determined using Image J software (National Institutes of
                        Health, Bethesda, MD, USA) and their relative intensities were calculated by normalizing
                        to β-actin. Images were processed using Adobe Photoshop CS4 (Adobe, San Jose, CA,
                        USA). In some instances, nonspecific lanes were cropped to generate the images and the
                        boundaries are indicated in representative figures.

                        2.9. Virus Infections and Plaque Assays
                              The cells were plated into 6-well plates, and the next day, the cells were washed twice
                        in PBS and infected with EMCV (strain k) at MOI = 1.0. After 1 h, the virus was removed
                        and the cells were washed with PBS and replaced with a complete growth medium. In
                        experiments with inhibitors, the cells were pretreated with 3-methyladenine (5 mM) or
                        bafilomycin A1 (100 nM) for 1 h and infected with EMCV, and then fresh complete media
                        with 10% FBS was added. At indicated times post infection, EMCV containing supernatants
                        and cell pellets were harvested for virus titration. Serial dilution of supernatants or clarified
                        cell lysates containing intracellular virus were added to the confluent monolayer of L929
                        cells in 12-well plates. The plates were incubated for 1 h at 37 ◦ C. The cells were washed
                        with PBS and overlaid with DMEM containing 0.5% carboxymethylcellulose and incubated
                        for 24 h. The cells were fixed with 10% formaldehyde, and plaques were stained using
                        0.1% crystal violet and counted. The assays were performed in triplicate, and the fold
                        change in virus titers was determined from three independent experiments and shown as
                        mean ± SD. The expression of the viral antigen was determined on Western blots using
                        the 3D Pol antibody (Santa Cruz Biotechnology, Dallas, TX, USA).

                        2.10. Statistical Analysis
                             All values are presented as mean ± SD and are representative of at least three inde-
                        pendent experiments. Two-way ANOVA (or one-way ANOVA for a single time point) was
                        used for determining statistical significance between groups, using Prism 8 (GraphPad)
                        software, and p values of
knockdown stable cell lines were generated in HT1080 cells by transfecting shRNA-tar-
                      geting ABCE1 and stable clones with greater than 90% reduced expression were screened
                      and used in this study (Figure 1A). Two independent clones were evaluated for effect on
                      RNase L enzyme activity (Figure 1 and Figure S1A). As reported in other studies, pro-
Viruses 2021, 13, 315                                                                                                                  6 of 16
                      longed ABCE1 knockdown caused reduced cell proliferation and early passage cells were
                      expanded and used [45]. The effect of ABCE1 on RNase L enzyme activity was determined
                      by transfecting 2-5A, a unique ligand and activator of RNase L, and rRNA cleavage char-
                                    used [45].
                      acteristic of RNase       The effect
                                             L activity wasof ABCE1     on RNase
                                                              quantitated     and Lanalyzed
                                                                                     enzyme activity
                                                                                                 on RNA   was  determined
                                                                                                            chips.  Controlbycells
                                                                                                                                transfecting
                      produced 8.4% rRNA cleavage, while ABCE1 knockdown (ABCE1 KD) had 3-fold in-of RNase
                                    2-5A,  a unique  ligand  and   activator of RNase    L, and  rRNA    cleavage  characteristic
                      creased rRNA  L activity
                                       cleavage was quantitated
                                                  (25%).           and analyzed
                                                          Transfecting             on RNA
                                                                           cells with         chips.dsRNA
                                                                                        synthetic     Control (poly
                                                                                                               cells produced
                                                                                                                      I:C), which8.4% rRNA
                      binds oligoadenylate synthetase (OAS) to produce 2-5A from cellular ATP, producedcleavage
                                    cleavage,   while  ABCE1     knockdown      (ABCE1      KD)   had  3-fold  increased   rRNA
                                    (25%). Transfecting cells with synthetic dsRNA (poly I:C), which binds oligoadenylate
                      22.4% rRNA cleavage in WT cells compared to 59% in ABCE1 KD cells (Figure 1B,C). As
                                    synthetase (OAS) to produce 2-5A from cellular ATP, produced 22.4% rRNA cleavage in
                      expected, RNase L KO cells generated by CRISPR/Cas9 technology showed no cleavage
                                    WT cells compared to 59% in ABCE1 KD cells (Figure 1B,C). As expected, RNase L KO
                      of rRNA with      2-5A or poly I:C transfection [58,59]. To further test that the impact of
                                    cells generated by CRISPR/Cas9 technology showed no cleavage of rRNA with 2-5A or
                      ABCE1 on RNasepoly I:CL transfection
                                               activity was    mediated
                                                            [58,59].        by RNase
                                                                      To further          L, the
                                                                                  test that   weimpact
                                                                                                   knocked     down on
                                                                                                           of ABCE1    ABCE1
                                                                                                                          RNasein  L activity
                      RNase L KO was cellsmediated
                                           using shRNA
                                                     by RNase L, we knocked down ABCE1 in RNase L KO cellstrans-
                                                           and   monitored     rRNA     cleavage     by 2-5A   or poly  I:C  using shRNA
                      fection (Figure
                                    and1A–C).    No rRNA
                                          monitored   rRNA cleavage
                                                              cleavage bywas    observed
                                                                             2-5A  or poly inI:Cthe   ABCE1 KD/RNase
                                                                                                 transfection                L KO
                                                                                                                (Figure 1A–C).    No rRNA
                      cells, indicating  that the
                                    cleavage    waseffect  of ABCE1
                                                    observed             was mediated
                                                                in the ABCE1     KD/RNase    by Lregulating    RNase L that
                                                                                                   KO cells, indicating   activity
                                                                                                                               the effect of
                      (Figure 1B,C).   Thesewas
                                    ABCE1      results suggest
                                                  mediated        that ABCE1
                                                              by regulating      regulates
                                                                               RNase           RNase
                                                                                       L activity       L enzyme
                                                                                                    (Figure          activity
                                                                                                             1B,C). These      and suggest
                                                                                                                            results
                                    that ABCE1
                      cells with reduced   levels regulates
                                                   of ABCE1RNase       L enzyme activity
                                                                show enhanced       RNase Land      cells with
                                                                                                activity  in thereduced
                                                                                                                  presencelevels  of ABCE1
                                                                                                                             of the
                      2-5A ligand. show enhanced RNase L activity in the presence of the 2-5A ligand.

     Figure 1. Increased
                  Figureribonuclease
                            1. IncreasedLribonuclease
                                             (RNase L) activity  in cells
                                                           L (RNase    L) with  reduced
                                                                          activity        ATP-binding
                                                                                    in cells             cassette
                                                                                              with reduced        E1 (ABCE1)cassette
                                                                                                              ATP-binding     proteinE1levels.
     (A) Knockdown     of ABCE1
                  (ABCE1)          levelslevels.
                                protein    using short  hairpin RNA of
                                                  (A) Knockdown        (shRNA)
                                                                          ABCE1   in levels
                                                                                     HT1080using
                                                                                              WT cells   or CRISPR/Cas9
                                                                                                     short  hairpin RNARNase
                                                                                                                           (shRNA)L KOincells
     was verified HT1080
                   in cell lysates  by immunoblotting
                             WT cells    or CRISPR/Cas9using RNasespecific
                                                                     L KOantibodies.      (B) WT,in
                                                                             cells was verified     ABCE1    KD, RNase
                                                                                                      cell lysates       L KO, and ABCE1
                                                                                                                   by immunoblotting
     KD/RNase LusingKO cells     wereantibodies.
                          specific     transfected(B)
                                                    with
                                                      WT, 2-5A  (10 µM)
                                                            ABCE1     KD,or   2 µg/mL
                                                                            RNase   L KO, of and
                                                                                             polyABCE1
                                                                                                   I:C for KD/RNase
                                                                                                           6 h, and theLRNase   L-mediated
                                                                                                                         KO cells  were
                  transfected
     cleavage of rRNA     (arrows)with
                                     was 2-5A  (10 μM)
                                           analyzed      or 2 μg/mL
                                                     on RNA             of poly
                                                               chips using       I:C for
                                                                              Agilent     6 h, and the
                                                                                       Bioanalyzer        RNase
                                                                                                      2100.       L-mediated
                                                                                                            (C) The            cleavage
                                                                                                                     cleavage of rRNA was
                  of rRNA
     quantitated and           (arrows)
                      normalized          was analyzed
                                     to mock-treated      on RNA
                                                       samples.  Datachips   using AgilentofBioanalyzer
                                                                        are representative     at least three2100. (C) Theexperiments
                                                                                                              independent   cleavage ofand
                  rRNA     was   quantitated    and normalized     to mock-treated
     expressed as means ± SD; WT: wild-type; ** p < 0.01; *** p < 0.001.                samples.   Data   are representative  of at least
                   three independent experiments and expressed as means± SD; WT: wild-type; ** p < 0.01; *** p < 0.001.
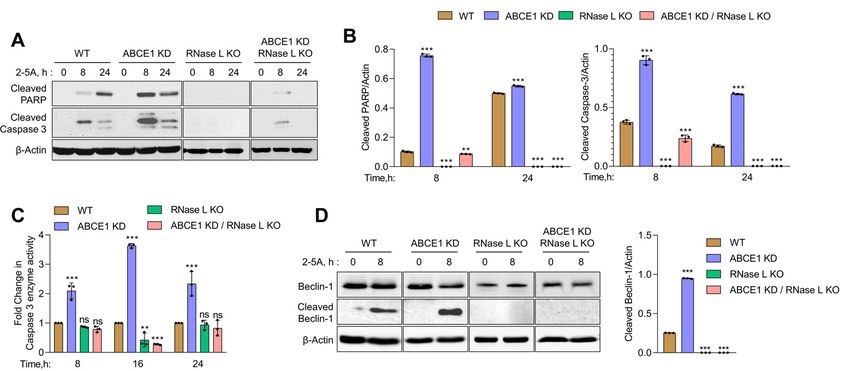
                                3.2. ABCE1 Modulates RNase L-Induced Autophagy
                   3.2. ABCE1 Modulates RNase
                                  Previous    L-Induced
                                           work  from ourAutophagy
                                                          and other groups have shown that RNase L activation induces
                        Previousautophagy
                                   work from   [11,12]. We other
                                                  our and   used several
                                                                     groupsassays
                                                                              have to  determine
                                                                                    shown          the impact
                                                                                             that RNase         of ABCE1in-
                                                                                                            L activation    on RNase
                   duces autophagy [11,12]. We used several assays to determine the impact of ABCE1 on L KO
                                 L-induced    autophagy   [62].  First, WT, ABCE1   KD, RNase   L KO,  and  ABCE1   KD/RNase
                                 cells expressing
                   RNase L-induced       autophagy  GFP-LC3
                                                        [62]. were
                                                               First,transfected
                                                                        WT, ABCE1 with KD,
                                                                                       2-5A RNase
                                                                                              and the formation
                                                                                                      L KO, and  of distinct
                                                                                                                     ABCE1GFP-LC3
                                puncta    that  correspond   to  autophagosomes     and induction   of
                   KD/RNase L KO cells expressing GFP-LC3 were transfected with 2-5A and the formation autophagy    was  quantified at
                                 indicated times (Figure 2A). We observed a significant increase in GFP-LC3 puncta (35.3% of
                   of distinct GFP-LC3 puncta that correspond to autophagosomes and induction of autoph-
                                 GFP+ cells) as early as 4 h post transfection in ABCE1 KD cells compared to WT cells (10.4%). A
                   agy was quantified at indicated times (Figure 2A). We observed a significant increase in
                                 similar increase in GFP-LC3 puncta was observed in another ABCE1 KD clone 2 (Figure S1B).
                   GFP-LC3 puncta      (35.3% of GFP+
                                 In comparison,           cells)
                                                    GFP-LC3       as early
                                                                puncta      asobserved
                                                                         were  4 h post transfection
                                                                                         in only 3.7% inof ABCE1
                                                                                                           RNase LKD KOcells
                                                                                                                          and 5.1% of
                   compared toABCE1
                                  WT cells KD/RNase L KO cells at the same time point. After 8 h, the number ofinGFP-LC3
                                               (10.4%).  A  similar     increase in  GFP-LC3    puncta    was   observed
                   another ABCE1     KDincreased
                                puncta     clone 2 (Figure
                                                     to 64.3%S1B).    In comparison,
                                                                in ABCE1               GFP-LC3
                                                                            KD cells and           puncta
                                                                                          18.9% in WT   cells.were observed
                                                                                                               However,  the numbers
                                    remained largely unchanged in RNase L KO and ABCE1 KD/RNase L KO cells (Figure 2B).
                                    We then measured the accumulation of autophagic vacuoles in live cells transfected with 2-5A
                                    by staining with a fluorescent dye that selectively labels autophagic vacuoles. Compared
                                    to WT cells, ABCE1 KD cells showed a 2-fold increase in autophagic vacuole accumulation
in only 3.7% of RNase L KO and 5.1% of ABCE1 KD/RNase L KO cells at the same time
                                     point. After 8 h, the number of GFP-LC3 puncta increased to 64.3% in ABCE1 KD cells
                                     and 18.9% in WT cells. However, the numbers remained largely unchanged in RNase L
Viruses 2021, 13, 315
                                     KO and ABCE1 KD/RNase L KO cells (Figure 2B). We then measured the accumulation                             7 of 16
                                     of autophagic vacuoles in live cells transfected with 2-5A by staining with a fluorescent
                                     dye that selectively labels autophagic vacuoles. Compared to WT cells, ABCE1 KD cells
                                     showed a 2-fold increase in autophagic vacuole accumulation 4 h and 8 h post 2-5A treat-
                                     4 h and
                                     ment,     8 h RNase
                                            while   post 2-5A L KOtreatment,
                                                                     and ABCE1  while    RNase L LKO
                                                                                      KD/RNase        KOandcellsABCE1
                                                                                                                  showed  KD/RNase       L KO (Fig-
                                                                                                                             very low levels      cells
                                     showed
                                     ure       very lowautophagy,
                                         2C). During        levels (Figure
                                                                        LC3-I2C).is During
                                                                                     cleaved autophagy,
                                                                                               and lipidated LC3-I   is cleaved
                                                                                                                 to LC3-II,        andislipidated
                                                                                                                               which      associated  to
                                     LC3-II,
                                     with     which is associated
                                           autophagosomes.          We with
                                                                        foundautophagosomes.
                                                                                  that ABCE1 KD We          found that
                                                                                                        enhanced            ABCE1 in
                                                                                                                      autophagy       KD   enhanced
                                                                                                                                        2-5A-trans-
                                     autophagy
                                     fected cells,inas2-5A-transfected
                                                        shown by increased cells, as  shown
                                                                                   levels      by increased
                                                                                           of LC3-II          levels of LC3-II
                                                                                                       on immunoblots              on immunoblots
                                                                                                                              as early  as 8 h com-
                                     as early as 8  h  compared     to WT   cells   (Figure  2D).  As  shown    previously,
                                     pared to WT cells (Figure 2D). As shown previously, cells lacking RNase L did             cells lacking   RNase
                                                                                                                                         not induce
                                     L did not induce
                                     autophagy            autophagy
                                                  with 2-5A             with[12,13],
                                                                 treatment     2-5A treatment
                                                                                          and cells[12,13],
                                                                                                     lackingand   cellsABCE1
                                                                                                               both     lackingandbothRNase
                                                                                                                                        ABCE1   L and
                                                                                                                                                   did
                                     RNase
                                     not     L did
                                         induce       not induce
                                                  autophagy       byautophagy        by 2-5AConsistent
                                                                     2-5A transfection.        transfection.withConsistent
                                                                                                                   enhancedwith and enhanced
                                                                                                                                      early onsetand of
                                     early onset of2-5A
                                     autophagy,       autophagy,
                                                           treatment2-5Aoftreatment
                                                                            ABCE1 KD    of ABCE1    KD cellspronounced
                                                                                             cells caused     caused pronounced         degradation
                                                                                                                              degradation      of p62
                                     of p62 (SQSTM1),
                                     (SQSTM1),               an LC3-binding
                                                  an LC3-binding       protein protein      that is degraded
                                                                                  that is degraded                on autophagosome-lysosome
                                                                                                        on autophagosome-lysosome             fusion,
                                     fusion, compared     to  WT,  RNase   L KO,     or ABCE1
                                     compared to WT, RNase L KO, or ABCE1 KD/RNase L KO cells    KD/RNase     L  KO    cells(Figure
                                                                                                                             (Figure2D–F).
                                                                                                                                       2D–F). Taken
                                                                                                                                                Taken
                                     together,  these    results  suggest   that    the  knockdown      of  ABCE1     induced
                                     together, these results suggest that the knockdown of ABCE1 induced early autophagy in       early  autophagy
                                     in RNase
                                     RNase      L-activated
                                             L-activated         cells
                                                              cells andand  these
                                                                         these        effects
                                                                                   effects  ofofABCE1
                                                                                                 ABCE1are  aremediated
                                                                                                                mediatedby    byaa direct
                                                                                                                                    direct effect
                                                                                                                                            effect on
                                                                                                                                                    on
                                     RNase L.
                                     RNase   L.

      Figure 2. Early onset of autophagy in ABCE1 KD cells on RNase L activation. HT1080        HT1080 WT,WT, ABCE1 KD, RNase L KO, and
      ABCE1    KD/RNase LLKO
      ABCE1 KD/RNase           KOcells
                                     cellsexpressing
                                           expressing GFP-LC3
                                                      GFP-LC3 were
                                                                 were mock-transfected
                                                                      mock-transfectedor     or transfected
                                                                                                 transfected with
                                                                                                              with 2-5A
                                                                                                                    2-5A (10
                                                                                                                           (10 μM)
                                                                                                                               µM) and
                                                                                                                                   and (A)
                                                                                                                                         (A) the
                                                                                                                                             the
      formation
      formation ofof GFP-LC3    puncta was
                     GFP-LC3 puncta       was microscopically
                                              microscopicallyimaged
                                                              imagedafter
                                                                       after88 h;
                                                                               h; scale
                                                                                  scale bar
                                                                                         bar 50
                                                                                             50 µm.
                                                                                                  μm. (B)
                                                                                                      (B) The
                                                                                                          The percent   of GFP+
                                                                                                               percent of   GFP+ cells
                                                                                                                                 cells showing
                                                                                                                                       showing
      puncta formation compared with mock-treated cells was analyzed. (C) Autophagy induction in live cells was evaluated
      puncta formation compared with mock-treated cells was analyzed. (C) Autophagy induction in live cells was evaluated
      by staining autophagic vacuoles and quantified. Results shown represent mean ± SD for the experiment performed in
      by staining autophagic vacuoles and quantified. Results shown represent mean ± SD for the experiment performed in
      triplicate and shown as the percent cells showing autophagic vacuoles from randomly selected fields. (D) Cell lysates were
      triplicate and
      harvested        shown astimes,
                  at indicated     the percent
                                         and thecells showing
                                                 conversion  ofautophagic
                                                                unconjugated vacuoles
                                                                                 LC3-I tofrom    randomly
                                                                                           lipidated         selected
                                                                                                        LC3-II         fields. (D) of
                                                                                                                and degradation    Cell
                                                                                                                                      p62lysates
                                                                                                                                           were
      were
      monitored on immunoblots and normalized to β-actin levels. (E,F) The band intensity was calculated using Image of
             harvested  at indicated    times, and the conversion  of unconjugated      LC3-I   to lipidated  LC3-II  and   degradation      p62
                                                                                                                                          J soft-
      were
      ware, and the ratio of LC3-II/β-actin or p62/β-actin was determined and the levels were compared to WT cells. Results areJ
             monitored   on immunoblots      and  normalized  to β-actin levels.  (E,F)  The  band   intensity  was  calculated  using  Image
      software, and the
      representative      ratio of
                       of three     LC3-II/β-actin
                                independent         or p62/β-actin
                                                experiments.       was determined
                                                              WT: wild-type;            and the
                                                                                ** p < 0.01; *** plevels were compared to WT cells. Results
                                                                                                    < 0.001.
      are representative of three independent experiments. WT: wild-type; ** p < 0.01; *** p < 0.001.

                                     3.3. RNase L Activation Sensitizes ABCE1 Knockdown Cells to Apoptosis
                                          Activation of RNase L by 2-5A induces cell death by apoptosis, and the byproducts
                                     of RNase L enzyme activity promote a switch from autophagy to apoptosis [13,63]. To
                                     determine if the increased RNase L enzyme activity in ABCE1 KD cells affected cell viability,
3.3. RNase L Activation Sensitizes ABCE1 Knockdown Cells to Apoptosis
                                         Activation of RNase L by 2-5A induces cell death by apoptosis, and the byproducts
  Viruses 2021, 13, 315                                                                                                              8 of 16
                                   of RNase L enzyme activity promote a switch from autophagy to apoptosis [13,63]. To
                                   determine if the increased RNase L enzyme activity in ABCE1 KD cells affected cell via-
                                   bility, WT, ABCE1 KD, RNase L KO, and ABCE1 KD/RNase L KO cells were transfected
                                   withWT,   ABCE1
                                         2-5A.        KD, RNase
                                                At indicated         L KO,
                                                                 times,  celland  ABCE1was
                                                                              viability    KD/RNase    L KOby
                                                                                               determined    cells
                                                                                                               MTS were transfected
                                                                                                                     assay            withblue
                                                                                                                             and trypan
                                        2-5A.  At indicated    times,  cell viability was   determined  by  MTS   assay
                                   exclusion assays. After 8 h, ABCE1 KD cells showed 72% cell viability compared to    and   trypan  bluemini-
                                        exclusion assays. After 8 h, ABCE1 KD cells showed 72% cell viability compared to minimal
                                   mal loss of viability in WT, RNase L KO, and ABCE1 KD/RNase L KO cells. The viability
                                        loss of viability in WT, RNase L KO, and ABCE1 KD/RNase L KO cells. The viability of
                                   of ABCE1    KD cells was further reduced at 16 h to 57%, compared to 88% in WT cells, and
                                        ABCE1 KD cells was further reduced at 16 h to 57%, compared to 88% in WT cells, and
                                   the loss  of viability
                                        the loss           continued
                                                 of viability  continued totodecrease
                                                                              decreaseat at 24
                                                                                            24 h to 44%
                                                                                               h to 44%ininABCE1
                                                                                                            ABCE1  KDKD  cells
                                                                                                                       cells    while
                                                                                                                             while 62%62% of of
                                   the WT
                                        the WT cells were viable. Similarly, ABCE1 KD clone 2 showed 48% cell viability at 24 h24 h
                                            cells  were   viable.   Similarly,   ABCE1     KD   clone 2 showed    48%  cell  viability  at
                                   (Figure  S1C).
                                        (Figure     NoNo
                                                 S1C).   significant
                                                             significantloss
                                                                          lossofofviability
                                                                                   viability was   observedininRNase
                                                                                             was observed       RNase    L KO
                                                                                                                      L KO    andand   ABCE1
                                                                                                                                   ABCE1
                                   KD/RNase
                                        KD/RNaseL KO    cellscells
                                                     L KO      (Figure   3A).
                                                                   (Figure  3A).

Figure Figure
         3. Involvement        of ABCE1
                  3. Involvement    of ABCE1in RNase
                                               in RNase L-induced      apoptosisinin
                                                           L-induced apoptosis           response
                                                                                      response        to 2-5A
                                                                                                 to 2-5A        treatment.
                                                                                                          treatment.   HT1080HT1080      WT,KD,
                                                                                                                                 WT, ABCE1     ABCE1
                                                                                                                                                  RNaseKD,
RNase L  L KO,
            KO,and andABCE1
                         ABCE1     KD/RNase
                                KD/RNase     L KO L cells
                                                     KO were
                                                           cells transfected
                                                                  were transfected
                                                                              with 10 µM with   10 μM
                                                                                             of 2-5A   for of 2-5A for
                                                                                                           indicated       indicated
                                                                                                                       times           times
                                                                                                                             and (A) cell      and (A)
                                                                                                                                           viability was cell
viabilitymeasured
           was measured
                      using MTSusing  MTS (B)
                                   reagent.  reagent.   (B) The
                                                 The percent       percent of
                                                               of apoptotic     apoptotic
                                                                              cells           cells wasbydetermined
                                                                                    was determined          trypan blue dyeby trypan   blue
                                                                                                                                exclusion    dyeResults
                                                                                                                                          assay.  exclusion
assay. Results     are representative
         are representative                of three independent
                               of three independent                    experiments
                                                       experiments performed              performed
                                                                                    in triplicate        in triplicate
                                                                                                   and shown     as mean and   shown
                                                                                                                            ± SD        as mean to
                                                                                                                                  and compared     ± SD
                                                                                                                                                     WTand
compared      to WT    cells; and  (C)  real-time   cell  viability  was   measured       over  time    using  a dual    dye monitoring
         cells; and (C) real-time cell viability was measured over time using a dual dye monitoring system in cells transfected with 2-5A   system   in cells
transfected
         and compared to mock-transfected cells. The percent cell survival in each well was determined by quantitating dead cells by
               with   2-5A    and  compared     to  mock-transfected        cells.  The   percent    cell survival    in  each   well was   determined
quantitating     dead cells
         and normalized      to and  normalized
                                the total number oftocells
                                                         theattotal
                                                               each number
                                                                     time point.ofData
                                                                                     cellsare
                                                                                            atrepresentative
                                                                                               each time point. of fourData   areper
                                                                                                                         values    representative
                                                                                                                                     well performedofinfour
values per     wellfrom
         triplicate  performed      in triplicate
                          three experimental        from and
                                                samples     three   experimental
                                                                shown    as mean ±samples         and shownofaspercent
                                                                                       SD. (D) Quantitation           mean cell
                                                                                                                              ± SD.   (D) Quantitation
                                                                                                                                   survival at 30 h after of
percent2-5A
          cell survival    at  30 h after  2-5A   transfection     normalized     to  mock-transfected        cells.  WT:   wild-type;
                transfection normalized to mock-transfected cells. WT: wild-type; ** p < 0.01; *** p < 0.001; ns: not significant.       ** p < 0.01; *** p <
0.001; ns: not significant.
                                                ABCE1 KD cells showed increased cell death from 26% to 67% in trypan blue exclusion
                                          assay
                                           ABCE1  overKD time   compared
                                                             cells  showedtoincreased
                                                                                 WT cells (16%         to 59%from
                                                                                               cell death       cell death),
                                                                                                                       26% towhile67% over    80% ofblue
                                                                                                                                        in trypan      RNaseexclu-
                                    sion assay over time compared to WT cells (16% to 59% cell death), while overclone
                                          L  KO   and   ABCE1      KD/RNase        L  KO    cells  remained      viable   (Figure   3B). ABCE1      KD     80% of
                                          2 showed 68% cell death at 24 h after 2-5A transfection (Figure S1D). We then assessed
                                    RNase     L KO and ABCE1 KD/RNase L KO cells remained viable (Figure 3B). ABCE1 KD
                                          the effects of 2-5A on cell survival in real time of WT, ABCE1 KD, RNase L KO, or ABCE1
                                    clone 2 showed 68% cell death at 24 h after 2-5A transfection (Figure S1D). We then as-
                                          KD/RNase L KO cells using dual dyes and an IncuCyte real-time monitoring system for
                                    sessed30 the   effects ofin2-5A
                                              h (described               on cellThe
                                                                    Methods).       survival     in realof
                                                                                         quantitation       time
                                                                                                              cell of  WT, ABCE1
                                                                                                                    survival    showedKD, thatRNase
                                                                                                                                                 only 10%L KO,
                                                                                                                                                            of or
                                    ABCE1 ABCE1 KD cells survived after 30 h compared to 47% of WT cells, while RNase L KO andsys-
                                               KD/RNase         L  KO   cells  using     dual    dyes    and   an   IncuCyte      real-time    monitoring
                                    tem ABCE1
                                          for 30 hKD/RNase
                                                      (described       in Methods).
                                                                     L KO                   The quantitation
                                                                            cells were mostly                         of cell3C,D).
                                                                                                     unaffected (Figure          survival   showed
                                                                                                                                        These   results that
                                                                                                                                                         showonly
                                    10% that
                                           of ABCE1
                                               activation KDofcells
                                                                 RNase survived
                                                                          L by 2-5Aafter     30 lacking
                                                                                        in cells  h comparedABCE1,   towhich
                                                                                                                         47% of    WT cells,
                                                                                                                                increases  RNase while   RNase L
                                                                                                                                                    L activity,
                                    KO andalso ABCE1
                                                enhancesKD/RNase
                                                              apoptosis compared
                                                                           L KO cellstowere  WT cells.
                                                                                                    mostly unaffected (Figure 3C,D). These results
                                   show that activation of RNase L by 2-5A in cells lacking ABCE1, which increases RNase
                                       3.4. ABCE1 Knockdown Augments RNase L-Induced Apoptosis by Enhancing Caspase-3 Activity
                                   L activity, also enhances
                                       and Beclin-1 Proteolytic apoptosis
                                                                Cleavage compared to WT cells.
                                              In previous studies, we showed that small dsRNAs generated by RNase L enzyme
                                         activity promote a switch from autophagy to apoptosis by the caspase-mediated cleavage of
Viruses 2021, 13, x FOR PEER REVIEW                                                                                                   9 of 16
Viruses 2021, 13, 315                                                                                                                                         9 of 16

                                           3.4. ABCE1 Knockdown Augments RNase L-Induced Apoptosis by Enhancing Caspase-3 Activ-
                                       key ity and Beclin-1
                                           autophagy        Proteolytic
                                                         protein,       Cleavage
                                                                   Beclin-1   [13]. Here, we show increased RNase L activity accompanied
                                       by early In   previous
                                                  onset          studies, wecorrelating
                                                           of autophagy           showed thatwith smalla dsRNAs
                                                                                                          switch to   generated
                                                                                                                        apoptotic  by cell
                                                                                                                                       RNase    L enzyme
                                                                                                                                            death     in cells lacking
                                            activity promote     a switch    from   autophagy     to apoptosis
                                       ABCE1. Together, these events suggest the involvement of caspase cascade    by the  caspase-mediated       cleavage
                                                                                                                                                        and Beclin-1
                                            of key autophagy protein, Beclin-1 [13]. Here, we show increased RNase L activity accom-
                                       cleavage in events leading to enhanced cell death in ABCE1 KD cells. To investigate the
                                            panied by early onset of autophagy correlating with a switch to apoptotic cell death in
                                       activation    of caspase-3,
                                            cells lacking               we monitored
                                                            ABCE1. Together,                  the cleavage
                                                                                     these events    suggest the  ofinvolvement
                                                                                                                      caspase-3 and       PARP,cascade
                                                                                                                                    of caspase       both hallmarks
                                       of apoptosis,
                                            and Beclin-1 in WT,    ABCE1
                                                             cleavage           KD, RNase
                                                                        in events     leading L toKO,     and ABCE1
                                                                                                    enhanced      cell deathKD/RNase
                                                                                                                               in ABCE1 L   KD KO     cells
                                                                                                                                                  cells.  Toafter 2-5A
                                       transfection
                                            investigateat the
                                                           indicated    times
                                                               activation         on immunoblots.
                                                                             of caspase-3,   we monitored  Thetheappearance
                                                                                                                    cleavage ofof   cleavedand
                                                                                                                                  caspase-3     PARP PARP,was evident
                                       by 8both
                                             h inhallmarks
                                                   ABCE1 KD     of apoptosis,
                                                                    cells (9-fold in WT,
                                                                                       moreABCE1
                                                                                               thanKD,WT)  RNase     L KO, and ABCE1
                                                                                                             and remained         sustained KD/RNase
                                                                                                                                                 at 24 hLcompared
                                       to WTKOcells.
                                                 cells after   2-5A transfection
                                                        As expected,                  at indicated
                                                                            PARP cleavage          wastimes   on immunoblots.
                                                                                                         barely     detectable inThe  RNaseappearance
                                                                                                                                                 L KO and of ABCE1
                                            cleaved PARP was evident by 8 h in ABCE1 KD cells (9-fold more than WT) and remained
                                       KD/RNase L KO cells. Caspase-3 activity, measured by levels of cleaved caspase-3 on
                                            sustained at 24 h compared to WT cells. As expected, PARP cleavage was barely detecta-
                                       immunoblots,         showed a similar temporal profile in ABCE1 KD cells (2.5-fold more than
                                            ble in RNase L KO and ABCE1 KD/RNase L KO cells. Caspase-3 activity, measured by
                                       WT levels
                                             at 8 hofand     3.6-fold
                                                       cleaved           more
                                                                 caspase-3         at 24 h) compared
                                                                               on immunoblots,       showed ato      WT cells
                                                                                                                  similar         andprofile
                                                                                                                            temporal     low to      no cleavage in
                                                                                                                                                in ABCE1
                                       RNaseKD Lcells
                                                   KO(2.5-fold
                                                         cells and    ABCE1
                                                                   more   than WT  KD/RNase
                                                                                       at 8 h andL3.6-fold
                                                                                                      KO cells more (Figure   4A,B).
                                                                                                                       at 24 h)         We measured
                                                                                                                                 compared     to WT cellscaspase-3
                                       enzyme     activity
                                            and low    to noin    cell lysates
                                                               cleavage    in RNaseusing   a fluorescent
                                                                                        L KO    cells and ABCE1substrate     following
                                                                                                                       KD/RNase     L KORNase          L activation at
                                                                                                                                             cells (Figure
                                            4A,B). We
                                       indicated    timesmeasured     caspase-3 aenzyme
                                                              and observed            2-foldactivity    in cellincrease
                                                                                              to 3.6-fold       lysates using   a fluorescent
                                                                                                                            in ABCE1             substrate
                                                                                                                                           KD cells     compared to
                                       WT following
                                            cells. NoRNase        L activation
                                                          significant             at indicated
                                                                          caspase-3       enzyme times   and observed
                                                                                                      activity             a 2-fold toin3.6-fold
                                                                                                                  was detected                     increase
                                                                                                                                         the lysates      of RNase L
                                            in ABCE1 KD cells compared to WT cells. No significant caspase-3 enzyme activity was
                                       KO cells and ABCE1 KD/RNase L KO cells (Figure 4C). Based on our previous results, we
                                            detected in the lysates of RNase L KO cells and ABCE1 KD/RNase L KO cells (Figure 4C).
                                       hypothesized
                                            Based on our   that  increased
                                                             previous   results, apoptosis     due to RNase
                                                                                    we hypothesized                  L activation
                                                                                                          that increased     apoptosisin due
                                                                                                                                         ABCE1to RNaseKD L cells could
                                       be attributed      to caspase-3-mediated            cleavage      of  Beclin-1.     Subsequently,
                                            activation in ABCE1 KD cells could be attributed to caspase-3-mediated cleavage of Be-             using     immunoblot
                                       analysis,
                                            clin-1. we   determined
                                                    Subsequently,      usingincreased
                                                                                immunoblot cleavage
                                                                                                analysis,of Beclin-1
                                                                                                             we determined(3.8-fold    morecleavage
                                                                                                                                 increased     than WT)   of 8 h after
                                            Beclin-1  (3.8-fold   more  than    WT)   8 h after RNase    L activation
                                       RNase L activation in ABCE1 KD cells compared to WT cells, which overlapped with  in ABCE1   KD    cells compared
                                            to WT cells,
                                       increased            whichactivity
                                                    caspase-3       overlapped      with increased
                                                                                (Figure                 caspase-3 activity
                                                                                           4D). No significant                 (Figure 4D).
                                                                                                                        modulation             No signifi-activity or
                                                                                                                                         of caspase-3
                                            cant modulation of caspase-3 activity or Beclin-1 cleavage was observed in RNase L KO
                                       Beclin-1 cleavage was observed in RNase L KO cells and ABCE1 KD/RNase L KO cells.
                                            cells and ABCE1 KD/RNase L KO cells. These results suggest that compared to WT cells,
                                       These   results suggest that compared to WT cells, increased RNase L activity in ABCE1 KD
                                            increased RNase L activity in ABCE1 KD cells enhances apoptosis by the increased
                                       cellscaspase-3-mediated
                                             enhances apoptosis           by the
                                                                     cleavage     ofincreased
                                                                                      Beclin-1 and caspase-3-mediated
                                                                                                      cells lacking both ABCE1  cleavage     of Beclin-1
                                                                                                                                       and RNase       L are and cells
                                       lacking   both    ABCE1      and     RNase
                                            resistant to apoptosis by 2-5A treatment.  L  are resistant     to  apoptosis      by  2-5A    treatment.

                Figure 4. Increased caspase-3 activity and the proteolytic cleavage of Beclin-1 in ABCE1 knockdown cells on RNase L
                 Increased
      Figure 4.activation  bycaspase-3   activity andanalysis
                              2-5A. (A) Immunoblot       the proteolytic
                                                                 of HT1080cleavage
                                                                            WT, ABCE1of Beclin-1 in ABCE1
                                                                                         KD, RNase           knockdown
                                                                                                      L KO, and             cells on LRNase
                                                                                                                 ABCE1 KD/RNase              L activation
                                                                                                                                       KO cells
      by 2-5A. transfected
                (A) Immunoblot       analysis
                            with 10 μM   of 2-5A offor
                                                    HT1080    WT,
                                                       indicated    ABCE1
                                                                 times       KD, RNase
                                                                       and probed          L KO,PARP
                                                                                    with cleaved   and and
                                                                                                         ABCE1    KD/RNase
                                                                                                             cleaved              L KO cells
                                                                                                                     caspase-3 antibodies    transfected
                                                                                                                                           and
      with 10 µMnormalized
                    of 2-5Atofor
                               β-actin levels. times
                                 indicated     (B) Theand
                                                        bandprobed
                                                             intensity was cleaved
                                                                     with  calculatedPARP
                                                                                      using Image  J software
                                                                                             and cleaved      and the ratio
                                                                                                           caspase-3        of cleavedand
                                                                                                                        antibodies     PARP/β-
                                                                                                                                          normalized to
                actin or cleaved caspase-3/β-actin was determined and the levels were compared to WT cells. (C) Caspase-3/7 enzyme
      β-actin levels. (B) The band intensity was calculated using Image J software and the ratio of cleaved PARP/β-actin or cleaved
      caspase-3/β-actin was determined and the levels were compared to WT cells. (C) Caspase-3/7 enzyme activity was measured
      in HT1080 WT, ABCE1 KD, RNase L KO, and ABCE1 KD/RNase L KO cells transfected with 10 µM of 2-5A for indicated
      times and the cleavage of fluorescent caspase-3 substrate was determined. Results shown represent mean ± SD for the
      experiment performed in triplicate and representative of three independent experiments. (D) Immunoblot analysis of
      HT1080 WT, ABCE1 KD, RNase L KO, and ABCE1 KD/RNase L KO cells transfected with 10 µM of 2-5A for indicated
      times and probed with Beclin-1 antibodies and normalized to β-actin levels. The band intensity was calculated using Image
      J software and the ratio of cleaved Beclin-1/β-actin was determined and the levels were compared to WT cells. Results are
      representative of three independent experiments. WT: wild-type; ** p < 0.01; *** p < 0.001; ns: not significant.
lot analysis of HT1080 WT, ABCE1 KD, RNase L KO, and ABCE1 KD/RNase L KO cells transfected with 10 μM of 2-5A
for indicated times and probed with Beclin-1 antibodies and normalized to β-actin levels. The band intensity was calcu-
lated using Image J software and the ratio of cleaved Beclin-1/β-actin was determined and the levels were compared to
WT cells. Results are representative of three independent experiments. WT: wild-type; ** p < 0.01; *** p < 0.001; ns: not
    Viruses 2021, 13, 315
significant.                                                                                                    10 of 16

                                      3.5. ABCE1 Regulates Autophagy during EMCV Infection
                                           3.5. ABCE1work
                                           Previous     Regulates
                                                                hasAutophagy  during
                                                                     shown that       EMCVinfection
                                                                                    EMCV     Infection can induce autophagy in an RNase
                                      L-dependentPrevious  work has
                                                      manner      andshown   that times
                                                                        at later   EMCV of
                                                                                         infection  can induceinhibiting
                                                                                            viral growth,       autophagy autophagy
                                                                                                                             in an RNase L- reduced
                                           dependent manner and at later times of viral growth, inhibiting autophagy reduced EMCV
                                      EMCV yield [11,12]. Our results show increased autophagy in ABCE1 KD cells, so we
                                           yield [11,12]. Our results show increased autophagy in ABCE1 KD cells, so we determined
                                      determined
                                           the impactthe
                                                       of impact
                                                           ABCE1 on of EMCV
                                                                       ABCE1     on EMCV
                                                                              infection.      infection.
                                                                                         HT1080   WT andHT1080
                                                                                                           ABCE1 KD WT     and
                                                                                                                        cells    ABCE1
                                                                                                                              were          KD cells
                                                                                                                                     infected
                                      werewith
                                            infected
                                                 EMCVwith     EMCV atofmultiplicity
                                                        at multiplicity                  ofofinfection
                                                                           infection (MOI)               (MOI)
                                                                                               1. Cells were     of 1. Cells
                                                                                                             harvested  at 4 h were
                                                                                                                                and 8 hharvested
                                                                                                                                         post      at
                                      4 h and   8 h post
                                           infection,    infection,
                                                      proteins        proteins were
                                                                were separated         separated
                                                                                 by denaturing       by denaturing
                                                                                                 polyacrylamide       polyacrylamide
                                                                                                                  gel electrophoresis,   andgel elec-
                                           immunoblots
                                      trophoresis,   and were    probed with
                                                           immunoblots         LC3 probed
                                                                             were   and P62 antibodies
                                                                                             with LC3toand monitor  autophagy induction.
                                                                                                                P62 antibodies      to monitor au-
                                      tophagy induction. Lysates were also probed with anti-3D-Pol antibody to of
                                           Lysates  were   also probed   with anti-3D-Pol antibody    to detect accumulation     viral    the accu-
                                                                                                                                       detect
                                           viral protein (Figure 5A).
                                      mulation viral of the viral protein (Figure 5A).

Figure 5.Figure
            Effect5.of   ABCE1
                      Effect        on autophagy
                              of ABCE1      on autophagy during
                                                             during EMCV
                                                                      EMCVinfection.         HT1080WT
                                                                               infection. HT1080         WTand and    ABCE1
                                                                                                                  ABCE1      KD KDcells cells
                                                                                                                                        were were
                                                                                                                                               infected infected
                                                                                                                                                           with with
EMCV (MOIEMCV    of(MOI
                     1.0) and    atand
                           of 1.0)  indicated     times
                                        at indicated      (A)(A)
                                                       times    conversion
                                                                   conversionofofunconjugated
                                                                                      unconjugated LC3-I LC3-Ito to  lipidated
                                                                                                                 lipidated         LC3-II,
                                                                                                                              LC3-II,         degradation
                                                                                                                                        degradation      of p62, of p62,
and accumulation        of viralofprotein
         and accumulation                     3D Pol
                                    viral protein       were
                                                    3D Pol  weremonitored
                                                                   monitoredon  onimmunoblots
                                                                                     immunoblots and   and    normalized
                                                                                                           normalized           to β-actin
                                                                                                                          to β-actin   levels.levels.
                                                                                                                                                (B) The(B)   The band
                                                                                                                                                          band
intensityintensity
           was calculated        using using
                      was calculated      ImageImage
                                                   J software,    andand
                                                         J software,    thethe
                                                                             ratio    of of
                                                                                  ratio   LC3-II/β-actin,
                                                                                            LC3-II/β-actin,p62/β-actin,
                                                                                                                p62/β-actin, or  or 3D    Pol//β-actin was
                                                                                                                                     3D Pol//β-actin        was deter-
mined and     the levels
         determined      andwere     compared
                              the levels            to WT to
                                          were compared      cells.  (C) Intracellular
                                                               WT cells.   (C) Intracellular andand(D)
                                                                                                     (D) extracellular
                                                                                                         extracellular titertiter  of EMCV
                                                                                                                               of EMCV     were were      determined
                                                                                                                                                  determined
         by   a plaque   assay,  and  (E)  the  fold change   in EMCV     titers  in  supernatants    of
by a plaque assay, and (E) the fold change in EMCV titers in supernatants of ABCE1 KD cells was compared ABCE1     KD   cells was   compared      to WTto  cells.
                                                                                                                                                             WT cells.
         Results
Results are         are representative
              representative               of three
                                    of three         independent
                                               independent           experiments.(F)
                                                                  experiments.         (F) EMCV
                                                                                           EMCV titers
                                                                                                    titersinin
                                                                                                             WT WT andandABCE1
                                                                                                                             ABCE1 KD cells
                                                                                                                                         KD 4cells
                                                                                                                                                 h or 48 h
                                                                                                                                                         h post
                                                                                                                                                            or 8 h post
infection.infection.
            (G) WT(G)   andWTABCE1
                                and ABCE1KD KD     cells
                                               cells     wereleft
                                                      were     leftuntreated
                                                                    untreated ororwerewere pretreated  with with
                                                                                              pretreated     3-MA 3-MA
                                                                                                                     (5 mM)(5  ormM)
                                                                                                                                  bafilomycin     A1 (100 nM)A1 (100
                                                                                                                                          or bafilomycin
nM) 1 h prior to infection with EMCV (MOI of 1.0), and viral titers in the supernatant were determined byassay.
         1  h prior  to infection   with   EMCV    (MOI   of 1.0), and  viral titers   in the supernatant    were   determined      by  a plaque            The assay.
                                                                                                                                                     a plaque
         fold   change    in the viral  yield  in WT   and  ABCE1     KD   cells  treated   with  either  3-MA    or
The fold change in the viral yield in WT and ABCE1 KD cells treated with either 3-MA or bafilomycin A1 was compared   bafilomycin     A1  was   compared      to
         untreated     samples.    Data  represent   mean   ±  SD  performed     in  triplicate. WT:  wild-type;    * p <  0.05;
to untreated samples. Data represent mean ± SD performed in triplicate. WT: wild-type; * p < 0.05; ** p < 0.01; *** p < 0.001.   ** p <  0.01; *** p <  0.001.

                                                 Compared to WT cells, increased conversion of LC3-I to LC3-II was observed in ABCE1
                                             KD cells that correlated with the degradation of the autophagy receptor, P62, as early as
Viruses 2021, 13, 315                                                                                           11 of 16

                        4 h post infection. The increase in LC3-II conversion and P62 degradation continued at 8 h
                        post infection in ABCE1 KD cells (Figure 5B). To test the impact of enhanced autophagy in
                        ABCE1 KD cells on the replication of EMCV, intracellular and extracellular viral titers were
                        determined following the infection of WT and ABCE1 KD cells at indicated times, starting
                        at 4 h post infection (Figure 5C,D). ABCE1 KD resulted in a 1.5-fold to 4-fold increase in
                        levels of both intracellular and released EMCV at all the time points (Figure 5C–E). To
                        determine the effect of autophagy on EMCV replication, WT and ABCE1 KD cells were
                        pretreated with autophagy inhibitors, 3-MA, or bafilomycin A1 prior to EMCV infection.
                        Viral titers were determined 4 h and 8 h post infection from supernatants and compared
                        to untreated cells. ABCE1 KD cells showed higher viral titers compared to WT cells.
                        However, treatment with both autophagy inhibitors reduced EMCV titers more drastically
                        in ABCE1 KD cells at both 4 h and 8 h post infection compared to WT cells (Figure 5F,G).
                        Taken together, these results indicate that ABCE1 plays an important role in regulating
                        EMCV-induced autophagy and that the enhanced autophagy induction in ABCE1 KD cells
                        supports EMCV infection.

                        4. Discussion
                             The OAS/RNase L antiviral pathway is activated by IFN, produced during viral
                        infections, and the activity of RNase L is regulated by 2-5A synthesized by certain OAS
                        isoforms from cellular ATP. Many RNA and DNA viruses are susceptible to the antiviral
                        effects of this pathway. Accordingly, viruses encode for proteins that antagonize or inhibit
                        one or many steps of this pathway [17,18]. In addition, host cells express proteins that
                        keep the activation of this pathway in check as RNase L cleaves cellular RNAs and inhibits
                        protein synthesis that can be detrimental to cellular homeostasis. This study focused on
                        one of the earliest identified cellular inhibitors of RNase L, ABCE1, also known as RNase L
                        inhibitor (RLI). RLI was characterized as a negative regulator of the OAS/RNase L pathway
                        by antagonizing 2-5A binding and nuclease activity of RNase L [38]. Our results show that
                        the knockdown of ABCE1 in HT1080 fibrosarcoma cells results in increased RNase L activity
                        in cells transfected with its activator, 2-5A, or synthetic dsRNA (poly I:C), which activates
                        OAS to produce 2-5A. Two independent ABCE1 KD clones yielded similar results in the
                        assays we studied, ruling out clone-specific artifacts (Figure S1). A similar increase in RNase
                        L activity in RLI KD cells was observed in prostate cancer cells activated with 2-5A [60]. A
                        decrease in the inhibition of RNase L activity was also observed in Hela cells expressing
                        RLI antisense cDNA [42]. We quantified the differences in RNase L activity across cell
                        lines and samples using the RNA integrity number (RIN) to minimize variability [61]. The
                        effects of ABCE1 on inhibiting RNase L is specific as cells lacking both proteins show no
                        nucleolytic activity. In contrast, another recent study showed the interaction of ABCE1
                        with Dom34 (Pelota) and RNase L to function as a positive regulator of exogenous RNA
                        decay [40]. It is not clear if transfected exogenous RNAs are processed differently from
                        the endogenous RNAs cleaved in the cellular context and during viral infections. In line
                        with other studies on RNase L activation, in our studies, the ligand 2-5A was delivered
                        by complexing with lipid reagents, in contrast to the electroporation-mediated delivery
                        used by Nogimori et al. [40]. Furthermore, basal levels of OAS proteins and RNase L
                        vary by cell types and are determinants of IFN induction during viral infection, including
                        EMCV [64]. Hela M cells are deficient in endogenous RNase L activity and have been used
                        to reconstitute the expression of RNase L mutants [65–67]. It is not clear if the variable
                        levels of endogenous RNase L in cell lines, along with differences in the dose and mode of
                        delivery of 2-5A, can explain the differences in the two studies, and further investigation
                        will be required. ABCE1 is evolutionarily conserved in archaea and eukaryotes, compared
                        to the limited function of RNase L in higher vertebrates, suggesting more fundamental
                        roles. Accordingly, recent studies have shown ABCE1 function in regulating translation,
                        ribosome recycling, and ribosome homeostasis. Depletion of ABCE1 in yeast, Drosophila,
                        and mammalian cells have shown a marked reduction in polysomes and accumulation
                        of mRNA-free 80S monomers [51,68]. It is likely that in cells depleted of ABCE1, cellular
Viruses 2021, 13, 315                                                                                            12 of 16

                        RNAs inclusive of mRNAs are more accessible to RNase L for cleavage, causing enhanced
                        degradation. Similar to other results, our data support the role of ABCE1 as an inhibitor of
                        RNase L activity.
                              Activation of RNase L during a viral infection or directly by 2-5A transfection induced
                        autophagy only in cells expressing WT RNase L and not in RNase L KO Mouse embryonic
                        fibroblasts (MEFs) or cells with RNase L knockdown. Reconstituting RNase L KO cells with
                        a RNase L mutant lacking enzyme activity did not restore autophagy, implicating RNA
                        cleavage as a triggering event [11,12]. Our results show that RNase L activation in ABCE1
                        knockdown cells significantly enhanced autophagy at earlier time points that correlate with
                        RNase L activity compared to parental WT cells or cells lacking RNase L or both proteins.
                        RNase L cleaves single-stranded regions of viral and cellular RNAs, including rRNA, to
                        produce short dsRNAs with signaling roles. RNase L-mediated rRNA cleavage can inhibit
                        protein translation and disassembly and turnover of polysomes similar to observations
                        made in ABCE1-depleted yeast, Drosophila, and mammalian cells. Therefore, the activation
                        of RNase L in ABCE1 knockdown cells can synergistically enhance the accumulation of
                        non-translating ribosomes that may be sequestered in autophagosomes by specialized
                        autophagy, ribophagy, and serve as a recycling pathway.
                              RNase L participates in the cross-talk between autophagy and apoptosis. Depending
                        on the cell type and the expression levels of apoptotic and anti-apoptotic proteins, RNase
                        L activates caspase-3 to induce apoptosis [13,60,63,64]. Our previous studies showed
                        that dsRNAs produced by RNase L induces caspase-3, which in turn cleaves autophagy
                        protein, Beclin-1, to promote a switch from autophagy to apoptosis [13]. Here, we have
                        demonstrated that RNase L activation in ABCE1 knockdown sensitizes cells to apoptosis
                        and shows significantly reduced cell proliferation. Our results show a close correspondence
                        of increased RNase L activity with caspase-3 enzyme activity, as observed previously in
                        prostate cancer cells with ABCE1 knockdown. Here, we have shown that caspase-3 activity
                        and cleavage of PARP is consistent with caspase-3-mediated cleavage of Beclin-1 observed
                        at the same time points after RNase L activation. The knockdown of ABCE1 expression in
                        human esophageal cancer, breast cancer, and small cell lung cancer cells causes reduced
                        proliferation, increased apoptosis, migration, and invasion; however, the role of RNase
                        L inhibition in mediating these effects remains to be determined [53–55]. It is likely that
                        mammals may have evolved additional roles of ABCE1 in regulating the tumor suppressor
                        roles of RNase L by regulating RNase L enzyme activity.
                              ABCE1 has diverse roles during viral infections. The initial characterization of ABCE1
                        supported an inhibition of antiviral role of IFN during infection with EMCV and HIV. In
                        these studies, ABCE1 was transcriptionally induced by virus infection and not IFN. In both
                        instances, overexpression of ABCE1 inhibited RNase L activity and enhanced virus produc-
                        tion; however, decreasing ABCE1 levels correlated with decreased viral yield [41,42]. Based
                        on recent studies, ABCE1 may serve dual roles in HIV pathogenesis. Overexpression causes
                        a decrease in RNase L activity and increased HIV production. In contrast, antisense ABCE1
                        (RLI) construct expression reverses inhibition of RNase L activity, with a corresponding
                        decrease in HIV titers [41]. Additionally, ABCE1 (HP68) was shown to be required for
                        immature HIV-1 capsid assembly [44]. Recently, ABCE1 has been shown to interact with
                        gag and cellular protein, DDX6, to facilitate HIV-1 immature capsid assembly using RNA
                        granules [43,69,70]. In other studies, ABCE1 was identified in a genome-wide screen as a
                        proviral host protein needed for the efficient translation of measles (MeV), mumps (MuV),
                        and RSV mRNA and not cellular RNAs [45]. Many viruses induce translation shut-off
                        by perturbing mRNA or protein synthesis. However, paramyxovirus relies on ongoing
                        protein synthesis and requires the ribosome recycling function of ABCE1. The polycistronic
                        paramyxovirus mRNA could cause altered termination of ribosome, and hence the rigid
                        requirement of ABCE1 to recycle ribosomes in sustaining viral replication. The initiation of
                        translation during EMCV infection is cap independent due to its internal ribosome entry
                        sites (IRES) that bind eIFs to directly recruit the 40S ribosomal subunit [71]. The precise role
                        of ABCE1 in the translation of EMCV proteins will need further investigation. However,
You can also read