Comparative genomics of muskmelon reveals a potential role for retrotransposons in the modification of gene expression - Nature
←
→
Page content transcription
If your browser does not render page correctly, please read the page content below
ARTICLE
                  https://doi.org/10.1038/s42003-020-01172-0                OPEN

                  Comparative genomics of muskmelon reveals
                  a potential role for retrotransposons in the
                  modification of gene expression
1234567890():,;

                  Ryoichi Yano 1,2,3 ✉, Tohru Ariizumi                    1,4,Satoko Nonaka1,4, Yoichi Kawazu5, Silin Zhong                      6,7,

                  Lukas Mueller6,8, James J. Giovannoni                    6,8, Jocelyn K. C. Rose 9 & Hiroshi Ezura 1,4 ✉

                  Melon exhibits substantial natural variation especially in fruit ripening physiology, including
                  both climacteric (ethylene-producing) and non-climacteric types. However, genomic
                  mechanisms underlying such variation are not yet fully understood. Here, we report an
                  Oxford Nanopore-based high-grade genome reference in the semi-climacteric cultivar
                  Harukei-3 (378 Mb + 33,829 protein-coding genes), with an update of tissue-wide RNA-seq
                  atlas in the Melonet-DB database. Comparison between Harukei-3 and DHL92, the first
                  published melon genome, enabled identification of 24,758 one-to-one orthologue gene
                  pairs, whereas others were candidates of copy number variation or presence/absence
                  polymorphisms (PAPs). Further comparison based on 10 melon genome assemblies identified
                  genome-wide PAPs of 415 retrotransposon Gag-like sequences. Of these, 160 showed
                  fruit ripening-inducible expression, with 59.4% of the neighboring genes showing similar
                  expression patterns (r > 0.8). Our results suggest that retrotransposons contributed to the
                  modification of gene expression during diversification of melon genomes, and may affect fruit
                  ripening-inducible gene expression.

                  1 Faculty of Life and Environmental Sciences, University of Tsukuba, 1-1-1 Tennodai, Tsukuba, Ibaraki 305-8572, Japan. 2 Advanced Analysis Center,

                  National Agriculture and Food Research Organization (NARO), 2-1-2 Kannondai, Tsukuba, Ibaraki 305-8518, Japan. 3 JST PRESTO, 4-1-8, Honcho,
                  Kawaguchi, Saitama 332-0012, Japan. 4 Tsukuba Plant Innovation Research Center (T-PIRC), University of Tsukuba, 1-1-1 Tennodai, Tsukuba, Ibaraki
                  305-8572, Japan. 5 Institute of Vegetable and Floriculture Science, National Agriculture and Food Research Organization (NARO), Tsu, Mie 514-2392,
                  Japan. 6 Boyce Thompson Institute for Plant Research, Ithaca, NY 14853, USA. 7 State Key Laboratory of Agrobiotechnology, School of Life Sciences, The
                  Chinese University of Hong Kong, Hong Kong, China. 8 U.S. Department of Agriculture/Agriculture Research Service, Robert W. Holley Centre for
                  Agriculture and Health, Ithaca, NY 14853, USA. 9 Plant Biology Section, School of Integrative Plant Science, Cornell University, Ithaca, NY 14853, USA.
                  ✉email: ryoichi.yano.7814@gmail.com; ezura.hiroshi.fa@u.tsukuba.ac.jp

                  COMMUNICATIONS BIOLOGY | (2020)3:432 | https://doi.org/10.1038/s42003-020-01172-0 | www.nature.com/commsbio                                          1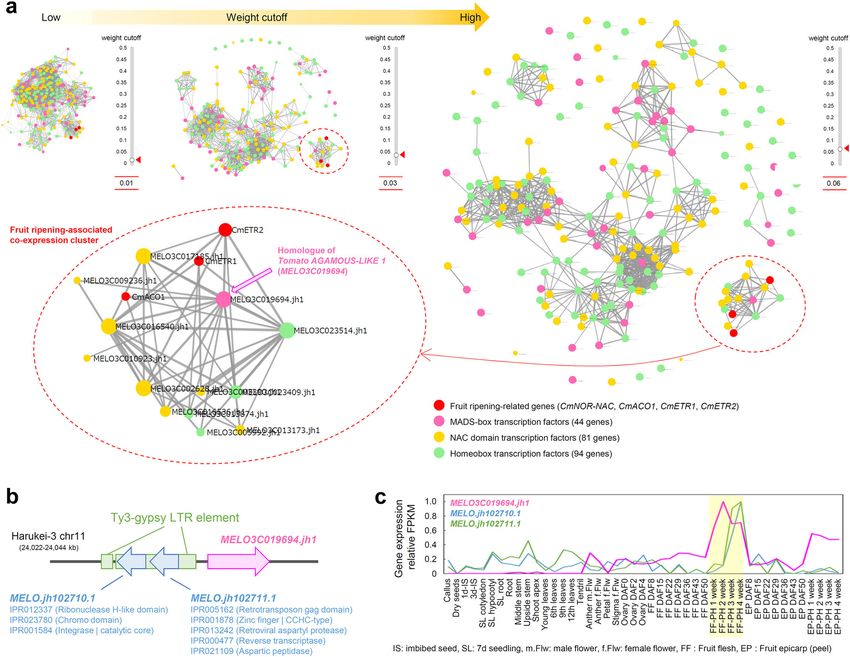
ARTICLE                                                              COMMUNICATIONS BIOLOGY | https://doi.org/10.1038/s42003-020-01172-0

M
           elon (Cucumis melo L.) is one of the most economically           dataset of the Melonet-DB (https://melonet-db.dna.affrc.go.jp/
           important fruit crops in the world and is a source               or https://gene.melonet-db.jp) by adding RNA-seq samples of
           of vitamins, minerals, and other health-promoting                ethylene-producing ripening fruit. In addition, the genomes of
substances. It is thought to have originally diversified in India            seven more melon accessions were sequenced and assembled
and Asia and is known to exhibit very wide natural variation,               by ONT at the contig level to conduct the assembly-based
especially in fruit phenotypes1–3. At least 19 horticultural sub-           PAP analysis of retrotransposon Gag-like sequences. Based on
groups and six major groups of melon have been identified.                   a combination of comparative genomics and comprehensive tran-
A particularly notable feature of melon is the coexistence of both          scriptome analysis, we suggest that retrotransposons played a role in
climacteric (ethylene-producing and showing a burst in respira-             the modification of gene expression as well as evolution of fruit-
tion at the onset of ripening) and non-climacteric fruit types4–6.          ripening-inducible gene expression during diversification of melon
For example, the French cultivar “Vedrantais”, belonging to                 genomes.
the subgroup var. cantalupensis, is well-known example of a cli-
macteric melon, whereas melons of the subgroup var. inodorus
(e.g., the American cultivars “Honey dew” and Spanish “Piel de              Results
Sapo”) are non-climacteric. The molecular mechanism of ethy-                Genome assembly and comparative genomics of Harukei-3
lene production has been intensively studied in melon, given                melon. Melon is usually described as producing sweet fruit;
the importance of this hormone in regulating climacteric fruit-             however, Harukei-3 produces considerably sweeter fruit than
ripening traits such as shelf life, which is of considerable eco-           other melon accessions if it is grown in the appropriate seasons
nomic importance7–11.                                                       (Supplementary Fig. 1). Indeed, the Japanese word “Harukei”
   The melon genome comprises 12 chromosomes, and its gen-                  means a line suitable for growing in the spring. As a consequence
ome size was estimated to be ~454 Mb based on the nuclear DNA               of its taste and attractive appearance (Fig. 1a), Harukei-3 has
content12. This is larger than the genomes of other cucurbit                been used for a long time in Japan as a standard melon to breed
plants such as Cucumis sativus (7 chromosomes, 367 Mb) and                  high-grade muskmelon. To investigate the genome structure of
Citrullus lanatus (11 chromosomes, 425 Mb). The first reported               Harukei-3, and to obtain functional gene information for future
whole genome sequence of melon was that of the experimental                 genetic studies and breeding, we assembled its genome sequence
line designated DHL9213, which was originally derived from a                by combining ONT ultra-long sequencing (R9.4.1 and R10),
cross between the non-climacteric “Piel de Sapo” (subsp. melo               Bionano optical map, Illumina Hiseq, mate pair, and linkage map
var. inodorus) and the Korean landrace “Songwhan Charmi”                    information (summarized in Supplementary Fig. 2). The ONT
(subsp. agrestis var. chinensis). A genomic DNA sequence of 417             platform yielded more long reads than did PacBio RSII, and these
Mb was published in the latest version of the DHL92 genome                  ONT long reads were used to generate a contig assembly with
reference (CM3.6.1), of which 337 or 79.6 Mb was the actual                 N50 = 8.6 Mb that was 10 times higher than that of the PacBio
nucleotide sequence or ambiguous bases (e.g., NNN), respec-                 contig (Fig. 1b and Supplementary Fig. 2). After scaffolding with
tively14. In addition, 29,980 protein-coding genes have been                the Bionano map and mate pair data, we obtained 80 ONT-based
reported in the genome annotation CM4.014. The DHL92 gen-                   genomic scaffolds with an N50 = 17.5 Mb. We also assembled the
ome reference has been utilized for supporting transcriptome                genomic scaffold based on PacBio RSII using the same procedure
analyses as well as quantitative trait loci (QTL) studies of                (N50 = 11.4 Mb). Using PacBio-based scaffolds as a hint to
important agricultural traits, including fruit ripening, fruit mor-         modify the ONT-based scaffolds, we obtained 66 genomic scaf-
phology, and disease resistance5,11,15–19. With decreasing costs            folds with a physical gap number of 92 and an N50 = 18.9 Mb.
of whole genome sequencing, several melon accessions have                   Finally, 12 chromosome sequences were constructed using
been sequenced and characterized using the Illumina short read              28 scaffolds based on linkage map information (Fig. 1c and
next-generation sequence (NGS) platform20,21. However, third                Table 1; Harukei-3 ver. 1.41 pseudomolecule). The chromosomal
generation sequencing technologies (e.g., PacBio RSII/sequel and            sequence lengths without ambiguous bases (e.g., NNN) from
Oxford Nanopore Technology [ONT]), implemented with single                  Harukei-3 (366.7 Mb) were much longer than those from DHL92
molecule sequencing that can generate long reads (e.g. >10 kb)              (318.2 Mb), reflecting the lower number of physical gaps in the
emerged as an alternative approach. Many plant genomes                      Harukei-3 genome sequence (Table 1). The chloroplast genome
have been assembled and/or re-evaluated using such newer                    was likely to be entirely assembled because we obtained two
DNA sequencers22–28, including the genome of the Chinese                    kinds of contigs with sequence lengths of 155 and 156 kb
inodorus melon cultivar Payzawat, which was sequenced                       (Table 1). When the Harukei-3 genomic sequence was compared
using a PacBio RSII platform29. In addition, such approaches                with the linkage map of Harukei-316, we observed complete co-
can provide insights into genome structural variation, as was               linearity between physical positions and linkage positions
demonstrated in Solanum lycopersicum using ONT ultra-long                   (Fig. 1d), indicating that the Harukei-3 genome sequence was
sequencing technology22.                                                    correctly assembled at a chromosome-scale. In contrast, when
   At present, little is known about genomic structural variation,          it was compared with the linkage map of other accessions or
especially copy number variation (CNV) and presence/absence                 sources13,30,31, the physical position did not match the linkage
polymorphism (PAP) in the genomes of melon subgroups. In this               map position of some markers (Supplementary Fig. 3), suggesting
current study, we assembled the whole genome sequence of the                chromosome-level structural differences between the genomes of
semi-climacteric Japanese cultivar “Earl’s Favorite Harukei-3”              melon accessions.
(Harukei-3; var. reticulatus) by coupling ultra-long ONT sequen-               We conducted genomic alignment of Harukei-3 and DHL92
cing (R9.4.1 + R10 flow cells) with Bionano optical mapping and              and while most of the alignment showed co-linearity, a large
Illumina mate pair sequencing. This melon shows moderate cli-               number of small genomic sequences were observed that might
macteric ripening behavior, although the rate of ripening is less than      have resulted from translocation across the chromosomes
that of the well-studied cultivar Charentais (var. cantalupensis)4.         between the two genomes (Fig. 1e). Additionally, the Harukei-3
ONT RNA-seq-based gene prediction coupled with other methods,               assembly revealed the duplication of a large genomic block
such as ab initio prediction, also identified 33,829 protein-coding          (>120 kb block repeat on chromosome 5 or 9), but this was not
genes whose protein BUSCO benchmark value was 1372 (95.3%).                 apparent in the DHL92 genome. We previously constructed the
We also expanded our tissue-wide transcriptome (RNA-seq)                    Harukei-3 genomic pseudomolecule based on PacBio RSII data;

2                         COMMUNICATIONS BIOLOGY | (2020)3:432 | https://doi.org/10.1038/s42003-020-01172-0 | www.nature.com/commsbio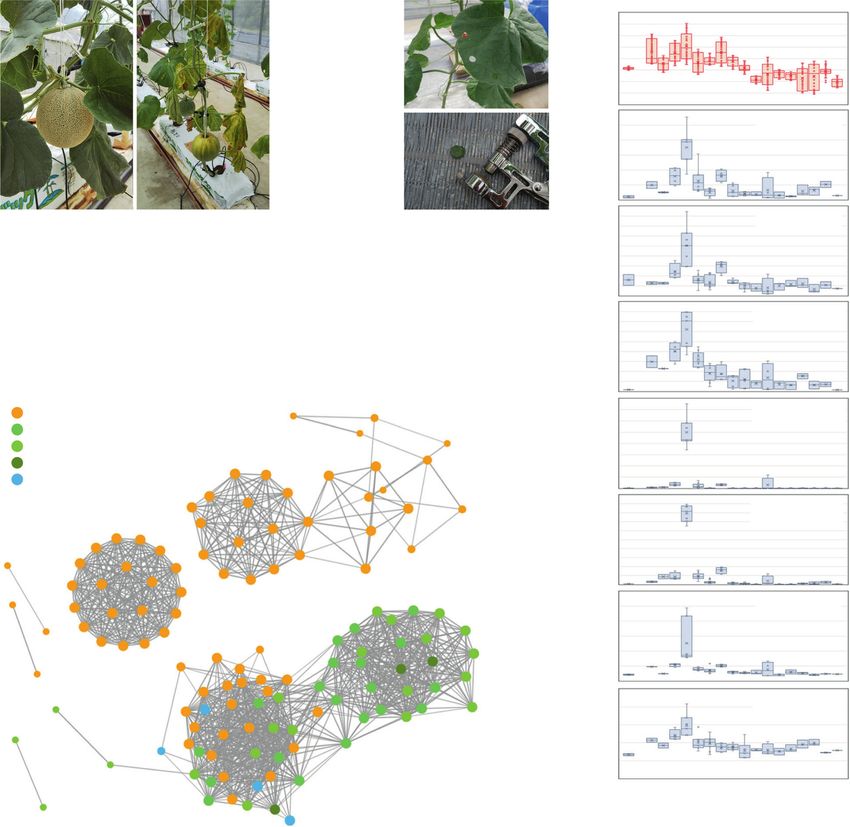
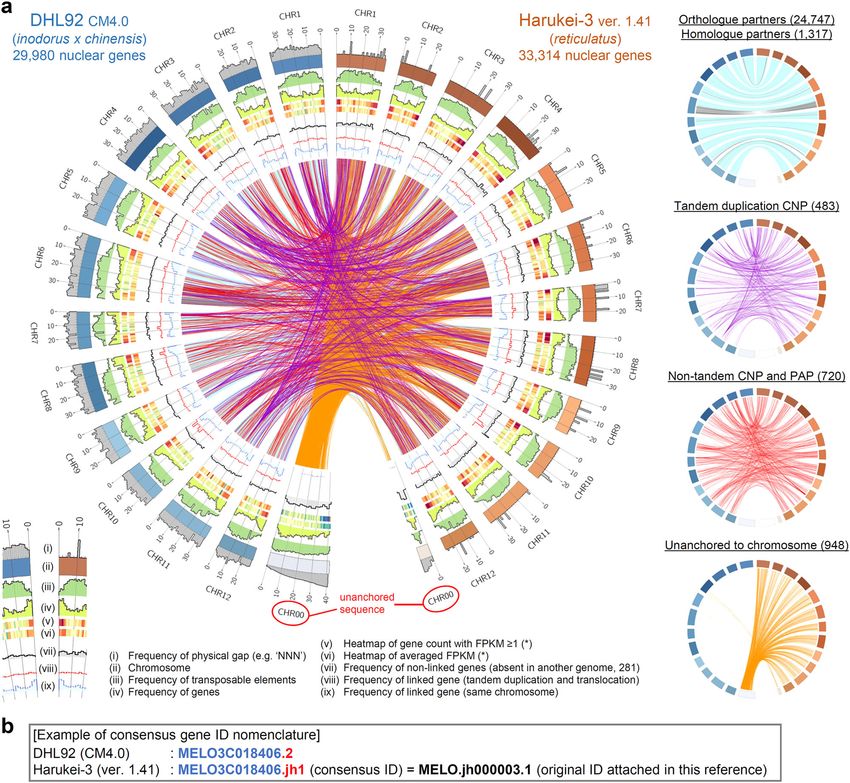
COMMUNICATIONS BIOLOGY | https://doi.org/10.1038/s42003-020-01172-0                                                                     ARTICLE

Fig. 1 Whole genome assembly of Harukei-3 melon. a Harukei-3 melon fruit. b Histograms of sequenced reads in Oxford Nanopore technology (ONT,
R9.4.1 and R10 flow cells) or PacBio RSII. Ultra-long reads with >60 kb are present only in ONT dataset. Reads with ≥5 kb were used for de novo assembly
(for detailed procedure see Supplementary Fig. 2). c Construction of the chromosome-scale pseudomolecule in Harukei-3. d Comparison between linkage
map and assembled pseudomolecule. Linkage maps were obtained in the genetic population derived from Harukei-3 and I-10 accessions16. Physical and
genetic positions of 167 markers are shown. e Genomic alignment between Harukei-3 and DHL92 genomes. Right panels show examples of large genomic
block duplication (>120 kb) that are present (or assembled) in the Harukei-3 genome. Blue and red dots indicate that DNA is aligned in forward or reverse
directions, respectively. Unanchored sequences are indicated by red rectangles.

however, this version of the genome assembly did not resolve                  in the Harukei-3 genome (e.g., simple sequence repeats and DNA/
the large genomic block duplication (Supplementary Fig. 4),                   RNA transposons). In total, 211 Mb of the Harukei-3 genomic
underlining the value of the ONT ultra-long reads in resolving                sequence was found to correspond to repetitive elements
the genomic structure. We also conducted a genomic alignment                  (Supplementary Data 2).
between Harukei-3 and the recently published genome of                           We next analyzed the gene partner relationship between
the inodorus melon, Payzawat, which was assembled based on                    Harukei-3 and DHL92 genomes based on bidirectional BLAST-n/
PacBio data29. This revealed a large genomic block duplication                p search41 and transcript alignment analysis with the BLAST-like
on chromosome 5 of Harukei-3 that was absent, or not                          alignment tool42 (Fig. 2a). Of the 33,314 nuclear genes of the
assembled, in the Payzawat genome (Supplementary Fig. 5).                     Harukei-3 genome, 24,747 and 1317 genes showed one-to-one
Other large genomic blocks were also absent in the Payzawat                   orthology or a homologous partner relationship, respectively,
genome (e.g., the upper part of chromosome 8).                                with DHL92 genes (Supplementary Data 3). We attached a
   To compare the genomes based on gene information, we newly                 consensus gene ID to the 24,747 orthologous genes of the
predicted genes in the Harukei-3 genomic sequence. We mainly                  Harukei-3 genome (a gene ID that starts with the “MELO3C”
used ONT RNA-seq for this purpose as ONT RNA-seq analysis                     string and ends with the “.jh1” string) to help maintain a
can yield nearly full-length sequence mRNA molecules (summar-                 consistent gene nomenclature among melon genomes (Fig. 2b).
ized in Supplementary Figs. 6, 7). By combining ab initio                     Although it is generally difficult to compare reference genomes
prediction (e.g., AUGUSTUS) and short read-based prediction                   that are generated by different sequencing technologies, 1203
(e.g., Braker2) as supplementary methods, we identified 33,829                 genes were identified as possible candidates for CNV and PAP
protein-coding genes in the Harukei-3 genome (33,314 nuclear                  (Fig. 2a, Supplementary Fig. 9a, Supplementary Data 4 and 5).
genes + 515 organelle genes). Both protein BUSCO benchmark                    Most of the unanchored DHL92 genes were also positioned on
analysis32 (ver. 3.0) and an InterProScan search33 indicated that             one of the 12 Harukei-3 chromosomes.
the Harukei-3 genome annotation represents a highly compre-                      In addition to the assembly level genome comparison,
hensive dataset of plant protein-coding genes compared with                   we resequenced six melon accessions (Harukei-3, Honey dew
published cucurbit genomes26–28,34–40 (complete BUSCO = 1372                  [var. inodorus], Spicy [var. cantalupensis], Manshuu and Ougon-9
[95.3%] and InterPro ID count = 5607; Table 2 and Supplemen-                  [var. makuwa], and JSS6 [C. agrestis, wild melon]) using Illumina
tary Data 1). In addition, we observed that our ONT-based gene                Hiseq for comparisons with the three melon genome references
prediction method gave accurate insights into exon-intron                     (Harukei-3, DHL92, and Payzawat). While Honey dew and Spicy
gene structure, whereas other methods (e.g., AUGUSTUS and                     are American melon accessions, Manshuu and Ougon-9 belong to
Braker2) gave incorrect assessments of structure in some genes                the Asian melon accession and JSS6 is a wild melon collected
(Supplementary Fig. 8). We also searched for repetitive elements              in Japan. Although the read alignment ratio was comparable

COMMUNICATIONS BIOLOGY | (2020)3:432 | https://doi.org/10.1038/s42003-020-01172-0 | www.nature.com/commsbio                                            3
ARTICLE COMMUNICATIONS BIOLOGY | https://doi.org/10.1038/s42003-020-01172-0
between the three genome references, the Harukei-3 reference
Gene count
showed slightly better alignment ratios relative to the other two
Table 1 Summary of assembled sequence lengths and predicted genes in the Harukei-3 genome. DNA sequence lengths of each chromosome and unanchored sequence are
2235
2016
2535
1967
2229
2847
1801
2021
2807
2064
2833
2569
2056
28,013
genome references in the resequencing data of Harukei-3 itself,
Honey dew, and Spicy (Supplementary Fig. 10a). In contrast, the
DHL92 reference showed better alignment ratios in comparison
compared between Harukei-3 ver. 1.41 reference (left) and DHL92 CM3.6.1/4.0 reference (right). In Harukei-3, organelle genomes are assembled as one scaffold.
to the other two references in the case of makuwa and wild
1887
2260
2079
1864
1577
2099
1735
22,445
1594
1536
1540
22,207
2273
2001
melon. Unlike the alignment ratio, the number of polymorphisms
Gap
(single nucleotide polymorphisms (SNPs) and small insertions/
deletions (Indels)) that were predicted to affect protein amino
acid sequence was highly variable between the Harukei-3 and
DHL92 references (Supplementary Fig. 10b). These results
Undetermined
(“NNN”, kb)
underlined the importance of using several genome references
in the resequencing study.
4428
4822
5747
5286
4557
5786
5605
22,465
6313
3958
3865
3273
3573
57,212
Co-expression analysis of fruit-ripening-inducible genes. Since
Harukei-3 fruit produce ethylene during ripening, we investigated
Determined (kb)
ethylene-related gene expression in Harukei-3 and updated the
tissue-wide melon RNA-seq transcriptome dataset of Yano et al.18
31,291
29,761
26,381
24,896
31,984
23,792
24,137
23,699
28,980
22,706
21,670
28,852
318,148
19,177
by adding data derived from ethylene-emitting ripe fruit (Fig. 3a).
Alignment ratios of RNA-seq reads were much higher in
Harukei-3 genome reference than in DHL92 probably because the
RNA-seq data were obtained from Harukei-3 itself. We identified
27,687 Harukei-3 genes with Fragments Per Kilobase of exon per
Total (kb)
27,065
375,360
41,642
34,318
38,297
37,038
31,667
25,243
29,324
28,958
26,664
34,457
34,765
27,564
Million mapped fragment (FPKM) values ≥ 0.1 (Supplementary
Fig. 11, Supplementary Data 6 and 7). Such high-sensitive
detection of gene expression level enabled high-resolution co-
expression analysis, and weighted genome-wide correlation net-
work analysis43 (WGCNA) identified >60 co-expression clusters,
Unanchored
(CM3.6.1/
including those specific to ripening fruit (Supplementary Fig. 12).
DHL92
We also updated the Melonet-DB web-application tools, “Gene
chr04
chr06
chr08
chr09
chr02
chr05
chr07
chr03
chr01
chr10
chr12
Total
chr11
4.0)
expression map viewer” (https://melonet-db.dna.affrc.go.jp/ap/
mvw) and “Co-expression viewer” (https://melonet-db.dna.affrc.
go.jp/ap/mds) (Supplementary Figs. 13, 14, and 15). In the newer
Gene count
dataset, up-regulation of ethylene-related genes (e.g., CmACO1,
CmETR1/2, and CmNOR-NAC) in ripe fruit was observed
3243
2493
3660
2617
2701
82
50
3703
2798
2588
3307
2603
3580
2801
36,094
645
317
66
(Fig. 3b), consistent with ethylene production by the Harukei-3
fruit. Further co-expression analysis, including not only known
ethylene-related genes but also 81 NAC domain, 90 homeobox,
and 42 MADS-box transcription factors, identified a co-
Gap
9
12
6
6
0
0
0
11
43
16
4
2
10
7
4
7
94
5
expression cluster that was specific to fruit ripening (Fig. 4a).
In the central region of this cluster, we identified an AGAMOUS-
like gene, MELO3C019694.jh1, which is a homolog of Tomato
AGAMOUS-LIKE 1 (TAGL1); a gene that has been shown to
Undetermined
(“NNN”, kb)
be involved in regulating fruit ripening44,45. Zhao et al.21 also
recently identified this melon gene as a candidate QTL that
116
393
396
130
360
271
3625
5170
595
416
126
348
236
239
24
0
0
0
regulates fruit suturing. A comparison of the Harukei-3 and
DHL92 genomes indicated that Harukei-3 carries a longer
protein-coding transcript of MELO3C019694 relative to that
of DHL92, and its expression was higher in ripe fruit than in pre-
Determined (kb)
ripe fruit (Supplementary Fig. 16). When the genome sequences
flanking MELO3C019694 were analyzed using the Harukei-3
24,882
36,514
2045
29,911
28,643
29,488
34,011
3249
155
36,524
26,893
366,542
33,842
27,296
33,922
24,615
156
96
genome reference, the upstream promoter region of
MELO3C019694 was found to contain two Ty3-gypsy LTR-ret-
roelements (Fig. 4b; chr11, 24,022,719–24,024,675 bp [1956 bp]
and 24,024,698–24,031,639 bp [6941 bp]). Around this genomic
region, two protein-coding sequences were identified. One of
Total (kb)
24,998
30,037
34,190
29,725
27,657
155
36,940
24,854
36,910
34,052
7215
34,404
156
96
28,914
27,488
3273
370,168
them, MELO.jh102711.1, encodes a protein sequence with
retrotransposon-related protein domains such as IPR005162
(retrotransposon Gag domain), IPR013242 (retroviral aspartyl
protease), and IPR000477 (reverse transcription). Together with
LTR/gypsy elements, these sequences appear to function as LTR
Mitochondria
Chloroplast2
Chloroplast3
Chloroplast1
Unanchored
retrotransposons. According to the tissue-wide transcriptome
(ver. 1.41)
Harukei-3
dataset, MELO3C019694 and the neighboring retrotransposon-
chr04
chr06
chr08
chr09
chr02
chr05
chr07
chr03
chr01
chr10
chr12
Total
chr11
related protein-coding sequences (e.g., MELO.jh102711.1) showed
4 COMMUNICATIONS BIOLOGY | (2020)3:432 | https://doi.org/10.1038/s42003-020-01172-0 | www.nature.com/commsbio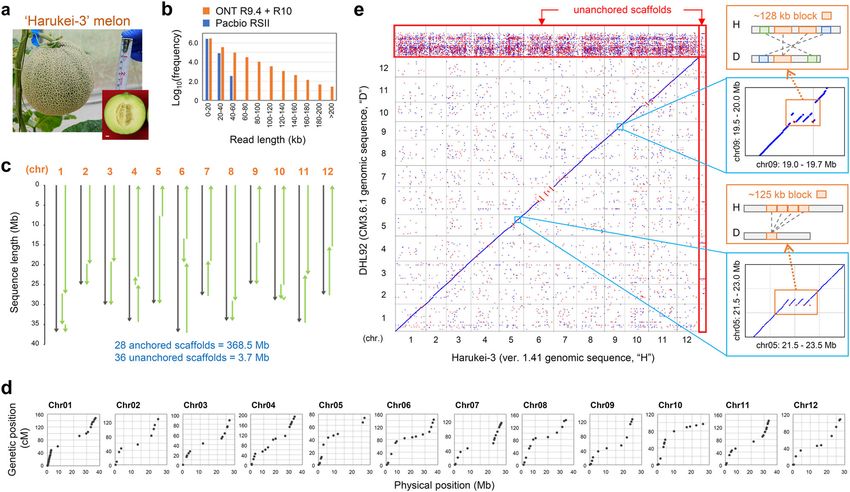
COMMUNICATIONS BIOLOGY | https://doi.org/10.1038/s42003-020-01172-0 ARTICLE
Table 2 Harukei-3 genome annotation contains comprehensive set of plant protein-coding genes. Completeness of protein-
coding gene dataset was assessed by protein BUSCO benchmark ver. 3.032 and InterProScan33, and the BUSCO benchmark
scores and the counts of identified GO and InterPro ID are compared between Harukei-3 and other genomes including 12
published cucurbit genomes.
Protein- Protein BUSCO benchmark (ver. 3.0) GO/InterProScan ID count
coding gene
Genome reference (annotation version) Complete Fragmented Missing GO: BP GO: MF GO: CC InterPro ID
Cucumis melo (var. reticulatus, Harukei-3 33,829 1372 (95.3%) 16 52 638 845 200 5607
ver. 1.41)
Cucumis melo (var. inodorus x conomon, 29,980 1257 (87.3%) 68 115 625 833 198 5533
DHL92 CM4.0)14
Cucumis melo (var. inodorus x conomon, 27,427 1175 (81.6%) 85 180 631 839 196 5515
DHL92 CM3.5)13
Lagenaria siceraria (USVL1VR-Ls)34 22,472 1233 (85.6%) 85 122 615 830 192 5381
Cucumis sativus (PI183967)39 22,790 1309 (90.9%) 45 86 626 836 198 5537
Cucumis sativus (Gy14, v1)40 21,503 1286 (89.3%) 53 101 632 847 201 5511
Cucumis sativus (Chineese Long, v3)26 24,317 1314 (91.3%) 38 88 628 841 200 5570
Cucurbita argyrosperma35 28,298 1268 (88.1%) 75 97 618 828 194 5426
Cucurbita moschata (Rifu ver. 1.1)36 32,205 1333 (92.6%) 37 70 627 841 200 5546
Citrullus lanatus (97103 ver. 2)27 22,596 1313 (91.2%) 40 87 623 836 199 5498
Citrullus lanatus (Charleston Gray, v2)37 22,545 1298 (90.1%) 44 98 611 823 196 5418
Benincasa hispida var. B22728 27,467 1321 (91.7%) 43 76 632 841 197 5505
Cucurbita maxima (Rimu ver. 1.1)36 32,076 1338 (92.9%) 31 71 632 841 200 5551
Cucurbita pepo38 27,868 1232 (85.6%) 55 153 610 823 195 5411
Arabidopsis thaliana (Col-0 TAIR10) 27,416 1432 (99.4%) 3 5 621 838 199 5618
Solanum lycopersicum (Heinz1706 34,075 1348 (93.6%) 45 47 636 853 200 5628
ITAG4.0)24
BP biological process, MF molecular function, CC cellular component
similar expression patterns, with the highest levels in post-harvest analysis between Harukei-3 and other melons indicated that
ripening fruits (Fig. 4c). there are PAPs in these retrotransposon Gag-like sequences;
some were conserved between melon accessions (e.g., MELO.
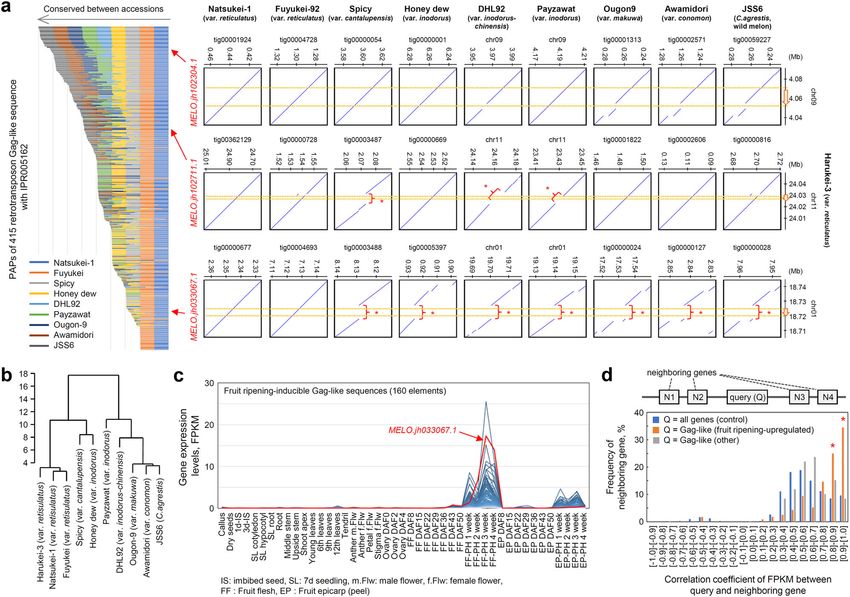
PAPs and the expression of retrotransposon Gag sequences. jh102304.1) while others were not conserved and/or present in
The presence of the LTR retrotransposons in the upstream pro- specific melons (e.g., MELO.jh102711.1 and MELO.jh033067.1)
moter sequence of MELO3C019694.jh1 (SlTAGL1 homolog) in (Fig. 5a). A hierarchical clustering analysis based on the PAP
the Harukei-3 genome prompted us to perform an enrichment genotype dataset indicated that Natsukei-1 and Fuyukei melons
analysis of CNV and PAP candidates (1,203 genes or putative are much closer to Harukei-3 compared to other accessions,
protein-coding sequences) found between Harukei-3 and DHL92 which is consistent with the fact that they have the same
genomes (Fig. 2a). For the purpose, a web-application tool, origin (a reticulatus melon imported from the United Kingdom
designated “GO term enrichment analysis”, was developed for the around 100 years ago) (Fig. 5b). By contrast, the Asian melons
Melonet-DB database (https://melonet-db.dna.affrc.go.jp/ap/got). Awamidori, Ougon-9, and JSS6 are distant from such reticulatus
This revealed several InterPro IDs (IPRIDs) that are usually melons. This result indicated that the PAP datasets obtained by
observed in retrotransposon-related function to be enriched in assembly-based analysis reflect genomic variation between
the 1203 candidates (e.g., IPR005162, IPR013242, and IPR000477; melon cultivars and accessions.
Supplementary Fig. 9b). This suggested that retrotransposons Then, tissue-wide gene expression patterns were analyzed
have been copied or jumped across chromosomes during diver- in 415 retrotransposon Gag-like sequences. Interestingly, 160
sification of the melon genome. Such structural difference should (38.6%) showed fruit-ripening-inducible expression with the
be detected in the form of PAPs between genomes if genome highest levels in post-harvest fruit samples (Fig. 5c). One of
sequences are aligned and compared at a relatively narrow range them, MELO.jh033067.1, was present only in reticulatus melons,
(e.g., 50–100 kb). To analyze the PAPs of retrotransposon-related but it showed higher expression levels in ripening fruits than did
sequences in such a manner, we sequenced seven more melon other genes (Fig. 5a, c). As described above, the expression
genomes by using the ONT R9.4.1 platform. Genome assemblies pattern of MELO.jh102711.1, a Gag-like sequence, is similar to
were obtained as contig datasets for Natsukei-1 (var. reticula- that of the neighboring gene, MELO3C019694 (Fig. 4c). Thus, to
tus), Fuyukei (var. reticulatus), and Awamidori (var. conomon) investigate whether neighboring genes are co-expressed with Gag-
in addition to Spicy, Honey dew, Ougon-9, Awamidori, and JSS6 like sequences, the correlation of gene expression was analyzed in
(wild melon). The N50 values for the contig assemblies a genome-wide manner. The result indicated that 59.4% of genes
were more than 3.5 Mb, with a maximum value of 10.1 Mb neighboring fruit-ripening-inducible Gag-like sequences also
(Supplementary Fig. 17), indicating that they were sufficient for showed similar expression patterns (Fig. 5d and Supplementary
local genomic sequence alignment analysis. According to Data 8; Pearson’s correlation coefficient r > 0.8). In contrast, in
the Harukei-3 ver. 1.41 genome reference, there are at least the case of other Gag-like sequences, the degrees of correlation
415 putative protein-coding sequences with IPR005162 (retro- between the Gag-like sequences and the neighboring genes were
transposon Gag domain). Assembly-based sequence alignment the same levels as the control.
COMMUNICATIONS BIOLOGY | (2020)3:432 | https://doi.org/10.1038/s42003-020-01172-0 | www.nature.com/commsbio 5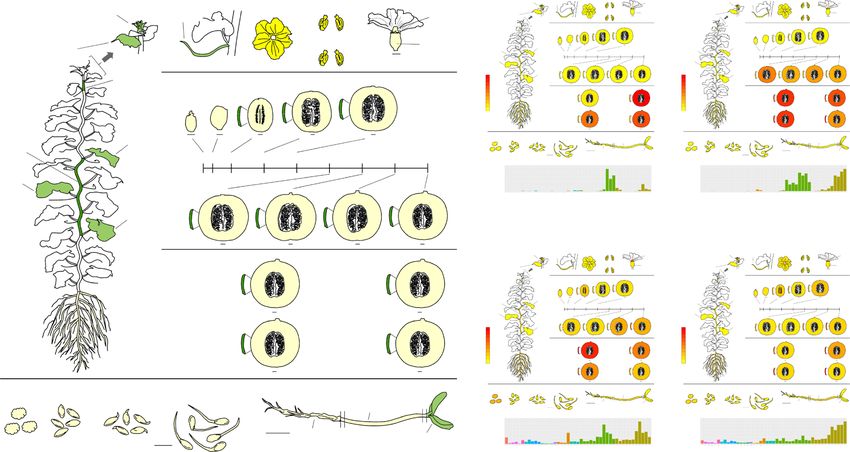
ARTICLE                                                                 COMMUNICATIONS BIOLOGY | https://doi.org/10.1038/s42003-020-01172-0

Fig. 2 Comparison of Harukei-3 and DHL92 genome references. a A circos plot comparing Harukei-3 and DHL92 genomes. Frequencies of physical gap
[i], transposable elements [iii], predicted genes [iv], genes absent in either genome [vii], candidate genes for copy number variation (CNV) and presence/
absence polymorphism (PAP) [viii], orthologue and homologue partners [ix] are drawn in the plot together with the chromosome [ii], heatmaps of gene
count with FPKM (Fragments Per Kilobase of exon per Million mapped fragments; gene expression levels) ≥ 0.1 [v] or averaged FPKM [vi] in the tissue-
wide transcriptome dataset shown in Fig. 3. Orthologous or homologous gene partners are shown by links in the center of the plot (also shown in the right
panels). One-to-one orthologous gene partners (24,747 links) or homologous partners (1317 links) are indicated by blue and gray lines in which blue line
indicate that genes are located at the same direction while gray lines indicate the opposite direction. Purple, red, and orange links indicate 483 tandem
duplication CNVs, 720 non-tandem CNVs and PAPs, and 948 genes that are unanchored in either genome, respectively. b Gene ID nomenclature in the
Harukei-3 ver. 1.41 genome reference. Consensus gene ID that starts with “MELO3C” string are attached to 24,758 Harukei-3 genes that have one-to-one
orthologues in DHL92 genome.

Heat-inducible expression of retrotransposon Gag sequences.                   stress damage (Fig. 6a). In contrast, Harukei-3 plants grown
There is increasing evidence that the expression of plant                     during a cooler period (e.g., before midsummer or after Sep-
retrotransposon-related sequences is up-regulated by abiotic and              tember) had thick leaves with a dense green color, and produced
biotic stress46–48. To investigate the environmental response of              sweeter melon fruit (Fig. 6a and Supplementary Fig. 1). We
Harukei-3 retrotransposon-related sequences, we performed a                   generated transcriptome data corresponding to a total 75 time
field transcriptome analysis of leaf samples collected weekly from             points and 18 independent plants (Supplementary Data 9).
plants grown in a greenhouse at the University of Tsukuba from                WGCNA clustering using this dataset indicated that the retro-
early summer to late autumn. In Japan, midsummer is not an                    transposon Gag-like sequences were co-expressed with heat shock
appropriate season for melon cultivation because the temperature              protein genes that carry the signature of HSP20-like chaperones
inside the greenhouse sometimes exceeds 45 °C. Indeed, Harukei-               (Fig. 6b, c). Homologs of Arabidopsis thaliana stress response
3 plants grown during midsummer showed severe signs of heat                   regulators (e.g. ABSCISIC ACID RESPONSIVE ELEMENT

6                           COMMUNICATIONS BIOLOGY | (2020)3:432 | https://doi.org/10.1038/s42003-020-01172-0 | www.nature.com/commsbio
COMMUNICATIONS BIOLOGY | https://doi.org/10.1038/s42003-020-01172-0 ARTICLE
a (+)
Anther
[female]
Anther
[male]
b MELO3C014437 (CmACO1) MELO3C016540 (CmNOR-NAC)
SA Tn Pt Am St SA Tn Pt Am St
Tendril (Af) (Am) Stigma
(+) Petal (Pt) Ov Ov
Shoot apex (Tn) (St) YL Af YL Af
(SA) S2 FD S2 FD
Ovary
Young leaves (Ov) S1 TL S1 TL
(YL) TL TL
DAF0 [before pollination]
Stem high high
TL TL
[upside] Fruit development (FD) fl
fl
FPKM
FPKM
(S2) fl ep PH PH
ep
ep 1w 2w 1w 2w
Rt Rt
low low
3w 4w 3w 4w
True leaf Cl DS G1 G3 Cl DS G1 G3
sH sH
Stem (TL) (el: epicarp, fl: flesh)
(S1) [12th] sR sC sR sC
DAF 2 4 8 15 22 29 36 43 50
5000 1000
FPKM
FPKM
True leaf
(TL) fl fl
fl fl 0 0
[9th] ep
ep ep ep Non-fruit tissues Fruit tissues Non-fruit tissues Fruit tissues
True leaf
(TL)
[6th]
MELO3C006451 (CmETR2) MELO3C003906 (CmETR1)
SA Tn Pt Am St SA Tn Pt Am St
Post harvest (PH) fl fl
ep ep YL Af Ov YL Af Ov
(+) 1-week stored (+) 2-week stored S2 FD S2 FD
[ethylene emitting] [ethylene emitting]
Root S1 TL S1 TL
(Rt) TL TL
fl fl
high high
ep ep TL TL
(+) (+)
FPKM
FPKM
3-week stored 4-week stored PH PH
[ethylene emitting] [ethylene emitting] 1w 2w 1w 2w
Rt Rt
low low
3w 4w 3w 4w
(+) (+) Seedling (7d after imbibition)
Germinating seed Germinating seed Cl DS G1 G3 sH Cl DS G1 G3 sH
(1d imbibition, G1) (3d imbibition, G3) (+) Hypocotyl (sH) sR sC sR sC
FPKM
FPKM
300 300
(+) (+) Cotyledon
Root
(sR) (sC) 0 0
Callus Dry seed
(Cl) (DS) Non-fruit tissues Fruit tissues Non-fruit tissues Fruit tissues
(+) newly added RNA-seq samples Fruit flesh (DAF2, 4, 8, 15, 22, 29, 36, 43, 50 + post harvest 1, 2, 3, 4 week)
Fruit epicarp (DAF2, 4, 8, 15, 22, 29, 36, 43, 50 + post harvest 1, 2, 3, 4 week)
Fig. 3 Tissue-wide transcriptome (RNA-seq) dataset in Harukei-3 melon. a A cartoon illustrating the updated tissue-wide RNA-seq dataset of Harukei-3
melon. RNA-seq of post-harvest ripening fruit (flesh: 4, epicarp: 4), shoot apex, female flower anther, imbibed seeds (1 and 3 days after imbibition), and 7-
day seedlings (root, hypocotyl, cotyledon) were newly added to the previous dataset18. b Gene expression patterns of known fruit-ripening-related genes
(CmACO1, CmETR1 and 2, CmNOR-NAC) in the updated tissue-wide transcriptome dataset. A new version of “Gene expression map viewer” in Melonet-DB
(https://melonet-db.dna.affrc.go.jp/ap/mvw) was used to obtain the electro-fluorescent pictogram images.
BINDING FACTOR 3 [AtABF3] and DREB AND EAR MOTIF retrotransposon Gag-like sequences, including MELO.jh33067.1,
PROTEIN 2 [AtDEAR2]) were also co-expressed with these Gag- showed the up-regulation of expression in ethylene-producing
like sequences (Fig. 6c, d), indicating that melon plants grown ripening fruits (Fig. 5c). Moreover, 59.4% of genes neighboring
during midsummer experienced drought stress, in addition to the fruit-ripening-inducible Gag-like sequences were co-
heat stress. Taken together, these results suggested that some expressed with the retrotransposon Gag-like sequences. There-
retrotransposon Gag-like sequences were responsive to abiotic fore, it is possible that the region of LTR retrotransposon around
stress such as heat stress. Gag-like sequences carry cis-acting and/or enhancer DNA ele-
ments that induce fruit-ripening-inducible gene expression. It
seems also possible that ethylene production indirectly drives the
Discussion transcription of Gag-like sequences. In plants, the biosynthesis of
In this study, our assembly-based genome sequence comparison ethylene is also known to be stimulated under abiotic conditions,
clearly demonstrated that there is a substantial PAPs in retro- including heat stress51. Indeed, some of the Gag-like sequences
transposon Gag-like sequences between melon genomes. For were also up-regulated upon heat stress in melon (e.g., MELO.
example, one of the Gag-like sequences, MELO.jh33067.1, is jh33067.1 in Fig. 6d). In A. thaliana, heat-inducible transcription
present in the genome of reticulatus melons (e.g., Harukei-3, of the retrotransposon ONSEN is regulated through small inter-
Natsukei-1, and Fuyukei) but is absent from those of some fering RNA52,53, and an epigenetic regulatory mechanism may
melons, such as DHL92 and Payzawat (Fig. 5a). The genetic similarly be involved in the regulation of LTR retrotransposon in
relationship was also well reflected in the hierarchical clustering melon. It is possible that such mechanism is a driving force to
dendrogram based on the PAP genotype dataset (Fig. 5b), diversify the genome not only in melon but also in other plants.
demonstrating that our assembly-based approach is successful to The same also may be applicable to MELO3C019694.jh1, which
analyze genome-wide PAPs between genomes. There is growing is a homolog of tomato AGAMOUS-like gene SlTAGL1, a reg-
evidence that some plant LTR retrotransposons, which are clas- ulator of fruit ripening. Recently, Zhao et al.21 reported that
sified into the subfamilies gypsy and copia, exhibit stress- MELO3C019694.jh1 gene expression levels were higher in the
inducible transcription46–48. The phytohormone ethylene has sutured melon Vedrantais (var. cantalupensis) than in non-
also been shown to be involved in stress-induced expression of sutured Piel de Sapo (var. inodorus) at 7 days after pollination21.
retrotransposon in Solanum chilense49. If a retrotransposon Here, we identified this gene as a possible regulator of fruit
is inserted into a promoter region, it may affect constituent ripening as it is co-expressed with known ethylene-related fruit-
cis-acting elements, which in turn may alter or enhance the ripening genes such as CmACO1 and CmNOR-NAC (Fig. 4a).
transcriptional response of downstream genes to environmental Since Vedrantais and Piel de Sapo are well-known climacteric and
and/or developmental signals50. Interestingly, most of the non-climacteric melons, respectively, it is possible that the
COMMUNICATIONS BIOLOGY | (2020)3:432 | https://doi.org/10.1038/s42003-020-01172-0 | www.nature.com/commsbio 7ARTICLE COMMUNICATIONS BIOLOGY | https://doi.org/10.1038/s42003-020-01172-0
Fig. 4 Identification of a long terminal repeat (LTR) retrotransposon in the promoter region of MELO3C001864, a potential core regulator of fruit
ripening. a Co-expression analysis of four known fruit-ripening-related genes with 81 NAC domain, 90 homeobox, and 42 MADS-box transcription factors
based on the updated tissue-wide transcriptome dataset. In the updated version of “Co-expression viewer” in the Melonet-DB (https://melonet-db.dna.
affrc.go.jp/ap/mds), the weight cutoff value is changeable in a real-time manner with the slider bar function present in the interface window. At weight
cutoff = 0.06, one co-expression cluster, including known fruit-ripening-related genes, is detached from other clusters (shown by dashed red circles).
A melon homologue of Tomato AGAMOUS-LIKE 1 (TAGL1), MELO3C019694, is positioned at the center of this fruit-ripening-associating co-expression
cluster (indicated by pink-filled arrow). b Schematic illustration of the genomic region around MELO3C019694. Two long terminal repeat (LTR)/gypsy
elements (1956 bp and 6941 bp) are identified by RepeatMasker in the promoter region of MELO3C019694 in Harukei-3 genome (Supplementary Data 2).
Around this region, two retrotransposon-related protein-coding sequences were located: MELO.jh102710.1 and MELO.jh102711.1. c Tissue-wide gene
expression patterns of MELO3C019694 and neighboring retrotransposon-related sequences. Their expression levels were highest in post-harvest ripening
fruits (indicated by a yellow box).
difference in gene expression levels is associated not only with gene prediction, which is important for gene-based comparative
fruit suturing but also with ripening behavior (e.g., presence of genomics study (Fig. 2a). In particular, multiple ONT genome
ethylene production). Interestingly, the upstream promoter assemblies seem essential to analyze PAPs in a genome-wide
region of MELO3C001864.jh1 in the Harukei-3 genome also manner (Fig. 5a). Information related to the Harukei-3 genome
carries at least one LTR retrotransposon insertion (e.g., MELO. assembly, genome annotation, and the transcriptome dataset
jh102711.1). Given that this LTR retrotransposon is absent from obtained in this study can be accessed using our updated web-
the genomes of some melons such as DHL92 and Payzawat application tools in the Melonet-DB database (https://melonet-
(Fig. 5a), it is possible that such PAP of the retrotransposon db.dna.affrc.go.jp/). Together with future updates, this database
insertion is also involved in variation of gene expression levels will contribute to functional genomic study of melon, especially
between melon cultivars. Additional studies, using genome edit- reverse genetics study using the genome editing technique and
ing and/or comparative transcriptomics, will clarify the detailed TILLING mutant population.
role of this LTR retrotransposon in fruit ripening.
In this study, we present evidence that assembly level genome
comparisons can elucidate structural genomic variation, including Methods
PAPs, as well as large genomic block duplications. ONT-based Plant materials and growth conditions. Seeds of cultivated melon accession,
Harukei-3 (C. melo var. reticulatus), Natsukei-1 (var. reticulatus), Fuyukei (var.
assembly successfully resolved structural variation (Figs. 1e, 2a, reticulatus), Honey dew (var. inodorus), Spicy (var. cantalupensis), Manshuu (var.
and 5a) and we show that ONT is also useful for genome-wide makuwa), Ougon-9 (var. makuwa), Awamidori (var. conomon), and wild melon,
8 COMMUNICATIONS BIOLOGY | (2020)3:432 | https://doi.org/10.1038/s42003-020-01172-0 | www.nature.com/commsbioCOMMUNICATIONS BIOLOGY | https://doi.org/10.1038/s42003-020-01172-0 ARTICLE
Fig. 5 Presence/absence polymorphism (PAP) and fruit-ripening-inducible expression of retrotransposon Gag-like sequences. a Assembly-based PAP
analysis of 415 retrotransposon Gag-like sequences between melon genomes. PAP was analyzed based on genomic DNA alignment using Harukei-3 as a
reference. Except for the DHL92 and Payzawat genomes, genomic contigs were newly assembled based on the Oxford Nanopore technology sequencing
data. The left graph shows the summary of the PAP analysis while the right panels show some examples of genomic alignments. In the right panels,
genomic regions that are present in Harukei-3 but absent in other melons are indicated by red arrows and parentheses. In each alignment, the positions of
Gag-like sequences are shown by yellow dashed lines. b A hierarchical clustering of 10 melon genomes based on the PAP genotyping dataset of Gag-like
sequences. The PAP data of 415 Gag-like sequences shown in (a) were subjected to R-hclust analysis. c Fruit ripening-inducible expression of Gag-like
sequences. Of the 415 Gag-like sequences found in the Harukei-3 genome, 160 show fruit-ripening-inducible expression. The expression of MELO.
jh033067.1 that was present in reticulatus melons but absent in other melons was strongly up-regulated in post-harvest ripening fruits (red arrow). d A
histogram showing the correlation of gene expression between the Gag-like sequence and its neighboring genes. Correlation coefficients were calculated
based on Fragments Per Kilobase of exon per Million mapped fragments (FPKM; gene expression levels) values from the tissue-wide transcriptome dataset
shown in Fig. 3. Three different groups of queries were analyzed; all genes (control), fruit-ripening-inducible Gag-like sequences, and other Gag-like
sequences (not up-regulated in ripening fruits, control). In the case of fruit-ripening-inducible Gag-like sequences, co-expression was observed for 59.4%
of the neighboring genes (red asterisks).
JSS6 (C. agrestis), were obtained from the Genebank of the National Agriculture Nanopore Minion® device coupled with flow cell. For the genome sequencing of
and Food Research Organization (NARO) in Japan. Melon plants were grown Harukei-3, both R9.4.1 and R10 flow cells were used, whereas only R9.4.1 was used
using the hydroponics method in the greenhouse of the University of Tsukuba in in the sequencing of Natsukei-1, Fuyukei, Spicy, Honey dew, Awamidori, and JSS6.
Japan as previously reported18. For genomic DNA sequencing, apexes of branched ONT flow cells were repetitively used at least twice with the same DNA library.
shoots were detached from plants and immediately frozen in liquid nitrogen. For To obtain DNA sequence data, basecalling was performed using a CUDA-enabled
tissue-wide RNA-seq study, tissues shown in Fig. 3a and Supplementary Fig. 6 were GPU server with ONT’s guppy ver. 3.3.0 software. For PacBio RSII and Illumina
similarly obtained and frozen in liquid nitrogen. For field RNA-seq study, hole- paired end (PE) sequencing, the outsourcing service of Macrogen Japan Co. Ltd
punched leaf samples were also collected in a weekly manner from July to (Kyoto, Japan). was used except the Illumina PE data of Harukei-3 that was
November as shown in Fig. 6. These samples were crushed to powdery frozen obtained with a Hiseq-2000 sequencer at Cornel University. Illumina sequencing
samples using the Multi-beads shocker instrument (Yasui Kikai Corporation, was performed with the 100 bp PE mode in Harukei-3 or the 150 bp PE mode in
Osaka, Japan) and stored at −80 °C until use. Honey dew, Spicy, Manshuu, Ougon-9, and JSS6. Illumina mate pair sequencing
was performed with 5 kb and 10 kb insert libraries by using the outsourcing service
of Hokkaido System Science Co. Ltd. (Sapporo, Japan).
Genomic DNA isolation and DNA sequencing. Genomic DNA was isolated using
Maxwell® 16 Tissue DNA Purification Kit (Code No. AS1030, Promega, Wisconsin,
USA). Although this kit is designed to couple with an automated DNA extraction RNA isolation and RNA-seq data acquisition. Total RNA was isolated using
machine, we did not use this but manually isolated genomic DNA by hand to Maxwell® 16 LEV Plant RNA Kit (Code No. AS1430, Promega, Wisconsin, USA)
obtain long intact DNA. Isolated genomic DNA was further subjected to the Short according to the manufacturer’s protocol. For ONT direct RNA-seq and cDNA
read Eliminator XS kit (Circulomics, Maryland, USA) to remove short DNA RNA-seq, libraries were prepared using the Direct RNA sequencing kit (Code No.
fragments withARTICLE COMMUNICATIONS BIOLOGY | https://doi.org/10.1038/s42003-020-01172-0
a ‘Non-stressed’ Harukei-3 ‘Heat-stressed’ Harukei-3 d Midsummer
in Japan
45.3 ºC
(highest temp)
50
greenhouse, ºC
Temperature in
[Field RNA-seq] 40
Continuous leaf disk 30
sampling (once a week)
20
10
MELO.jh033067.1
Total 75 points 0.25
(retrotransposon Gag-like)
from 18 plants 0.20
(July to November) 0.15
0.10
0.05
0
4.0 MELO3C022607.jh1
(retrotransposon Gag-like)
b Enriched ID Fisher’s exact test Num
3.0
Information of GO ID 2.0
(Interproscan ID) p-value q-value gene
IPR008978 2.07E-06 4.87E-04 HSP20-like chaperone 8 1.0
IPR002068 1.25E-06 4.87E-04 Alpha crystallin/Hsp20 domain 8
0
IPR001584 1.28E-05 2.00E-03 Integrase | catalytic core 32
IPR016197 1.62E-04 1.90E-02 Chromo domain-like 12 40 MELO3C018458.jh1
Gene expression level, FPKM (75 leaf RNA-seq samples in the greenhouse)
IPR023780 2.04E-03 1.92E-01 Chromo domain 18 (AtABF3 like)
IPR012337 2.65E-03 1.98E-01 Ribonuclease H-like domain 33 30
IPR001128 4.85E-03 1.98E-01 Cytochrome P450 11 20
IPR016161 1.69E-02 1.98E-01 Aldehyde/histidinol dehydrogenase 3
IPR008927 1.55E-02 1.98E-01 6-phosphogluconate dehydrogenase | C-terminal-like 3 10
0
c Retrotransposon Gag-like MELO3C034119.jh1
6000 (HSP20 like)
HSP20-like gene
heat shock protein gene
3000
heat shock transcription factor
Stress response-related gene
0
1800 MELO3C005923.jh1
(AtHSP21 like)
1200
600
0
MELO3C027079.jh1
(AtHSFA3 like)
40
20
0
MELO3C007573.jh1
20 (AtDEAR2 like)
15
10
5
0
6th Jul
20th Jul
27th Jul
3th Aug
7th Sep
2nd Nov
9th Nov
10th Aug
17th Aug
24th Aug
31th Aug
14th Sep
28th Sep
5th Oct
19th Oct
26th Oct
12nd Oct
21st Sep
Heat stress-associated
co-expression cluster Date (2018 Summer)
Fig. 6 Transcriptional responses of retrotransposon Gag-like sequences in the greenhouse from July to November. a Harukei-3 melon plants under non-
stressed or heat-stressed conditions. Leaf disks were collected weekly using a hole punch. In total, 75 RNA-seq data were obtained in 18 independent Harukei-3
plants from July to November. b InterPro ID enrichment analysis in the genes that co-express with retrotransposon Gag-like sequences. Co-expression dataset
is based on 75 leaf RNA-seq data obtained in the greenhouse. Heat shock protein genes are highly enriched in the genes. c Co-expression of Gag-like sequences
with abiotic stress-related genes. Gag-like sequences and abiotic stress-related genes are co-expressed in one cluster (shown by red dashed circle). d Changes
in gene expression in the greenhouse. Expression patterns of two retrotransposon Gag-like sequences are shown together with those of abiotic stress-related
genes such as AtABF3-like and AtHSP21-like.
3.2.1 software. For Illumina RNA-seq with the 150 bp PE mode, the outsourcing (Supplementary Fig. 2). For Bionano scaffolding, 86 Gb raw data were obtained
service of Macrogen Japan Co. Ltd. was used. using the outsourcing service of AS ONE Corp. (Osaka, Japan). They were first
assembled to construct “cmap” with Irys solve ver. 3.2; then, cmap was used for
both scaffolding and correction of chimeric contigs (incorrectly assembled contigs)
Whole genome assembly. The procedures, datasets, and detailed parameters used using the same software. Scaffolding was also performed using 74 Gb of Illumina
for whole genome assembly of Harukei-3 are summarized in Supplementary Fig. 2. mate pair (5 kb and 10 kb insert sizes) with SSPACE ver. 3.056 at different “k”
We used two kinds of sequence reads, ONT (R9.4.1 + R10 flow cells; 32.6 Gb) and parameter values (from k = 160 to 80, 40, 20, 10, and 5). By using k values from
PacBio RSII (19.5 Gb), for initial contig assembly. In the case of ONT, reads with larger to smaller in series, we tried to maximize the connections and minimize false
≥5 kb were selected and used. Contigs were separately assembled based on ONT or positives. Chimeric scaffolds generated by the mate pair scaffolding were again
PacBio reads with the Canu ver. 1.8 pipeline54; then errors present in the contig corrected using Bionano cmap. At this point, scaffold N50 values for ONT-based
sequences were corrected with Pion55 using 37 Gb of Illumina PE dataset. At this and PacBio-based assemblies were 17.5 Mb and 11.4 Mb, respectively. ONT-based
point, contig N50 values for ONT-based and PacBio-based contig assemblies were scaffolds were further updated using PacBio-based scaffolds as a hint. In this
8.6 Mb and 0.86 Mb, respectively. Then, scaffolds were assembled based on contigs attempt, both scaffolds were first classified into each chromosome group by using
by combining methods of Bionano Irys optical map and Illumina mate pair linkage map information. Then, candidates of PacBio-based scaffolds that can
10 COMMUNICATIONS BIOLOGY | (2020)3:432 | https://doi.org/10.1038/s42003-020-01172-0 | www.nature.com/commsbioCOMMUNICATIONS BIOLOGY | https://doi.org/10.1038/s42003-020-01172-0 ARTICLE
connect two distinct ONT-based scaffolds were identified by BLAST-n search using removing non-expressing genes (e.g., FPKM < 0.1 in any of the samples), WGCNA
the following conditions: p-value ≤ 1e–150, sequence identity ≥ 99%, blast score ≥ was performed to obtain the co-expression dataset as described previously18.
1000, and alignment length ≥ 5000 bp (Supplementary Fig. 2). If both end of the Pearson’s correlation coefficients were also calculated using R 3.2.3 (https://www.r-
PacBio-based scaffold had sequence alignments with distinct ONT-based scaffolds, project.org/) based on FPKM values independently of WGCNA to distinguish
it was used to connect them. Finally, the chromosome-scale pseudomolecule was positive and negative correlations. Co-expression datasets can be explored
constructed using 28 genomic scaffolds that were anchored and oriented by linkage using the web-application tool “Co-expression viewer” in the Melonet-DB
map information16,30,57. (https://melonet-db.dna.affrc.go.jp/ap/mds).
For the contig assembly in Natsukei-1, Fuyukei, Spicy, Honey dew, Ougon-9,
Awamidori, and JSS6, ONT sequencing reads with ≥5 kb (R9.4.1 flow cell) were
Resequencing. Three different melon genome references were used in this study:
first subjected to the Canu ver. 1.8 pipeline. The resultant contig sequences were
Harukei-3, DHL92 (CM3.6.1 genome sequence + CM4.0 annotation), and Pay-
subjected to Racon58 and Medaka (https://nanoporetech.github.io/medaka/) to
zawat (ASM976082v1 genome sequence). Illumina paired end short reads of
correct erroneous bases. To further determine the candidates of chimeric contigs, Harukei-3, Honey dew, Spicy, Manshuu, Ougon-9, and JSS6 (see above) were
ONT reads were aligned to contig sequences with minmap259 using the following
aligned to genome sequence with bowtie266 using the following parameters, “–end-
parameter: “-a -uf -k14 -A 2 -B 4 -O 4,24 -E 2,1”. Then, read depth data were
to-end –very-sensitive –score-min L,0,−0.12 –mp 2,2 –np 1 –rdg 1,1 –rfg 1,1.”
obtained based on the read alignment information using the mpileup function of
Variant call was performed with the Genome analysis tool kit67, and mutation
samtools60. Contigs were split at positions where the depth of ONT reads was less
characterization was performed as described previously68.
than four.
Comparative genomics analysis. Genomic alignment was performed with
Gene prediction. Procedures and datasets used for genome annotation are LAST69 using the following parameters, “-e 25 -v -q 3 -j 4 -P 32 -a 1 -b 1 (for
summarized in Supplementary Figs. 6, 7. For ONT-based gene prediction, datasets lastal)” and “-s 35 -v (for last-split)”. After file format conversion via maf-
of 8.2 Gb ONT direct RNA-seq and 8.8 Gb ONT cDNA RNA-seq were combined convert, plot graphs comparing distinct genomes were generated with R 3.2.3
and used. They were aligned to Harukei-3 ver. 1.41 genomic sequence with based on the result of LAST alignment. To obtain information of orthologue
Minimap2 using the following parameters “-ax splice -uf -k14.” Then, transcript partners, we performed bidirectional blast searches based on both transcript and
information with exon-intron structure was obtained by pinfish (https://github. protein sequences. Because it is difficult to determine one-to-one orthologue
com/nanoporetech/ont_tutorial_pinfish) using several “c” parameter values (c = 2, partners when genes are duplicated in either genome, we also used the infor-
3, 5, and 10; Supplementary Fig. 7). Predicted transcript sequences were obtained mation of transcript alignment obtained with blat42 as supporting information.
from the genomic sequence with gffread (https://ccb.jhu.edu/software/stringtie/ When genes were paired in both bidirectional BLAST-n/p search and transcript
gff.shtml#gffread) based on the General Feature Format (GFF) information of alignment analysis, they were determined as one-to-one orthologue partners.
Pinfish; then, they were combined with transcript sequence information of DHL92 Candidates of CNV and PAP were determined by integrating the results of
genome annotation CM4.0. Again, Minimap2 alignment and Pinfish prediction bidirectional BLAST-n/p search with the information of gene position on the
were performed based on the combined transcript sequences to obtain the merged chromosome that could be obtained from genome annotation (GFF3 files).
GFF annotation. Next, the protein-coding open reading frame (ORF) was pre- Information analysis described above has been automated with Perl scripts.
dicted in each transcript followed by hmmsearch. The best possible ORFs were Circos70 was used to visualize and compare genomes.
kept by selecting those with the highest sum total hmmsearch scores. If no protein For PAP analysis of retrotransposon Gag-like sequences, DNA alignment
domain was found in any ORF candidates, the longest ORF was kept. Transcripts analysis was performed for each sequence in nine melon genomes using the
were further grouped into gene units based on the position of the exon(s) and the Harukei-3 genome as a standard reference. First, the genomic sequence containing
results of the self-BLAST search (both transcript and protein sequences); tran- the Gag-like sequence and its surrounding region (approx. 50–100 kb) was
scripts were grouped if both the transcript and protein sequences had homology to obtained from the Harukei-3 genome sequence. By using this sequence as a query,
each other and the positions of exon(s) on the genome were consistent between a BLAST-n search was performed against the whole genome sequence data of the
them. To further select the best-possible ORF in each gene unit, hmmsearch as target melon cultivar or accession. The specific region of contig or chromosome
well as BLAST-p search against protein sequences of 9 plant genomes were per- that showed the best homology to the query sequence was identified from the
formed again (a list of the genome references used for the purpose is shown in BLAST search result, then the DNA sequence of this region was obtained and
Supplementary Fig. 7d). The ONT-based method described above predicted further used for LAST alignment. Plot graphs comparing both sequences (Harukei-
31,306 protein-coding genes. A perl pipeline designated “ONT4genepredict” was 3 versus the target melon) were generated with R 3.2.3 based on the result of the
developed to automatically perform the information analysis described above. It is LAST alignment. The PAP status of the Gag-like sequence in the target melon was
available in Melonet-DB (https://melonet-db.dna.affrc.go.jp/ap/dnl). To evaluate also calculated as a numeric value based on the alignment ratio of the correspon-
the completeness of predicted genes, we used BUSCO ver. 3.0 benchmark32. ding genomic region. For example, an alignment ratio of 1.0 means the complete
The protein BUSCO score for the ONT-based gene dataset was 1362 (94.6%) presence of the Gag-like sequence in the target melon genome, while 0 means that
(Supplementary Fig. 7c). In addition to the ONT-based method, gene prediction the sequence is absent.
was also performed with AUGUSTUS ver. 3.3.2 (ab initio method)61, Braker2
pipeline62, and Genome Threader63. For AUGUSTUS gene prediction, the para-
InterPro ID enrichment analysis. ID enrichment analysis was performed based on
meter dataset was first trained and generated with the perl script autoAug.pl using
Fisher’s exact test using the R-exact2x2 module. To calculate q-value from p-value, R-
the ONT-based annotation dataset described above. Then, genes were predicted
qvalue package was used. This ID enrichment analysis is available in the “GO
with AUGUSTUS software using the default parameters. Braker2 was executed
enrichment analysis tool” in Melonet-DB (https://melonet-db.dna.affrc.go.jp/ap/got).
using the Illumina RNA-seq dataset of 45 tissue-wide samples (total 118 Gb;
Fig. 3a). RNA-seq reads were first aligned to the Harukei-3 genome sequence, then
the read alignment information was merged and used for Braker2 gene prediction. Statistics and reproducibility. All statistical tests were performed using available
Transcript annotation was also obtained with StringTie64 software based on the softwares, packages, and online tools mentioned in the methods. Reproducibility
read alignment information. Genome Threader was executed based on the protein can be accomplished using raw sequencing data deposited on public databases
sequences of 10 published plant genomes (listed in Supplementary Fig. 7d). Then, and the same command lines mentioned in the methods, where we used publicly
EvidenceModeler (EVM, https://evidencemodeler.github.io/) was used to integrate available softwares for most of the analysis. Fisher’s exact test was used for
the results of StringTie, AUGUSTUS, Braker2, and Genome Threader with the testing enriched GO or InterPro terms. Both p-value and q-value was used to
weight score setting of 10, 8, 1, and 1. EVM produced the dataset of 59,613 indicate statistical significance. The number of RNA-seq samples used for tissue-
protein-coding genes with complete BUSCO ver. 3.0 score = 1348 (93.6%). wide or leaf co-expression analyses were 45 and 75, respectively, which were
Finally, using the EVM-based dataset as a supplementary dataset, ONT-based determined according to the previous study18. Co-expression was evaluated
annotation dataset was updated to obtain 33,829 protein-coding genes (40,363 based on the weight values calculated by R-WGCNA and pearson’s correlation
transcripts, BUSCO ver. 3.0 score = 1,372 [95.3%]). InterProScan33 was also coefficients (n = 45 or 75).
conducted to obtain GO and InterPro ID in each predicted protein amino acid
sequence.
Reporting summary. Further information on research design is available in the Nature
Research Reporting Summary linked to this article.
Identification of repetitive elements. Repetitive elements including DNA/RNA
transposable elements were searched in both Harukei-3 ver. 1.41 and DHL92 Data availability
CM3.6.1 genomes using RepeatModeler and RepeatMasker (http://www. Raw sequencing data used in this study can be found in the NCBI database under the
repeatmasker.org/) using a repeat sequence dataset, dc20181026. following Bioproject accession numbers: PRJNA603155 (genome sequencing dataset of
Harukei-3 melon), PRJNA624817 (genome sequencing dataset of seven melon accessions),
RNA-seq and co-expression data analysis. Alignment of Illumina RNA-seq PRJNA603146 (ONT cDNA RNA-seq), PRJNA603129 (ONT direct RNA-seq),
paired end short reads was performed with HISAT265 using the following para- PRJNA603204 (tissue-wide RNA-seq of Harukei-3 melon), or PRJNA603202 (leaf RNA-seq
meters: “–maxins 1000 - –score-min L,0,−0.12 –mp 2,2 –np 1 –rdg 1,1 –rfg 1,1.” in the greenhouse). Genome assembly and annotation of Harukei-3 melon (ver. 1.41
Then, gene expression levels were calculated as FPKM values with StringTie. After genome reference) is available on Melonet-DB (https://melonet-db.dna.affrc.go.jp/ap/dnl).
COMMUNICATIONS BIOLOGY | (2020)3:432 | https://doi.org/10.1038/s42003-020-01172-0 | www.nature.com/commsbio 11You can also read