Genetic and spatial organization of the unusual chromosomes of the dinoflagellate Symbiodinium microadriaticum
←
→
Page content transcription
If your browser does not render page correctly, please read the page content below
Articles
  https://doi.org/10.1038/s41588-021-00841-y

Genetic and spatial organization of the unusual
chromosomes of the dinoflagellate Symbiodinium
microadriaticum
Ankita Nand 1,5, Ye Zhan                   , Octavio R. Salazar
                                         1,5                               2,5
                                                                              , Manuel Aranda                 2   ✉, Christian R. Voolstra              3   ✉
and Job Dekker 1,4 ✉

Dinoflagellates are main primary producers in the oceans, the cause of algal blooms and endosymbionts of marine inverte-
brates. Much remains to be understood about their biology, including their peculiar crystalline chromosomes. We assembled
94 chromosome-scale scaffolds of the genome of the coral endosymbiont Symbiodinium microadriaticum and analyzed their
organization. Genes are enriched towards the ends of chromosomes and are arranged in alternating unidirectional blocks. Some
chromosomes are enriched for genes involved in specific biological processes. The chromosomes fold as linear rods and each
is composed of a series of structural domains separated by boundaries. Domain boundaries are positioned at sites where tran-
scription of two gene blocks converges and disappear when cells are treated with chemicals that block transcription, indicat-
ing correlations between gene orientation, transcription and chromosome folding. The description of the genetic and spatial
organization of the S. microadriaticum genome provides a foundation for deeper exploration of the extraordinary biology of
dinoflagellates and their chromosomes.

D
        inoflagellates are single-celled marine plankton, abundant          respectively19–21. Dinoflagellate chromosomes appear permanently
        in the world’s oceans, and of great economic and ecological         condensed throughout the cell cycle, and optical birefringence
        importance1. This is due to their role as primary producers2,       properties of chromosomes suggest they have liquid-crystalline
their ability to cause harmful algal blooms3 and because of the sym-        features22.
biotic relationships they form with a broad range of marine inverte-            For decades, dinoflagellates have escaped genomic analysis
brates1. In particular, dinoflagellates in the family Symbiodiniaceae4      due to their unusually large genomes (ranging from 1 to 250 Gb;
are known for their role as intracellular symbionts of reef-building        ref. 23). With the advent of next-generation sequencing, a number
corals. In recent decades, we have witnessed unprecedented loss of          of Symbiodiniaceae genome sequences are now available, such as
coral reef cover due to local and global anthropogenic insult5. Coral       the genomes of Breviolum minutum24, Fugacium kawagutii25 and
bleaching, that is, the loss of Symbiodiniaceae triggered by ocean          Symbiodinium microadriaticum14 (among others). These genome
warming due to climate change, is now the main driver of coral reef         sequences are collections of (short) scaffolds, not chromosome-scale
degradation6.                                                               assemblies. A chromosome-scale assembly of a dinoflagellate
    Dinoflagellates seem to defy many of the cellular features              genome is key to providing answers to pertinent biological ques-
found in other eukaryotes. For instance, dinoflagellates commonly           tions such as how they achieve the unusual folding of their chromo-
use 5-hydroxymethyluracil instead of thymidine7, show a pau-                somes, whether the unidirectional alignment of genes is a feature
city of transcriptional regulation8–10, exhibit broad RNA editing11         conserved across chromosomes and whether such alignment is
and seem to have a portion of their genes arranged in tandem                related to features of chromosome organization and architecture.
arrays12,13, which may explain, at least partially, the pervasive           Here we generated a chromosome-scale assembly of the genome of
gene duplication observed in their genomes14. Most interestingly,           the dinoflagellate S. microadriaticum.
dinoflagellates fold their chromosomes in a way that is distinct
from other eukaryotes and that is also distinct from prokaryotes.           Results
Dinoflagellates were until recently believed to have no histones, and       Chromosome-scale assembly of the S. microadriaticum genome.
their DNA was reported to be in a crystal-like state15,16. More recent      Previously, we used Illumina sequencing to build 9,695 scaffolds for
transcriptome studies, however, confirmed that dinoflagellates do           S. microadriaticum14. These scaffolds cover 808,242,489 bp (scaf-
possess histones, but lack histone H1 (refs. 17,18). However, only a        fold N50 = 573.5 kb, contig N50 = 34.9 kb). We employed Hi-C26
very small fraction of the genome is nucleosomal, as shown, for             to group, order, and orient these scaffolds into chromosome-scale
example, by nuclease digestion patterns19. DNA is likely packaged by        scaffolds27,28. The Hi-C-assisted assembly process is described in the
other proteins, for example histone-like proteins and dinoflagellate/       Methods section (Methods, Supplementary Materials and Extended
viral nuclear proteins (DVNPs) derived from bacteria and viruses,           Data Fig. 1) and is summarized in Fig. 1a.

1
 Program in Systems Biology, Department of Biochemistry and Molecular Pharmacology, University of Massachusetts Medical School, Worcester, MA,
USA. 2Biological and Environmental Sciences & Engineering Division (BESE), Red Sea Research Center (RSRC), King Abdullah University of Science and
Technology (KAUST), Thuwal, Saudi Arabia. 3Department of Biology, University of Konstanz, Konstanz, Germany. 4Howard Hughes Medical Institute,
Chevy Chase, MD, USA. 5These authors contributed equally: Ankita Nand, Ye Zhan, Octavio R. Salazar. ✉e-mail: manuel.aranda@kaust.edu.sa;
christian.voolstra@uni-konstanz.de; job.dekker@umassmed.edu

618            Konstanzer Online-Publikations-System (KOPS)                      Nature Genetics | VOL 53 | May 2021 | 618–629 | www.nature.com/naturegenetics
      URL: http://nbn-resolving.de/urn:nbn:de:bsz:352-2-1k1pj6yhvnh7f1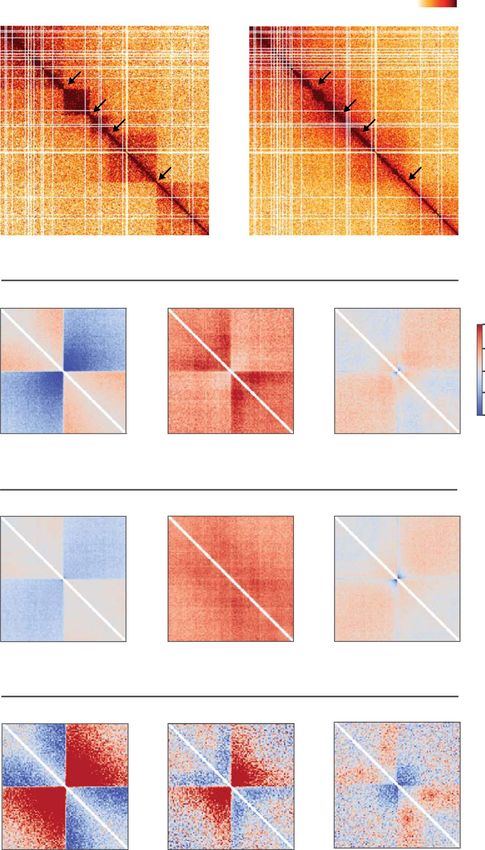
NaTurE GEnETicS Articles
a b
Chr 1 Chr 94 Cluster 1–94
Chr 1
Map Hi-C reads to Illumina scaffolds
40-kb resolution Hi-C matrix
Clustering 40-kb bins in 94 chromosomes
Order subscaffolds along chromosomes
Orienting subscaffolds at 40-kb resolution
Cluster 1–94 Chr 94
Adding back filtered 40-kb bins
Manual curation at 1-kb resolution
Assembly Smic1.0 with 94 chromosomes
Smic1.0; bin size: 250 kb
0 0.012
0
0.001
Gapfilling using de novo PacBio contigs Smic1.1N Read
Hi-C count
coverage
per 10 kb
c
Chromosome 4 Chromosome 26 Chromosome 59
1.0 1.0 1.0
Insulation score
Insulation score
Insulation score
0 0 0
0 0.012
–1.0 –1.0 –1.0 Hi-C count
5.8 Mb
5. 8 Mb
11.9 Mb
8.9 Mb
5.8 Mb
Smic1.0; bin size: 50 kb Smic1.0; bin size: 50 kb Smic1.0; bin size: 50 kb
Chromosome 4: 8–10 Mb Chromosome 26: 1–3 Mb Chromosome 59: 0–2 Mb
2 Mb
2 Mb
2 Mb
0 0.002
Smic1.0; bin size: 5 kb Smic1.0; bin size: 5 kb Smic1.0; bin size: 5 kb
Hi-C count
Fig. 1 | Hi-C-assisted assembly of chromosome-scale scaffolds for S. microadriaticum. a, Main steps in Hi-C-assisted assembly of Smic1.0 and Smic1.1N.
b, Hi-C interaction map for the set of 94 chromosomes (ordered by descending size, 250-kb bins) of Smic1.0 and 94 clusters of high-copy scaffolds
(ordered according to their preferred interactions with the set of 94 chromosomes). Relative sequence coverage per 10-kb bin is shown along the right
axis. Each of the clusters interact mostly with only one of the chromosomes, but sequences in these clusters have, on average, a copy number that is
11 times higher than sequences located along the assembled portions of chromosomes 1–94. c, Examples of Hi-C interaction maps for chromosomes
4, 26 and 59. Hi-C data are mapped to Smic1.0 and binned at 50-kb resolution. Dotted squares indicate sections that are shown at higher resolution
(5-kb bins) below the chromosome-wide interaction maps. Plots on top of the heatmaps represent insulation profiles (10-kb resolution, window size
500 kb; Methods). This profile represents the number of interactions that occur across each location. Local minima in these profiles indicate the locations
of sites across which interaction frequencies are relatively low, and these correspond to Hi-C domain boundaries.
Nature Genetics | VOL 53 | May 2021 | 618–629 | www.nature.com/naturegenetics 619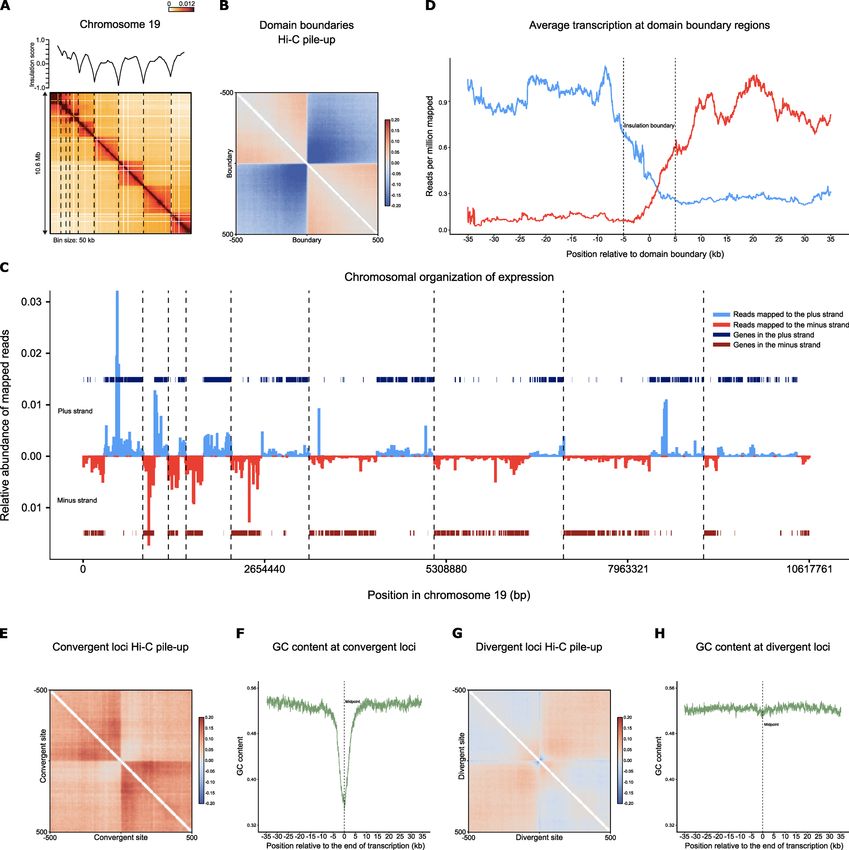
Articles                                                                                                                NaTurE GEnETicS

    Hi-C reads were mapped to the set of Illumina-based scaffolds          interactions between these Hi-C domains form a series of squares
(Supplementary Table 1). A total of 2,324,324,062 uniquely map-            and rectangles farther from the diagonal. Hi-C interaction maps
ping chromatin interactions were obtained. Hi-C data were binned           obtained from cultures enriched in coccoid cells (G2/M immobile
at 40-kb resolution and corrected for intrinsic experimental biases29.     cells) or mastigote cells (G1/S flagellated cells) showed no obvious
We used hierarchical clustering (karyotyping27) to identify groups of      differences (Extended Data Fig. 3).
bins that interact frequently with each other and are, therefore, likely      One possible explanation for domain boundaries is the pres-
located on the same chromosome. We identified 94 clusters, repre-          ence of gaps in the genome assembly. However, domain patterns
senting 94 chromosomes. Subsequently, we used Hi-C-based scaf-             for chromosomes were nearly identical for Smic1.0 and Smic1.1N
folding27 to order and orient subscaffolds along each chromosome.          (for example, compare Fig. 1c with Extended Data Fig. 2d), indi-
Subscaffolds are consecutive sections of the original Illumina-based       cating that most boundaries are resistant to extensive gap filling.
scaffolds that are located on the same chromosome based on Hi-C            To further analyze these domainal features, we used the previously
interaction frequency (Methods).                                           described insulation metric to determine the positions of Hi-C
    After extensive manual curation of the assembly using Hi-C data        domain boundaries genome-wide at 10-kb resolution (Fig. 1c)34. We
binned at 1-kb resolution, we obtained a genome-wide assembly              identified 441 domain boundaries (excluding chromosomes 83–94,
(Smic1.0) that contains 94 chromosome-scale scaffolds that com-            which are too short for this analysis). Visual inspection suggests
bined cover 624,473,910 bp (77% of the starting 808,242,489 bp;            this analysis did not identify some weaker domain boundaries. For
scaffold N50 = 8.44 Mb, contig N50 = 23.35 kb; Supplementary               Smic1.1N, we identified 468 boundaries, of which 227 were located
Table 2). The chromosome number is close to previous estimates             in contiguous sequence (that is, located at least 10 kb from a contig
of 97 ± 2 chromosomes based on electron microscopic analy-                 end). This strongly indicates that boundaries are genuine chromo-
ses30–33. Chromosome lengths range from 26,204 bp to 16,626,072 bp         some structural features and not the result of remaining gaps in the
(median = 6,643,339 bp).                                                   assemblies (see below).

Gap filling and placing higher copy sequences. In the process              Two patterns of GC content fluctuations. We find two
of assembly, we set aside a total of 183,768,579 bp because they           chromosome-scale patterns of GC content fluctuations: (1) GC con-
interacted frequently with more than one chromosome. Increased             tent increases towards the ends of the chromosomes (Fig. 2a,b) and
Hi-C interactions between loci located on different chromosomes            (2) GC content dips to form small local minima at Hi-C domain
can occur when sequences are present in several copies at a single         boundaries (Fig. 2c); the GC content decreases by ~6% from 51 to
location or are present in several locations but are included only         46%. The dip in GC content observed at domain boundaries could
once at one location in the assembly. Analysis of Hi-C read cover-         suggest that this chromosome architectural feature is encoded in the
age indicated that while sequences present on the assembled chro-          genome. These findings were also true for the gap-filled genome
mosomes 1–94 are all present at similar copy number, many of the           Smic1.1N (Extended Data Fig. 4). Furthermore, considering only
subscaffolds that were set aside were present at much higher copy          Hi-C boundary sequences located in a contig (that is, at least 10 kb
number (on average 11 times higher than sequences included on the          away from the boundaries of a contig), we found the same pattern
chromosome scaffolds; Fig. 1b). The excluded subscaffolds could be         (Extended Data Fig. 4d,e), This provides further evidence that these
clustered in 94 groups (referred to here as clusters 1–94) based on        chromatin domain boundaries detected by Hi-C and their distinct
their Hi-C interaction frequencies. Each of these clusters interacts       sequence composition are bona fide chromosomal features.
particularly frequently with only 1 of the 94 chromosomes (Fig. 1b).
An overall gene ontology (GO) biological process enrichment anal-          Some chromosomes are enriched in distinct sets of genes.
ysis showed highly significant overrepresentation of genes associ-         Genome models from Aranda et al.14 were mapped to Smic1.0
ated with DNA integration, reverse transcription, DNA replication          (Supplementary Data Files 1–3). Of the 49,109 gene models, 48,715,
and transposition.                                                         corresponding to 99% of the genes, were successfully mapped using
   To place these repetitive subscaffolds on the assembled chro-           Minimap2 (ref. 35). We used GO term enrichment to investigate
mosomes, we generated contigs using long reads sequenced on                whether genes located on the same chromosome were function-
a PacBio RSII instrument (Methods) and aligned these contigs               ally related (Supplementary Data Files 4–6). We also checked for
to Smic1.0. Contiguously aligned segments of Smic1.0 were then             tandem-arrayed genes, with the motivation that genes in such arrays
replaced with the corresponding sections of PacBio contigs. This           might be linked to related processes. We found genes involved in
resulted in extensive gap filling and addition of 111,219,491 bp of        photosynthesis (chloroplastic), nitrogen cycling and stress response
sequence to Smic1.0. We found that this process led to the chro-           (among others) to be enriched on certain chromosomes. For
mosomal placement of ~91 Mb of the ~183 Mb of the sequences                instance, chromosome 4 contains seven genes of chloroplastic ATP
that make up the high-copy clusters 1–94 in Smic1.0. We refer to           synthase subunit c genes, six of which followed each other in direct
this gap-filled genome as Smic1.1N (Methods and Extended Data              vicinity (Smic9977, Smic9979, Smic9980, Smic9981, Smic9983 and
Fig. 2a). This assembly covers 735,693,401 bp (scaffold N50 = 9.9 Mb,      Smic9984). Furthermore, chromosome 4 contains 16 genes encod-
contig N50 = 467 kb, chromosome sizes range from 27,448 to                 ing the pentatricopeptide repeat-containing proteins, organized in
19,282,064 bp, median = 7,826,525 bp). However, gap-filling also           three clusters, besides other chloroplastic genes (for example, PsbP
introduced new assembly errors as evidenced by sequences interact-         domain-containing protein 7, short-chain dehydrogenase TIC 32,
ing with several chromosomes (Extended Data Fig. 2b). For analyses         etc.). We also found a surplus of tandem-arrayed nitrogen-related
described below, we focused on the thoroughly manually curated             genes (12 out of a total of 51) on chromosome 5. Notably, we found
Smic1.0 assembly, but also performed all analyses on Smic1.1N,             clusters of nitrate transporters (n = 9 genes arranged in two clusters
which produced nearly identical results (Extended Data).                   of 6 and 2 genes, and 1 gene) and nitrate reductases (n = 3 genes),
                                                                           some of which were tandem-arrayed, and clusters of Ankyrin repeat
Hi-C interaction map has domainal features. The Hi-C inter-                domain-containing (n = 6 genes) and Ankyrin-2 proteins (n = 8
action maps of all chromosomes show domainal features                      genes). Chromosome 33 has two clusters of ammonia channel/trans-
(Fig. 1c): each chromosome has a series of square-shaped domains           porter genes, corroborating the view that Symbiodiniaceae feature
along the diagonal with relatively elevated interaction frequencies        extensive gene duplication associated with the provisioning of nitro-
within them and lower frequencies between them. The boundaries             gen14. Chromosome 23 is enriched for genes involved in the response
between them are often, but not always, sharp transitions. Further,        to stress, notably signified by a vast expansion of genes annotated as

620                                                                         Nature Genetics | VOL 53 | May 2021 | 618–629 | www.nature.com/naturegenetics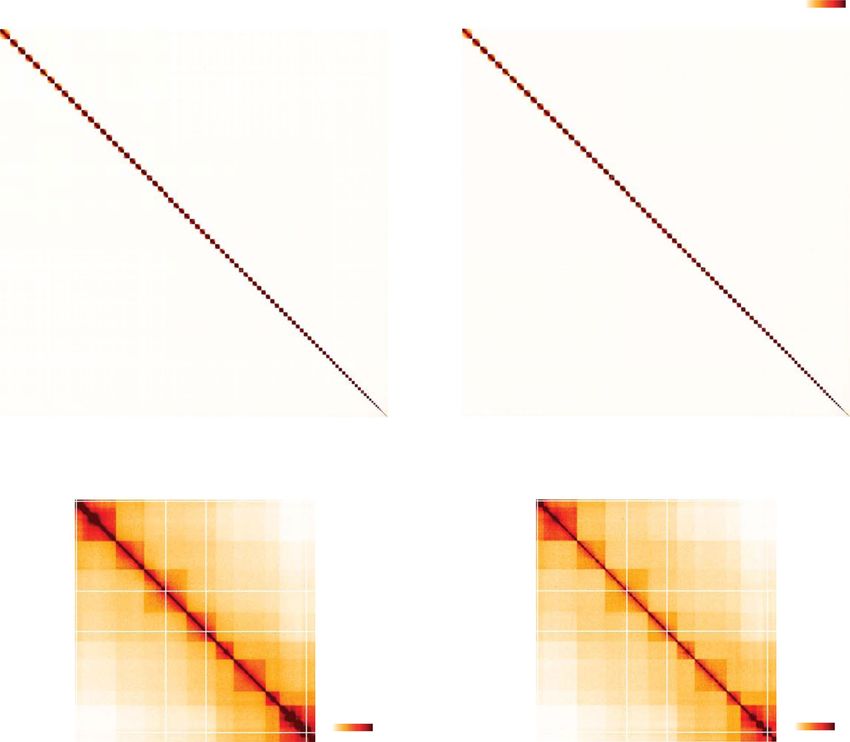
NaTurE GEnETicS Articles
a
Chromosome 4 Chromosome 26 Chromosome 59
0.60 0.60
0.55 0.55
GC content
GC content
0.50 0.50
0.45 0.45
0.40 0.40
0.35 0.35
1 2,998,428 5,996,856 8,995,284 11,993,712 1 2,225,220 4,450,440 6,675,659 8,900,879 1 1,472,250 2,944,500 4,416,750 5,889,000
Position in chromosome (bp) Position in chromosome (bp) Position in chromosome (bp)
b c
Left side telomere Right side telomere GC content at domain boundary regions
0.53 0.53
0.52
0.52 0.52 Insulation
0.50 boundary
GC content
GC content
GC content
0.51 0.51
0.48
0.50 0.50
Chromosomes averages Chromosomes averages 0.46
Polynomial fit Polynomial fit
R 2 = 0.88 R 2 = 0.85
0.49 0.49
0 0.5 1.0 1.5 2.0 2.5 –2.5 –2.0 –1.5 –1.0 –0.5 0
0
5
0
5
0
–5
0
5
10
15
20
25
30
35
5
–3
–2
–2
–1
–1
–3
Distance from telomere (Mb) Distance from telomere (Mb)
Position relative to domain boundary (kb)
Fig. 2 | GC content along chromosomes as well as near telomeres and Hi-C domain boundaries for Smic1.0. a, GC content fluctuations along
chromosomes 4, 26 and 59 measured in 10-kb windows. b, GC content along regions 2.5 Mb from telomeric ends, averaged for chromosomes of sizes of
at least 5 Mb and measured in 10-kb windows. GC content decreases as distance to telomeres increases. c, GC content around domain boundaries. Values
are averaged across all domain boundaries in the genome for regions 30 kb upstream and downstream domain boundaries and in 100-bp sliding windows.
Dotted lines delimit position of the 10-kb boundaries. A decline in GC content is observed at boundaries that define Hi-C domains.
either BTB/POZ and MATH domain-containing protein 2s or BTB Genes tend to be organized in unidirectional blocks. The organi-
and MATH domain-containing protein, similar to chromosome zation and orientation of genes along chromosomes shows an even
31, which contains 40 BTB and MATH domain-containing protein distribution across strands (Fig. 3c and Extended Data Fig. 5 for
genes in two clusters, suggesting expansion of genes encoding these Smic1.1N). However, the orientation of neighboring genes is highly
proteins in S. microadriaticum and showing their presence in a few correlated and neighboring genes rarely change orientation. Within
specific clusters, as found previously for Arabidopsis and rice36. This a 10-gene window, gene orientation changes are strikingly infre-
chromosome further contains 150 genes of chloroplastic pentatri- quent, similar to our previous analysis14 (Fig. 3d and Extended Data
copeptide repeat-containing proteins in various clusters, putatively Fig. 5). We observe that genes are preferably organized in blocks of
involved in RNA editing37. Enrichment is driven by the occurrence co-oriented genes (Fig. 3e), with less than 10% of the genes found
of the same gene in several copies, and by colocation of different without a co-oriented neighbor. Furthermore, 50% of the genes in
genes involved in the same process on the same chromosome. At the genome are organized in blocks of nine or more co-oriented
present, it is unclear whether the clustering of functionally related genes (Fig. 3f). Such a pattern, where immediate neighboring genes
genes along certain chromosomes is a simple consequence of the are more likely to follow the same orientation, is commonly observed
tandem array arrangement of genes due to mechanisms of duplica- in prokaryotes, while in most eukaryotes orientation of neighboring
tion or whether this is selected for regulatory reasons. genes is less, or not, correlated. Notable exceptions include kineto-
plastids, which also show blocks of unidirectional genes40.
Gene density increases towards telomeres. Gene density in
S. microadriaticum ranges from 38 to 155 genes per Mb, showing a Chromosomal distribution of repetitive elements. The most
greater gene density compared with other eukaryotic genomes such abundant repetitive elements in S. microadriaticum are long inter-
as human (3.5–23 genes per Mb, excluding the Y chromosome) and spersed nuclear elements (LINEs), followed by simple repeats,
mouse (7.5–15.9 genes per Mb)38, but a gene density comparable unclassified repeats and DNA transposons, constituting 13.36, 5.79,
with that of Drosophila (200 genes per Mb)39. Gene density increases 4.61 and 1.56% of the genome, respectively.
towards the telomeres (Fig. 3a,b and Extended Data Fig. 5), having Repetitive elements follow the opposite pattern to gene density,
an average gene number of ~9 per 100 kb at the end of the chromo- expression and GC content, being lower towards the ends of the
somes and decreasing to ~6 towards the central region (Fig. 3b). chromosomes (Fig. 3a,g,h and Extended Data Fig. 5). The locations
Nature Genetics | VOL 53 | May 2021 | 618–629 | www.nature.com/naturegenetics 621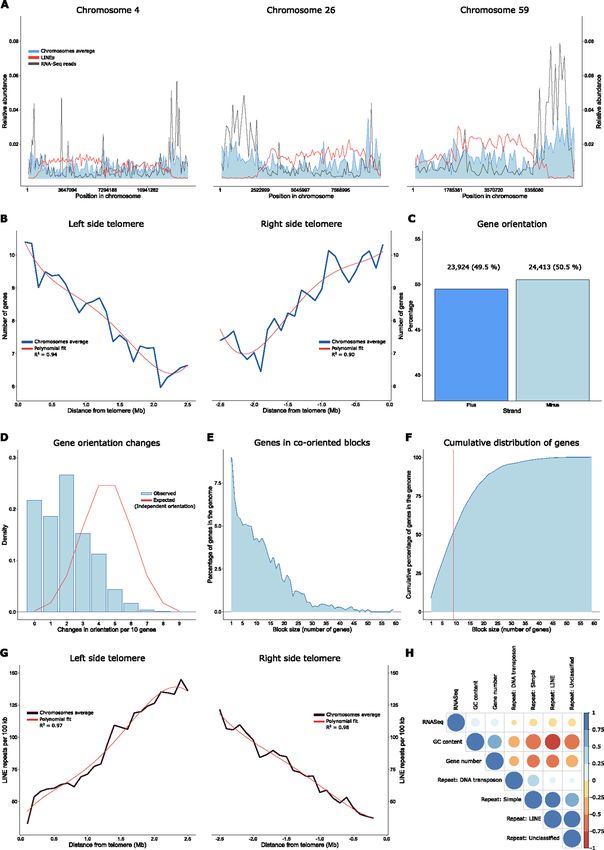
Articles                                                                                                                    NaTurE GEnETicS

of LINE elements are correlated positively with the presence of                  We observe more variable exponents when we plotted P(s) for
other repetitive elements, indicating that repetitive elements are, in        interactions between Hi-C domains; exponents ranged from −0.1
general, enriched in the middle of the chromosomes (Fig. 3g).                 to −0.4. When we assume that domain formation is due entirely
   In summary, our analysis shows that gene density and gene                  to sequence gaps, though highly unlikely (see above and below),
expression are generally higher towards chromosome ends, result-              the P(s) plots in Fig. 4d can be used to estimate the size of such
ing in a moderate, yet significant, positive correlation between gene         putative gaps by determining how much individual interdomain
density and gene expression (R2 = 0.33, P = 4.2 × 10−157) (Fig. 3a,h          P(s) plots need to be shifted along the x-axis so that they all overlap
and see Extended Data Fig. 5 for this analysis for Smic1.1N).                 (Methods). In most cases, plots would need to be shifted several
Furthermore, gene density and expression were correlated posi-                hundred kilobases. After such putative gap correction, the esti-
tively with GC content (Fig. 3h and Extended Data Fig. 5), and                mated exponents for regime II for the different sections of the Hi-C
negatively with repeat density. This is in line with the notion that          map again ranged between −0.3 and −0.4 (Fig. 4e). Nearly identical
high GC content regions are associated with gene-rich regions.                results are found when P(s) was analyzed for Hi-C data mapped to
                                                                              Smic1.1N (Extended Data Fig. 2).
Chromosomes are folded as linearly organized rods. Next, we
leveraged the Hi-C data to obtain insights into the spatial organiza-         Fluctuation of chromatin compaction along chromosomes.
tion of S. microadriaticum chromosomes. When average interaction              Visual inspection of Hi-C interaction maps shows that interactions
frequency P is plotted as a function of genomic distance s (P(s)),            tend to be of higher frequency near the ends of all chromosomes. To
a general inverse relationship is typically observed and, from the            quantify this, we plotted P(s) for telomeric Hi-C domains and for
shape and exponent of the curve, features of chromosome folding               internally located Hi-C domains (Fig. 4f). We observed that chro-
can be inferred. We plotted P(s) for S. microadriaticum (Fig. 4a). The        matin interactions in terminal domains are about twofold higher for
shape of P(s) suggests three regimes. First, for loci separated by a          loci separated up to 1 Mb, while the exponent of P(s) is very similar
few kilobases there is a very steep decay. Read orientation analysis          for all domains (around −0.3). One interpretation is that the chro-
shows that the steep decay in regime I is the result of noninforma-           matin fiber has a shorter contour length near the telomeric ends
tive Hi-C ligation products41 (Extended Data Fig. 6). Second, for             as compared with chromatin in the middle portions of the chro-
loci separated by several kilobases up to ~3 Mb there is a very shal-         mosomes45. Very similar results were obtained when Hi-C data was
low decay (P(s) ≈ s−0.4). Third, for loci separated by more than ~3 Mb        mapped to Smic1.1N (Extended Data Fig. 2).
there is a steep drop in contact frequency. The overall shape of P(s)
is reminiscent of that observed for mitotic chromosomes in verte-             Domain boundaries occur at sites where genes converge. We
brates. We have previously demonstrated that such a P(s) shape is             next investigated the relationship between gene orientation, tran-
consistent with the formation of rod-shaped chromosomes42,43. This            scription and features of chromosome conformation observed with
is consistent with microscopic observations of chromosomes in a               Hi-C. Figure 5a shows the Hi-C interaction map for chromosome
variety of dinoflagellates that show elongated rod-shaped and per-            19, with domain boundaries indicated by dotted lines.
manently condensed chromosomes (for example, ref. 44). The steep                 The sharp boundaries in chromatin interactions are readily
drop in interaction frequency for loci separated by more than ~3 Mb           detected when we aggregate Hi-C interactions around boundaries
indicates that, along the long-axis of the stiff rod-shaped chromo-           genome-wide (Fig. 5b); interactions across domain boundaries are
some, loci rarely interact with loci located more than 3 Mb away              depleted. To determine whether there is a relationship between uni-
along the linear genome (Fig. 4b). All chromosomes, regardless of             directional gene blocks and chromosomal domains, we plotted RNA
their length, show the steep drop in P(s) at ~3 Mb, which indicates           expression along each chromosome in a strand-specific manner to
that the internal organization of chromosomes is independent of               highlight blocks of co-expressed co-oriented genes (Fig. 5c). As
chromosome length.                                                            expected, blocks of transcripts are observed that alternate between
    The exponent of P(s) for regime II shows some properties of               being encoded on the top and the bottom strand. Intriguingly,
how chromatin is organized in a cross-section of the rod-shaped               most domain boundaries observed by Hi-C are located at positions
chromosome42,43. For S. microadriaticum, the exponent of P(s) in the          where transcription of blocks of unidirectional genes converges.
intralayer regime is small: based on the global P(s) plot shown in            A similar pattern was observed along all chromosomes. To quantify
Fig. 4a, the exponent is close to ~0.4. For Smic1.1N the exponent is          this pattern genome wide, we plotted the number of reads derived
somewhat smaller, between −0.3 and −0.4 (Extended Data Fig. 2).               from each strand as a function of distance up or downstream of
We also plotted P(s) for interactions that occur in individual Hi-C           Hi-C domain boundaries (Fig. 5d). We find that reads upstream of
domains, excluding any interactions that occur across Hi-C domain             a boundary map almost exclusively to the top strand, while reads
boundaries (Fig. 4c,d and Extended Data Fig. 2). The exponent of              downstream of a boundary map mostly to the bottom strand.
P(s) for interactions in individual domains is consistently around               We did not identify domain boundaries at all locations
−0.3 (Fig. 4d,e). Such small exponent indicates extensive packing             where transcription of blocks of unidirectional genes converge.
and potential mixing of DNA in cross-sections of the rod-shaped               This is most likely due to the fact that the parameters we chose
chromosomes.                                                                  for the insulation analysis to identify domains boundaries34 are

Fig. 3 | Gene and repetitive element distribution along chromosomes for Smic1.0. a, Relative abundance of genes (blue), LINE repeats (red) and mapped
RNA-seq reads (gray) for chromosomes 4, 26 and 59. b, Gene number along regions 2.5 Mb from telomeric ends, averaged for chromosomes of sizes of
at least 5 Mb and measured in 100-kb windows. Gene number is observed to decrease as distance to telomeres increases. c, Directionality of genes in
the genome. A similar number of genes is found in both strands. d, Frequencies of changes in gene orientation. Gene orientation changes defined as the
occurrences of neighboring genes located in opposite strands and measured in sliding windows of 10 genes. Observed (blue) and assuming an equal and
independent probability of gene orientation (red). e, Distribution of genes in blocks of co-oriented genes. f, Cumulative distribution of genes in blocks
of co-oriented genes; 50% of the genes are found in blocks of 9 or more co-oriented genes (red). g, LINEs number along regions 2.5 Mb from telomeric
ends, averaged for chromosomes of sizes of at least 5 Mb and measured in 100-kb windows. LINEs number is observed to increase as distance to
telomeres increases. h, Correlations between gene number, GC content, RNA-seq data and repeat types: LINE, DNA transposons, Simple and Unclassified.
Correlation coefficients are shown as a color and size gradient between positive (blue) and negative (red) values. Correlations were done at 100-kb
windows.

622                                                                             Nature Genetics | VOL 53 | May 2021 | 618–629 | www.nature.com/naturegenetics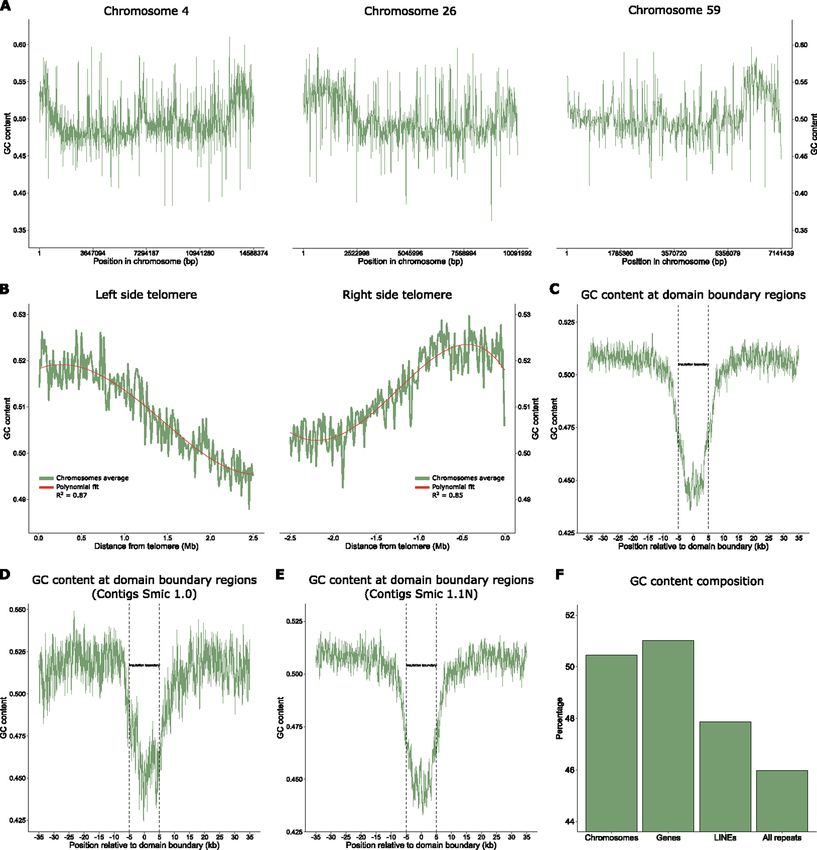
NaTurE GEnETicS Articles
conservative (Fig. 1 and Methods). Visual inspection of Hi-C inter- that did not overlap a called domain boundary. When we aggre-
action maps confirms the presence of domain boundaries at most gated average Hi-C interactions around this set of further conver-
of the locations where gene expression blocks converge. To explore gent sites, we again observe the formation of a distinct structural
this in another way, we identified all sites where transcription of boundary (Fig. 5e). We conclude that domain boundaries occur at
blocks of co-oriented genes converges. This set includes 388 out of the large majority of sites of convergent unidirectional gene blocks.
the 441 domain boundaries and a further set of 280 convergent sites In a small minority of cases we detected a domain boundary away
a Chromosome 4 Chromosome 26 Chromosome 59
0.08 0.08
Chromosomes average
LINEs
RNA-seq reads
0.06 0.06
Relative abundance
Relative abundance
0.04 0.04
0.02 0.02
1 2,998,429 5,996,857 8,995,285 1 2,225,221 4,450,440 6,675,660 1 1,472,251 2,944,501 4,416,751
Position in chromosome Position in chromosome Position in chromosome
b Left side telomere Right side telomere
c Gene orientation
55
9 9
17,887 (49.4%) 18,286 (50.6%)
50
8 8
Number of genes
Number of genes
Percentage
7 7 45
Chromosomes average Chromosomes average
Polynomial fit Polynomial fit
R 2 = 0.95 R 2 = 0.89
6 6
40
0 0.5 1.0 1.5 2.0 2.5 –2.5 –2.0 –1.5 –1.0 –0.5 0 Plus Minus
Distance from telomere (Mb) Distance from telomere (Mb) Strand
d Gene orientation changes
e Gene in co-oriented blocks
f Cumulative distribution of genes
0.25 10.0 100
Cumulative percentage of genes in the genome
Perecentage of genes in the genome
0.20
Observed 7.5 75
Expected
(independent
0.15 orientation)
Density
5.0 50
0.10
2.5 25
0.05
0 0 0
0 1 2 3 4 5 6 7 8 9 1 5 10 15 20 25 30 35 40 45 1 5 10 15 20 25 30 35 40 45
Changes in orientation per 10 genes Block size (number of genes) Block size (number of genes)
g h
Repeat: DNA transposon
Left side telomere Right side telomere
150 150
Repeat: unclassified
Repeat: simple
Gene number
Repeat: LINE
GC content
125 Chromosomes average 125
RNA-seq
Polynomial fit
Chromosomes average
LINE repeats per 100 kb
LINE repeats per 100 kb
R 2 = 0.98
Polynomial fit
R 2 = 0.99 1
100 100
RNA-seq
0.75
GC content
75 75 0.5
Gene number 0.25
50 50 Repeat: DNA transposon 0
Repeat: simple –0.25
–0.5
Repeat: LINE
0 0.5 1.0 1.5 2.0 2.5 –2.5 –2.0 –1.5 –1.0 –0.5 0
–0.75
Distance from telomere (Mb) Distance from telomere (Mb) Repeat: unclassified
–1
Nature Genetics | VOL 53 | May 2021 | 618–629 | www.nature.com/naturegenetics 623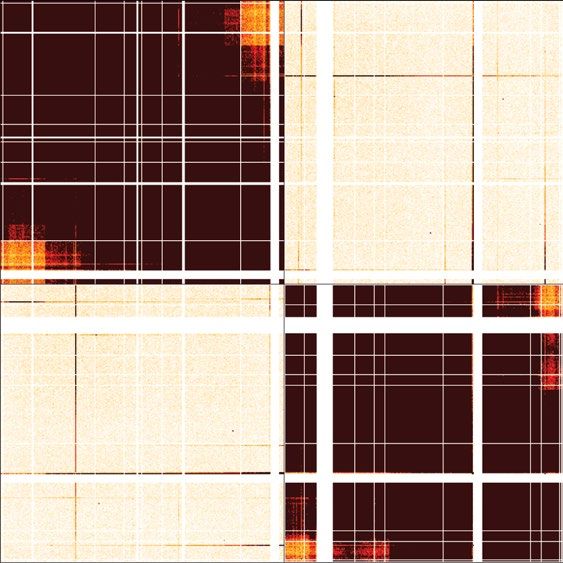
Articles NaTurE GEnETicS
a b c
10–4 Chromosome 4 Smic1.0; bin size: 50 kb
–4
P(s) ≈ s
Row 1
Chromosome linearly organized
10–5
Contact frequency P
Row 2
Regime II: kb
extensive interactions
Row 3
10–6 P(s) ≈ s–0.4
Regime III: Row 4
very few interactions Row 5
–7
10
Row 6
P(s) ≈ s–1.8
Row 7
I lI llI
10–8 Row 8
Row 9
102.5 103.5 104.5 105.5 106.5 107.5
11.9 Mb 0 0.012
Genomic distance s (bp)
Hi-C count
d e f
100 Before gap correction 100 After gap correction 100 Mastigote-enriched culture
Row 1 Row 1
Row 2 Row 2
Row 3 Row 3
Row 4 Row 4 End domains
10–1 Within Hi-C domains Row 5 10–1 Within Hi-C domains Row 5 Internal domains
Row 6 Row 6
Contact frequency P
Contact frequency P
Contact frequency P
Row 7 Row 7 10–1
P(s) ≈ s–0.3 Row 8 P(s) ≈ s–0.4 Row 8
10 –2 Row 9 10–2 Row 9
P(s) ≈ s–0.3
10–3 10–3 P(s) ≈ s–0.3 10–2
P(s) ≈ s–0.16
Between Hi-C domains Between Hi-C domains
10–4 10–4
10–3
104.5 105.5 106.5 107.5 104.5 105.5 106.5 107.5 104 105 106 107
Genomic distance (bp) Genomic distance (bp) Genomic distance (bp)
Fig. 4 | Linear organization of S. microadriaticum chromosomes. a, Genome-wide contact frequency P versus genomic distance s for mastigote-enriched
cultures. P(s) shows three regimes (I, II and III) with distinct exponents (indicated with gray straight lines). The P(s) plot is very similar for
coccoid-enriched cultures. b, Schematic depiction of a linearly organized chromosome. Linear organization is predicted from the presence of the steep
drop in P(s) (regime III). The shallow decay in interaction frequency followed by a steep drop at ~3 Mb is consistent with an organization where loci have
interactions only with loci located within a limited genomic distance (~3 Mb up- and downstream). Regime I is, at least in part, due to the presence of
aberrant Hi-C molecules known to occur at very short distances (unligated ends and self-circularized fragments; Extended Data Fig. 6). c, Hi-C interaction
map for chromosome 4 (bin size = 50 kb) for mastigotes. Dotted lines indicate domain boundaries and define a set of squares across the interaction map.
d, P(s) for each square defined by domain boundaries in (c). Hi-C data from mastigotes. Each individual line represents P(s) for a single square, colored by
row (indicated in panel C). The estimated exponent for P(s) for regime II ranges from around −0.16 to −0.3 as indicated by the straight gray lines. Plots
for chromatin interaction data within contiguous Hi-C domains, and between Hi-C domains are indicated. e, As d, but after correcting genomic distances
(s) for estimated gap sizes between adjacent Hi-C domains. The estimated exponent for P(s) for regime II is between −0.3 and −0.4, as indicated by the
straight gray line. f, P(s) plots for Hi-C domains located at the telomeric ends of chromosomes (red lines) and for domains located internally (blue lines)
for chromosomes 4, 26 and 59. Hi-C data obtained with cultures enriched in mastigotes. The P(s) plots are very similar for coccoid-enriched cultures.
from such convergent sites (53 out of 441 boundaries). These could structures detected by Hi-C, with the convergent sites forming very
be due to remaining gaps in the assembly, or represent different prominent boundaries, and the divergent loci minor and locally act-
types of structural boundaries. ing boundaries. A clear reduction in GC content (~10%) is observed
We aggregated Hi-C interactions around the sites from which only at convergent boundaries (Fig. 5f,h). All results shown in
divergent unidirectional gene blocks are transcribed within each Fig. 5 were reproduced when we repeated the analysis using
domain (referred to as the bidirectional locus) (Fig. 5g). We observe Smic1.1N (Extended Data Fig. 7).
that, on average, at bidirectional loci the Hi-C interaction map
shows a local boundary; interactions between loci located up to Loss of domains in cells treated with transcription blockers. The
~100 kb upstream and ~100 kb downstream of the bidirectional strong correlation between gene orientation and boundary posi-
locus are depleted. Compared to convergent sites, this boundary tion suggests a mechanistic relationship between transcription and
effect is much weaker and occurs over only relatively short genomic chromatin domain formation. To test this, we treated cells with
distances. In addition, we observe lines of enriched interactions that chemicals that are known to block transcription in other eukary-
form a ‘plus’ sign. This can represent long-range looping interactions otes. We incubated cells for 12 h with combinations of two different
anchored at the bidirectional locus and other loci located at varying concentrations of triptolide (25 µM or 200 µM), and dichlorobenz-
distances either up- or downstream. We conclude that both the con- imidazole 1-β-d-ribofuranoside (DRB; 50 µM or 400 µM), or with
vergent and divergent sites have specific higher order chromosome dimethylsulfoxide (DMSO; control treatment). This treatment led
624 Nature Genetics | VOL 53 | May 2021 | 618–629 | www.nature.com/naturegenetics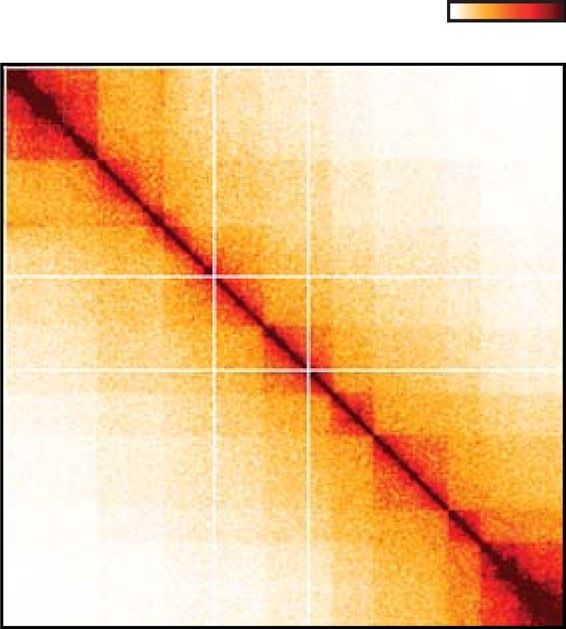
NaTurE GEnETicS Articles
a 0 0.012
b d
Chromosome 19
1.0
Insulation score
Average transcription at domain boundary regions
0
Domain boundaries
1.5
–1.0 Hi-C pile-up
–500
Reads per million mapped
0.20
0.15 1.0 Insulation
0.10 boundary
Boundary
0.05
9.2 Mb
0
–0.05
–0.10 0.5
–0.15
–0.20
0
500
Bin size: 50 kb –500 500 –35 –30 –25 –20 –15 –10 –5 0 5 10 15 20 25 30 35
Boundary Positive relative to domain boundary (kb)
c Chromosomal organization of expression
0.03
Reads mapped to the plus strand
Reads mapped to the minus strand
Genes in the plus strand
Genes in the minus strand
0.02
Relative abundance of mapped reads
0.01
Plus strand
0
Minus strand
0.01
0 2,312,662 4,625,325 6,937,988 9,250,650
Position in chromosome 19 (bp)
e Convergent loci Hi-C pile-up f GC content at convergent loci g Divergent loci Hi-C pile-up h GC content at divergent loci
–500 –500
0.54 0.54
Midpoint
0.20 0.20
0.15 0.15
Divergent site
Convergent site
0.10 0.10
GC content
0.50 0.50 Midpoint
0.05 0.05
GC content
0 0
–0.05 –0.05
–0.10 –0.10 0.46
0.46
–0.15 –0.15
–0.20 –0.20
0.42 0.42
500 500
–500 500 –500 500
Convergent site Divergent site
5
0
5
0
5
0
–5
0
5
10
15
20
25
30
35
5
0
5
0
5
0
–5
0
5
10
15
20
25
30
35
–3
–3
–2
–2
–1
–1
–3
–3
–2
–2
–1
–1
Position relative to the end of transcripution (kb) Position relative to the end of transcripution (kb)
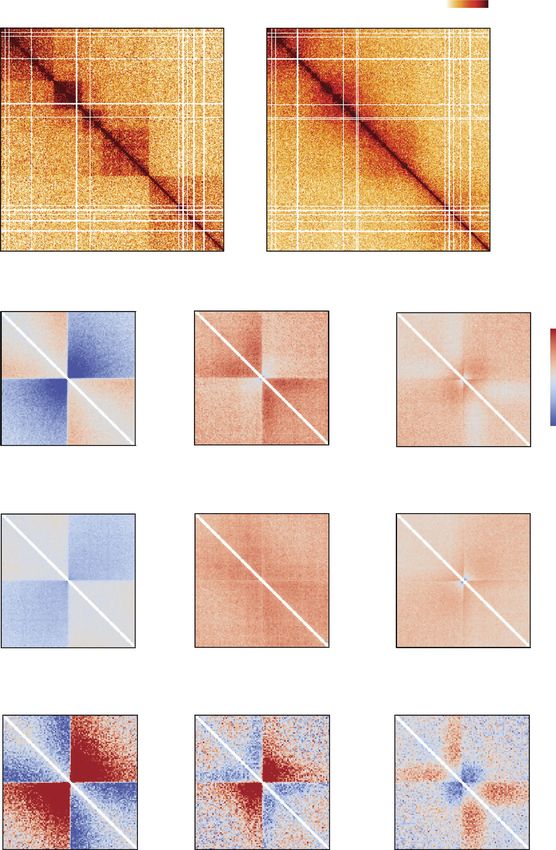
Fig. 5 | Correlation between Hi-C domains and unidirectional gene blocks. a, Hi-C interaction map for chromosome 19 (Smic1.0; bin size = 50 kb) for
mastigotes. Dotted lines indicate domain boundaries. Plot on top of the heatmap represents the insulation profile (10-kb resolution, window size 500 kb).
b, Average Hi-C interactions around the set of 441 domain boundaries (±500 kb) at 10-kb resolution. Data are log10(observed interaction frequency/
expected interaction frequency). c, Chromosome 19 transcription and domain landscape. Indicated are: transcripts mapping to the plus strand (light
blue), transcripts mapping to the minus strand (red), genes on the plus strand (dark blue), genes on the minus strand (dark red), and domain boundaries
(dotted vertical lines). d, Average relative transcription around boundaries. Values are averaged across all domain boundaries in the genome for regions
30 kb upstream and downstream domain boundaries and in 100-bp sliding windows. Dotted lines delimit domain boundary, which is a 10-kb region based
on Hi-C data. The limited amount of transcription observed to proceed through the boundary can be the result of the imprecision of boundary detection
(10 kb). e, Average Hi-C interactions around 280 manually curated convergent sites (±500 kb), previously not identified as domain boundaries, at 10-kb
resolution. Data are log10(observed interaction frequency/expected interaction frequency). f, GC content around all convergent sites. Values are averaged
across all manually curated convergent sites in the genome for regions 35 kb upstream and downstream to the midpoint between two expression blocks
(dotted line) in 100-bp sliding windows. Data are log10(observed interaction frequency/expected interaction frequency). g, Average Hi-C interactions
around 517 manually curated divergent sites (±500 kb) at 10-kb resolution. Data are log10(observed interaction frequency/expected interaction frequency).
h, GC content around divergent sites. Values are averaged across all manually curated divergent sites in the genome for regions 35 kb upstream and
downstream to the midpoint between two expression blocks (dotted line) in 100-bp sliding windows.
to growth arrest but not cell death as cultures resumed growth with while domain boundaries are readily detected in DMSO-treated
a normal doubling rate after the chemicals were washed away. We cells, when cells are treated with either dose of triptolide + DRB,
then performed Hi-C on treated and control cultures. We find that domain boundaries became visibly weaker or disappeared entirely
Nature Genetics | VOL 53 | May 2021 | 618–629 | www.nature.com/naturegenetics 625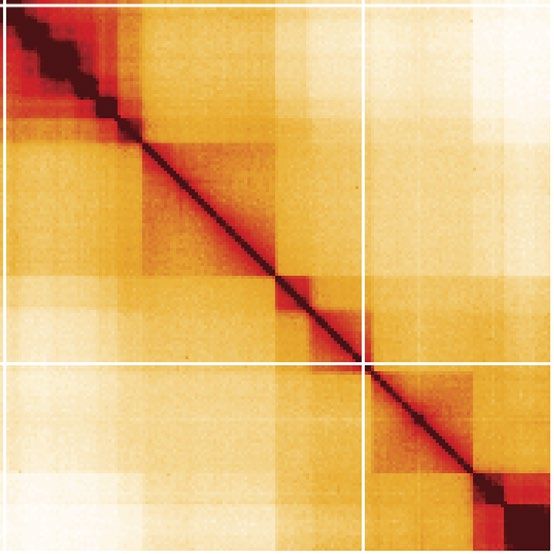
Articles                                                                                                                      NaTurE GEnETicS

(Fig. 6a). Similar results were found when Hi-C data was mapped to                  Various models have been proposed on how DNA is organized
Smic1.1N (Extended Data Fig. 8).                                                in dinoflagellate chromosomes. One principal hallmark of dino-
    To quantify this effect, we aggregated Hi-C data around Hi-C                flagellate chromatin is the observation that most of their DNA is
domain boundaries at sites of convergent transcription and at sites             not wrapped around nucleosomes. Histones are replaced by other
of divergent transcription (as described above). We detect depletion            basic proteins, for example, histone-like proteins derived from bac-
of chromatin interactions across domain boundaries and conver-                  teria and DVNPs derived from viruses19–21. Microscopically, these
gent sites in DMSO-treated cells (Fig. 6b), and this depletion was              chromosomes appear as permanently condensed rods, with some
diminished for cells treated with triptolide and DRB (Fig. 6c,d). We            variation during the cell cycle44. Our Hi-C data are fully consistent
also detected changes in chromatin interaction patterns around sites            with these observations. In one model, this rod-shaped structure
of divergent transcription: in DMSO-treated cells, characteristic               represents a helically coiled toroidal chromonema50. Our data do
local depletion of interactions and line-like features are observed (as         not support this model; first, the model assumes helical folding, but
in Fig. 5g). In cells treated with triptolide and DRB, these features           our Hi-C maps do not show such features, which would lead to peri-
change, with a reduction in short-range interactions at the divergent           odic features in interaction maps, for example, as seen in prometa-
sites, and an increase in longer-range interactions (Fig. 6c,d).                phase chromosomes in chicken cells43. Further, this model assumes
    These observations indicate that chromatin conformation is                  circular chromosomes, which is not observed by Hi-C. The optical
sensitive to treatment of cells with triptolide and DRB. We were                birefringent properties of dinoflagellate chromatin51,52 suggest that
not able to identify conditions where S. microadriaticum takes up               the DNA has liquid-crystalline features. This has led to a model
modified bases, such as 5-ethynyl uridine (EU), and therefore we                where the chromosomes fold as cholesteric liquid crystals22,53–56.
were not able to ascertain that this treatment indeed blocks nascent            Polymer simulations may provide insights into whether our Hi-C
transcription. Based on our data, we can conclude that chromosome               data, and especially the exponent of P(s) plot, are consistent with
conformation is modulated under conditions that block cell growth,              liquid-crystalline folding or not. For loci separated by up to 3 Mb,
possibly through effects on transcription. The fact that domain for-            we find that their interaction frequency decays very slowly with
mation is sensitive to growth conditions shows that domain bound-               increasing genomic distance. The exponent of this decay is around
aries are not due to remaining genome assembly errors.                          −0.4, and even smaller when P(s) is analyzed in domains (−0.3),
                                                                                which is much smaller than what is observed in other eukaryotes
Discussion                                                                      and even smaller than for mammalian mitotic chromosomes. We
We present a chromosome-scale assembly of the genome of the                     considered the possibility that the small exponent we observed was
dinoflagellate S. microadriaticum. This assembly shows the orga-                the result of inefficient formaldehyde crosslinking of chromatin
nization of the genetic information and, together with Hi-C data,               interactions in dinoflagellates. Therefore, we also performed Hi-C
shows insights into the spatial organization of chromosomes in                  using a combination of formaldehyde and disuccinimidyl gluta-
this representative of the unique dinoflagellates. We find that genes           rate (DSG). The Hi-C interaction maps and P(s) plots obtained
are enriched near the telomeric ends and are generally arranged in              this way are very similar (Extended Data Fig. 9), suggesting the
alternating unidirectional blocks. Chromosomes fold in a series of              small exponent is not due to low crosslinking efficiency. The small
domains, with each domain containing a pair of divergently tran-                exponent suggests a very high amount of compaction but does
scribed gene blocks and domain boundaries located where unidi-                  not by itself show how DNA is packed in such layers. Finally, the
rectional gene blocks converge. This observation suggests a close               relationships between the Hi-C domains observed here and micro-
relationship between gene orientation, gene expression and chro-                scopically observed structures, such as the banding pattern along
matin domain formation, which was further supported by our                      liquid-crystalline chromosomes and decondensed loops emanating
observation that domain formation was found to be sensitive to                  from the condensed core48,57,58, remain to be explored.
treatment with triptolide and DRB. Similar results were described                   Mammalian genomes also have domainal features (topologically
recently for a different dinoflagellate species46. Hi-C data confirm            associating domains or TADs59,60) that superficially resemble the
that chromosomes form relatively stiff rod-shaped structures,                   domains we observe here. However, in mammals, TADs do not show
consistent with previous extensive microscopic observations. In                 a correlation with gene orientation. In yeast, small chromosomal
contrast to many other eukaryotes, we did not detect evidence for               domains have been observed that often have boundaries at conver-
chromosome compartmentalization in active and inactive spatial                  gent genes. In Drosophila, a correlation between domain boundar-
compartments. It is possible that the formation of stiff rods prevents          ies, gene density and orientation was observed61. Trypanosomes
long-range compartmental interactions. We did not detect any                    also form unidirectional gene blocks but, in contrast to what
locus-specific point-to-point looping interactions despite collecting           we observe for S. microadriaticum, no correlation between gene
more than 2 billion chromatin interactions for this ~0.8 Gb genome.             orientation and domain formation was described62. The domains
Line-like features in Hi-C maps at divergent sites suggest that loop            we observe here resemble those seen in the prokaryote Caulobacter63;
extrusion events, anchored at these sites, may occur, consistent with           they have sharp boundaries, show a similar nested pattern
the fact that S. microadriaticum expresses cohesin and condensin                and no boundary loops. In Caulobacter, domain boundaries are
complexes. Such loops may be related to microscopic observations                positioned at highly expressed genes and depend on transcrip-
of loops in dinoflagellates44,47–49.                                            tion. Assuming a supercoiled bacterial chromosome, polymer

Fig. 6 | Altered chromosome conformation in cells treated with triptolide and DRB. a, Hi-C interaction maps for a section of chromosome 19 (Smic1.0;
bins size 10 kb) for cells treated with DMSO (control, left) or triptolide (TRP) and DRB (right). Cells were treated with 25 μM TRP + 50 μM DRB or 200 μM
TRP + 400 μM DRB. Both treatments produced similar results, and Hi-C data obtained with the two treatments were pooled. Arrows indicate positions
of domain boundaries that are visible in control cells and that disappear in cells treated with triptolide and DRB. b, Hi-C data (observed/expected) for
DMSO-treated cells, aggregated around domain boundaries (±500 kb; n = 441, left panel), convergent sites (n = 280; middle panel) and divergent sites
(n = 517; right panel). Bin size: 10 kb. Data are log10(observed interaction frequency/expected interaction frequency). c, Hi-C data (observed/expected)
for triptolide + DRB-treated cells, aggregated around domain boundaries (±500 kb; n = 441, left panel), convergent sites (n = 280; middle panel) and
divergent sites (n = 517; right panel). Bin size: 10 kb. Data are log10(observed interaction frequency/expected interaction frequency). d, Change in chromatin
interactions around domain boundaries (±500 kb; n = 441, left panel), convergent sites (n = 288; middle panel) and divergent sites (n = 517; right panel).
Shown is log2[(TRP + DRB)/DMSO]. Bin size: 10 kb.

626                                                                               Nature Genetics | VOL 53 | May 2021 | 618–629 | www.nature.com/naturegenetics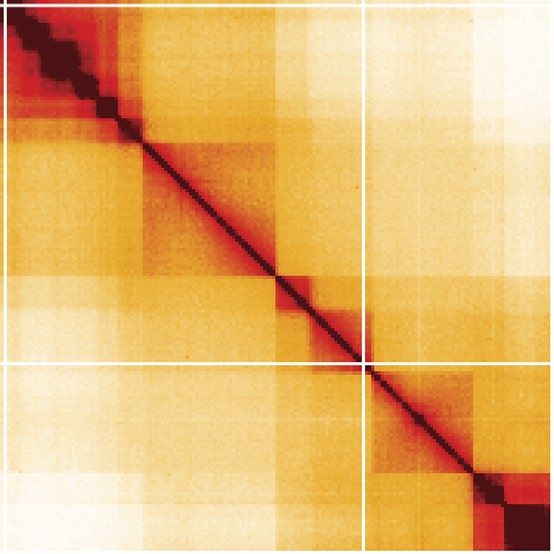
NaTurE GEnETicS                                                                                                                              Articles
simulations had indicated that domain boundaries can form at                            Many of the peculiarities of Symbiodiniaceae genomes,
sites that block diffusion of supercoils63. However, no relation with                such as the unidirectional blocks of genes, the high number of
gene orientation was reported. Future studies are required to test                   genomic genes, the high density of genes or the tandem array
such models or to show alternative mechanisms of domain forma-                       arrangement of genes (among others) could be corroborated
tion in dinoflagellates.                                                             here. In particular, the observation that a portion of the chromo-

             a                                                                                                            0       0.003
                                 Chromosome 19: 1–2.9 MB                                      Chromosome 19: 1–2.9 Mb
                                         DMSO                                                       TPL+DRB           Hi-C count
                   2.9 Mb

             b                                             DMSO-treated cells; log10(observed/expected)

                               Boundaries                                Convergent sites                               Divergent sites
             –500 kb                                    –500 kb                                       –500 kb
                                                                                                                                                   0.2

                                                                                                                                                   0.1

                       0                                      0                                               0                                    0

                                                                                                                                                   –0.1

                                                                                                                                                   –0.2
              500 kb                                     500 kb                                           500 kb
                  –500 kb          0           500 kb        –500 kb            0           500 kb            –500 kb         0           500 kb

             c                                           TPL+DRB-treated cells; log10(observed/expected)

                               Boundaries                                Convergent sites                               Divergent sites
             –500 kb                                    –500 kb                                       –500 kb

                       0                                      0                                               0

                 500 kb                                  500 kb                                           500 kb
                     –500 kb       0           500 kb        –500 kb            0           500 kb            –500 kb         0           500 kb

             d                                                         log2[(TPL+DRB)/DMSO]

                               Boundaries                                Convergent sites                               Divergent sites
             –500 kb                                    –500 kb                                       –500 kb

                       0                                      0                                               0

                 500 kb                                  500 kb                                           500 kb
                     –500 kb       0           500 kb        –500 kb            0           500 kb            –500 kb         0           500 kb

Nature Genetics | VOL 53 | May 2021 | 618–629 | www.nature.com/naturegenetics                                                                             627
Articles NaTurE GEnETicS
somes are enriched for specific biological processes (for example, 15. Gornik, S. G., Hu, I., Lassadi, I. & Waller, R. F. The biochemistry and
photosynthesis, nitrogen cycling and stress response) and that evolution of the dinoflagellate nucleus. Microorganisms 7, 245 (2019).
16. Rizzo, P. J. Those amazing dinoflagellate chromosomes. Cell Res. 13, 215–217
functionally related genes tend to co-occur at adjacent sites in the (2003).
genome, add a previously unobserved amount of chromosomal 17. Bayer, T. et al. Symbiodinium transcriptomes: genome insights into the
functionalization. Notably, in most cases, we found duplications of dinoflagellate symbionts of reef-building corals. PLoS ONE 7, e35269 (2012).
specific genes (rather than sets of genes encoding for entire path- 18. Marinov, G. K. & Lynch, M. Diversity and divergence of dinoflagellate histone
proteins. G3 (Bethesda) 6, 397–422 (2015).
ways), which, in the course of the GO enrichment analysis, are
19. Gornik, S. G. et al. Loss of nucleosomal DNA condensation coincides with
portrayed as pathway enrichments. While this is a limitation of our appearance of a novel nuclear protein in dinoflagellates. Curr. Biol. 22,
analysis, it reflects the notion that specific genes of specific path- 2303–2312 (2012).
ways are enriched. From an adaptation perspective, such a structural 20. Riaz, S. et al. Distinctive nuclear features of dinoflagellates with a particular
organization provides the opportunity for dynamic environmental focus on histone and histone-replacement proteins. Microorganisms 6, 128
(2018).
adaptation through chromosome duplication or loss. Varying chro- 21. Irwin, N. A. T. et al. Viral proteins as a potential driver of histone depletion
mosome counts and polyploidy have been described for field and in dinoflagellates. Nat. Commun. 9, 1535 (2018).
cultured specimens64. 22. Wong, J. T. Y. Architectural organization of dinoflagellate liquid crystalline
The description of the genetic and spatial organization of the chromosomes. Microorganisms 7, 27 (2019).
chromosomes of S. microadriaticum, and that of a different dino- 23. Hou, Y. & Lin, S. Distinct gene number-genome size relationships for
eukaryotes and non-eukaryotes: gene content estimation for dinoflagellate
flagellate Breviolum minutum46, will open new lines of research into genomes. PLoS ONE 4, e6978 (2009).
the mechanisms of chromosome folding in this extraordinary group 24. Shoguchi, E. et al. Draft assembly of the Symbiodinium minutum nuclear
of organisms. In addition, given the ecological importance of dino- genome reveals dinoflagellate gene structure. Curr. Biol. 23, 1399–1408 (2013).
flagellates, the chromosome-scale assembly of their genomes will be 25. Lin, S. et al. The Symbiodinium kawagutii genome illuminates dinoflagellate
instrumental into explaining their unique biology. gene expression and coral symbiosis. Science 350, 691–694 (2015).
26. Lieberman-Aiden, E. et al. Comprehensive mapping of long-range
interactions reveals folding principles of the human genome. Science 326,
Online content 289–293 (2009).
Any methods, additional references, Nature Research report- 27. Kaplan, N. & Dekker, J. High-throughput genome scaffolding from in vivo
ing summaries, source data, extended data, supplementary infor- DNA interaction frequency. Nat. Biotechnol. 31, 1143–1147 (2013).
mation, acknowledgements, peer review information; details of 28. Burton, J. N. et al. Chromosome-scale scaffolding of de novo genome
assemblies based on chromatin interactions. Nat. Biotechnol. 31, 1119–1125
author contributions and competing interests; and statements of (2013).
data and code availability are available at https://doi.org/10.1038/ 29. Imakaev, M. et al. Iterative correction of Hi-C data reveals hallmarks of
s41588-021-00841-y. chromosome organization. Nat. Methods 9, 999–1003 (2012).
30. Blank, R. J. & Trench, R. K. Speciation and symbiotic dinoflagellates. Science
Received: 16 June 2020; Accepted: 9 March 2021; 229, 656–658 (1985).
Published online: 29 April 2021 31. Trench, R. K. & Blank, R. J. Symbiodinium microadriaticum Freudenthal, S.
goreauii, sp. nov., S. kawagutii, sp. nov. and S. pilosum, sp. nov.: gymnodinioid
dinoflagellate symbionts of marine invertebrates. J. Phycol. 23, 469–481 (1987).
References 32. Blank, R. J. & Huss, V. A. R. DNA divergency and speciation in
1. Taylor, F. J. R. The Biology of Dinoflagellates (Blackwell Scientific Publications, Symbiodinium (Dinophyceae). Plant Syst. Evol. 163, 153–163 (1989).
1987). 33. LaJeunesse, T. C., Lambert, G., Andersen, R. A., Coffroth, M. A. & Galbraith,
2. Field, C. B., Behrenfeld, M. J., Randerson, J. T. & Falkowski, P. Primary D. W. Symbiodinium (Pyrrhophyta) genome sizes (DNA content) are smallest
production of the biosphere: integrating terrestrial and oceanic components. among dinoflagellates. J. Phycol. 41, 880–886 (2005).
Science 281, 237–240 (1998). 34. Crane, E. et al. Condensin-driven remodeling of X-chromosome topology
3. Gilbert, P. M., Anderson, D. M., Gentien, P., Graneli, E. & Sellner, K. The during dosage compensation. Nature 523, 240–244 (2015).
global, complex phenomena of harmful algal blooms. Oceanography 18, 35. Li, H. Minimap2: pairwise alignment for nucleotide sequences. Bioinformatics
132–141 (2005). 34, 3094–3100 (2018).
4. LaJeunesse, T. C. et al. Systematic revision of symbiodiniaceae highlights the 36. Kushwaha, H. R., Joshi, R., Pareek, A. & Singla-Pareek, S. L. MATH-domain
antiquity and diversity of coral Endosymbionts. Curr. Biol. 28, 2570–2580 e6 family shows response toward abiotic stress in Arabidopsis and rice. Front.
(2018). Plant Sci. 7, 923 (2016).
5. Hughes, T. P. et al. Spatial and temporal patterns of mass bleaching of corals 37. Yagi, Y. et al. Pentatricopeptide repeat proteins involved in plant organellar
in the Anthropocene. Science 359, 80–83 (2018). RNA editing. RNA Biol. 10, 1419–1425 (2013).
6. Hughes, T. P. et al. Global warming and recurrent mass bleaching of corals. 38. Mayer, R. et al. Common themes and cell type specific variations of higher
Nature 543, 373–377 (2017). order chromatin arrangements in the mouse. BMC Cell Biol. 6, 44 (2005).
7. Lin, S. Genomic understanding of dinoflagellates. Res. Microbiol. 162, 39. Adams, M. D. et al. The genome sequence of Drosophila melanogaster. Science
551–569 (2011). 287, 2185–2195 (2000).
8. Erdner, D. L. & Anderson, D. M. Global transcriptional profiling of the toxic 40. Li, X.-Q. & Du, D. Gene direction in living organisms. Sci. Rep. 2, 982 (2012).
dinoflagellate Alexandrium fundyense using massively parallel signature 41. Lajoie, B. R., Dekker, J. & Kaplan, N. The Hitchhiker’s guide to Hi-C analysis:
sequencing. BMC Genomics 7, 88 (2006). practical guidelines. Methods 72, 65–75 (2015).
9. Baumgarten, S. et al. Integrating microRNA and mRNA expression profiling 42. Naumova, N. et al. Organization of the mitotic chromosome. Science 342,
in Symbiodinium microadriaticum, a dinoflagellate symbiont of reef-building 948–953 (2013).
corals. BMC Genomics 14, 704 (2013). 43. Gibcus, J. H. et al. A pathway for mitotic chromosome formation. Science
10. Barshis, D. J., Ladner, J. T., Oliver, T. A. & Palumbi, S. R. Lineage-specific 359, eaao6135 (2018).
transcriptional profiles of Symbiodinium spp. unaltered by heat stress in a 44. Bhaud, Y. et al. Morphology and behaviour of dinoflagellate chromosomes
coral host. Mol. Biol. Evol. 31, 1343–1352 (2014). during the cell cycle and mitosis. J. Cell Sci. 113, 1231–1239 (2000).
11. Liew, Y. J., Li, Y., Baumgarten, S., Voolstra, C. R. & Aranda, M. 45. Dekker, J. Mapping in vivo chromatin interactions in yeast suggests an
Condition-specific RNA editing in the coral symbiont Symbiodinium extended chromatin fiber with regional variation in compaction. J. Biol.
microadriaticum. PLoS Genet. 13, e1006619 (2017). Chem. 283, 34532–34540 (2008).
12. Bachvaroff, T. R. & Place, A. R. From stop to start: tandem gene arrangement, 46. Marinov, G. K. et al. Transcription-dependent domain-scale
copy number and trans-splicing sites in the dinoflagellate Amphidinium three-dimensional genome organization in the dinoflagellate Breviolum
carterae. PLoS ONE 3, e2929 (2008). minutum. Nat. Genet. https://doi.org/10.1038/s41588-021-00848-5 (2021).
13. Beauchemin, M. et al. Dinoflagellate tandem array gene transcripts are highly 47. Soyer-Gobillard, M. O. et al. Location of B- and Z-DNA in the chromosomes
conserved and not polycistronic. Proc. Natl Acad. Sci. USA 109, 15793–15798 of a primitive eukaryote dinoflagellate. J. Cell Biol. 111, 293–304 (1990).
(2012). 48. Sala-Rovira, M. et al. Molecular cloning and immunolocalization of two
14. Aranda, M. et al. Genomes of coral dinoflagellate symbionts highlight variants of the major basic nuclear protein (HCc) from the histone-less
evolutionary adaptations conducive to a symbiotic lifestyle. Sci. Rep. 6, 39734 eukaryote Crypthecodinium cohnii (Pyrrhophyta). Chromosoma 100,
(2016). 510–518 (1991).
628 Nature Genetics | VOL 53 | May 2021 | 618–629 | www.nature.com/naturegeneticsYou can also read