The value of satellite observations in the analysis and short-range prediction of Asian dust - atmos-chem-phys.net
←
→
Page content transcription
If your browser does not render page correctly, please read the page content below
Atmos. Chem. Phys., 19, 987–998, 2019
https://doi.org/10.5194/acp-19-987-2019
© Author(s) 2019. This work is distributed under
the Creative Commons Attribution 4.0 License.

The value of satellite observations in the analysis and
short-range prediction of Asian dust
Angela Benedetti1 , Francesca Di Giuseppe1 , Luke Jones1 , Vincent-Henri Peuch1 , Samuel Rémy2 , and Xiaoye Zhang3,4
1 European  Centre for Medium-Range Weather Forecasts (ECMWF), Reading, UK
2 InstitutPierre-Simon Laplace, CNRS/Sorbonne Université, Paris, France
3 State Key Laboratory of Severe Weather & Key Laboratory of Atmospheric Chemistry of CMA,

Chinese Academy of Meteorological Sciences, Beijing, China
4 Center for Excellence in Regional Atmospheric Environment, IUE, CAS, Beijing, China

Correspondence: Angela Benedetti (a.benedetti@ecmwf.int)

Received: 24 January 2018 – Discussion started: 10 April 2018
Revised: 10 January 2019 – Accepted: 11 January 2019 – Published: 24 January 2019

Abstract. Asian dust is a seasonal meteorological phe-              smaller normalized mean bias and fractional gross error with
nomenon which affects east Asia, and has severe conse-              respect to the independent verification datasets. The impact
quences on the air quality of China, North and South Ko-            of the assimilated satellite observations is larger at analysis
rea and Japan. Despite the continental extent, the predic-          time, but lasts into the forecast up to 48 h. The performance
tion of severe episodes and the anticipation of their conse-        of the global model in terms of particulate matter does not
quences is challenging. Three 1-year experiments were run           show the same degree of skill as the performance in terms
to assess the skill of the model of the European Centre for         of optical depth. Despite this, the global model is able to
Medium-Range Weather Forecasts (ECMWF) in monitor-                  capture some regional pollution patterns. This indicates that
ing Asian dust and understand its relative contribution to the      the global model analyses may be used as boundary condi-
aerosol load over China. Data used were the Moderate Reso-          tions for regional air quality models at higher resolution, en-
lution Imaging Spectroradiometer (MODIS) Dark Target and            hancing their performance in situations in which part of the
the Deep Blue aerosol optical depth (AOD). In particular            pollution may have originated from large-scale mechanisms.
the experiments aimed at understanding the added value of           While assimilation is not a substitute for model development
data assimilation runs over a model run without any aerosol         and characterization of the emission sources, results indicate
data. The year 2013 was chosen as representative of the             that it can play a role in delivering improved monitoring of
availability of independent AOD data from two established           Asian dust optical depth.
ground-based networks (AERONET, Aerosol Robotic Net-
work, and CARSNET, China Aerosol Remote Sensing Net-
work), which could be used to evaluate experiments. Particu-
late matter (PM) data from the China Environmental Protec-
tion Agency were also used in the evaluation. Results show          1   Introduction
that the assimilation of satellite AOD data is beneficial to pre-
dict the extent and magnitude of desert dust events and to im-      Asian dust is a seasonal meteorological phenomenon which
prove the short-range forecast of such events. The availability     affects east Asia, particularly during spring. Dust is trans-
of observations from the MODIS Deep Blue algorithm over             ported from the deserts of Taklimakan, Mongolia, northern
bright surfaces is an asset, allowing for a better localization     China and Kazakhstan and can travel over long distances, af-
of the sources and definition of the dust events. In general        fecting the air quality of China, North and South Korea and
both experiments constrained by data assimilation perform           Japan. Occasionally, the dust can even be transported over the
better than the unconstrained experiment, generally showing         ocean over thousands of kilometers and reach the coasts of
                                                                    North America. Measurements at Mauna Loa, Hawaii, show

Published by Copernicus Publications on behalf of the European Geosciences Union.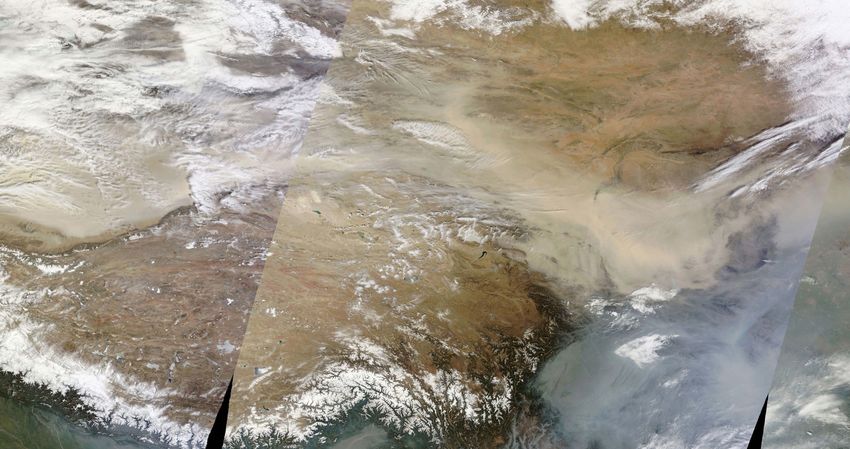
988                                             A. Benedetti et al.: The value of satellite observations for Asian dust analysis

the presence of dust of Asian origin (Shaw, 1980; Darzi and          cially in near-real time (NRT). A study by Uno et al. (2006)
Winchester, 1982; Holmes and Zoller, 1996).                          compared eight state-of-the-art dust models and showed that
   Dust is becoming a more serious concern due to the in-            emission fluxes from the Taklimakan desert and Mongolia
crease of industrial pollutants contained in it, also in con-        strongly differ among the models. They suggested that mea-
nection to intensified desertification in China causing longer       surements of dust flux and accurate updated land use infor-
and more frequent occurrences, both linked to climate fac-           mation are important to improve the models over these re-
tors and to land use change in west Asia (Zhang et al., 2003;        gions. They also found that modeling of dust transport and
Chuluun and Ojima, 2002). Areas affected by dust experi-             removal processes over key regions needs to be improved in
ence poor air quality and, as a consequence, dust is known           order to obtain more skillful dust prediction that could un-
to cause a variety of health problems, including sore throats        derpin warning systems, improve preparedness and possibly
and asthma in otherwise healthy people. Often, people are            lessen the impacts.
advised to avoid or minimize outdoor activities, depending              Although modeling problems need to be tackled at the
on the severity of the storms. For those who already have            level of the parameterization of the physical, dynamical and
asthma or respiratory infections, dust-related pollution can         radiative processes, data assimilation of dust-related observa-
be fatal (Lee et al., 2013; Goudie, 2014; Chen et al., 2011).        tions such as optical depth and lidar backscatter from satellite
The economic impact of dust storms connected to reduced              sensors can help alleviate problems and improve the forecast
air visibility, canceled flights and disrupted ground travel can     of dust events. This has been shown for example in a pio-
also be high (Jeong, 2008).                                          neering work by Sekiyama et al. (2010), in which the authors
   Because of its health, social and economical impacts, it is       show that assimilation of data from the Cloud-Aerosol Lidar
critical to understand the source strength, transport and de-        and Infrared Pathfinder Satellite Observations (CALIPSO) li-
position of dust and to establish sand and dust storms (SDS)         dar in an ensemble Kalman filter framework improves the
forecasting and early warning capabilities. Under the aus-           model simulation of Aeolian dust events. Assimilation efforts
pices of the World Meteorological Organization (WMO), the            to specifically improve dust prediction have been undertaken
need for a global SDS forecasting and early warning system           at the global and regional scale by several institutes, both us-
was highlighted in 2005. More than 40 member countries ex-           ing ensemble methods in which emissions are also perturbed
pressed interest in participating in activities to improve ca-       (Lin et al., 2008; Rubin et al., 2016; Di Tomaso et al., 2017)
pacities for more reliable SDS monitoring, forecasting and           and variational methods (Niu et al., 2008; Liu et al., 2011).
assessment. The SDS-WAS (Warning and Assessment Sys-                 All studies show the positive impact of satellite and in situ
tem) was launched in 2007 with the mission to enhance the            data assimilation in desert-dust-affected regions for high load
ability of countries to deliver timely and quality sand and          episodes, with some impact lasting into the forecast range.
dust storm forecasts, observations and information to users             Progress has been made in recent years thanks to the de-
through an international partnership of research and opera-          ployment of accurate, multi-channel aerosol sensors on satel-
tional communities. Towards this goal, three regional centers        lite platforms and the improvement of ground-based net-
have been created: the Northern Africa–Middle East–Europe            works which are now offering stable observations of good
(NAMEE) node, the Pan-American node and the Asian node.              quality over long periods and increasingly in NRT. Given
The latter is hosted by the Chinese Meteorological Adminis-          these opportunities in this paper, we will investigate the
tration (CMA) and its focus is Asian dust prediction (Zhang          added benefit of data assimilation for the desert dust anal-
and coauthors, 2015). Member countries of the Asian node             ysis and short-range prediction using ECMWF’s Integrated
include Japan, South Korea, Mongolia and Kazakhstan. All             Forecasting System (IFS) and aerosol optical depth (AOD)
centers run their forecast models for the specific region            observations from Moderate Resolution Imaging Spectrora-
(Gong and Zhang, 2008; Park et al., 2010). Some models               diometer (MODIS), which are now also available on bright
such as that of the Japan Meteorological Agency run at the           surfaces (Deep Blue collection) in the framework of the 4D-
global scale (Tanaka and Chiba, 2005). The European Centre           Var assimilation system extended to aerosol species (Courtier
for Medium-Range Weather Forecasts (ECMWF) also con-                 et al., 1994; Benedetti et al., 2009). The novelty with respect
tributes its dust forecasts to the Asian node through a partner-     to previous studies that also employed MODIS observations
ship between the Copernicus Atmosphere Monitoring Ser-               (i.e., Liu et al., 2011) rests in the use of a fully operational
vice (CAMS) and CMA1 .                                               4D-Var system in which the model dynamics serve as a con-
   Despite the recognized relevance, Asian dust monitoring           straint during the assimilation. For dust storms of synoptic
and forecasting are still a challenge due to the poor char-          extent, this constraint might imply a longer lasting impact of
acterization of the sources, which have strong spatial and           the assimilated data into the forecast range. The verification
temporal variability, and the paucity of observational data          of the analysis and forecast benefits from the availability of
available to characterize both emissions and transport, espe-        data from the Aerosol Robotic Network (AERONET; Hol-
                                                                     ben et al., 1998, 2001), as well from the China Aerosol Re-
   1 See http://eng.nmc.cn/sds_was.asian_rc/ (last access: 21 Jan-   mote Sensing Network (CARSNET; Che et al., 2015). Addi-
uary 2019) for further reference.                                    tionally, PM data from the China Environmental Protection

Atmos. Chem. Phys., 19, 987–998, 2019                                                  www.atmos-chem-phys.net/19/987/2019/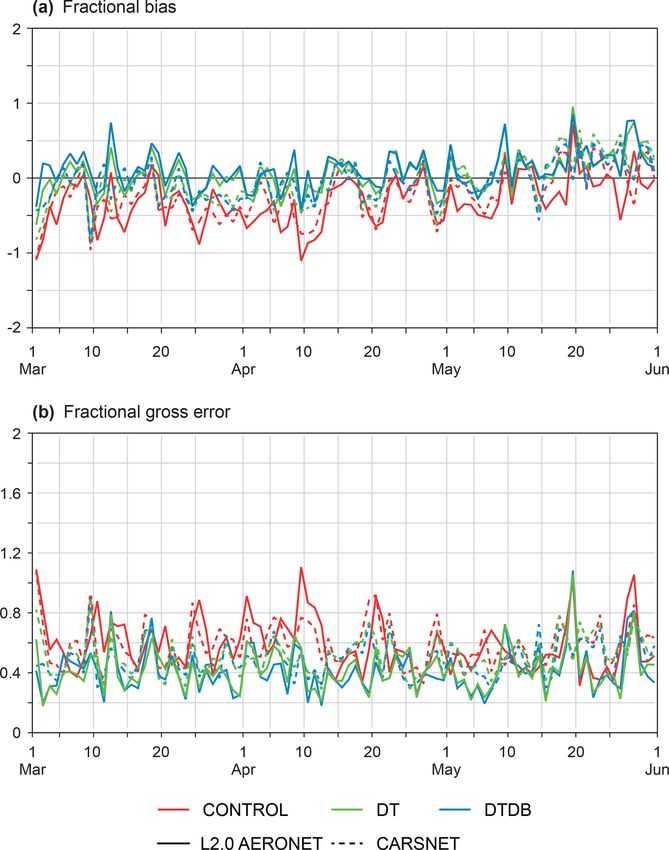
A. Benedetti et al.: The value of satellite observations for Asian dust analysis                                                989

Agency (CEPA) are also used to assess the value of AOD             also includes chemically reactive tracers such as ozone, car-
assimilation in surface PM forecasts.                              bon monoxide, NOx and formaldehyde, as well as green-
                                                                   house gases.
                                                                      The ECMWF CAMS system is used operationally to pro-
2   Description of the ECMWF CAMS system                           vide global forecasts of aerosols, reactive gases and green-
                                                                   house gases, as well as boundary conditions for higher res-
Desert dust forecasts are provided by the ECMWF CAMS               olution regional models proving air quality forecasts over
system, which is a comprehensive modeling and assimila-            Europe. Data are freely available from the CAMS web-
tion system based on the IFS developed at ECMWF with               site (https://atmosphere.copernicus.eu/; last access: 21 Jan-
the extended capabilities of including atmospheric com-            uary 2019).
position tracers in the transport model and in the analy-
sis (Flemming et al., 2015). The system has been devel-
oped in the CAMS precursor projects, Global and Regional           3   Methodology and experimental setup
Earth System Monitoring Using Satellite and In Situ Data
(GEMS; Hollingsworth et al., 2008) and Monitoring Atmo-            The ECMWF CAMS system also runs a 4D-Var assimilation
spheric Composition and Climate (MACC; Peuch and Enge-             of satellite- and ground-based data for the meteorological
len, 2012). Aerosols are forecast within the ECMWF CAMS            variables as well as the atmospheric composition variables.
global system by an aerosol model (Morcrette et al., 2009),        The aerosol assimilation uses total aerosol mixing ratio as
based on earlier work by Reddy et al. (2005) and Boucher           a control variable. Each aerosol species is assumed to con-
et al. (2002) that uses five species: dust, sea salt, black car-   tribute to the total aerosol mixing ratio according to a frac-
bon, organic carbon and sulfates. In the version of the model      tional contribution which is assumed constant over the 12 h
used in this study, nitrates were not included. More recent        assimilation window. At the end of the minimization, the in-
versions of the model do include this important aerosol com-       crements in total aerosol mixing ratio are distributed to the
ponent.                                                            individual species according to their fractional contribution
   Dust aerosols specifically are represented by three prog-       to the total mass. A forward model is used to calculate the
nostic variables that correspond to three size bins, with bin      aerosol optical depth (AOD) from the individual components
limits of 0.03, 0.55, 0.9 and 20 µm radius. Specific dust          using a lookup table approach. The aerosol optical properties
processes that are parameterized are the production of dust        are prescribed according to Bozzo et al. (2017). During the
through saltation and removal by wet and dry deposition and        minimization, the tabulated optical properties of the individ-
sedimentation. Various areas are marked as having the po-          ual species are retrieved and used in the calculation of the
tential to emit dust based on surface albedo, moisture of the      total extinction. The vertical integral of the extinction profile
top soil level and bare soil fraction. Dust emissions are pa-      provided the total AOD, which is the observed quantity, at
rameterized following Ginoux et al. (2001) as a function of        every observation location. The vertical profile of the aerosol
the cubic power of 10 m wind speed. A correction is also ap-       mixing ratio is not modified by the assimilation as only AOD
plied to account for gustiness as described in Morcrette et al.    is used as observation. Thus, the vertical profile is largely
(2008). Dry deposition depends on a prescribed deposition          dictated by the model and the distribution of the increments
velocity and on the aerosol concentration in the model level       in the vertical is due to the vertical structure function in the
closer to the surface.                                             background error.
   For sea salt, a bin representation is used and emissions are       AOD data at 550 nm from the MODIS sensors on board
also parameterized as a function of surface winds. For all         the Terra and Aqua satellites have been assimilated in the
other tropospheric aerosols (carbonaceous aerosols and sul-        ECMWF 4D-Var system since 2008 (Benedetti et al., 2009).
fates), a bulk parameterization is used and emission sources       Initially, only the Dark Target product was used (Levy et al.,
are defined according to established inventories (Lamarque         2010). Since 2015, both MODIS Dark Target and Deep Blue
et al., 2010). Biomass burning emissions contributing to           (Hsu et al., 2013) data have been used. Deep Blue offers
black carbon and organic matter loads are prescribed from          the advantage of providing aerosol optical depth (AOD) re-
the Global Fire Assimilation System (GFAS; Kaiser et al.,          trievals over bright surfaces, which is of particular interest for
2012). Removal processes include sedimentation for dust and        getting insight on dust sources by means of data assimilation.
sea salt only, and wet and dry deposition and in-cloud and         It can be assumed that over deserts the biggest contribution
below-cloud scavenging for all particles. A simplified repre-      to AOD comes from dust aerosols, even if the analysis uses
sentation of the sulfur cycle is also included with only two       total AOD and the other aerosol species are also included.
variables, sulfur dioxide (SO2 ) acting as a precursor for sul-    Recently, MODIS Collection (Col.) 6 has become available
fate (SO4 ) in particulate form. Overall, a total of 12 addi-      (Levy et al., 2013; Sayer et al., 2013, 2014). This is the col-
tional prognostic variables for the mass mixing ratio of the       lection that has been used in this study.
different components (bins or types) of the various aerosols          The operational ECMWF CAMS system also uses AOD
are used in this configuration. The ECMWF CAMS system              data from the MetOp Polar Multi-sensor Aerosol prod-

www.atmos-chem-phys.net/19/987/2019/                                                   Atmos. Chem. Phys., 19, 987–998, 2019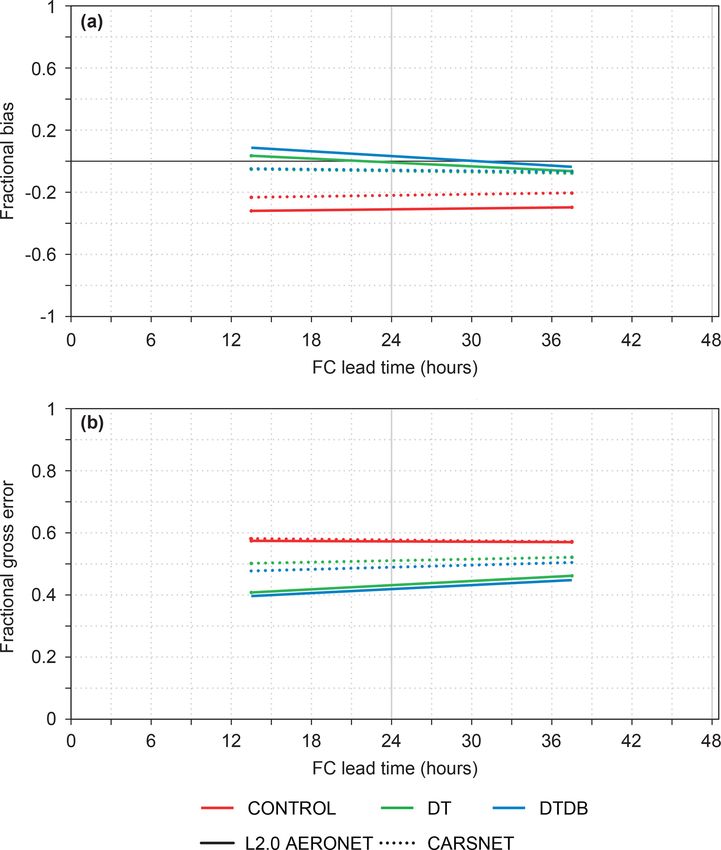
990 A. Benedetti et al.: The value of satellite observations for Asian dust analysis
uct (PMAp), operationally provided by EUMETSAT after
February 2014, and hence not available for the experiments
outlined in this paper. Assimilation of this product for the
purpose of the application outlined here would need an inde-
pendent assessment.
To investigate the impact of the assimilation on the dust
prediction, three experiments were set up for the whole
of 2013: one experiment with 4D-Var data assimilation of
MODIS Col. 6 with the exclusion of Deep Blue data (indi-
cated hereafter as DT), one experiment with 4D-Var assimi-
lation of MODIS Col. 6 data with the inclusion of Deep Blue
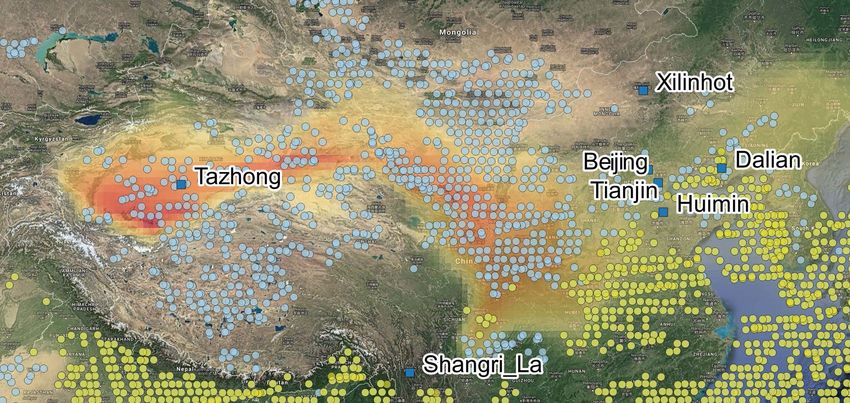
Figure 1. Desert dust event forecast by the CAMS system for
data (indicated as DTDB) and one control experiment with
9 March 2013 (shaded) with observation locations from the Dark
free-running aerosols (indicated as CONTROL). In the con- Target (yellow dots) and the Deep Blue algorithms (blue dots) from
trol experiment, no aerosol data are assimilated in the analy- MODIS Collection 6 used in the assimilation experiments. A few
sis. In this paper, we focus on results during the spring sea- in situ verification stations are also highlighted. For these stations
son (March–April–May 2013), when several marked events detailed results are provided.
occurred.
The horizontal resolution of the operational version run in
the context of CAMS is currently 40 km with 60 vertical lev-
els and model top at 0.1 hPa. The experiments shown here
were run with a previous version of the system, compara-
ble with the CAMS configuration for 2013, with a horizontal
resolution of 80 km and the same number of vertical levels.
4 Outcomes of the investigation
4.1 Comparisons with independent AOD datasets
Results from the three experiments (DT, DTDB and CON-
TROL) are presented in the following. Comparisons were Figure 2. NASA Worldview image for 9 March 2013 (https://go.
made with independent datasets from AERONET and nasa.gov/2FI0vbI; last access: 21 January 2019).
CARSNET. AERONET data are routinely used for the ver-
ification of the ECMWF CAMS forecasts, but this is the
first time that the CARSNET dataset has been used in As an example of the extent of these types of events,
this context. Model data were bilinearly interpolated to the Fig. 1 shows the 9 March dust storm as simulated by the
AERONET and CARSNET site locations and then averaged ECMWF model, along with the coverage provided by the
over 24 h periods (from T +3 to T +24). AERONET data are MODIS Dark Target and Deep Blue AOD retrievals. Com-
similarly averaged, with each data value receiving a weight paring with the satellite image on the same day (Fig. 2), cour-
proportional to the time difference between the data values tesy of NASA, the model shows a good degree of qualitative
before and after it, up to a maximum of 3 h. The CARSNET agreement with the observations.
data used were already in the form of daily averages and no This particular dust storm was analyzed in detail by
further averaging was done. Chauhan et al. (2016). The storm originated in the Takli-
While the entire year was considered, we focus in this pa- makan and dust was first transported to northeastern China
per on the spring season when Asian dust is at its peak due and further transported to the southeast. The air quality in
to the seasonal increased frequency of cyclonic weather sys- Beijing was severely affected as the sandstorm spread. The
tems with associated high surface wind speeds. At this time dust further propagated to the Korean Peninsula and Japan.
of the year the contrast between warm air masses in the south Figure 3 shows a first look at the model performance via
and cold air masses from Siberia and Mongolia is maximum. 2-D histograms of model versus observed values of AOD at
The high north–south thermal gradient can give rise to situ- 440 nm for March–May 2013. All stations are considered
ations characterized by a high baroclinic instability, with the together. Data are plotted for central–northern China (30–
development of fast developing and moving lows associated 45◦ N, 75–135◦ E). Visual inspection of the plots shows that
with high winds over the dust-emitting regions of the Takli- both assimilation experiments have a more similar distribu-
makan and Gobi deserts and inner Mongolia. tion than the control experiment with respect to the obser-
vations, particularly for large dust events (red shades). The
mean of the observations is 0.593 versus 0.481 for exper-
Atmos. Chem. Phys., 19, 987–998, 2019 www.atmos-chem-phys.net/19/987/2019/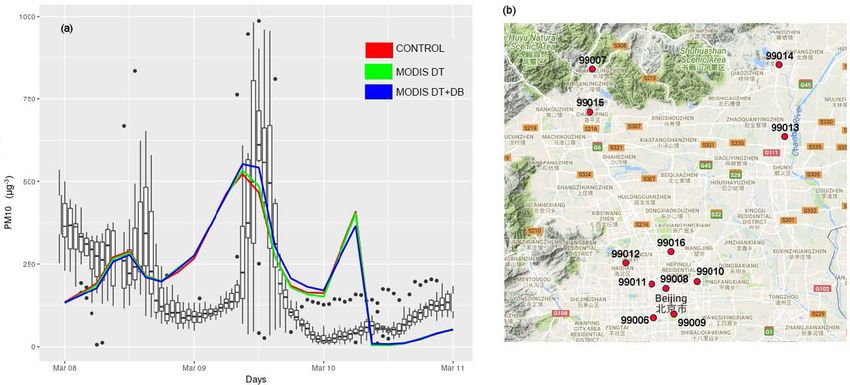
A. Benedetti et al.: The value of satellite observations for Asian dust analysis                                                 991

Figure 3. Two-dimensional histogram of modeled versus observed AOD at 440 nm for all stations (33 in total) in central–northern China
(30–45◦ N, 75–135◦ E). Panel (a) shows experiment CONTROL, panel (b) shows experiment DT and panel (c) shows experiment DTDB.
FC stands for forecast (model simulation) and OB stands for observations.

Figure 4. Fractional bias for aerosol optical depth at 440 nm with respect to AERONET (circles) and CARSNET (squares) data:
panel (a) shows the experiment CONTROL, panel (b) shows experiment DT (with only Dark Target MODIS retrievals in the assimilation),
and panel (c) shows experiment DTDB (with both Dark Target and Deep Blue MODIS retrievals in the assimilation).

iment CONTROL, 0.599 for experiment DT and 0.602 for                     Figure 4 shows maps of FB for aerosol optical depth
experiment DTDB. Correlation is the highest for experiment           (AOD) at 440 nm with respect to all AERONET and
DTDB at 0.725 versus 0.707 for experiment DT and 0.668               CARSNET sites for March–May 2013 over central–northern
for experiment CONTROL.                                              China at the analysis time. Within a certain margin of noise,
   The statistical indicators presented here are fractional bias     it is possible to see that the performance of both experiments
(FB, sometimes also referred to as modified normalized               including assimilated MODIS data is more skillful than that
mean bias) and fractional gross error (FGE), although other          of the control experiment. The figure also shows that includ-
indicators have been analyzed and have been found to lead to         ing the Deep Blue data, which provide aerosol optical depth
similar conclusions. The mathematical definitions for these          information over bright surfaces, helps to further reduce the
parameters are the following:                                        bias with respect to the ground-based observations. Figure 5
                                                                     shows maps of FGE and confirms that the error with respect
           n
        2X    fi − o i                                               to the independent observations is reduced in the runs with
 FB =                                                       (1)      assimilated satellite data.
        n i=1 fi + oi
           n
                                                                         Time series of FB and FGE average over the same area are
        2X    | fi − o i |                                           shown in Fig. 6. Again, the improvement in bias and error in
FGE =                      ,                                (2)
        n i=1 | fi + oi |                                            the assimilation experiments is visible. The model has gener-
                                                                     ally a similar bias when compared to the CARSNET obser-
where fi is the model output and oi are the observations; n          vations and AERONET stations over this region. The bias is
represents the total number of observations. The FB is nor-          particularly large for the CONTROL experiment, except for
malized to make it non-dimensionless. It varies between +2           some days. Yet again the experiments with assimilated satel-
and −2 and has an ideal value of zero for a perfect model            lite data perform visibly better than the CONTROL. If we
(and perfect observations). The FGE ranges between 0 and 2           focus on the FGE, its maximum value during the study pe-
and behaves symmetrically with respect to under- and over-           riod reached values of 1. Focusing, for example, on 10 April,
estimation, without overemphasizing outliers (as instead the         the error in the experiment CONTROL is close to 1.1 with re-
root mean square error does). See Yu et al. (2006) for further       spect to the AERONET stations (solid red line) and 0.7 with
information.                                                         respect to the CARSNET station (dotted red line). However,

www.atmos-chem-phys.net/19/987/2019/                                                     Atmos. Chem. Phys., 19, 987–998, 2019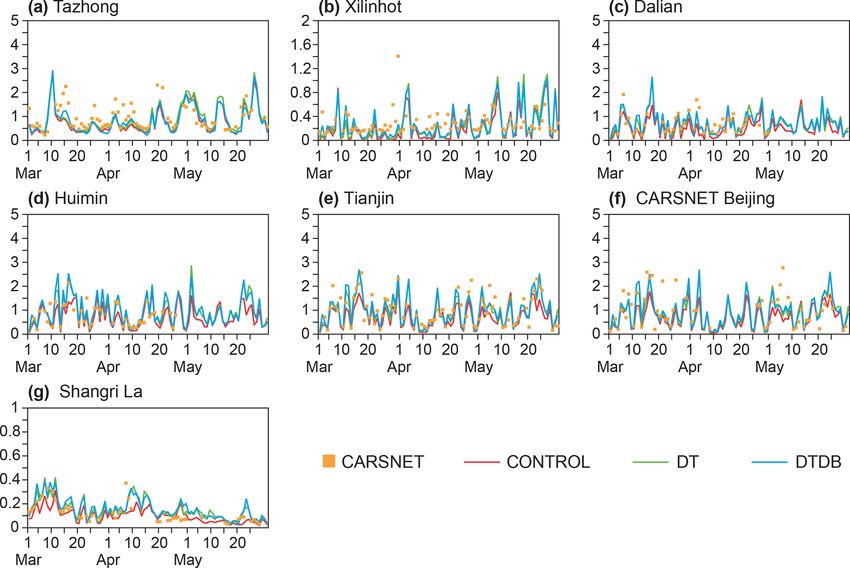
992                                                 A. Benedetti et al.: The value of satellite observations for Asian dust analysis

Figure 5. As in for Fig. 4 but for fractional gross error.

                                                                        iments. This indicates the additional benefits of including ob-
                                                                        servational satellite information over source areas. Curiously
                                                                        on 10 March one can observe a similar behavior but this time
                                                                        with respect to the AERONET observations, with the FGE
                                                                        going from 0.9 in the CONTROL (red solid line) to 0.4 in
                                                                        experiments DT and DTDB (green and blue solid lines) for
                                                                        an improved agreement with the AOD at the AERONET sta-
                                                                        tions close to 60 %. In this case, the satellite data have im-
                                                                        proved the analysis observations downwind of the storm (see
                                                                        Fig. 1).
                                                                           Specific sites in China have also been selected in order
                                                                        to understand the model skill in both remote and urbanized
                                                                        regions that are particularly affected by Asian dust plumes.
                                                                        The agreement between the experiments and independent ob-
                                                                        servations is generally better for AERONET stations than
                                                                        CARSNET stations with generally lower normalized mean
                                                                        bias and FGE, highlighting the fact that the arid Asian re-
                                                                        gions where some of the CARSNET stations are located are
                                                                        more challenging for the model to represent correctly.
                                                                           This can also be seen in Fig. 7 in which the model is com-
                                                                        pared with the observations at several CARSNET stations
                                                                        over the whole spring season of 2013. The increase in AOD
                                                                        corresponding to the passage of the 9 March storm shown
                                                                        in Fig. 1 is evident in the ground-based CARSNET observa-
                                                                        tions. The magnitude of the dust peak in the source region is
                                                                        best captured by the runs with assimilated Deep Blue AOD
                                                                        data, even though the secondary dust peak is still underesti-
Figure 6. Time series of fractional bias (a) and fractional gross
                                                                        mated by the model, as shown in the time series for Tazhong
error (b) in AOD at 440 nm averaged over the central–northern
                                                                        (39.0◦ N–83.67◦ E). The improvement coming from assimi-
China area (33 sites). Solid lines are relative to AERONET data,
whereas dotted lines are relative to CARSNET data. Red is exper-        lation is especially felt downwind of the source regions, as
iment CONTROL, green is experiment DT and blue is experiment            seen for example in Shangri-La (28.03◦ N–99.73◦ E) to the
DTDB.                                                                   southeast and Xilinhot (43.95◦ N–116.12◦ E) to the north-
                                                                        east.

                                                                        4.2   Impact of the assimilation on the short-range AOD
the FGE for the DT and DTDB experiments is around 0.2                         forecasts
for AERONET stations (green and blue solid lines) and 0.4
for CARSNET stations (green and blue dotted lines), with                In the previous subsection, results have been presented
a 50 %–80 % reduction in error due to the assimilation of               that show how assimilation of AOD satellite data from the
satellite data. However, on other dates, the improvement is             MODIS retrievals brings beneficial improvements to the sim-
less marked. The dust storm case of 9 March is quite inter-             ulation of AOD within the ECMWF CAMS system. The im-
esting. The FGE is 0.9 for all experiments with respect to the          pact on the analysis is clearly shown in the improvement in
CARSNET data (red, green and blue dotted lines), but is re-             the FB and FGE. The question that might arise at this point
duced to 0.3 the following day with a faster decrease for the           is whether the impact of the assimilated satellite data is only
DTDB experiment (blue dotted line) than for the other exper-            felt at the analysis time or whether it carries on to the subse-

Atmos. Chem. Phys., 19, 987–998, 2019                                                     www.atmos-chem-phys.net/19/987/2019/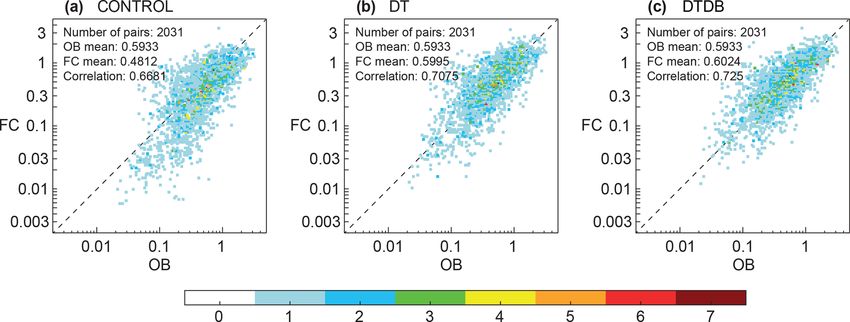
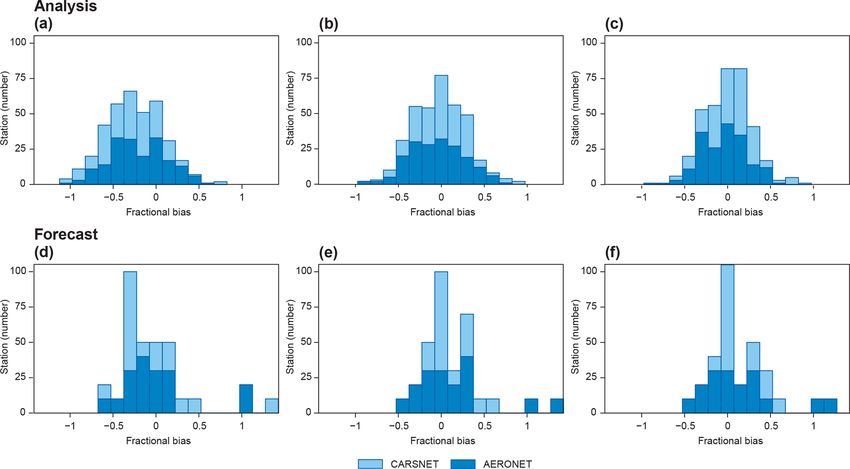
A. Benedetti et al.: The value of satellite observations for Asian dust analysis                                                     993

Figure 7. Comparison of CARSNET aerosol optical depth data (blue squares) with model aerosol optical depth at several CARSNET
stations highlighted in Fig. 1 during the period March–May 2013. Red corresponds to experiment CONTROL, green to experiment DT
and blue to experiment DTDB. From (a) to (g): Tazhong (39.0◦ N–83.67◦ E), Xilinhot (43.95◦ N–83.67◦ E), Dalian (38.90◦ N–121.63◦ E),
Huimin (37.48◦ N–117.53◦ E), Tianjin (39.10◦ N–117.17◦ E), Beijing (39.80◦ N–116.47◦ E) and Shangri-La (28.02◦ N–99.73◦ E).

Figure 8. The histograms on the top and bottom rows are constructed using data from all stations displayed in the map of Fig. 4 and are
valid at the analysis and 48 h forecast times, respectively. Panels (a) and (d) are relative to the experiment CONTROL, (b) and (e) to the
experiment DT and (c) and (f) to the experiment DTDB.

www.atmos-chem-phys.net/19/987/2019/                                                        Atmos. Chem. Phys., 19, 987–998, 2019
994                                             A. Benedetti et al.: The value of satellite observations for Asian dust analysis

                                                                     plants, it is the 48 h aerosol forecast that is considered to plan
                                                                     the plant operations (Schroedter-Homscheidt et al., 2013). In
                                                                     these instances, a reduction in the forecast bias from day 2
                                                                     is a welcome development. Moreover, experiment DTDB,
                                                                     which included both MODIS Dark Target and Deep Blue
                                                                     data, shows a slightly lower fractional gross error in the com-
                                                                     parison with CARSNET data than the DT experiment, indi-
                                                                     cating an additional beneficial impact of observations close
                                                                     to the dust sources.

                                                                     4.3   Comparisons with independent PM data

                                                                     PM data were obtained for the months of March–May 2013
                                                                     from CEPA for several stations in the Beijing area. For clar-
                                                                     ity purposes, only the month of March is shown in Fig. 10,
                                                                     which presents the comparison between model PM10 values
                                                                     and observations (panel a) and a map with the location of the
                                                                     stations (panel b). The data for all stations show a peak in
                                                                     PM10 (all particles with diameter smaller than 10 µm), corre-
                                                                     sponding to the passage of the dust front on 9 March. The box
                                                                     plot represents the histograms of hourly data obtained from
                                                                     the 11 air quality stations available in the Beijing municipal-
                                                                     ity. Outliers are indicated with a dot. The coarse resolution of
                                                                     the ECMWF model means that all station points are included
Figure 9. Fractional bias (a) and fractional gross error (b) as a    in the same grid box.
function of forecast range for experiment CONTROL (red), exper-         The model captures the front passage which is visible in
iment DT (green) and experiment DTDB (blue). Data are averaged
                                                                     the increase of PM10 . However, the timing of the PM maxi-
over central–northern China (30–45◦ N, 75–135◦ E) for the period
March–May 2013.
                                                                     mum in the model is early by approximately 3 h. If we con-
                                                                     sider the average value of the PM10 observation peak, then
                                                                     the model underestimates it by ≈ 100 mg m−3 . Outside the
                                                                     peak, the values of PM in the models are too large, indicat-
quent forecast. To answer this question, the spatial data rel-       ing a broader spatial extent of the aerosol plume in the model
ative to FB shown in Fig. 4 are summarized in Fig. 8 using           with respect to what was observed. It is important to notice
a histogram which shows the FB as a function of the num-             that the coarse model resolution does not allow the fine de-
ber of AERONET and CARSNET sites. Panels a, b and c                  tails of the local pollution to be resolved, particularly in re-
show the histogram for the analysis time, whereas panels d,          gions in which the topography is varied. Moreover, not all
e and f show the same for the 48 h forecast. Again, we can           species are modeled in the system. For example nitrates are
observe that the skill of the experiments with data assimila-        not included in the model version used in this study and this
tion is higher with respect to the control experiment. While         missing component might partially be the cause of the clear
this increased skill is higher at analysis time, it persists into    disagreement between the model and observations (see, for
the short-range forecast at 48 h.                                    example, Wu et al., 2017). However in situations dominated
   Figure 9 shows the behavior of FB and FGE as a func-              by large-scale synoptic events such as the case for the dust
tion of forecast range. This is another way to display what          storm of 9 March, the model can give a qualitative indica-
is already shown in Fig. 8. It can be seen that the average          tion of the cause of the increased pollution and can be used
FB (FGE) over central–northern China is lower by about 0.4           to provide a warning to the population. This is what is seen
(0.2) for experiments DT and DTDB with respect to the con-           for all experiments in Fig. 10a. What we can also observe is
trol experiment. Of particular interest is the fact that the skill   that the assimilation is not able to improve the PM10 forecast.
of the two experiments with data assimilation is almost con-         The small differences between the experiments with assimi-
stant at various forecast lead times, indicating that the posi-      lated satellite data and the control experiment are well within
tive impact of the observations is also felt after the analysis      the large differences between the model and observations.
into the short-range forecast.                                       PM10 is increased in the DTDB experiment thanks to the ad-
   ECMWF CAMS forecasts are issued out to day 5. How-                ditional AOD data, but it does not reach the observed peak.
ever, some users utilize the forecast from day 2 for their ap-       The spurious secondary peak of 10 March, not reported in
plications. For example, for the management of solar power           the PM data, is reduced in the DTDB experiment. However,

Atmos. Chem. Phys., 19, 987–998, 2019                                                   www.atmos-chem-phys.net/19/987/2019/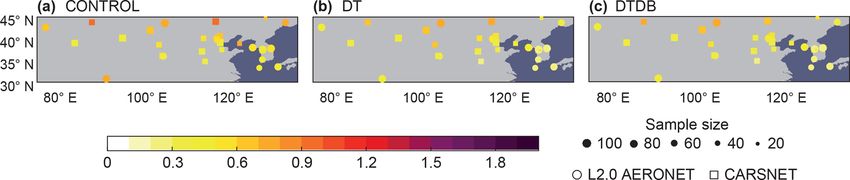
A. Benedetti et al.: The value of satellite observations for Asian dust analysis                                                       995

Figure 10. (a) March 2013 PM10 time series for the measurements recorded at the 11 stations available in the Beijing (39.9◦ N, 116.4◦ E) mu-
nicipality and the simulations performed with the ECMWF model in the different configurations (CONTROL in red, DT in green and DTDB
in blue). (b) Location and identification code of the observation stations around the Beijing area. The map covers an area of approximately
40 km2 .

once again, the difference with the observed values of PM is            pact of the assimilated data is mainly felt at the analysis time
of 2 orders of magnitude.                                               but remains visible in the 48 h forecast.
                                                                           Comparisons with PM10 data from the CEPA network for
                                                                        March 2013 in the Beijing area show that the model has skill
                                                                        in predicting the passage of a dust front. However there is a
5   Conclusions                                                         mismatch in PM10 values with large biases (up to 2 orders
                                                                        of magnitude in some cases) displayed by the model, even
The operational ECMWF CAMS system was used to demon-                    for the assimilation experiments. The assimilation of satel-
strate the impact of assimilating satellite AOD data for an             lite AOD in this case can only make small adjustments to
improved characterization of Asian dust storms. Three ex-               PM10 but is unable to improve the quality of forecast funda-
periments were conducted: one control experiment with no                mentally. Despite this, the passage of the storm is captured,
aerosol data assimilated, one experiment with only Collec-              indicating that the global model is somewhat able to capture
tion 6 MODIS Dark Target AOD retrievals, which do not of-               the regional pollution flow, even at coarse resolution. This in-
fer coverage over bright surfaces, and one experiment with              dicates that the global model analyses may be used as bound-
all available MODIS data including Deep Blue AOD re-                    ary conditions for regional air quality models at higher res-
trievals.                                                               olution, enhancing their performance in situations when part
   Several concluding points can be learned from these exper-           of the pollution may have originated via synoptic flow mech-
iments. Results confirm that assimilation of advanced satel-            anisms. However, the skill of the global model for PM10 is
lite data is effective for improving the representation of desert       poor. This is likely due to model biases, coarse resolution,
dust distributions over Asia and for monitoring and forecast-           unresolved topography, a lack of resolved local emissions
ing dust episodes (in the short range). In particular, MODIS            and a lack of observations to constrain the aerosol specia-
Deep Blue data are beneficial both in source regions (i.e.,             tion and vertical structure. It is worth mentioning that AOD
Tazhong) and downwind of desert areas (i.e., Xilinhot and               is less affected by these factors as it is a column-integrated
Shangri-La). The fractional bias and the gross error with re-           variable. Also, spatial patterns of AOD do not always match
spect to independent AOD observations from the AERONET                  with those of surface PM due to variability in aerosol hygro-
and CARSNET ground-based networks are lower in the as-                  scopicity and relative humidity which can affect AOD greatly
similation experiments than in the control forecast with no             but leave PM10 completely unchanged.
assimilated aerosol data. Time series of FGE averaged over                 These results highlight the crucial importance of the veri-
central–northern China reveal that in some extreme cases the            fying datasets to assess model skill and assimilation impact.
FGE is reduced by as much as 60 %–80 % in the experiment                CARSNET data offer unprecedented coverage over remote
which includes all MODIS data (DTDB) with respect to the                Asian dust regions which are otherwise poorly observed.
experiment which has no aerosol data (CONTROL). The im-

www.atmos-chem-phys.net/19/987/2019/                                                         Atmos. Chem. Phys., 19, 987–998, 2019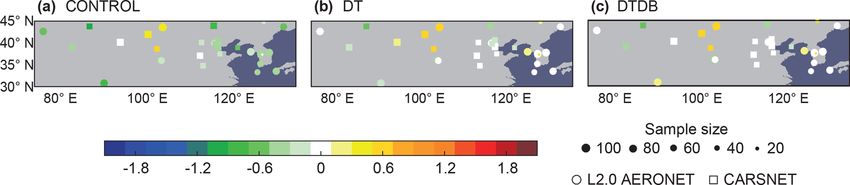
996                                               A. Benedetti et al.: The value of satellite observations for Asian dust analysis

From the regional distribution maps of Fig. 4 it is possible           improvement of the original version of the manuscript. The design
to see that CARSNET and AERONET stations over Asia                     team at ECMWF (Anabel Bowen and Simon Witter) is also
are largely complementary. Data availability in these regions          gratefully acknowledged for revising all figures to comply with
both for assimilation and model evaluation and development             publication standards.
is key to progress in further addressing the challenges of
                                                                       Edited by: Federico Fierli
Asian dust prediction.
                                                                       Reviewed by: two anonymous referees
   As part of CAMS, ECMWF is providing twice-daily fore-
casts of atmospheric composition (including desert dust) up
to 5 days ahead, which are publicly available. These fore-
casts rely on assimilation of MODIS Collection 6.1 AOD
(both Dark Target and Deep Blue data) as well as PMAp data.            References
They have been shown to provide useful information and re-
liable boundary conditions for local air quality applications          Benedetti, A., Morcrette, J.-J., Boucher, O., Dethof, A., Engelen,
in Europe, China and east Asia, provided they are used in                R., Fisher, M., Flentje, H., Huneeus, N., Jones, L., Kaiser, J.
conjunction with high-resolution regional air quality models.            W., Kinne, S., Mangold, A., Razinger, M., Simmons, A. J.,
                                                                         and Suttie, M.: Aerosol analysis and forecast in the European
                                                                         centre for medium-range weather forecasts integrated forecast
                                                                         system: 2. Data assimilation, J. Geophys. Res.-Atmos., 114,
Data availability. Model data can be obtained from ECMWF upon
                                                                         https://doi.org/10.1029/2008JD011115, 2009.
request by directly contacting the corresponding author (Angela
                                                                       Boucher, O., Pham, M., and Venkataraman, C.: Simulation of the
Benedetti; angela.benedetti@ecmwf.int). AERONET data can be
                                                                         atmospheric sulfur cycle in the Laboratoire de Météorologie Dy-
obtained from their website at https://aeronet.gsfc.nasa.gov/ (last
                                                                         namique general circulation model: Model description, model
acccess: 21 January 2019). The CARSNET and CEPA data used in
                                                                         evaluation, and global and European budgets, Note scientifique
this article were courtesy of Xiaoye Zhang (xiaoye@cma.gov.cn).
                                                                         de l’IPSL, Institut Pierre Simon Laplace (IPSL), Paris, France,
                                                                         21, 2002.
                                                                       Bozzo, A., Remy, S., Benedetti, A., Flemming, J., Bech-
Author contributions. FDG provided the initial motivation for this       told, P., Rodwell, M., and Morcrette, J.-J.: Implementa-
study, contributed to the writing of the manuscript, performed the       tion of a CAMS-based aerosol climatology in the IFS,
PM10 verification and provided Figs. 1, 8 and 10. LJ provided            Technical Memorandum, 801, ECMWF, Reading, England,
the software for the plotting of Figs. 4, 5, 6, 7 and 9. VHP made        https://doi.org/10.21957/84ya94mls, 2017.
several comments and suggestions for the original version of the       Chauhan, A., Zheng, S., Xu, M., Cao, C., and Singh, R. P.: Charac-
manuscript and provided financial support through the PANDA              teristic changes in aerosol and meteorological parameters associ-
project (FP7 606719). SR contributed to the revised version of the       ated with dust event of 9 March 2013, Modeling Earth Systems
manuscript and provided input on the description of the model dust       and Environment, 2, 1–10, https://doi.org/10.1007/s40808-016-
scheme which he had revised and developed. XZ kindly provided            0236-1, 2016.
the CARSNET AOD and the CEPA PM10 data.                                Che, H., Zhang, X.-Y., Xia, X., Goloub, P., Holben, B., Zhao,
                                                                         H., Wang, Y., Zhang, X.-C., Wang, H., Blarel, L., Damiri,
                                                                         B., Zhang, R., Deng, X., Ma, Y., Wang, T., Geng, F., Qi, B.,
Competing interests. The authors declare that they have no conflict      Zhu, J., Yu, J., Chen, Q., and Shi, G.: Ground-based aerosol
of interest.                                                             climatology of China: aerosol optical depths from the China
                                                                         Aerosol Remote Sensing Network (CARSNET) 2002–2013, At-
                                                                         mos. Chem. Phys., 15, 7619–7652, https://doi.org/10.5194/acp-
Acknowledgements. This work has been initiated and partly                15-7619-2015, 2015.
funded by the PANDA European Project (FP7, no. 606719). The            Chen, R., Li, Y., Ma, Y., Pan, G., Zeng, G., Xu, X., Chen, B., and
work has also been supported by the Copernicus Atmosphere                Kan, H.: Coarse particles and mortality in three Chinese cities:
Monitoring Service, which is part of the European Union’s                the China Air Pollution and Health Effects Study (CAPES), Sci.
flagship space programme Copernicus. CAMS data are freely                Total. Environ., 409, 4934–4938, 2011.
available from http://atmosphere.copernicus.eu (last access: 21 Jan-   Chuluun, T. and Ojima, D.: Land use change and carbon cycle in
uary 2019). The data providers contributing to the AERONET               arid and semi-arid lands of East and Central Asia, Sci. China
and CARSNET networks are also gratefully acknowledged. We                Ser. C., 45, 48–54, 2002.
acknowledge the use of imagery from the NASA Worldview                 Courtier, P., Thépaut, J.-N., and Hollingsworth, A.: A strategy for
application (https://worldview.earthdata.nasa.gov/; last access:         operational implementation of 4D-Var, using an incremental ap-
21 January 2019) operated by the NASA Goddard Space Flight               proach, Q. J. Roy. Meteor. Soc., 120, 1367–1387, 1994.
Center Earth Science Data and Information System (ESDIS)               Darzi, M. and Winchester, J. W.: Aerosol characteristics at Mauna
project. PM10 data were courtesy of the China Environmental              Loa Observatory, Hawaii, after east Asian dust storm episodes, J.
Protection Agency network (China). The co-editor Federic Fierli          Geophys. Res.-Oceans, 87, 1251–1258, 1982.
and two anonymous reviewers are gratefully acknowledged for            Di Tomaso, E., Schutgens, N. A. J., Jorba, O., and Pérez García-
their useful comments which have greatly contributed to the              Pando, C.: Assimilation of MODIS Dark Target and Deep
                                                                         Blue observations in the dust aerosol component of NMMB-

Atmos. Chem. Phys., 19, 987–998, 2019                                                     www.atmos-chem-phys.net/19/987/2019/
A. Benedetti et al.: The value of satellite observations for Asian dust analysis 997 MONARCH version 1.0, Geosci. Model Dev., 10, 1107–1129, ogy and application, Atmos. Chem. Phys., 10, 7017–7039, https://doi.org/10.5194/gmd-10-1107-2017, 2017. https://doi.org/10.5194/acp-10-7017-2010, 2010. Flemming, J., Huijnen, V., Arteta, J., Bechtold, P., Beljaars, A., Lee, H., Kim, H., Honda, Y., Lim, Y.-H., and Yi, S.: Effect of Asian Blechschmidt, A.-M., Diamantakis, M., Engelen, R. J., Gaudel, dust storms on daily mortality in seven metropolitan cities of Ko- A., Inness, A., Jones, L., Josse, B., Katragkou, E., Marecal, rea, Atmos. Environ., 79, 510–517, 2013. V., Peuch, V.-H., Richter, A., Schultz, M. G., Stein, O., and Levy, R. C., Remer, L. A., Kleidman, R. G., Mattoo, S., Ichoku, C., Tsikerdekis, A.: Tropospheric chemistry in the Integrated Fore- Kahn, R., and Eck, T. F.: Global evaluation of the Collection 5 casting System of ECMWF, Geosci. Model Dev., 8, 975–1003, MODIS dark-target aerosol products over land, Atmos. Chem. https://doi.org/10.5194/gmd-8-975-2015, 2015. Phys., 10, 10399–10420, https://doi.org/10.5194/acp-10-10399- Ginoux, P., Chin, M., Tegen, I., Prospero, J. M., Holben, B., 2010, 2010. Dubovik, O., and Lin, S.-J.: Sources and distributions of dust Levy, R. C., Mattoo, S., Munchak, L. A., Remer, L. A., Sayer, A. aerosols simulated with the GOCART model, J. Geophys. Res.- M., Patadia, F., and Hsu, N. C.: The Collection 6 MODIS aerosol Atmos., 106, 20255–20273, 2001. products over land and ocean, Atmos. Meas. Tech., 6, 2989– Gong, S. L. and Zhang, X. Y.: CUACE/Dust – an integrated 3034, https://doi.org/10.5194/amt-6-2989-2013, 2013. system of observation and modeling systems for operational Lin, C., Wang, Z., and Zhu, J.: An Ensemble Kalman Filter for dust forecasting in Asia, Atmos. Chem. Phys., 8, 2333–2340, severe dust storm data assimilation over China, Atmos. Chem. https://doi.org/10.5194/acp-8-2333-2008, 2008. Phys., 8, 2975–2983, https://doi.org/10.5194/acp-8-2975-2008, Goudie, A. S.: Desert dust and human health disorders, Environ. 2008. Int., 63, 101–113, 2014. Liu, Z., Liu, Q., Lin, H.-C., Schwartz, C. S., Lee, Y.-H., and Holben, B., Tanre, D., Smirnov, A., Eck, T. F., Slutsker, I., Abuhas- Wang, T.: Three-dimensional variational assimilation of MODIS san, N., Newcomb, W. W., Schafer, J., Chatenet, B., Lavenu, aerosol optical depth: Implementation and application to a F., Kaufman, Y. J., Vande Castle, J., Setzer, A., Markham, B., dust storm over East Asia, J. Geophys. Res.-Atmos., 116, Clark, D., Frouin, R., Halthore, R., Karneli, A., O’Neill, N. T., https://doi.org/10.1029/2011JD016159, 2011. Pietras, C., Pinker, R. T., Voss, K., and Zibordi, G.: An emerging Morcrette, J.-J., Beljaars, A., Benedetti, A., Jones, L., and Boucher, ground-based aerosol climatology: Aerosol optical depth from O.: Sea-salt and dust aerosols in the ECMWF IFS model, AERONET, J. Geophys. Res.-Atmos., 106, 12067–12097, 2001. Geophys. Res. Lett., 35, https://doi.org/10.1029/2008GL036041, Holben, B. N., Eck, T., Slutsker, I., Tanre, D., Buis, J., Setzer, A., 2008. Vermote, E., Reagan, J., Kaufman, Y., Nakajima, T., Lavenu, F., Morcrette, J.-J., Boucher, O., Jones, L., Salmond, D., Bechtold, P., Jankowiak, I., and Smirnov, A.: AERONET – A federated in- Beljaars, A., Benedetti, A., Bonet, A., Kaiser, J., Razinger, M., strument network and data archive for aerosol characterization, Schulz, M., Serrar, S., Simmons, A. J., Sofiev, M., Suttie, M., Remote Sens. Environ., 66, 1–16, 1998. Tompkins, A. M., and Untch, A.: Aerosol analysis and forecast Hollingsworth, A., Engelen, R., Textor, C., Benedetti, A., Boucher, in the European Centre for medium-range weather forecasts in- O., Chevallier, F., Dethof, A., Elbern, H., Eskes, H., Flemming, tegrated forecast system: Forward modeling, J. Geophys. Res.- J., Granier, C., Kaiser, J. W., Morcrette, J.-J., Rayner, P., Peuch, Atmos., 114, https://doi.org/10.1029/2008JD011235, 2009. V.-H., Rouil, L., Schultz, M. G., Simmons, A. J., and The Gems Niu, T., Gong, S. L., Zhu, G. F., Liu, H. L., Hu, X. Q., Zhou, C. H., Consortium: Toward a monitoring and forecasting system for at- and Wang, Y. Q.: Data assimilation of dust aerosol observations mospheric composition: The GEMS project, B. Am. Meteorol. for the CUACE/dust forecasting system, Atmos. Chem. Phys., 8, Soc., 89, 1147–1164, 2008. 3473–3482, https://doi.org/10.5194/acp-8-3473-2008, 2008. Holmes, J. and Zoller, W.: The elemental signature of transported Park, S.-U., Choe, A., Park, M.-S., and Chun, Y.: Performance tests Asian dust at Mauna Loa observatory, Tellus B, 48, 83–92, 1996. of the Asian dust aerosol model 2 (ADAM2), Journal of Sustain- Hsu, N., Jeong, M.-J., Bettenhausen, C., Sayer, A., Hansell, R., able Energy & Environment, 1, 77–83, 2010. Seftor, C., Huang, J., and Tsay, S.-C.: Enhanced Deep Blue Peuch, V. and Engelen, R.: Towards and operational GMES At- aerosol retrieval algorithm: The second generation, J. Geophys. mosphere Monitoring Service, ECMWF Newsletter, 132, 20–25, Res.-Atmos., 118, 9296–9315, 2013. 2012. Jeong, D.-Y.: Socio-Economic Costs from Yellow Dust Damages in Reddy, M. S., Boucher, O., Bellouin, N., Schulz, M., Balkan- South Korea, Korean Social Science Journal, 2, 1–29, 2008. ski, Y., Dufresne, J.-L., and Pham, M.: Estimates of global Kaiser, J. W., Heil, A., Andreae, M. O., Benedetti, A., Chubarova, multicomponent aerosol optical depth and direct radiative N., Jones, L., Morcrette, J.-J., Razinger, M., Schultz, M. G., perturbation in the Laboratoire de Météorologie Dynamique Suttie, M., and van der Werf, G. R.: Biomass burning emis- general circulation model, J. Geophys. Res.-Atmos., 110, sions estimated with a global fire assimilation system based https://doi.org/10.1029/2004JD004757, 2005. on observed fire radiative power, Biogeosciences, 9, 527–554, Rubin, J. I., Reid, J. S., Hansen, J. A., Anderson, J. L., Collins, https://doi.org/10.5194/bg-9-527-2012, 2012. N., Hoar, T. J., Hogan, T., Lynch, P., McLay, J., Reynolds, C. Lamarque, J.-F., Bond, T. C., Eyring, V., Granier, C., Heil, A., A., Sessions, W. R., Westphal, D. L., and Zhang, J.: Develop- Klimont, Z., Lee, D., Liousse, C., Mieville, A., Owen, B., ment of the Ensemble Navy Aerosol Analysis Prediction Sys- Schultz, M. G., Shindell, D., Smith, S. J., Stehfest, E., Van tem (ENAAPS) and its application of the Data Assimilation Re- Aardenne, J., Cooper, O. R., Kainuma, M., Mahowald, N., search Testbed (DART) in support of aerosol forecasting, At- McConnell, J. R., Naik, V., Riahi, K., and van Vuuren, D. mos. Chem. Phys., 16, 3927–3951, https://doi.org/10.5194/acp- P.: Historical (1850–2000) gridded anthropogenic and biomass 16-3927-2016, 2016. burning emissions of reactive gases and aerosols: methodol- www.atmos-chem-phys.net/19/987/2019/ Atmos. Chem. Phys., 19, 987–998, 2019
998                                               A. Benedetti et al.: The value of satellite observations for Asian dust analysis

Sayer, A., Hsu, N., Bettenhausen, C., and Jeong, M.-J.: Validation      Wu, F., Zhang, D., Cao, J., Guo, X., Xia, Y., Zhang, T., Lu,
  and uncertainty estimates for MODIS Collection 6 “Deep Blue”            H., and Cheng, Y.: Limited production of sulfate and nitrate
  aerosol data, J. Geophys. Res.-Atmos., 118, 7864–7872, 2013.            on front-associated dust storm particles moving from desert to
Sayer, A., Munchak, L., Hsu, N., Levy, R., Bettenhausen, C., and          distant populated areas in northwestern China, Atmos. Chem.
  Jeong, M.-J.: MODIS Collection 6 aerosol products: Comparison           Phys., 17, 14473–14484, https://doi.org/10.5194/acp-17-14473-
  between Aqua’s e-Deep Blue, Dark Target, and “merged” data              2017, 2017.
  sets, and usage recommendations, J. Geophys. Res.-Atmos., 119,        Yu, S., Eder, B., Dennis, R., Chu, S.-H., and Schwartz, S. E.: New
  https://doi.org/10.1002/2014JD022453, 2014.                             unbiased symmetric metrics for evaluation of air quality models,
Schroedter-Homscheidt, M., Oumbe, A., Benedetti, A., and Mor-             Atmos. Sci. Lett., 7, 26–34, 2006.
  crette, J.-J.: Aerosols for concentrating solar electricity produc-   Zhang, X. and co-authors: WMO/WWRP sand and dust
  tion forecasts: requirement quantification and ECMWF/MACC               storm warning advisory and assessment system (SDS-
  aerosol forecast assessment, B. Am. Meteorol. Soc., 94, 903–            WAS), technical report on asian regional centre, available
  914, 2013.                                                              at: https://www.wmo.int/pages/prog/arep/wwrp/new/documents/
Sekiyama, T. T., Tanaka, T. Y., Shimizu, A., and Miyoshi, T.: Data        technique_report_on_asian_RC_final_2015.pdf (last access:
  assimilation of CALIPSO aerosol observations, Atmos. Chem.              21 January 2019), 2015.
  Phys., 10, 39–49, https://doi.org/10.5194/acp-10-39-2010, 2010.       Zhang, X.-Y., Gong, S., Zhao, T., Arimoto, R., Wang, Y., and Zhou,
Shaw, G. E.: Transport of Asian desert aerosol to the Hawaiian Is-        Z.: Sources of Asian dust and role of climate change versus de-
  lands, J. Appl. Meteorol., 19, 1254–1259, 1980.                         sertification in Asian dust emission, Geophys. Res. Lett., 30,
Tanaka, T. Y. and Chiba, M.: Global simulation of dust aerosol with       https://doi.org/10.1029/2003GL018206, 2003.
  a chemical transport model, MASINGAR, J. Meteorol. Soc. Jpn.,
  83, 255–278, 2005.
Uno, I., Wang, Z., Chiba, M., Chun, Y., Gong, S., Hara, Y.,
  Jung, E., Lee, S.-S., Liu, M., Mikami, M., Music, S., Nick-
  ovic, S., Satake, S., Shao, Y., Song, Z., Sugimoto, N., Tanaka,
  T., and Westphal, D. L.: Dust model intercomparison (DMIP)
  study over Asia: Overview, J. Geophys. Res.-Atmos., 111,
  https://doi.org/10.1029/2005JD006575, 2006.

Atmos. Chem. Phys., 19, 987–998, 2019                                                      www.atmos-chem-phys.net/19/987/2019/
You can also read