Fisheries - Executive Office of Energy and Environmental Affairs Massachusetts Office of Coastal Zone Management - Mass.gov
←
→
Page content transcription
If your browser does not render page correctly, please read the page content below
Executive Office of Energy and Environmental Affairs
  Massachusetts Office of Coastal Zone Management

                      Fisheries
                Work Group Report

2020 Massachusetts Ocean Management Plan Review

                    January 19, 2021

                                                        1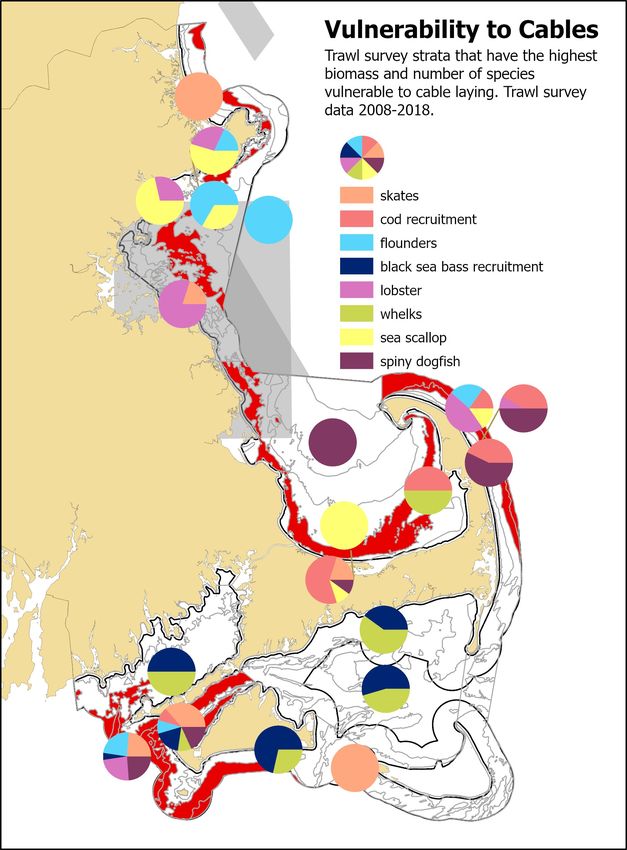
Table of Contents
  Table of Contents ................................................................................................................................... 2
  1.     Work Group Members .................................................................................................................. 3
  2.     Overview ....................................................................................................................................... 3
  3.     Introduction .................................................................................................................................. 4
  4.     High commercial fishing by effort and value ................................................................................ 4
     4.1 Methods .................................................................................................................................... 4
        4.1.1 Non-shellfish ..................................................................................................................... 4
        4.1.2 Shellfish ............................................................................................................................. 6
        4.1.3 Geoprocessing ................................................................................................................... 6
     4.2 Results ....................................................................................................................................... 7
        4.2.1 1988-2018 ......................................................................................................................... 7
        4.2.2 2010-2019 ......................................................................................................................... 9
     4.3 Discussion................................................................................................................................ 10
  5.     Concentrated recreational fishing .............................................................................................. 11
     5.1 Background ............................................................................................................................. 11
     5.2 Methods and Results .............................................................................................................. 12
     5.3 Discussion................................................................................................................................ 12
  6.     Important fish resource areas..................................................................................................... 13
     6.1 Methods .................................................................................................................................. 13
        6.1.1 Time period ..................................................................................................................... 14
        6.1.2 Species Selection ............................................................................................................. 14
        6.1.3 Averaging Technique....................................................................................................... 17
        6.1.4 Ranking & Indexing Techniques ...................................................................................... 18
     6.2 Results ..................................................................................................................................... 19
        6.2.1 Composite Ocean Plan map ............................................................................................ 19
        6.2.2 Species specific maps ...................................................................................................... 21
        6.2.3 Habitat closure maps ...................................................................................................... 24
        6.2.4 Vulnerability + habitat closure ........................................................................................ 26
     6.3 Discussion................................................................................................................................ 27
  7.     Aquaculture................................................................................................................................. 29
     7.1 Fixed fishing facilities .............................................................................................................. 29
  8.     Stakeholder Perception Survey................................................................................................... 30
     8.1 Adding shellfish maps ............................................................................................................. 30
     8.2 Great White Shark map........................................................................................................... 31
  9.     Proposed Science Priorities......................................................................................................... 32
  References ............................................................................................................................................ 32
  Appendices ........................................................................................................................................... 33
     Appendix A – Massachusetts 2007, 2012, and 2019 Landings-Weighted State-Wide Average Price
 per Live Pound¹ by Non-Shellfish Species ............................................................................................... 33
     Appendix B – ArcGIS Model – Commercial Fisheries Activity .......................................................... 34
     Appendix C – Fisheries not covered by the Vessel Monitoring System in Massachusetts .............. 35
     Appendix D ....................................................................................................................................... 36
        Atlantic Herring ............................................................................................................................ 36
        Cod................................................................................................................................................ 37
        Haddock ........................................................................................................................................ 38
     Appendix E – Illustrations of ranking and indexing processes ......................................................... 39

                                                                                                                                                            2
1. Work Group Members
Kathryn Ford (Chair), MA DMF Habitat Program, kathryn.ford@mass.gov
Tom Shields, MA DMF Shellfish, thomas.shields@mass.gov
Robert Glenn, MA DMF Survey and Assessment Program, robert.glenn@mass.gov
Tracy Pugh, MA DMF Invertebrate Fisheries Project, tracy.pugh@mass.gov
Story Reed, MA DMF Statistics, story.reed@mass.gov
Greg DeCelles, MA DMF Groundfish, gregory.decelles@mass.gov
Chris Schillaci, MA DMF Shellfish, christopher.schillaci@mass.gov
Jon Hare, NOAA NEFSC Science Director, jon.hare@noaa.gov
Alison Verkade, NOAA GARFO, alison.verkade@noaa.gov
David Stevenson, NOAA GARFO, david.stevenson@noaa.gov
Steve Cadrin, SMAST Dept Fisheries Oceanography, scadrin@umassd.edu
Chris McGuire, TNC Federal Fisheries, cmcguire@tnc.org
Emily Shumchenia, NROC Northeast Ocean Data Portal, emily.shumchenia@gmail.com
Nick Napoli, NROC Northeast Ocean Data Portal, nicknapoli01@gmail.com
Samantha Coccia-Schillo, CZM GIS Specialist, samantha.coccia-schillo@mass.gov
Prassede Vella, CZM Ocean Planning Lead, prassede.vella@mass.gov
Recreational Fishing Advisory Committee Members
Kevin Blinkoff, Executive Editor, On The Water Media
Kalil Boghdan, Down River Charters
Tim Brady, Tim Brady & Sons Charters
Raymond Kane, Massachusetts Fisheries Advisory Commission Chairman
Mike Pierdinock, CPF Charters
2. Overview
On November 18, 2019, the Massachusetts Division of Marine Fisheries convened a Fisheries Work
Group to discuss if and how to update three maps in the Massachusetts Ocean Management Plan:
important fish resource areas, high commercial fishing effort and value, and concentrated recreational
fisheries activity. The Work Group also discussed the need for additional layers and how to include
aquaculture. The assessments recommended by the Work Group were discussed by CZM staff and the
Science Advisory Council on January 29, 2020. Work Group discussions were held via email from March
to July 2020 and separate virtual meetings to discuss the concentrated recreational fisheries layer and
the commercial fisheries effort and value layer were held on July 7 and August 27 2020, respectively. In
September 2020 the Work Group results were discussed by the Science Advisory Council and the Ocean
Advisory Commission. Additional work on the commercial fisheries effort and value layer was completed
by a subgroup of DMF and CZM staff from November 2020 to January 2021. This report represents the
Work Group recommendations for SSU and existing use layers in the 2020 Ocean Plan Update. Drafts of
this report were improved by the comments identified in the advisory and public meetings. The primary
changes recommended by the Fisheries Work Group are as follows:
High commercial fishing effort and value – update with more recent data, use last 10 years of
data.
Concentrated recreational fishing – no change, add new survey to science priorities.
3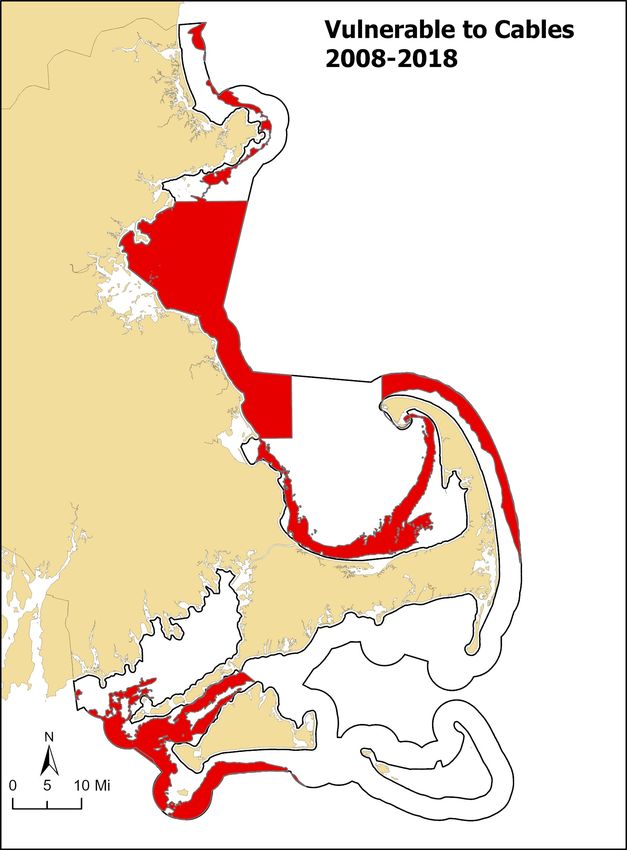
Important fish resource areas – use a vulnerability approach and include the cod spawning area
for separate important fish resource SSU layers for cables, pipelines, and sand mining. Develop
an important fish resource areas for renewable energy in a future iteration.
Fixed fishing facilities – update this layer and include as an area of Water Dependent Use.
3. Introduction
The primary charge of the Fisheries Work Group (as well as the other five work groups) was to
identify changes to the Special, Sensitive, and Unique (SSU) resource areas and existing water
dependent use (WDU) maps that were developed in 2014 for the 2015 Ocean Plan (EEA 2014). The
charge to the Work Group includes other priorities, such as updating the baseline assessment and
discussing the science framework, that are being addressed outside of the scope of this report. There is
one SSU resource, important fish resource areas, and two existing WDU maps, high commercial fisheries
effort and value and concentrated recreational fisheries, that the Work Group mapped in 2009 and 2014
and reassessed this year for the 2020 Ocean Plan Update. Additionally, the Work Group discussed how
the Ocean Plan should address fixed water dependent facilities including fish weirs and aquaculture. This
report describes the reassessment work done for each of these topics.
4. High commercial fishing by effort and value
4.1 Methods
For this Ocean Plan Update, the Fisheries Work Group conducted several analyses. The first was the
1988-2018 time series analysis using a fixed price model for assessing value. This analysis most closely
resembles the analyses used in the high commercial fishing effort and value maps in the 2009 and 2015
Ocean Plans.
The Fisheries Work Group also recommended developing maps that used the truncated time series
of 2010-2019 since the past decade of fishing activity best reflects existing uses in the ocean planning
area. A subgroup of the Fisheries Work Group analyzed the truncated time series with both the fixed
price model used in previous Ocean Plans and an adjusted price model using prices reported by year as
using a single year’s price could result in misleading patterns. This time series was also modeled with
and without the lobster fishery.
The two time-series’ use different end points due to the length of time it took to complete this
work. Since the Work Group recommended moving forward with the truncated time series (which was
originally done with 2010-2018 data), the more complicated 1988-2018 model was not updated to
include 2019.
4.1.1 Non-shellfish
The 1988-2018 time-series analysis used the same methods as described in previous Fisheries Work
Group reports to map non-shellfish commercial effort and value. This analysis required combining
multiple harvester catch reporting systems and dealer reports to generate a map that represented
regions where both high effort and high value fisheries occurred. The full description of the method
used to combine multiple types of catch reporting systems is available in the previous Fisheries Work
Group reports (EEA 2009, EEA 2014).
The 2010-2019 time-series analysis relied on the trip-level reporting data from the comprehensive
mandatory trip-level reporting program that DMF implemented in 2010 for all fisheries. The trip-level
reporting program eliminates known data gaps in pre-2010 DMF catch report data and minimizes
duplication between federal and state data collection programs. Since the NMFS VTR program collects
4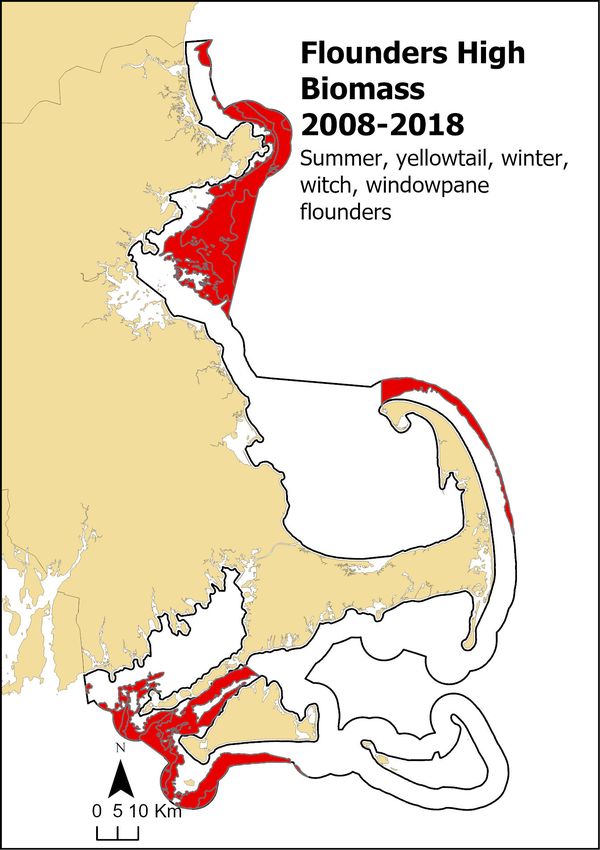
the same type of data at the trip-level from federal permit holders, those individuals were exempt from
reporting to DMF and DMF collected those data from NMFS VTRs. To integrate the DMF and NMFS trip-
reports, a spatial routine was run to translate the latitude and longitude coordinates provided on the
                                                         NMFS VTR to DMF Statistical Reporting Areas
                                                         (SRA) (Figure 1). These data were combined with
                                                         the DMF trip-level reports creating the final
                                                         dataset used in this analysis.
                                                              For the assessment of effort, trips were
                                                         calculated in a manner consistent with the
                                                         method used for the DMF fishery-specific catch
                                                         reports (1988-2009) in previous reports. This was
                                                         done because trip-level data can accommodate
                                                         multiple areas per trip, thus simply summing trips
                                                         by SRA from trip-level data could potentially
                                                         inflate the number of actual trips. Landings were
                                                         converted to live pounds (whole animal, shell on)
                                                         based on the grade and market reported by the
                                                         harvester. The dataset was then truncated to only
                                                         include data from State Waters (SRA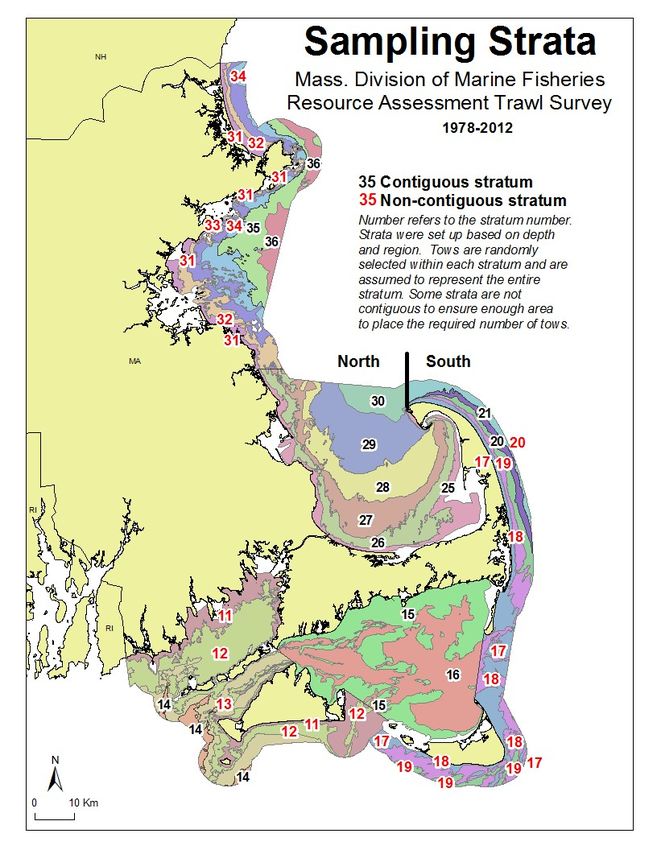
4.1.2 Shellfish
    The shellfish component of the analysis used Massachusetts dealer reported shellfish transactions
from the Standard Atlantic Fisheries Information System (SAFIS) for both time series, 1988-2018 and
2010-2019. Each transaction, e.g., each trip/DSGA combination, was considered to represent one
fisherman trip. Total number of trips and landings value were tallied by Designated Shellfish Growing
Area (DSGA; Figure 2) and averaged over the available years. When no price or value information was
provided by the dealer, values were derived by multiplying the live pound landings by the state-wide
landings-weighted average price per live pound in accordance with each price model. In the fixed-price,
2010-2019 model, the 2019 average was applied to all years whereas in the 1988-2018 model, the 2018
average was applied to all years; in the adjusted price model, averages from the year in question were
applied to that year. Records missing a DSGA were removed in all analyses. The values were then
divided by the square kilometers of each DSGA to obtain average trips and landings value per square
kilometer.

    Figure 2. Designated Shellfish Growing Areas updated 1/10/2014. Ocean Planning area is blue boundary line.

    4.1.3 Geoprocessing
     Spatial analysis utilized ArcGIS Pro 2.X software for all geoprocessing. All geoprocessing analysis
steps remained consistent with the analyses done for the 2009 and 2015 Ocean Plans and are outlined
in Appendix B.
     All sources of commercial fishing effort and landings value data were converted to a 250 m 2 raster
grid and condensed into two layers representing the combined fishing effort across all commercial
fisheries, and the combined value of landings generated by those fisheries for the shellfish and non-
shellfish components (DSGA and SRA, respectively). The raster grid was then clipped to the ocean
management plan boundary. To prevent the scale of commercial fisheries in one part of the state
overshadowing the importance of those in other parts of the state, the planning area was broken into
two regions: north of Cape Cod and south of Cape Cod (Figure 3). The two raster layers (combined
fishing effort and total landings value) were then re-classified into 10-percentile bins, within each of
those regions. With the two layers now on the same relative scale, they were added together (i.e. given
equal weight). The resulting combination was re-classified into high (top 25%), medium (middle 50%)

                                                                                                                 6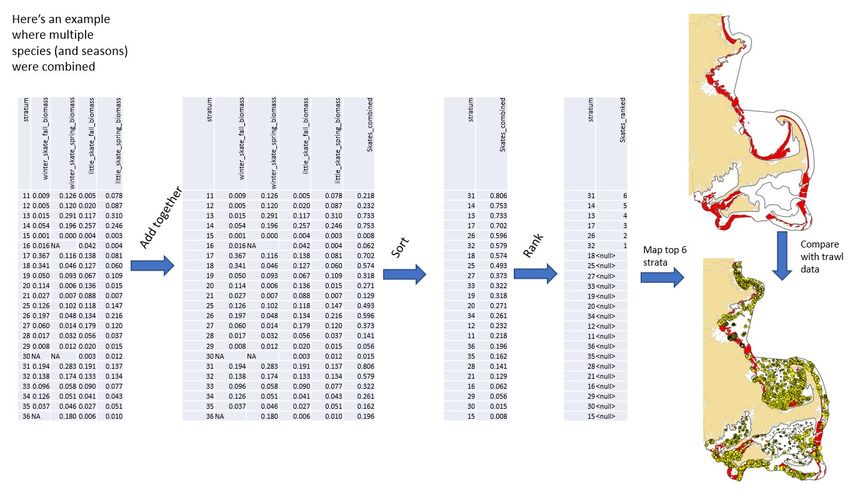
and low (bottom 25%) categories within each region. These geoprocessing steps were applied to both
time-series (1988-2018 and 2010-2019).

   Figure 3. Regions used in commercial fishing analyses.

   4.2 Results

   4.2.1 1988-2018
   The most direct comparison with previous Ocean Plans is the 1988-2018 time series map (Figure 4).

                                                                                                       7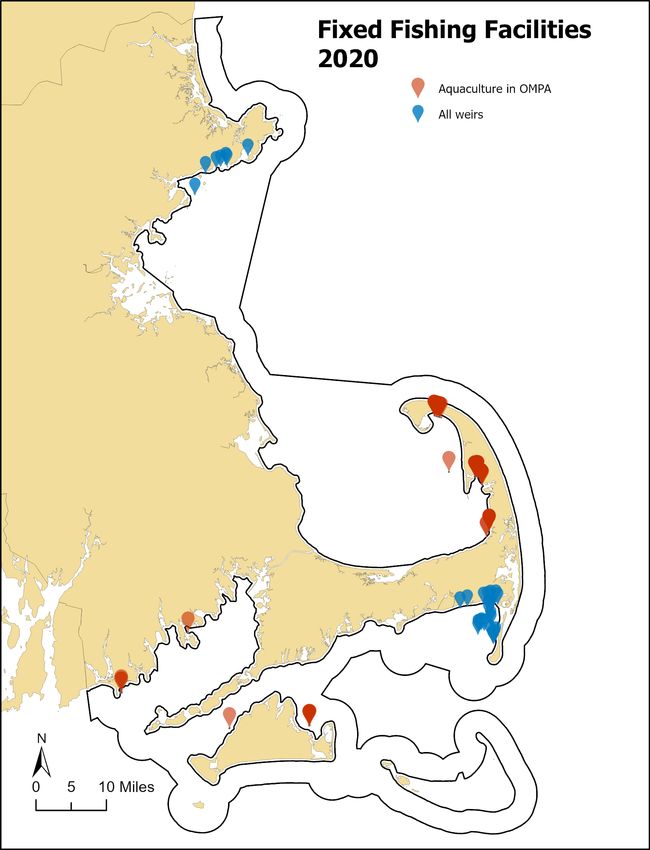
A                                                            B

C

Figure 4. Commercial Fisheries Activity raster maps. (A) 2009 Ocean Plan using 1988-2007 data (top left), (B) 2014 Ocean Plan
Update using 1988-2012 data (top right), and (C) 2019 Ocean Plan using 1988-2018 data (bottom left). High, medium, and
low values are scaled and relative to each region, north and south of Cape Cod.

                                                                                                                            8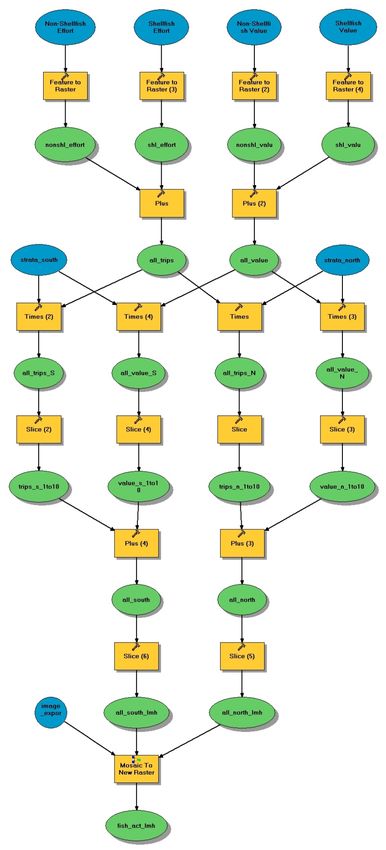
4.2.2 2010-2019
    For this time series, there are four maps: the effort and value using 2019 prices, the effort and value
using adjusted prices, and both maps without lobster (Figure 5).
A                                                               B

C                                                               D

Figure 5. Commercial Fisheries Activity raster maps. (A) 2010-2019 data with 2019 price (top left), (B) 2010-2019 data with
2019 price and no lobster (top right), (C) 2010-2019 data with adjusted prices (bottom left), and (D) 2010-2019 data with
adjusted prices and no lobster (bottom right). High, medium, and low values are scaled and relative to each region, north
and south of Cape Cod.

                                                                                                                              9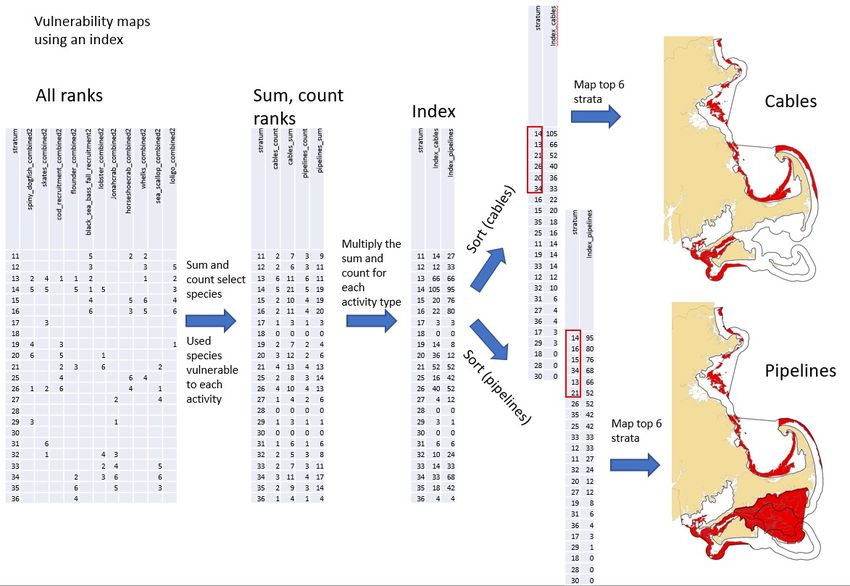
The Fisheries Work Group recommends using the values with adjusted prices in the truncated time-
series (2010-2019) commercial fisheries activity raster map (red polygons in Figure 5C) as the updated
“High Commercial Fishing by Effort and Value” map in the 2019 Ocean Plan Update.

    4.3 Discussion
     In previous ocean plan updates, using all the relevant data was deemed important to get a sense of
longer-term patterns. In the 1988-2018 time series, which can be compared to past ocean plan maps,
the subtle changes between the different time series (Figure 4) are hard to interpret since the spatial
patterns of fishing activity change over time in response to market forces, management actions,
abundance, etc. However, the stability of high effort and value areas in the northern region is
noteworthy. This is likely driven by the relative stability of the influence of the Gulf of Maine lobster
industry.
     The Fisheries Work Group concluded that more recent patterns are most relevant to use for ocean
planning purposes. Furthermore, the consistency of the dataset from the implementation of trip-level
reporting across the fisheries limits risk of error. Therefore, the high commercial fishing by effort and
value map was updated using the 2010-2019 time series. Additionally, the analysis is more accurate with
annual price adjustments over the time series. To determine how impactful the change from the fixed
price model to the adjusted price model was, the two were compared (Figure 5). Differences were found
to be minimal, so using the improved model does not introduce noteworthy changes.
      It is important to remember that the final maps convey relative importance of fisheries activity in
two regions: north of the Cape and south of the Cape (Figure 3). Therefore, the absolute values reflected
in an area with “high” effort and value may be quite different. In general, due to the influence of
American lobster and oyster aquaculture landings, effort and value absolute values are higher in the
region north of the Cape than south of the Cape. Spatial scales also play a critical role when interpreting
these results. The areal units used to report and aggregate these data are coarse. Concentrated
commercial fisheries can occur in locations that exist at finer spatial scales than can be accurately
detected by these data. Conversely, concentrated fishing in an isolated portion of an areal unit will
influence the value for the entire areal unit, which is potentially misleading for locations within that unit
where no commercial fishing occurs. Other jurisdictions are addressing this issue through Vessel
Monitoring Systems (VMS), which provide a much finer resolution spatial data. However, many of the
Massachusetts fisheries are not covered by VMS due to size or activity in fisheries that are not federally
managed (Appendix C), which is the primary reason the Work Group did not recommend focusing on
VMS data.
       The accuracy of these data depends upon commercial harvesters and dealers accurately and
completely reporting their data, especially the area information. The shellfish component of the analysis
depends on dealers assigning the correct DSGA to shellfish transactions. Though this is a required field,
compliance is a challenge. If a dealer fails to correctly assign a DSGA to a shellfish transaction, that
transaction would either be omitted (if no DSGA indicated; averaging less than 0.3% of all transactions
each year) or mis-represented (if the incorrect DSGA was reported). This may be why some ports show
unexpected high activity. In some cases, transactions may be legitimately reported without a DSGA
because a species was harvested from offshore waters outside MA State Waters, or dealers may not
realize they need to provide a DSGA for species. If the DSGA from legitimate State Waters shellfish
harvest is not provided, especially when concentrated within a specific species, there is the potential to
underrepresent that species in this analysis. Lastly, if any inshore shellfish data are missing from the
dealer dataset altogether, they will not be represented in this dataset. There are several known caveats
for this in earlier years of the dataset, particularly in the Falmouth and Chatham regions. However, the
affected DSGAs are primarily excluded from this analysis due to the ocean plan boundary. In recent
years, improving the legitimacy of DSGA reporting for inshore shellfish has been prioritized; therefore,
                                                                                                          10
DSGA activity from 2017 forward is considered validated whereas earlier years carry more of the stated
caveats.
Much of the trends seen in previous Ocean Plans and in the 2010-2019 analysis are driven by
American lobster landings. State water lobster landings and value were more than double that of any
other species in most years and is well documented within the last decade (DMF 2011-2019). In the last
10 years, the lobster fishery primarily occurred north of Cape Cod with a reduction in activity south of
Cape Cod. This drives the stability of the northern region seen in all models. When lobster effort and
value were removed, the most notable changes occurred north of Cape Cod, particularly off of Cape Ann
and in Cape Cod Bay (Figure 5). The southern region remained more stable with and without lobster
because the fishery makes up a far less percentage of the landings and value as compared to the north
region. Other species driving some of the high effort and value are likely a mix of shellfish, inverts, and
finfish. For example, whelk is a prominent fishery in Nantucket sound. The outer cape has a mix of
lobster and finfish, with some shellfish as well. Cape Ann is driven by a mix of inshore shellfish species
when excluding lobster.
A notable commercial fisheries trend in the past decade that is not evident in the mapping is the
greater than 300% increase in oyster effort and value between 2010 and 2019 (DMF 2019). This is due to
a boom in aquaculture beginning in 2012 that has resulted in oyster becoming the second highest
valued state waters species trailing only lobster. In value, oyster is consistently close to double the next
highest species in the more recent years of the time series1. The ocean plan boundary does not include a
lot of the inshore areas throughout Massachusetts, and this is where much of the oyster aquaculture
activity occurs. A few DSGAs that do have oyster activity are highlighted in Figure 5, primarily in Cape
Cod Bay, and more specifically Wellfleet and the high activity spot in the eastern part of the bay. Other
areas with very high effort and value include areas outside of the ocean management planning area,
such as Duxbury and Plymouth.
Consistent with the conclusion reached in the 2014 Ocean Plan Update, the Fisheries Work Group
sees great value in better spatial assessment of the individual fisheries and fishing practices for both
screening purposes and the determination of potential impacts from a given project. The impacts of
construction projects on commercial fisheries will vary for fixed and mobile gear fisheries and the
mobility of the species being targeted (e.g. surf clams compared to finfish). Additionally, providing more
information on the ranked areas, such as what fisheries are occurring and some absolute values of effort
and landings within some of the highlighted areas may help better inform decision making efforts. The
various stages of construction projects all have unique potential impacts and timing can heavily
influence the amount of impact anticipated.
5. Concentrated recreational fishing
5.1 Background
For the 2009 and 2015 Ocean Plans, a survey was sent to expert fishermen (including charter boat
captains and Division of Marine Fisheries employees) with maps of four different regions of the state.
Both surveys provided maps of the state and requested information regarding concentrations of
recreational fishing activity (where fishermen fish). Seventeen fishermen in 2009 and twenty-eight
fishermen in 2015 responded by drawing polygons on the maps; their maps were georeferenced and
digitized. The individual survey results were gridded into 250m2 cells. In 2009, all survey results were
used to identify areas of concentrated recreational fishing (Figure 6A). In 2015, a heat map was
1
In 2019 state-wide, oyster was estimated at $30 mil and the next species is haddock at $18 mil. In 2018 state
wide, oyster was estimated at $28 mil and surf clam was next at $17 mil (surf clam is primarily offshore).
11generated identifying degree of overlap in the 2015 survey results (Figure 6B), and any area with a
survey response was used to identify areas of concentrated recreational fishing.
A B
Figure 6. (A) 2009 Massachusetts Ocean Plan Concentrated Recreational Fishing map (Figure 2-15 from the MOP).
Any cell with a survey response was used to identify concentrated recreational fishing in the 2009 ocean plan
map. (B) 2015 Massachusetts Ocean Plan Concentrated Recreational Fishing map (Figure 17 from the MOP). Any
cell with a survey response was used to identify concentrated recreational fishing in the 2015 ocean plan map.
5.2 Methods and Results
For the 2020 Ocean Plan, the original methods were revisited first by the Fisheries Work Group and
then by a subcommittee of the Marine Fisheries Advisory Commission (MFAC) with expertise in
recreational fishing.
No additional datasets were identified that could improve the mapping resolution of the 2014 map
and the map captures major areas of fishing activity. The MFAC subcommittee recommended redoing
the survey but it should attempt to get feedback from 2,000 fishermen. Since resources were not
available to conduct the survey, it is recommended as a science priority. Lacking a new survey, the
subcommittee recommended keeping the 2015 map as the Concentrated Recreational Fishing map.
5.3 Discussion
The recreational fishery is surveyed using the Marine Recreational Information Program (MRIP)
survey, which is a state-regional-federal partnership that collects data about how often anglers fish and
what they catch. A pilot study in 2013 added a voluntary fishing location question to the survey. The
question was ultimately removed since the change to the survey methodology was not approved by all
12MRIP states as required for survey standardization. Adding this information to the survey is not seen as
a high priority or likely for MRIP.
Since the existing MRIP survey cannot be used to assess location of recreational fishing, the
subcommittee recommended conducting another survey similar to the efforts in 2008 and 2015. To
improve the accuracy of the survey, the subcommittee recommended that the state could use the
150,000 person angler database generated from the recreational fishing license to send out the survey,
and that a new survey effort should consider other survey methodologies such as utilizing cell phones or
vessel GPS devices. Also of interest for future discussion is including recreational lobster. The reporting
standard for recreational lobster changed in 2011 and may provide useful information for ocean
planning. The majority of this activity is thought to be outside of the ocean planning area, so it wasn’t
prioritized this year. Shellfishing was also recognized as an important recreational fishing activity that
occurs primarily outside of the ocean planning area. Neither the Work Group or subcommittee
identified a source of information that could be used to better understand the spatial distribution of
recreational shellfishing; it is thought that a town-by-town approach will be needed.
6. Important fish resource areas
6.1 Methods
A primary goal of the ocean planning process is to create layers with statewide extent for the
purpose of site selection screening for wind power and other ocean uses. In 2009, 2014, and 2020, the
important fish resource area assessment relied exclusively on fisheries-independent otter trawl survey
data collected by DMF each year in September and May since this dataset has the most reliable,
consistent statewide extent for fish species composition, biomass, and abundance. All trawl survey
stations are located within the ocean management plan boundary. The trawl survey purpose is to
measure changes in the relative abundance of commercially and recreationally important groundfish
over time. The survey has 23 strata, stratified according to depth and region. Over time, the survey has
collected 181 species. The top 10 species by biomass and abundance from 2008-2018 are listed in Table
1. The species on both lists are scup, butterfish, winter flounder, silver hake, and red hake.
Table 1. Total abundance and biomass, Massachusetts spring and fall trawl surveys 2008-2018.
Species Abundance Species Biomass, kg
SCUP 1,918,417 SPINY_DOGFISH 51,644
BUTTERFISH 544,004 SCUP 18,034
BAY_ANCHOVY 447,527 LITTLE_SKATE 13,900
LONGFIN_SQUID 322,629 WINTER_FLOUNDER 8,257
BLACK_SEA_BASS 115,533 WINTER_SKATE 8,175
NORTHERN_SAND_LANCE 70,521 AMERICAN_LOBSTER 7,701
WINTER_FLOUNDER 47,880 BUTTERFISH 5,427
SILVER_HAKE 37,700 SMOOTH_DOGFISH 4,305
ATLANTIC_ROCK_CRAB 35,440 SILVER_HAKE 3,860
RED_HAKE 33,783 RED_HAKE 3,696
The trawl survey results were compiled for these analyses according to the survey strata since that is
the appropriate scale of analysis based on the survey design. However, since some strata are not
spatially contiguous due to the need to have enough area in which to randomly assign multiple tows
(Figure 7), other spatial distribution errors can be introduced. Also, the trawl survey samples less in
areas with large amounts of fixed gear and hard bottom.
13Figure 7. Contiguous and non-contiguous sampling strata. North-south break indicated by black line.
For the 2020 Ocean Plan Update, two analyses were conducted. The first analysis used the same
analysis done for the 2009 Ocean Plan and the 2015 Ocean Plan Update. This method is described below
as the “composite method.” The second analysis, the “vulnerability method,” reflects on how the ocean
plan is being used to inform and screen specific types of construction activities and focuses on species
that are potentially vulnerable to those activities.
6.1.1 Time period
The composite assessment was done using multiple time periods. Based on the Fisheries Work
Group recommendation, the survey years 1978-2018 were used to compare to analyses done in 2009
and 2015. For the 2020 update, the Fisheries Work Group recommended comparing the full dataset
(1978-2018) to a truncated dataset (2008-2018). The truncated dataset better reflects current areas of
high biomass. The vulnerability assessment used data from the 2008-2018 time period.
6.1.2 Species Selection
In the composite analysis, the same species that were analyzed in 2009 and 2015 were used.
Twenty-two species were selected for the composite analysis based on their vulnerability to the trawl
(e.g. catchability) and their commercial and recreational importance in the state (Table 2). Atlantic cod
young-of-the-year and black sea bass young-of-the-year were included as separate species in the
assessment. Species biomass distributions are strongly tailed with low or zero catches dominating.
Therefore, specific analytical decisions were made in order to achieve the following goal: a statewide
distribution identifying strata with relatively high biomass consistently over time for commercially and
recreationally important species in the dataset. All statistical and classification work was conducted in R
and Excel; maps were prepared in ArcGIS Pro 2.4.
14Table 2. Species selected for consideration in the composite Fisheries Resource analysis (in black), the vulnerability Fisheries
Resource analysis (in red), and those that overlap (in bold)
American Lobster Scup Sand lance
Atlantic Cod Sea Scallop Surf clams
Black Sea Bass Silver Hake Ocean quahogs
Channeled Whelk Spiny Dogfish Atlantic herring
Haddock Summer Flounder Dogfish
Horseshoe Crab Tautog
Jonah Crab Windowpane Flounder
Knobbed Whelk Winter Flounder
Little Skate Winter Skate
Loligo Witch Flounder
Red Hake Yellowtail Flounder
For the 2020 Ocean Plan Update, the Fisheries Work Group recommended creating maps specific for
each use in the Mass Ocean Plan. After some discussion, the species selection process focused on
species vulnerable to sand mining, cables, and pipelines. Species vulnerable to renewable energy were
not discussed since renewable energy was not thought to be a priority in the coming years in state
waters and since renewable energy projects may influence pelagic species which the trawl survey does
not capture very well. Since different species are vulnerable to different construction activities, maps
tailored to each use could better reflect where species vulnerable to that use might be and therefore,
improve the protection of those areas. The uses were discussed in turn and two main distinctions were
drawn between the relatively greater impacts of sand mining and pipelines and relatively lesser impacts
of cable laying (Table 3). The specific species mapped and how they were mapped are in Table 4.
Table 3. Vulnerabilities by project types as discussed by the Fisheries Work Group
Vulnerable to cables Vulnerable to sand mining & pipelines
(Impacts considered small and temporary Species w/demersal eggs (e.g. whelk, herring,
enough to not worry about eggs in most winter flounder, loligo squid)
circumstances.)
Regulated closed areas/fishing protected Regulated closed areas/fishing protected
areas for cod and winter flounder areas for cod and winter flounder and species
with migrations impeded by sand mining e.g.
crabs, lobster, horseshoe crabs
(Impacts considered small and temporary Species dependent on sand habitat e.g. sand
enough to not worry about sand lance which lance
can move.)
Species that can’t move from the impact e.g. Species that can’t move from the impact e.g.
surf clams, ocean quahog, scallops, adult surf clams, ocean quahog, scallops, adult
channeled whelk channeled whelk
Spawning aggregations, e.g. cod, black sea Spawning aggregations, e.g. cod, black sea
bass bass
EMF sensitive species: All elasmobranchs Species more sensitive to food removal: e.g.
including dogfish and skates; lobster; flounder, skates, black sea bass
flounders
15Table 4. The species mapped
Species Vulnerable Vulnerable to Preliminary draft What was done
to cables pipelines/sand recommendation for how
mining to map
Sand lance No Yes Trawl survey data not Did not map
sufficient, can’t be mapped
Scallops Yes Yes Trawl survey data not Used trawl survey data
sufficient, consider using since it’s all we have and
known commercial areas we used it last time
Surf clams Yes Yes Trawl survey data not Did not map
sufficient, consider using
known commercial areas
but might underrepresent
north of Boston
Ocean Yes Yes Trawl survey data not Did not map
quahogs sufficient, consider using
known commercial areas
but might underrepresent
north of Boston
Atlantic No Yes Trawl survey data not Did not map, reviewed
herring sufficient, primary Atlantic maps from GMRI, NEFMC,
herring spawning areas and ASMFC. Atlantic
outside of Massachusetts herring spawning grounds
waters (check south of are primarily outside of
Nantucket) Massachusetts. Further
consideration of
protecting the area south
of Nantucket during
spawning season (fall) is
warranted. See Appendix
D for more information.
Cod Yes Yes Use regulatory areas Merged to trawl survey
spawning data. See Appendix D for
areas more information.
Cod YOY Yes Yes Use trawl survey data Done (trawl survey data
area for cod recruitment)
Channeled Yes Yes Trawl survey data not Done, combined
whelk sufficient, can’t be mapped channeled and knobbed
whelk (used trawl survey
data since we used it for
previous ocean plans)
Dogfish Yes No Use trawl survey data Done (spiny dogfish; used
trawl survey data)
Horseshoe No Yes Use trawl survey data and Done (used trawl survey
crabs available beach survey data data)
Black sea Yes Yes Use trawl survey data Done (used trawl survey
bass augmented with ventless data for black sea bass
spawning survey data, consider recruitment). Reviewed
areas adding Crepidula beds? ventless data which was
consistent with trawl
16survey data. Did not add
Crepidula beds since
known beds are in same
locations identified by
trawl and ventless
surveys.
Crabs No Yes Use trawl survey data Done (used trawl survey
augmented with ventless data for Jonah crabs).
survey data Reviewed ventless data
which was consistent with
trawl survey data.
Lobster Yes Yes Use trawl survey data Done (used trawl survey
augmented with ventless data). Reviewed ventless
survey data data which led to two
changes being made to
the map.
Skates Yes Yes Use trawl survey data Done by combining all
skates (winter, little; used
trawl survey data)
Winter Yes Yes Use trawl survey data; Done (used trawl survey
flounder make closed areas layer data)
available
All flatfish Yes Yes Use trawl survey data Done by combining all
flounders (summer,
yellowtail, winter, witch,
windowpane; used trawl
survey data)
Loligo squid No Yes Use trawl survey data Done (used trawl survey
data)
Fisheries Work Group members suggested we include all life stages of cod (e.g. adults), haddock,
and pollock. Our focus is on the most vulnerable life stages of cod, so in the vulnerability assessment we
included young of the year and the known spawning aggregations; adult cod and young of the year cod
were included in the composite method. Pollock doesn’t meet our abundance thresholds. They’re found
in too low of abundance and in not enough years to be included in the trimean assessment. Haddock
occurs in the survey primarily in deeper strata in Mass Bay and the backside of Cape Cod (Figure D-5).
Haddock spawns in a manner very similar to cod, but haddock stocks are not as threatened as cod. The
primary haddock grounds are thought to be outside of Massachusetts waters. For these reasons,
haddock was not included in the vulnerability assessment. See Appendix D for more information about
herring, cod, and haddock.
6.1.3 Averaging Technique
For each species, the biomass (abundance for Jonah crab, Atlantic cod juveniles, and black sea bass
juveniles) was averaged by survey stratum over the selected time series (1978-2018 and 2008-2018)
using the trimean averaging technique ([1st quartile + 2*median+3rd quartile]/4). We selected the
trimean to measure the center of the dataset because it is resistant to outlier years (years that have very
high or low catches) when compared with the arithmetic mean. The trimeans were calculated in R.
We selected a stratum for inclusion for each species based on the criterion of having at least 8 years
of non-zero catches within a season for the full time series (20% of the 40 year time series) and 2 years
17for the truncated time series (20% of the 11 year time series). This selection process allowed us to focus
on strata where species were consistently caught in the time series. Sets of strata were analyzed by
region (north or south of Cape Cod) since this boundary delineates different stock units of the same
species for winter skate, little skate, fall cod recruitment, winter flounder, windowpane flounder, and
American lobster. A third strata set was included for the backside of the Cape for spring cod
recruitment.
We combined the species and season specific data by normalizing the species stratum trimean by
dividing the stratum trimean by the sum of the trimeans for all included strata within a season.
Normalizing the stratum trimean gives each species approximately equal influence in the model. The
median of the normalized trimean values for all species/seasons was then determined for each stratum
in Excel.
In ArcGIS Pro 2.4, the normalized trimeans were joined to the stratum polygons by stratum number
using the Join tool and then clipped to the ocean management plan boundary. We then classified the
strata into high (top 25%), medium (middle 50%), and low categories (bottom 25%) based on quartiles of
the distribution of medians of normalized stratum trimean values within regional stratasets (north and
south of Cape Cod) (Figure 8).
Figure 8. Illustration of classification method used for composite mapping.
6.1.4 Ranking & Indexing Techniques
For the vulnerability maps, the normalized trimeans were summed by season for each species and
summed to create species groups for skates (winter and little), flounders (summer, yellowtail, winter,
witch, windowpane), and whelks (channeled and knobbed). The ranks were joined to the stratum
polygons by stratum number using the Join tool in ArcGIS Pro and then clipped to the ocean
management plan boundary. The top 25% of strata (the top 6 of 23 strata) were then ranked from 1-6 (6
having the highest normalized trimean value for that stratum-species combination) and the top 6 were
used for creating individual species/species-groups maps.
The individual species and species groups were combined to create the final vulnerability maps by
creating an index to reflect both the diversity and the biomass value of the stratum. For each stratum,
the count of species for which that stratum was in the top 6 as well as the sum of the stratum rank
values for all species were calculated. The count and sum were then multiplied and the top six indexed
strata were mapped. This way, strata biomass rank values are more heavily weighted if that stratum was
ranked for more species. For cables, the species considered vulnerable and used in mapping were sea
scallop, cod recruitment, skates, whelk, spiny dogfish, black sea bass recruitment, lobster, and flounders
18(not loligo squid, horseshoe crabs, or Jonah crabs). For pipelines and sand mining, the species
considered vulnerable and used in mapping were sea scallop, cod recruitment, skates, whelk, black sea
bass recruitment, lobster, skates, flounders, loligo squid, horseshoe crabs, and Jonah crabs (not spiny
dogfish). An illustration of the ranking process and index development is provided in Appendix E.
6.2 Results
6.2.1 Composite Ocean Plan map
The composite map identifies areas of the state with consistently high biomass for all 22 species
using the same method used in the original Ocean Plan of 2009 and the update in 2014.
The results from four separate time periods, 2009 MOP (1978-2007), 2014 MOP (1978-2012), and 2
time periods for the 2020 MOP (1978-2018 and 2008-2018), are presented in Figure 9. The full time
series, 1978-2018, resulted in a larger area being designated as Important Fish Resource Area and the
2008-2018 time series results in a smaller area being designated as Important Fish Resource Area (Table
5).
19Figure 9. Highest 25% of trimean values are the important fish resource areas A) 1978-2007 (top left); B) 1978-2012 (top
right); C) 1978-2018 (bottom left); and D) 2008-2018 (bottom right). Trawl data is clipped to ocean planning area boundary.
Ocean planning area boundary is in black.
20Table 5. Surface area of Important Fish Resource Area
Area (acres) % of OMP area
2009, 2015 area 253,681 18
1978-2018 area 314,694 23
2008-2018 area 185,170 13
North of Cape Cod, deeper strata are gaining in importance in the more recent time series. South of
Cape Cod, we see high scup and tautog catches in stratum 11 (which includes the shoreline of Buzzards
Bay, Martha’s Vineyard, and shallower sections of Muskeget Channel) and notable declines in biomass in
stratum 15, the shallow stratum hugging the shorelines of Nantucket Sound. South of Cape Cod, only
deeper strata remain as “important” in the more recent time series.
6.2.2 Species specific maps
The ranked trimean data was used to produce maps for each species (or species group) (Figure 10).
The maps were compared to the original trawl survey data and other data sources and were reviewed
by experts to assess if specific changes were warranted based on known patterns or biases introduced
by the trawl survey.
Figure 10. In this example, the normalized trimean biomass for all flounders in each season (fall and spring) were added to
get a total normalized biomass for each stratum. The top 6 strata (25%) were selected as having high biomass values.
For lobster, when compared to the DMF ventless survey data (Pugh and Glenn 2020) and further
reviewed by the DMF lobster biologist, Dr. Tracy Pugh, three areas stood out as particularly poorly
21mapped by the ranked trimean assessment: stratum 33 in Massachusetts Bays, stratum 14 at the mouth
of Vineyard Sound, and stratum 17 east of Nantucket. These inaccuracies were addressed as follows:
East of Nantucket shows up in the trimean assessment for lobster as having high biomass,
but the high biomass region is in reality well to the north in Provincetown waters. Since
survey stratum 17 extends from Provincetown to Nantucket, a misleading picture of this
resource is created. Since stratum 14 has consistently high catches for both the trawl survey
and the ventless survey, the decision was made to include stratum 14 instead of stratum 17.
The average high biomass value for the top three strata south of the Cape was input as the
stratum 14 biomass.
Stratum 33 (Massachusetts Bay) has a poor tow-completion rate due to the presence of
lobster gear, and therefore is thought to be underrepresented in this assessment. So
stratum 33 was also manually selected as having a high value and the average high biomass
value for the top three strata north of the Cape was input as the stratum 33 biomass.
Stratum 31 was subsequently dropped to stay consistent with the selection of a total of 6
survey strata as the top 25%.
For black sea bass and Jonah crab, there were no inconsistencies between the DMF ventless survey
data and the trawl survey data at the statewide scale, so the trawl survey data were relied upon (Pugh
pers comm). The horseshoe crab map was reviewed by DMF biologists with expertise in that species and
it was concluded that the sixth stratum, stratum 31 just north of Boston Harbor in shallow water, did not
need to be ranked. The more important strata for horseshoe crab are adequately represented by the
five strata remaining. The whelk map (a combination of knobbed and channeled whelks) was reviewed
by DMF biologists with expertise in those species and it was concluded that it adequately represents the
distribution of those species.
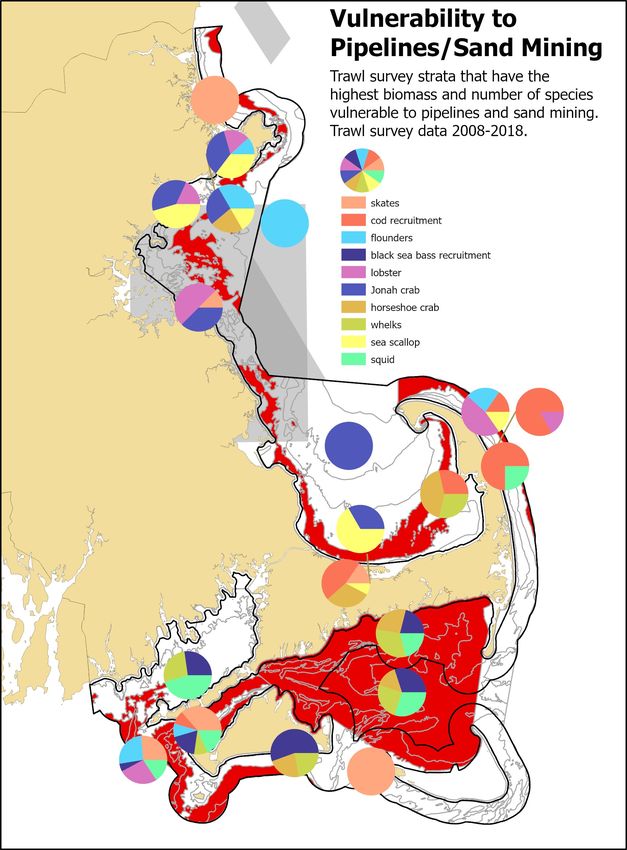
The vulnerability maps for cables (Figure 11) and pipelines/sand mining (Figure 12) are similar since
the species vulnerable to each activity are almost the same. The major difference between the cable and
pipeline/sand mining map is the inclusion of Nantucket Sound in the pipeline/sand mining map.
Horseshoe crabs and squid are both found in high abundance in Nantucket Sound. They were not
considered vulnerable to cables, but they were considered vulnerable to pipelines/sand mining. The
only other difference between the two maps is the addition of stratum 20 on the back side of Cape Cod
in the cable map. This stratum is on the cable map due to the prevalence of spiny dogfish, which were
not considered vulnerable to pipelines but they are considered vulnerable to electric cables due to their
sensitivity to electromagnetic fields.
As shown in Figures 11 and 12, the species driving the patterns by region are as follows:
Vineyard Sound: black sea bass recruitment, cod recruitment, flounders, lobster, loligo squid,
skates, spiny dogfish, whelks (not horseshoe crab, Jonah crab, or sea scallop)
Nantucket Sound: black sea bass recruitment, horseshoe crab, loligo squid, whelks
Backside of Cape Cod: cod recruitment, flounders, lobster, sea scallop, spiny dogfish
Massachusetts Bay: flounders, Jonah crab, lobster, sea scallop, skates
22Figure 11. The vulnerability map for cables. Spawning groundfish closures are in grey. Figure 12. The vulnerability map for pipelines/sand mining. Spawning groundfish
closures are in grey.
236.2.3 Habitat closure maps
To inform the review process for construction projects, maps identifying areas protected from
fisheries that DMF regulates are provided. They are:
The Winter and Spring Massachusetts Bay Cod Spawning Protection Areas for the protection
of aggregations of spawning cod from recreational fishing (Figure 13)
The Winter and Spring Massachusetts Bay Cod Conservation Zones for the protection of
aggregations of spawning cod from commercial fishing (Figure 13)
The Winter Flounder Spawning Area Closure for the protection of spawning winter flounder
from commercial fishing (Figure 14)
Inshore Restricted Waters for the protection of spawning winter flounder and to reduce
user conflict from commercial fishing (Figure 14)
The Winter Cod Conservation Zone prohibits any taking of cod by any means from November 15-
January 31 (322 CMR 8.07 (1)) and the Winter Massachusetts Bay Spawning Protection Area prohibits
recreational fishing for cod by any gear except for pelagic hook and line gear from November 1-January
31. The Spring Cod Conservation Zone prohibits any landing of cod from April 16-July 21 (322 CMR 8.07
(2)) and the Spring Massachusetts Bay Spawning Protection Area requires charter and party boats to
have a letter of authorization to fish from April 15-April 30.
(https://www.fisheries.noaa.gov/bulletin/northeast-multispecies-groundfish-fishing-year-2019-
recreational-rules)
The Winter Flounder Spawning Area Closure is closed to the commercial fishing for any finfish
(except for sea herring and line trawling for cod) from February 1 to May 31 (322 CMR 8.04) to protect
spawning winter flounder and winter flounder eggs. Net fishing is managed on a year-round basis to
reduce conflicts between different fisheries and users and to identify and regulate all inshore net
fisheries for purposes of resource conservation and management (322 CMR 4.02). Fishing with all but
cast nets and small bait nets (as described in 322 CMR 4.02 (5)) requires a special regulated fishery
permit endorsement issued by the Director of DMF. These areas are known as Inshore Restricted
Waters.
24Figure 13. Fisheries regulated areas for the protection of spawning cod.
25Figure 14. Fisheries regulated areas for the protection of spawning winter flounder.
6.2.4 Vulnerability + habitat closure
The Fisheries Work Group recommended including the cod spawning closure areas with the
vulnerability assessment to best encompass areas vulnerable to the adverse effects of cables, pipelines,
and sand mining. Within these areas, project proponents should address how they will avoid and
mitigate impacts to the vulnerable resources. Two maps are proposed to amend the Massachusetts
Ocean Plan and replace the important fish resource areas map:
261) Fish Resource Areas Vulnerable to Cables, which combines the cable vulnerability map with the
cod spawning area, clipped to the ocean management plan boundary (Figure 15);
2) Fish Resource Areas Vulnerable to Pipelines and Sand Mining, which combines the pipeline/sand
mining vulnerability map with the cod spawning area, clipped to the ocean management plan
boundary (Figure 16).
Figure 15. Areas with marine fisheries resources that are Figure 16. Areas with marine fisheries resources that are
vulnerable to cable laying. vulnerable to pipelines and sand mining.
These both represent an increase of area designated as Important Fish Resource Area in the previous
Ocean Plan (Table 6).
Table 6. Surface area of areas vulnerable to cables and pipelines/sand mining.
Area (acres) % of OMP area % increase
from previous
OMP
2020 Cables 402,562 29 11
2020 Pipelines 592,371 43 25
6.3 Discussion
The Fisheries Work Group and the Science Advisory Council have discussed in some detail
specifically how to define and map important fish resource areas. The composite mapping method used
for the important fish resource area map is a robust method to identify areas that have consistently high
biomass over time since it is resistant to outliers. However, the composite map may not accurately
27reflect shorter-term changes in spatial patterns of biomass and it does not focus on species that are
vulnerable to construction. The more recent data identifies deeper waters as having higher average
biomass over ten years in contrast to the identification of shallower waters with higher average biomass
over thirty-four years (Figure 9). Because the sample size is considerably reduced when smaller time
series are examined, differences in the distribution of areas considered “important” may reflect random
variation rather than actual change in relative importance of strata. Spatial-temporal variability in
distribution of fish may be a function of sample size, of changes in population size, or as response to
changes in abiotic environment such as temperature.
In 2014, efforts to identify “biomass hotspots” in Massachusetts found inconsistent patterns in
location of high biomass over the years and that the biomass hotspots were driven by different species
in different years (EEA 2014). That work also concluded that being able to explore the underlying data
and better understand why certain areas might be considered of “high importance” was a critical
component of working with this dataset.
Between 2014 and 2019, a subworkgroup explored various tools that could be optimized to allow
for deeper exploration of this dataset and provide the much-needed context for interpreting fisheries
data through the lens of ocean planning. The subworkgroup produced several maps and continued to
determine methods to best represent areas of importance to fisheries by using different mapping
methods and by examining how to group species. This work influenced the development of the
vulnerability approach to mapping fisheries resources.
In 2020, the Fisheries Work Group discussed what types of construction projects should be required
to use the important fish resource area map. In the 2009 and 2014 MOPs, the important fish resource
area layer is listed as an SSU for pipelines, sand mining, and renewable energy, but not for cables since
few of the 22 species mapped had notable vulnerabilities to cables. The Fisheries Work Group concluded
that if species vulnerable to cables were mapped in a vulnerability analysis, then there should be an SSU
for cables as well. This recommendation was influenced by the experience of Work Group members who
reviewed the Atlantic Link cable project. The developers were unaware of the cod spawning activity in
the Massachusetts Bay region in part because the project was not required to screen the project site
with the important fish resource area layer. The Work Group views the vulnerability approach as an
improvement over the composite ocean plan maps.
Some drawbacks of the current approach are as follows. The trawl survey uses a statistical design
that is not efficient for determining spatial distribution and may miss specific activities that may be
vulnerable to other ocean uses. Another key drawback is that several species are vulnerable that we
haven’t mapped (e.g. surf clam, ocean quahog, sand lance). Also, the trawl survey data are limited to
May and September and may not reflect times of year when vulnerable resources may be present. The
trimean method is robust, and efforts were used to ensure that regional patterns were represented. For
example, cod has three stocks in Massachusetts waters: south of Cape Cod, the backside of Cape Cod,
and north of Cape Cod. In each of these regions, the trimeans were normalized to identify the highest
relative catches of young of the year cod in that region. These were then ranked, resulting in some
isolated catches in a few strata south of Cape Cod and on the backside of Cape Cod outranking the very
high catches over more strata in Massachusetts Bay. An assessment of the implications of the regional
normalization process (done for winter skate, little skate, fall cod recruitment, winter flounder,
windowpane flounder, and American lobster) on the ranked vulnerability maps, should be done. Also,
the ranking method selected the top 6 strata, representing 25% of the strata. Another assessment
looking at the top 25% of the ranked values should be done for comparison.
In the 2009 Ocean Plan development process, emphasis was placed on a creating a single map that
represented areas of importance to fish resources. Since that time, the Fisheries Work Group has
recognized the drawbacks of consolidating so much information into a single map layer. Other species
groups have been handled as single species or as groups that share ecological niches and/or behaviors,
28You can also read