A woodland profile survey and assessment of herbivore impacts within the Ardnamurchan Deer Management Group part of the Sunart Special Area of ...
←
→
Page content transcription
If your browser does not render page correctly, please read the page content below
Scottish Natural Heritage
Research Report No. 1181

A woodland profile survey and
assessment of herbivore impacts within
the Ardnamurchan Deer Management
Group part of the Sunart Special Area of
Conservation (SAC) and Site of Special
Scientific Interest (SSSI)
RESEARCH REPORT

                                   Research Report No. 1181

       A woodland profile survey and assessment of
        herbivore impacts within the Ardnamurchan
        Deer Management Group part of the Sunart
       Special Area of Conservation (SAC) and Site
            of Special Scientific Interest (SSSI)

                         For further information on this report please contact:

                                      Lorraine Servant
                                      Scottish Natural Heritage
                                      Torlundy
                                      FORT WILLIAM
                                      PH33 6SW
                                      Telephone: 01463 701648
                                      E-mail: lorraine.servant@nature.scot

This report should be quoted as:

Headley, A.D. 2020. A woodland profile survey and assessment of herbivore impacts within
the Ardnamurchan Deer Management Group part of the Sunart Special Area of Conservation
(SAC) and Site of Special Scientific Interest (SSSI). Scottish Natural Heritage Research
Report No. 1181.

This report, or any part of it, should not be reproduced without the permission of Scottish Natural Heritage. This
permission will not be withheld unreasonably. The views expressed by the author(s) of this report should not be
taken as the views and policies of Scottish Natural Heritage.

                                        © Scottish Natural Heritage 2020.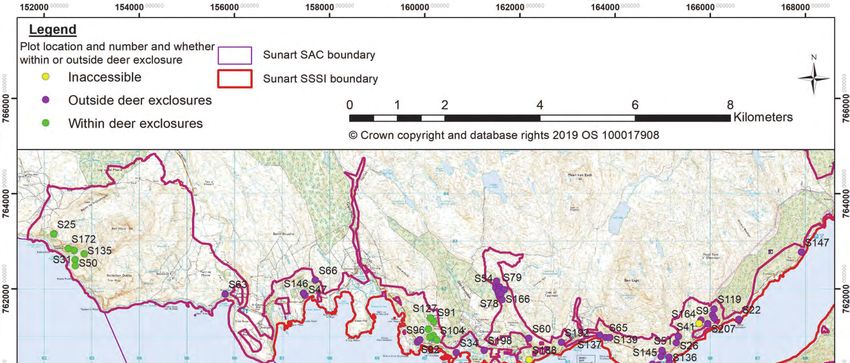
RESEARCH REPORT
Summary
A woodland profile survey and assessment of herbivore
impacts within the Ardnamurchan Deer Management
Group part of the Sunart Special Area of Conservation
(SAC) and Site of Special Scientific Interest (SSSI)
Research Report No. 1181
Project No: 117136
Contractor: Alistair Headley
Year of publication: 2020
Keywords
Sunart SAC; oak woodland; Lochaber; herbivore impact assessment; Ardnamurchan DMG.
Background
The upland oak woodland habitat within the Sunart SSSI has been identified as being
potentially ‘at risk’ from herbivore impacts and has therefore merited further investigation.
Excessive browsing of seedlings and saplings can prevent the population of trees from
regenerating. This survey was designed to assess the age-structure of the population of all
species of tree, as well as to assess the levels of browsing on seedlings and saplings and
other aspects of the woodland structure.
Main findings
The diameter of all species of tree within 51 sample plots chosen at random throughout the
woodland within the protected area was measured in May and August 2018. The numbers of
browsed and un-browsed seedlings and saplings, both small and large, were counted in the
same plots. A total of 2,693 seedlings and 1,343 saplings were found in 1.83 ha of woodland.
The diameters of 824 live trees and 98 dead trees were measured in a slightly larger area of
2.07 ha of woodland. The main findings are as follows:
Seedlings of birch were the second most abundant (628 per ha) after rowan (756 per ha)
and they both had the lowest levels of browsing (43% and 53%). Downy birch trees are
showing adequate regeneration to replace the mature trees in 31 of the 51 plots that were
surveyed.
Sessile oak dominates the woodland canopy and there are 49 and 47 mature and over-
mature trees per ha, respectively. The density of sessile oak seedlings were low at 10 per
ha. The densities of oak saplings are even lower at 6 per ha and only seven young
reproductive trees were found in all of the plots surveyed (2.07 ha). There was inadequate
regeneration to replace the population of mature and over-mature trees in 47 of the 51 plots
surveyed.
i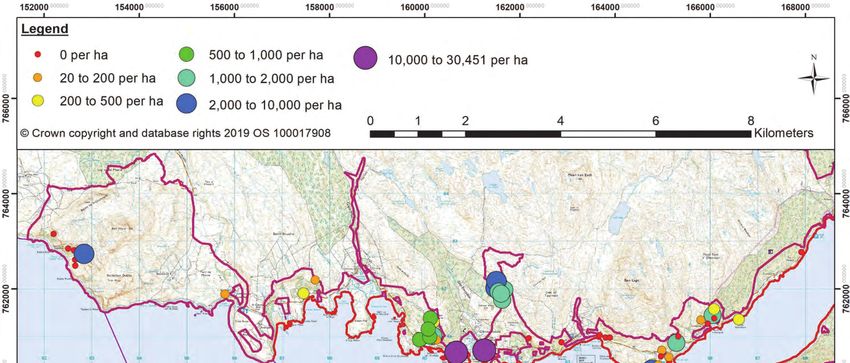
The population structure of sessile oak, rowan, hazel, holly, ash and alder are poor and at
present unable to replace the extant mature and over-mature trees. This means that this
part of the Sunart SAC is not satisfying one of its conservation objectives to maintain the
‘viability of typical species as components of the habitat’.
Shading by mature and over-mature trees is not thought to be significant in preventing in
seedlings from growing through to saplings or young reproductive trees in all but possibly
13 of the 51 plots.
There was no evidence that water-logging or dense vegetation or any other factors were
seen to be limiting the establishment of seedlings.
The high levels of browsing on seedlings and small saplings are considered to be primary
reason for the poor recruitment of saplings from the cohorts of seedlings.
Although sheep and goat are locally significant large herbivores, deer (roe and red) are
considered to be the main large herbivore within the Sunart SAC/SSSI responsible for the
browsing on the seedlings and saplings.
Rhododendron bushes were present in just over a third (36%) of the plots and in six of the
plots that could be accessed safely the density of rhododendron bushes is sufficiently high
to prevent or restrict the establishment of native tree seedlings and saplings.
For further information on this project contact:
Lorraine Servant, Scottish Natural Heritage, Torlundy, Fort William, PH33 6SW.
Tel: 01463 701648 or lorraine.servant@nature.scot
For further information on the SNH Research & Technical Support Programme contact:
Research Coordinator, Scottish Natural Heritage, Great Glen House, Leachkin Road, Inverness, IV3 8NW.
Tel: 01463 725000 or research@nature.scot
ii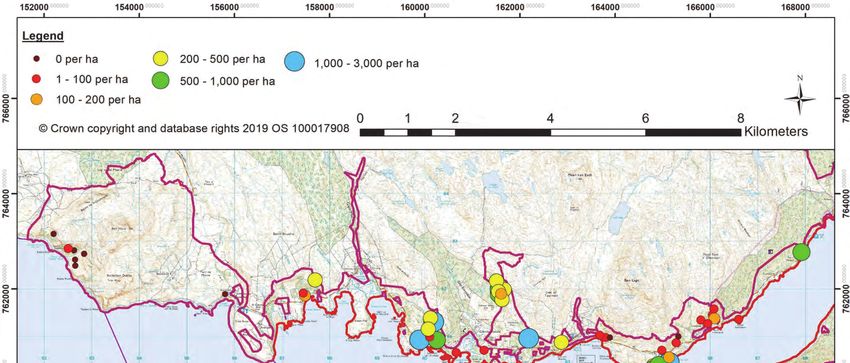
Table of Contents                                               Page

1.   INTRODUCTION                                                  1
     1.1   Aims                                                    2
2.   METHODS                                                       3
     2.1   Sampling strategy                                       3
     2.2   Field survey                                            3
     2.2.1 Woodland profile                                        3
     2.2.2 Herbivore impacts                                       4
     2.2.3 Quality control                                         5
     2.3   Data analysis                                           5
     2.3.1 Calculation of age-structure                            5
     2.3.2 Calculation of browsing impacts                         5
     2.3.3 Statistical analysis                                    6
3.   RESULTS                                                       7
     3.1   Overall number of trees, seedlings and saplings         7
     3.2   Species composition                                     7
     3.3   Woodland structure (life-classes)                       7
     3.4   Size/age distribution                                   8
     3.5   Basal area                                              9
     3.6   Non-native species                                      9
     3.7   Herbivore impacts                                      10
     3.8   Herbivores                                             10
     3.9   Potential for tree regeneration                        11
4.   DISCUSSION                                                   12
     4.1   Viability of typical tree species                      12
     4.2   Site Condition Monitoring targets                      12
     4.3   Site Management Statement                              13
     4.4   Reasons for lack of regeneration                       14
     4.5   Prognosis                                              15
5.   CONCLUSIONS                                                  16
6.   REFERENCES                                                   17
ANNEX 1: TABLES                                                   19
ANNEX 2: FIGURES                                                  24
ANNEX 3: METHODS USED FOR ASSIGNING LIFE STAGE CLASSES AND LEVELS
OF BROWSING                                                       51

                                          iii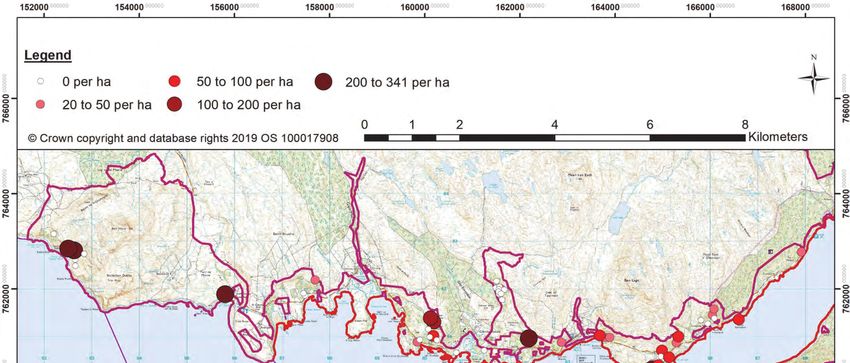
Acknowledgements

I would like to thank all the landowners for giving permission to access their land in order to
carry out the survey covered in this report. I want also to thank all the members of the survey
team (Tom Edwards and Fraser Milne) for their efforts in completing the survey, and to
Graeme Taylor of Scottish Natural Heritage in the helpful management of the contract.

Nomenclature

The scientific names of vascular plants follow that of Stace (2010).

                                              iv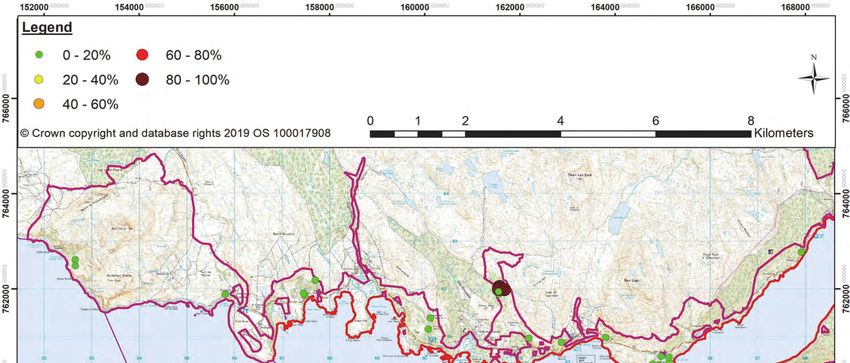
1. INTRODUCTION
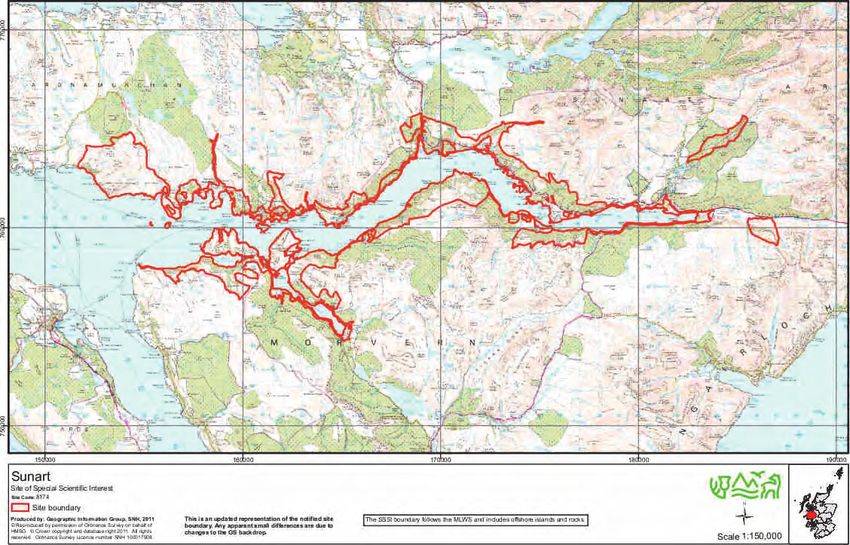
The Sunart Site of Special Scientific Interest (SSSI) is located around the north and south
shores of Loch Sunart which is between the Morvern and Ardnamurchan Peninsulas in the
west Lochaber district of the Highland region of Scotland (Figure 1). The Sunart SSSI is listed
for a wide variety of biological features:
Bryophyte assemblage
Caledonian Igneous
Chequered skipper (Carterocephalus palaemon)
Dragonfly assemblage
Eelgrass beds
Egg wrack (Ascophyllum nodosum ecad mackaii)
Lichen assemblage
Moine
Moths
Otter (Lutra lutra)
Rocky shore
Saltmarsh
Tertiary Igneous
Upland assemblage
Upland oak woodland
Vascular plant assemblage
The whole of the SSSI covers 5,540.16 ha of which 1,647 ha is upland oak woodland. All but
a small area of the SSSI at the eastern end in Glen Tarbert lies within the Sunart Special Area
of Conservation (SAC). The Sunart SAC is listed primarily for its Western acidic oak woodland,
but the other features for which it has been designated are:
mixed woodland on base-rich soils associated with rocky slopes;
wet heathland with cross-leaved heath
dry heaths;
reefs; and
otter.
The Conservation Objectives for the Sunart SAC are to ensure that the following are
maintained in the long term for each of the qualifying habitats:
Extent of the habitat on site
Distribution of the habitat within site
Structure and function of the habitat
Processes supporting the habitat
Distribution of typical species of the habitat
Viability of typical species as components of the habitat
No significant disturbance of typical species of the habitat
In the last assessment of the condition of the upland oak woodland habitat in November 2009,
it was assessed to be in ‘unfavourable no change’ condition. The condition assessment
identified over-grazing and the presence of invasive non-native species (Rhododendron
ponticum) as the main pressures on the habitat.
The Site Management Statement lists the following actions that need to take place in order
that the SSSI woodland features can be restored to favourable condition:
1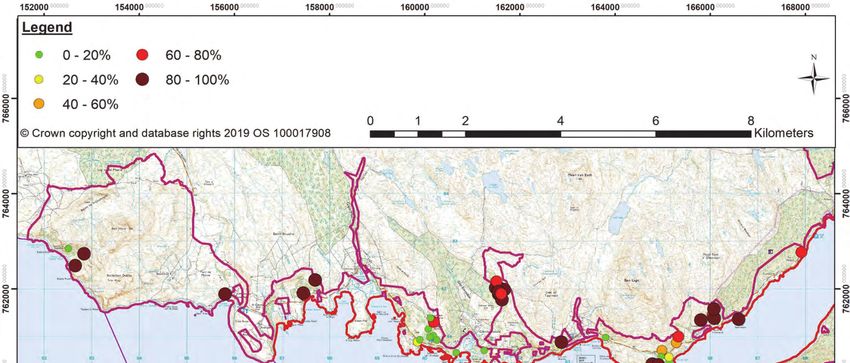
removal of rhododendron and subsequent control of regrowth or seedlings;
maintain a balance of deer grazing to allow for natural regeneration without the formation
of an unduly thick understory;
encourage the expansion of new native woodland onto appropriate ground around the
existing woodland, using natural regeneration where possible or by appropriate planting;
improving the structure of the woodland by increasing the proportion of saplings and
mature trees present for all native species, increasing the quantities of dead wood which
is present, and retaining open glades;
safeguarding against fire damage.
The non-vascular plant features (bryophytes and lichens) for the SSSI are also in unfavourable
condition and are dependent on the woodland habitat. The Site Management Statement for
the non-vascular plant features within the SSSI also state that:
the structure of the woodland habitat needs to be maintained or improved;
the control of regeneration of non-native species (rhododendron) needs to be carried
out to improve the condition of the lichen feature.
1.1 Aims
The key aim of this survey is to implement a fit for purpose baseline survey of the existing
woodland profile in terms of life-class, including seedlings and saplings, and the relative nature
and extent of current herbivore impacts on the populations of trees. This will provide the data
necessary to assess the long-term viability and future of the woodland habitat and, if there is
a poor age-structure to the population of trees, to identify the likely causal factors that may be
resulting in any lack of regeneration in the population of trees. The survey will also identify the
presence of rhododendron and whether deer exclosures are having the desired effect in
allowing tree regeneration and recruitment, and its consequent effect on the structure of the
woodland habitat.
2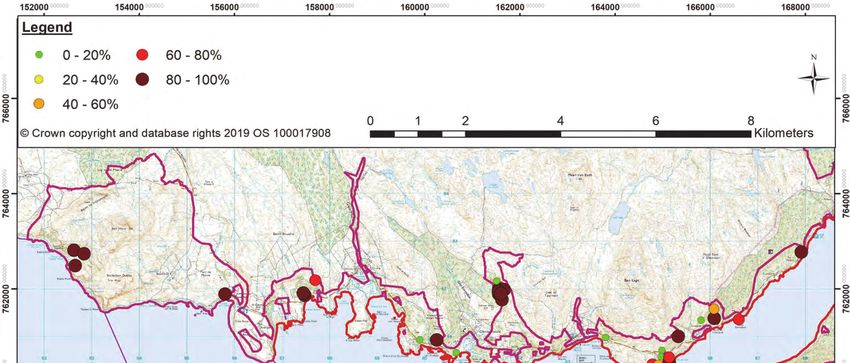
2. METHODS
For any healthy self-sustaining population of organisms there must be more individuals in the
younger generations than the older generations, otherwise the population will die out.
Although there may be spatial variation in the distribution of older and younger trees within a
woodland, for a woodland to sustain itself there must be more younger trees, especially
seedlings and saplings, than older trees. The direct measurement of the age of trees is both
time consuming and potentially damaging to trees as it requires the removal of a core of the
tree in order to count the number of annual growth rings. A much quicker and less invasive
approach is to measure the girth of the trees at a standardised height (1.3 m above the
ground). Trees can also be placed into different life-classes by their size, shape and proportion
of dead branches (Clifford et al., 2004). The life-classes do not relate directly to the age of the
trees, but give a descriptive indication of the stage in the trees life-history and these life-
classes can be summarised as follows:
Seedling – plants that are no more than 1.3 m tall and usually within the field layer
(mainly herbaceous perennials)
Small sapling – plants that are between 1.3 and 3 m tall
Large sapling – plants that are between 3 and 5 m tall and usually have a dbh less than
5 cm
Pole stage tree – dense stands of young reproductive trees more than 5 m tall with dbh
5 to 20 cm, but still not reached full canopy height and spread
Young reproductive tree – lone young reproductive trees that have dbh values 5 to 20
cm that have still not reached full canopy height and spread
Mature tree – healthy trees that have reached full height and have a spreading canopy
Over-mature tree – trees with a spreading canopy that have some dead or dying
branches (between 10 and 50% of the canopy)
Senescent tree – trees where more than 50% of the canopy is dead.
“Phoenix” trees – trees where the main bole is dead or procumbent and new vigorous
shoots coming from the base or from the main trunk
Dead trees – include standing dead trunks, dead trunks lying on the woodland floor and
stumps
2.1 Sampling strategy
Approximately 0.6% of the upland oak woodland habitat was sampled across the whole of the
Sunart SSSI by taking a total of 212 plots, of which 51 were within the area covered by the
Ardnamurchan DMG. The sample plots were taken at random within areas known to have
some trees present within the SSSI and the location of these plots is shown in Figure 2. This
map shows which plots are within deer exclosures, but some of these fences are no longer
effective in keeping red deer out of the ground enclosed.
2.2 Field survey
2.2.1 Woodland profile
Most of the survey was carried out between the 7th and 13th May, but the survey of six plots
had to be delayed until the 7th August due to the presence of a pair of breeding birds that are
on Schedule 1 of the Wildlife & Countryside Act (1981 as amended).
The surveyors navigated their way to the sample plot locations using maps and hand-held
GPS receivers (typically Garmin GS12s). Two sample plots had to be discarded due to
problems of access (dense rhododendron, rocks and steep ground) making it impossible to
reach the given grid references, and 14 plots had to be moved a certain distance so that they
were accessed safely. In every instance the grid reference at the centre of the plot was
3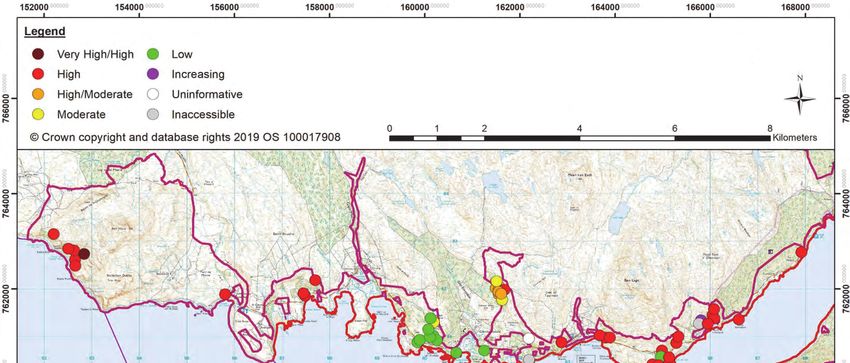
recorded. The centre of the plot was marked with a wooden post with a numbered tag. Forty
of the sample plots were within 10 metres of the given grid reference, i.e. within the margin of
error for single hand-held GPS receivers working within woodland. Eleven plots were between
10 and 20 metres of the grid reference supplied and three plots were between 20 and 42
metres from the grid reference.

The majority of plots had a diameter of 25.2 metre centred on the central post that was used
to mark the plot. The diameter of each tree (diameters more than 5 cm) was measured 1.3
metres above the ground (dbh) to the nearest centimetre with either a forestry tape or a tailor’s
tape measure. The Forestry Commission NFI Survey Manual for measuring tree diameters
was followed (FC NFI 15.0). Where a tree had multiple stems at 1.3 m above the ground each
one was measured separately and assigned to the tree. The species of tree and its life-class
was also noted using the classes described by Clifford et al. (2004) (see Annex 3 for details
of life-classes).

The Forestry Commission guidance on monitoring even-aged stands of trees suggests that at
densities of more than 300 stems per ha, a 11.2 m diameter plot is used, i.e. 100 m2 (Kerr et
al., 2002). Where the densities are between 150 and 300 stems per hectare, a 16 m diameter
plot is used, i.e. 200 m2. In addition, where there was a high density of seedlings and/or
saplings, i.e. more than 100 per 25.2 m diameter plot, a smaller plot size of 11.2 m or 16 m
diameter centred on the same post were used.

It was necessary to reduce the area used for counting the number of seedlings and saplings
at 20 plots (S34, S45, S54, S60, S78, S79, S86, S91, S96, S104, S110, S112, S114, S119,
S127, S131, S141, S145, S146 and S198). The result was that the total area of the plots used
for counting seedlings and saplings amounted to 1.83 ha.

The plot size was reduced for counting and measuring trees at 14 plots: S45, S54, S60, S78,
S79, S86, S91, S96, S104, S112, S114, S127, S131 and S145. This was done because either
the densities of the pole stage trees was very high or because the plot size was reduced to
keep within a fence line or because of an inaccessible crag being present. This meant that the
total area of the 51 plots used to count trees in different life-classes and to measure their
diameters amounted to 2.07 ha.

One or two photographs of the sample plots were taken with a digital camera and the direction
of the photograph recorded with a compass.

2.2.2   Herbivore impacts
As browsing on seedlings and saplings is considered to be an important factor in the apparent
lack of tree regeneration, the levels of browsing on seedlings and saplings was assessed. This
was done by counting the number of seedlings and saplings where the leading shoot was
browsed or un-browsed. Where the leading shoot was browsed the plant was classed as being
browsed, but some seedlings and many saplings had two or more leading shoots. Also for the
larger saplings, especially the saplings of downy birch, there was no clear leading shoots. In
these instances a plant was classed as being browsed if more than half the shoots were
browsed.

As four plots did not have any seedlings or saplings, the levels of browsing on (basal shoots,
epicormic shoots, preferentially browsed species, sward and fraying/ bark stripping) was
assessed as well using the criteria in Armstrong et al. (2014). The indicators and thresholds
for the different levels of browsing are given in Annex 3.

If the indicator was absent ‘NP’ was recorded. Where there were too few epicormic shoots,
basal shoots, seedlings, saplings or preferentially browsed species then a ‘U’ was recorded to

                                               4
indicate it is uninformative. If the indicator was considered to be inappropriate a ‘NA’ was
recorded. For instance, early in the season where purple moor-grass (Molinia caerulea) had
not started to grow, but dominated the sward, it was not possible to assess the levels of grazing
on the sward.
2.2.3 Quality control
Before the assessment was started Dr Headley spent at least one day with each of the other
field surveyors (Tom Edwards and Fraser Milne) to clarify the methods, the interpretation of
the various indicators and the standardisation of the various threshold levels to assign each
impact level. Initially several plots were assessed together. When there was a high level of
harmonisation, further sample plots were assessed individually and the results compared and,
where appropriate, discrepancies were discussed and adjustments made by the surveyors to
their interpretation or judgement of the indicators.
The data was recorded in the field either on to tablets or paper pro-forma recording sheets.
Data was checked for consistency and errors corrected.
2.3 Data analysis
2.3.1 Calculation of age-structure
Where ranges in the numbers of individuals of seedlings or saplings were given for a plot, the
mid-point value of the range was used to calculate the density of seedlings or saplings for that
individual plot. However, the upper and lower values were used to calculate a range in
seedling and sapling densities for the population of the species as a whole.
The numbers of individual trees in each life-class were totalled for each species and then
divided by the total area of the plots surveyed (2.07 ha for trees and 1.83 ha for seedlings and
saplings) to obtain the number of stems per ha. The number of trees in different size classes,
i.e. different dbh values, was also calculated using the size classes used by the Forestry
Commission (Kerr et al., 2002), as shown below:
Small trees 5 to 25 cm diameter
Medium trees 25 to 40 cm diameter
Large trees 40 to 55 cm diameter
Very large trees more 55 cm diameter
A minimum diameter of 5 cm was used for small trees as two trees in the pole stage life-class
had diameters less than 7 cm.
The basal area (m2 per ha) for each species was also calculated from the individual measures
of all stem diameters that were at least 5 cm in diameter. Basal area is used as an indication
of the level of shading.
2.3.2 Calculation of browsing impacts
The calculation of levels of browsing on seedlings and saplings was a simple calculation of
the proportions where there were absolute numbers.
The levels of grazing on the sward and the levels of fraying/bark stripping were not used in
the calculations as they are less relevant to an understanding of the impact on the overall
woodland structure. An overall browsing impact was calculated from each of the individual
indicators by ranking the values and taking the median score. To calculate the median value,
the number of indicators falling in each impact category was calculated and the central one
was taken when these values are ranked in ascending order. For example, if there were five
5indicators available the value of the 3rd indicator when placed in rank order was taken as the
impact category for the sample plot as a whole. When there was an even number of indicators
available the mid-point between the two indicators either side of the mid-point was used. In
some cases this fell between two categories, such as Moderate and Low. In this instance an
impact of Moderate/Low was taken.
2.3.3 Statistical analysis
Although averages and standard deviations were calculated for each variable, as the data is
not normally distributed the non-parametric statistics were calculated for the data. These were
medians, and 25th and 75th percentiles. The median shows the central tendency in the data
and is the central value when all values are ranked in increasing order. The 25th and 75th
percentiles are the respective 25th and 75th values when ranked in increasing order and the
difference between these two values shows the variation in the data. This is called the inter-
quartile range (Sokal & Rohlf, 1969).
As the browsing levels on seedlings and saplings are expressed as percentages, this data
requires arcsine transformation before means are calculated. The means and standard
deviations are these values when transformed back in to percentages.
63. RESULTS
3.1 Overall number of trees, seedlings and saplings
A total of 824 live trees and 98 dead trees were counted and measured within the 51 plots that
were located within the Ardnamurchan DMG part of the Sunart SSSI. This gives a density of
399 live trees per ha (excluding seedlings and saplings) and 47 dead stems per ha (Table 1).
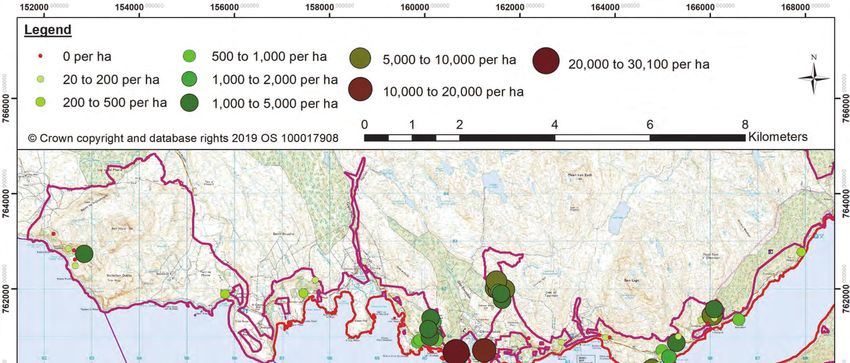
A total of 2,693 seedlings and 1,343 saplings were counted. There were, therefore, 1,475
seedlings per ha and 737 saplings per ha in this set of samples (Table 1). Seedlings were
present in 44 of the 51 sample plots, whilst small and large saplings were found in 34 and 24
sample plots, respectively. At least one tree was present in all but two of the 51 sample plots
(S25 and S79).
3.2 Species composition
Overall, downy birch (Betula pubescens) and rowan (Sorbus aucuparia) are the most
abundant species within this part of the Sunart SSSI (Figure 3). The total density of live
individuals, including seedlings and saplings, of these species was 1,514 and 811 plants per
ha, respectively (Table 1). Although sessile oak (Quercus petraea) is the next most abundant
species at 121 plants per ha, it only makes up 5% of all seedlings, saplings and live trees that
were counted. Hazel (Corylus avellana), holly (Ilex aquifolium) and alder (Alnus glutinosa) are
the next most abundant species, and at 38, 46 and 31 live stems per ha, they only each make
up between 1.2 and 1.7% of the composition of the woodland, respectively (Table 1). Ash
(Fraxinus excelsior), Scots pine, grey willow (Salix. cinerea), wych elm (Ulmus glabra) and the
non-native Sitka spruce (Picea sitchensis), fir (Abies sp.) and European larch (Larix decidua),
are very minor components of the woodland and their combined numbers amount to only 3.3%
of all live plants (Figure 3).
3.3 Woodland structure (life-classes)
Across the area surveyed as a whole there are far more seedlings than saplings and trees
(Figure 4 and Table 1). The combined densities of pole stage and young reproductive trees
was 150.4 stems per ha, which is only a little short of the density of mature trees (Figure 4).
The densities of small and large saplings are higher than the mature or over-mature life-
classes (Figure 4). The densities of senescent and “phoenix” life-classes are low, which
suggests that not too many trees are dying of old age at present.
When the life-classes of individual species of tree are examined there are marked differences
in the densities in each life-class (Table 1). The seedling stage is dominated mostly by rowan
and downy birch seedlings (Figure 5). The small and large sapling life-classes are dominated
by downy birch with rowan making only a small contribution to the population of saplings
(Figure 5). Small saplings of sessile oak were present at low densities, but the large saplings
of sessile oak were very rare with only two being found across the 1.83 ha of ground surveyed
within the 51 plots (Table 1). Small and large saplings of alder were more abundant than those
of sessile oak (Table 1).
Oak seedlings were relatively rare and were found in only nine of the 51 sample plots
surveyed. The plots with oak seedlings are scattered throughout the survey area covered in
this report (Figure 6). Sessile oak saplings were at even lower densities than the seedlings
and small saplings were found in only four plots and large saplings in two plots (Figures 7 and
8). Only seven young reproductive sessile oak trees were found in all the plots that were
surveyed. This compares with a total of 49 dead oak trees that were found in the same plots.
In contrast to the sessile oak population, the population of downy birch is successfully
reproducing with a higher density of seedlings and saplings than mature trees (Table 1). The
densities of birch seedlings exceed those of the median density of mature birch trees (140 per
ha) in 18 of the sample plots. There is considerable spatial variation in the recruitment of birch
7seedlings and saplings (Figures 7, 8 and 9). There is probably sufficient recruitment of large
saplings and young birch trees in over half of the plots to maintain the population of downy
birch in the long term. This is because the combined densities of saplings, pole stage and
young reproductive trees exceed those of mature live birch trees in 31 of 51 sample plots.
The recruitment of rowan saplings and young trees is moderate with the combined densities
of small and large saplings and young reproductive trees exceeding the density of mature
rowan trees in 16 of the sample plots. However, the densities of mature rowan trees were low
with an average density of only 3.4 mature trees and 1 over-mature tree per ha (Table 1).
Despite the very high densities of seedlings in some plots only 3.6% of these get to the small
sapling stage and the densities of large rowan saplings is less than half that of the small rowan
saplings.
Although there are good numbers of holly seedlings, very few saplings were found and only
one pole stage and no young reproductive trees were found (Table 1). There is, therefore, an
insufficient level of recruitment of young holly trees to replace the few mature holly trees found
in this survey.
Hazel has a similarly low number of saplings and young reproductive trees compared to the
densities of mature trees (Table 1).
Overall, alder has a higher density of saplings and young reproductive trees than mature or
over-mature trees (Table 1). It appears that there is adequate recruitment of juvenile and
young alder trees in three of the four plots where alder was present.
The other species of tree native to these woods are ash, wych elm and grey willow. Scots pine
is native to the area but the large mature Scots pine tree in the area around Dùn Ghallain
between Camasina and Laga Bay were all of similar size and close to a forestry plantation.
These trees are almost certainly planted.
Figures 10 to 14 show the densities of each of the different life-classes of tree in each plot
across the Ardnamurchan DMG part of the Sunart SSSI. Pole stage trees are at high densities
in a few plots and largely absent from most other plots whilst young reproductive trees are
found in most plots throughout the study area (Figure 11). Over-mature and especially
“phoenix” trees were found in the patch of woodland to the north of Glenborrodale (Figures 12
and 13). Dead trees were found in most plots, except those in the woodland to the north of
Glenborrodale (Figure 14).
3.4 Size/age distribution
The sessile oak trees within this part of the Sunart SSSI are composed mostly of small and
medium sized trees (Table 3 and Figure 15). The densities of seedlings, small saplings and
large saplings are much lower than those of all size classes of tree, except for the very large
trees (Figure 15). There is no obvious pattern to the spatial distribution of live sessile oak trees
across the area covered in this report (Figure 16). The median diameter of all the live oak
trees was 28 cm and the inter-quartile range was from 21 to 36 cms. Assuming radial growth
rates in the region of 1 to 2 mm per annum, then most of the sessile oak trees were established
between 52 and 180 years ago (Büyüksair et al., 2018; Härdtle et al., 2013).
The downy birch population has more seedlings than saplings, which are themselves more
abundant than live trees in any size class (Figure 17). Not surprisingly there are very few large
(dbh 40 to 55 cm) and no very large (dbh > 55cm) downy birch trees (Figure 17). Downy birch
trees were most abundant in the centre of the survey area and were largely absent from the
wood to the west of Ben Hiant (Figure 18). The median diameter of all live birch trees was 11
cm and the inter-quartile range was between 8 and 17 cms.
8The rowan and holly populations are dominated by seedlings (Figures 19 and 20). The
apparent survival rate of both the rowan and holly seedlings to the large sapling stage is 2%.
The low survival of these species through to the large sapling stage is the main reason for the
low frequency of trees of these species within the Sunart SSSI’s upland oak woodland habitat
(Table 1). Most small trees of holly and rowan were found growing out of relatively inaccessible
rock outcrops within the sample plots.
Hazel and alder can also be important constituents of upland oak woodland habitat. The cohort
of hazel saplings were at lower densities than the small or medium sized trees (Figure 21).
Many of the large sapling sized stems of hazel and alder were part of multiple stemmed stools
of an older tree. These species of tree naturally coppice, and therefore, stem densities can
give an exaggerated impression of the abundance of a species. Therefore, the apparently high
levels of recruitment of small and large saplings of alder are not necessarily of all new
individuals, but some are of new vegetative off-shoots from existing trees (Figure 22).
3.5 Basal area
The amount of canopy cover produced by mature trees, and therefore the amount of shading,
shows a strong positive relationship to the area of ground covered by the stem bases of these
trees, also known as basal area. The basal area averaged across all live trees and plots
surveyed was 17.5 m2 per ha (Table 4). This represents just under 0.2% of the ground area
that is occupied by the trunks of trees. At 18 m2 per ha the median basal area is the same as
the mean basal (Table 5). As one would expect most of the basal area is in the mature and
over-mature life-classes of tree (Figure 23).
Sessile oak accounts for 50% of the total basal area of live trees measured, with downy birch
contributing another 25% to the total live basal area (Table 4). Scots pine makes a significant
contribution (14%) to the total basal area due to a small number of large trees in a few plots
in the area around Dùn Ghallain. Alder and European larch are similar in that a relatively few
large stemmed trees make a greater contribution to the total basal area than the number of
stems present (Tables 3 and 5). Together, all the other species of tree (ash, hazel, rowan,
holly, wych elm and grey willow) account for less than 6% of the basal area of all live trees
(Table 4).
3.6 Non-native species
The larch trees in plot S22 at Rubha Shainphort near Camasinas are not native and are
planted, whilst the single trees in plots S66 and S147 may or may not have been deliberately
planted. Only one seedling of this species was found in plot S22 as these mature trees.
Seedlings of Sitka spruce were found in four plots and young reproductive trees were found
in one other plot. These plots do not have any mature Sitka spruce trees immediately close
by. There are, however, a number of Sitka spruce plantations immediately adjacent to or close
to the Sunart SAC/SSSI.
One unidentified fir (Abies sp.) seedling was found in one plot (S43).
Rhododendron bushes were recorded in 16 plots, including two where they prevented access
(S164 and S188), and they made it difficult to survey the area around Camasinas. The density
of rhododendron bushes is almost certainly preventing tree regeneration in this area and this
was evident in plots S9, S110, S115, S164 and S207 plots. This is not necessarily the worst
affected area, as another area with a severe infestation of rhododendron is around
Glenborrodale, especially in and around plots S34, S43, S92, S96, S104, S125, S127, S188
and S198. Plots S91, S119 and S140 also have rhododendron, but the plants have not
become especially tall and dense. Recent clearance of the rhododendron in plot S34 has
allowed significant regeneration of downy birch, but no sessile oak seedlings were present
9despite the presence of trees of this species in and around the plot. The densities of
rhododendron are considered to be sufficient to be preventing or reducing the establishment
of seedlings and/or saplings of native species of tree in six of the sample plots surveyed, plus
the two which could not be accessed due to the impenetrable nature of the thicket of
rhododendron bushes.
3.7 Herbivore impacts
Browsing levels on seedlings, small saplings and large saplings across all the species were
51%, 70% and 32%, respectively (Table 6). Levels of browsing on seedlings of downy birch
were significantly lower than those on all other species other than Sitka spruce (Table 6).
Browsing levels on seedlings of alder, ash, European larch, hazel and sessile oak were very
high at over 90% (Table 6). The lower browsing on rowan and downy birch seedlings may in
part be due to the small size of these far more numerous seedlings resulting in them being
hidden below the field layer during the summer months in their first year of growth.
The browsing levels on small saplings of alder, rowan and sessile oak were higher than that
on downy birch (Table 6). There were too few small saplings of holly, hazel, willows and ash
to make any valid comparisons. The fact that none of the large saplings of rowan, alder, holly,
sessile oak and willows had more than 50% of their shoots browsed may reflect the fact that
most of the branches were above the browsing level of any large herbivores.
When the browsing levels are analysed across individual plots the inter-quartile range for
browsing on seedlings was between 19 and 93% with the median browsing level being 77%
(Table 7). The browsing levels on all seedlings were high throughout the survey area, except
for the Glenborrodale Nature Reserve (Figure 24). Browsing levels on small saplings were
also high throughout most of the survey area with only a few plots close to the road at
Glenborrodale, Laga and Port nan Gall with no browsing of the small saplings (Figure 25).
There are too few plots with large saplings to discern any spatial pattern in the levels of
browsing of large saplings (Figure 26).
There are high levels of browsing within the deer fence around the woodland to the west of
Ben Hiant. Stags were seen within the woodland and a group of red deer were seen to cross
through a gap in the fence at the time of the survey.
Browsing levels on epicormic shoots could not be assessed in 30 sample plots because they
were absent and the levels of grazing on the sward could only be assessed in 26 plots (Table
8). The absence of suitable species to assess grazing on the sward was one reason for not
being able to assess this latter indicator. The browsing/grazing impacts were generally High
on the seedlings and saplings, and epicormic and basal shoots of trees (Table 8). Fraying and
bark stripping on seedlings and saplings was very rarely observed and therefore the median
impact for this indicator is Low (Table 8).
Overall herbivore impacts were High in most of the area surveyed except within the
Glenborrodale nature reserve (Figure 27). Overall herbivore impacts within the Glenborrodale
Nature Reserve are almost certainly Low due to the presence of a deer fence. The plots also
close to the village of Glenborrodale have Low overall herbivore impacts probably due to their
proximity to the road and houses.
3.8 Herbivores
The counting of deer dung pellet groups in the large plots was found not to be sufficiently
consistent to provide any meaningful data. Some of the sample plots were on steep slopes
that made it very difficult or unsafe to count deer dung pellet groups.
10Evidence for the presence of deer, especially red deer, was found in most plots. The evidence
included dung and hoof prints, but one dead stag was found in a power-line wayleave at
Camasinas. As mentioned above stags and hinds were seen within the exclosure Uamha na
Creadha and they were seen running through a gap in the fence. The area immediately around
this exclosure is used for hill grazing by sheep. It is probably this same hill grazing that use
the small fragments of wood above Camas nan Geall.
A small group (5 to 10 individuals) of goats browse in the area around Camasinas and these
were apparently released into this area in the last 5 to 10 years.
3.9 Potential for tree regeneration
All areas of the Sunart SSSI that were surveyed have the potential to support trees and there
is no obvious reason why seedlings or saplings should not establish in any of these areas.
There are plenty of seed sources for the regeneration of downy birch and sessile oak. Although
mature trees of rowan, hazel, holly and alder are much rarer there is no reason why their
seedlings and saplings should not establish as there are plenty of seedlings of rowan and holly
despite the mature trees of these species being present at low densities (3.4 and 1.5 trees per
ha).
114. DISCUSSION
4.1 Viability of typical tree species
In order that the Sunart SSSI continues to support the upland oak woodland habitat, there
must be viable populations of the species of tree typical of upland oak woodland. This means
that there must be a continued replacement of dead and dying oak trees and other species
characteristic of the wood (e.g. downy birch, hazel, rowan and holly) with young trees.
The sessile oak population has an unsustainable population structure as the large sapling
generation is virtually absent and there were relatively few small saplings present (Figure 15).
The density of oak seedlings was also very low and much lower than that of the mature tree
cohort. Therefore, the population of mature and over-mature sessile oak trees cannot
effectively be replaced.
In contrast to sessile oak, the downy birch population appears to be viable as there are higher
densities of seedlings and small and large saplings than mature trees (Table 1 and Figure 17).
Holly, rowan, hazel and alder are other typical species of upland oak woodland habitat. The
holly and rowan populations are not viable as the vast majority of seedlings do not survive
through to the small or large sapling stages (Figures 20 and 19). Similarly the hazel population
is not currently able to recruit new individuals due to the lack of large saplings.
The Sunart SSSI was been designated for its upland oak woodland and this habitat supports
a number of other features within this protected area, including the internationally important
assemblages of lichens and bryophytes. Therefore, any reduction in the cover of oak or any
of the other trees that support the mosses, liverworts and lichens that grow on the trunks and
larger branches (epiphytes) will be detrimental to this important feature. Birch tends not to
support so many of these epiphytic organisms. The levels of recruitment of new sessile oak
trees are worryingly low with far fewer seedlings and saplings than mature trees. Any self-
sustaining population of plants or animals has to produce more offspring than adults as most
young individuals die before they get to a reproductive age (Begon et al., 2006). When the
number of individuals in different cohorts is plotted the resultant graph, for trees at least, is
normally an inverted J-shaped curve (Gao et al., 2017; Edwards & Mason, 2006). In the case
of the sessile oak it is currently an unsustainable population as there are very few seedlings
as well as the fact very few of these seedlings are currently getting through to the pole stage
or young reproductive trees (Table 1 and Figure 6). Therefore, the Conservation Objectives
are not currently being met within at least for this part of the Sunart SAC.
4.2 Site Condition Monitoring targets
The nature conservation condition of statutory protected areas is assessed against a number
of attributes and targets listed in the Common Standards Monitoring (CSM) issued by the Joint
Nature Conservation Committee (JNCC). The relevant targets in the CSM guidance for
woodland habitats that can be assessed from the data collected in this survey are as follows:
1. Understorey (2-5 m tall) present over at least 20% of total stand area.
2. Canopy cover present over 30 – 90% of stand area.
3. At least three age classes spread across the average life expectancy of the commonest
trees.
4. Some area of relatively undisturbed mature/old growth stands or a scatter of large trees
allowed to grow to over-maturity/death on site (e.g. a minimum of 10% of the woodland
or 5-10 trees per ha).
5. A minimum of 3 fallen lying trees >20 cm diameter per ha and 4 trees per ha allowed to
die standing.
126. Signs of seedlings growing through to saplings to young trees at sufficient density to
maintain canopy density over a 10 yr period (or equivalent re-growth from coppice
stumps).
7. No more than 20% of areas regenerated by planting.
8. At least 95% of cover in any one layer of site-native or acceptable naturalised species.
Targets 2, 4 and 7 are satisfied. In terms of the cover of non-native species in the tree canopy
layer, the European larch and Sitka spruce trees are the only main non-native species present,
but their combined basal area, a surrogate for cover, amounts to only 0.533 m2 per ha, which
is only 3% of the total basal area of all live trees (Table 4). Therefore, target 8 is satisfied.
However, the presence of rhododendron in about a third of the plots and in six of the 53 plots
it was present as a dense thicket. Therefore, rhododendron probably makes up over 10% of
the cover of the shrub layer within the woodland habitat and consequently the Sunart SSSI
would fail the condition assessment on this criterion.
A total of 11 fallen lying trees with diameters greater than 20 cm were found in the 2.1 ha
surveyed, whilst there were 32 standing dead trees per ha. Therefore, both criteria in target 5
were satisfied.
Target 1 is only satisfied in that large saplings (3 to 5 metres tall) were present in 47% of the
sample plots, but the understorey cover is well below 20% and probably only amounts to a
few percent.
Downy birch satisfies target 3 listed above as there are seedling, saplings and mature trees
present for this species. However, sessile oak is largely lacking the sapling and young
reproductive/pole stage generations. These two species are the commonest trees in the
Sunart SSSI upland oak woodland habitat and therefore target 3 is not reached.
Target 6 may well be satisfied in that the canopy density will probably be maintained over the
next 10 years despite the fact that insufficient numbers of seedlings are managing to grow
through to young trees at present to maintain the woodland structure.
4.3 Site Management Statement
It is possible to make comments on some of the targets in the Site Management Statement.
This includes rhododendron, which was found to be present in 16 of the 53 sample plots
assigned to this part of the Sunart SAC/SSSI. The densities of this invasive non-native shrub
were observed to be significant in affecting the regeneration of the native trees and shrubs in
about 16% of the woodland. The densities of rhododendron bushes were so high as to cause
significant problems in preventing access to the woodland around Camasinas. The woodland
around Glenborrodale also has extensive areas of rhododendron some of which forms dense
thickets. This means that the 5th and 7th of the conservation objectives listed in the introduction
are not being met.
The balance of deer grazing to allow natural regeneration is not being met as browsing by
deer (roe and red) is preventing adequate regeneration of sessile oak, holly, rowan and hazel.
Neither is the aim of increasing the proportion of saplings of native species of tree being met.
The aim of having sufficient dead wood is certainly been achieved within this part of the Sunart
SSSI as a whole.
It is not possible to comment on the extent of woodland habitat within the Sunart SSSI and
whether native woodland is expanding onto appropriate ground around the existing woodland
habitat.
134.4 Reasons for lack of regeneration
There are two problems with the oak population: 1) there appears to be few seedlings
establishing and 2) very few of the seedlings are surviving to the large sapling stage. The
seedlings of oak are currently at densities that are probably too low to replace the mature and
over-mature trees in all but three of the 51 sample plots.
The lack of seedlings and small saplings surviving through to large sapling and young trees
not only applies to sessile oak, but also to the populations of rowan, holly, hazel, ash and wych
elm.
The lack of oak seedlings in the plots surveyed is unlikely to be due to a lack of seed production
as the canopy is dominated by sessile oak in 24 of the 51 plots. A low density of sessile oak
seedlings could be attributed to predation of the acorns by voles, squirrels and various species
of bird (Shaw, 1968). However, conversely a lack of regeneration of oaks has sometimes been
linked to a lack of red squirrels or jays caching seeds which subsequently germinate before
being re-found by these animals.
The poor establishment of saplings and young reproductive trees from seedlings could be
attributed to: 1) browsing by large herbivores, 2) insufficient light and/or 3) disease. There was
no evidence that plant pathogens had resulted in the death of any of the seedlings and
saplings of any species.
Excessive shading can prevent seedlings and saplings of the more light demanding species
from establishing, as shown for birch (Jarvis, 1964). The basal area of trees can be used as a
proxy for the amount of light likely to reach the floor of conifer plantations and to allow for the
natural regeneration of trees (Hale 2004). Sessile oak seedlings and saplings are moderately
shade tolerant and can apparently tolerate shading levels as low as 50% of ambient light
(Jarvis, 1964; Annighöfer et al., 2015; Březina & Dobrovolný, 2011). Out of the 51 plots
surveyed only 13 plots had basal areas greater than 25 m2 ha-1. The highest density of oak
seedlings found in this survey (200 per ha) was in plot S141 which had a basal area of 33.1
m2 ha-1. Therefore, the lack of establishment of sessile oak saplings and possibly the other
species of tree cannot be realistically attributed to significant amounts of shading by older
trees. This, however, does not exclude the fact that rhododendron thickets are almost certainly
preventing tree regeneration across about 11% of the woodland.
Given the lack of evidence for shading and disease for preventing the regeneration of sessile
oak within the woodland habitat at Sunart SSSI it only leaves browsing as the most likely
factor. Apart from birch, rowan and Sitka spruce, the browsing of the leading shoots of all
seedlings was very high at 85% or more. Browsing of the small saplings is also very high at
70%. Browsing is, therefore, considered to be the main, and almost certainly the only reason
for the lack of regeneration of trees within the woodland habitat within this part of the Sunart
SAC/SSSI. Birch has a greater degree of resilience to browsing due to it storing a greater
proportion of its carbohydrate reserves belowground, whilst Sitka spruce is less palatable to
browsers and is consequently less likely to be browsed by large herbivores (Forestry
Commission).
Although sheep and goats are probably important large herbivores in around Ben Hiant and
Camasinas, respectively, the majority of the upland oak woodland covered within this survey
is not affected by these animals. This only leaves red and roe deer as the most important large
herbivore that regularly browse on tree seedlings and saplings. The evidence for the impact
of sheep and/or deer in preventing the regeneration of broad-leaved trees in upland woodland
is long-standing and widespread (Shaw, 1968; Pigott, 1983; Beaumont et al., 1995; Rao,
2017).
144.5 Prognosis
If current levels of browsing continue, the dominance of the woodland canopy by oak will be
gradually reduced as the old and senescing sessile oak trees die. Currently the only tree that
is being recruited in any significant way is downy birch, and as this is species is more resilient
to browsing and is also less palatable (see Forestry Commission Scotland woodland grazing
toolbox), this species is likely to become the dominant species in the canopy. Therefore, in
the long term the woodland is most likely to change from one dominated by large over-mature
sessile oak trees to one dominated by downy birch. The maintenance of a healthy population
of large oak trees is important for this SSSI. This is because the upland oak woodland on the
Atlantic seaboard of Scotland are internationally important for their epiphytic lichen and
bryophyte communities and unlike large oak trees, birch trees do not provide the correct
niches to support these support communities. Although hazel, ash and rowan can also support
the epiphytic lichen and bryophyte communities, they are much rarer and are also
preferentially browsed by deer.
The woodland habitat is also likely to shrink in size. The woodland is already fragmented on
the hill slopes and may have already shrunk in size in some areas. This could be confirmed
by examining old aerial photographs of the area and examining historical Ordnance Survey
maps.
155. CONCLUSIONS
Taken as a whole the age structure of the sessile oak population within the Sunart SSSI
that lies within the Ardnamurchan DMG is poor, due to a low number of saplings, pole
stage and young reproductive trees.
Far more young trees of sessile oak are needed to replace the ageing and dying
population of sessile oak trees.
Browsing by deer is largely responsible for the low survival of sessile oak, rowan, hazel
and holly seedlings through to the small and large sapling stages.
Although browsing by deer is probably the most important factor responsible for the lack
of regeneration of sessile oak, low densities of seedlings in certain parts of the woodland
habitat may be due to poor acorn production and/or predation of the acorns produced
by the ageing/senescing oak trees in the area.
If nothing is done to encourage an increase in the regeneration of sessile oak, and other
preferentially browsed tree species, the woodland will gradually change to a purely
birchwood and if deer as well as goats and sheep are not excluded or the numbers
reduced significantly the woodland will also decrease in extent and become even more
fragmentary.
Without such interventions the woodland will lose its conservation interest in terms of its
epiphytic lichen and bryophyte flora.
166. REFERENCES
Annighöfer, P., Beckschäfer, P., Vor, T. & Ammer, C. 2015. Regeneration patterns of
European oak species (Quercus petraea (Matt.) Liebl., Quercus robur L.) in dependence of
environment and neighbourhood. PLoS ONE, 10(8): e0134935.
Armstrong, H., Black, B., Holl, K. & Thompson, R. 2014. Assessing herbivore impact in
woodlands: a subjective method. Forestry Commission, Edinburgh.
Begon, M., Townsend, C.R. & Harper, J.L. 2006. Ecology: from individuals to ecosystems. 4th
edition. Blackwell Publishing, Oxford.
Beaumont, D.J., Dugan, D., Evans, G. & Taylor, S. 1995. Deer management and tree
regeneration in the RSPB reserve at Abernethy Forest. Scottish Forestry, July 1995, letters.
Březina, I. & Dobrovolný, L. 2011. Natural regeneration of sessile oak under different light
conditions. Journal of Forest Science, 57(8), 359-368.
Büyüksair, U., As, N. & Dündar, T. 2018. Intra-ring properties of earlywood and latewood
sections of sessile oak (Quercus petraea) wood. Bioresources, 13(1), 836-845.
Clifford, T., Collier, L., & Clifford, B. 2004. Woodland Profile Survey, Zone 1 - Feshie
Catchment Section 7 Control Agreement Area. A Report to the Deer Commission for
Scotland. Inverness.
Edwards, C. & Mason, W.L. 2006. Stand structure and dynamics of four native Scots pine
(Pinus sylvestris L.) woodlands in northern Scotland. Forestry, 79(3), 261-277.
Forestry Commission, n.d. Woodland grazing toolbox: Relative palatability and resilience of
native tree seedlings and saplings to browsing. Available at:
https://forestry.gov.scot/woodland-grazing-toolbox/grazing-management/foraging/palatability-
and-resilience-of-native-trees#
Gao, W.Q., Ni, Y.Y., Zue, Z.M., Wang, X.F., Kang, F.F., Hu, J., Gao, Z.H., Jiang, Z.P. & Liu,
J.F. 2017. Population structure and regeneration dynamics of Quercus variabilis along
latitudinal and longitudinal gradients. Ecosphere, 8(4), 1-15.
Hale, S. 2004. Managing light to enable natural regeneration in British conifer forests.
Information Note 63. Forestry Commission, Edinburgh.
Hamilton, G.J. 1975. Forest mensuration handbook. Forestry Commission Booklet 39. HMSO,
London.
Jarvis, P.G. 1964. The adaptability to light intensity of seedlings of Quercus petraea (Matt.)
Leibl. Journal of Ecology, 52(3), 545-571.
Kerr, G., Mason, B., Boswell, R. & Pommerening, A. 2002. Monitoring the transformation of
even-aged stands to continuous cover management. Information Note. Forestry Commission,
Edinburgh.
Pigott, C.D. 1983. Regeneration of oak-birch woodland following exclusion of sheep. Journal
of Ecology, 71(2), 629-646.
17Rao, S.J. 2017. Effect of reducing red deer Cervus elaphus density on browsing impact and
growth of Scots pine Pinus sylvestris seedlings in semi-natural woodland in the Cairngorms,
UK. Conservation Evidence, 14, 22-26.
Shaw, M.W. 1968. Factors affecting the natural regeneration of sessile oak (Quercus petraea)
in North Wales: I. A preliminary study of acorn production, viability and losses. Journal of
Ecology, 56(2), 565-583.
Sokal, R.R. & Rohlf, F.J. 1969. Biometry: The principles and practice of statistics in biological
research. Freeman & Co., San Francisco.
Stace, C. 2010. New Flora of the British Isles. 3rd edition. Cambridge University Press,
Cambridge.
18ANNEX 1: TABLES
Table 1. The number of trees (per ha) in each life-class for each species of tree surveyed across the Ardnamurchan Deer Management Group
(DMG) part of the Sunart SSSI.
Life-class
Species of tree Small Large Pole Young Over- Total
Seed-lings Mature Senescent “Phoenix” Dead
saplings saplings stage reproductive mature Live
downy birch 628.4 301.9 362.1 66.8 59.1 70.2 16.9 2.4 6.3 1,514.2 9.2
rowan 756.1 27.4 12.1 1.0 8.2 3.4 1.0 0.0 0.0 809.1 0.5
sessile oak 10.4 4.9 1.1 0.0 3.4 49.4 47.0 1.9 2.4 120.5 23.7
holly 42.7 1.1 0.5 0.0 0.5 1.5 0.0 0.0 0.0 46.3 0.0
hazel 26.8 1.1 0.0 0.0 0.5 8.2 0.5 0.5 0.5 38.1 0.0
alder 2.7 7.7 7.1 0.0 6.3 4.4 2.4 0.0 0.0 30.6 0.0
ash 4.9 1.1 0.0 0.0 0.0 3.9 3.4 0.0 0.0 13.3 0.0
Scots pine 0.0 0.0 0.0 0.0 1.0 10.7 0.0 0.0 0.0 11.6 2.4
European larch 0.5 0.0 0.0 0.0 0.0 8.7 0.0 0.0 0.0 9.3 2.4
grey willow 0.0 0.0 6.6 0.0 0.0 1.0 0.0 0.0 0.0 7.5 0.0
Sitka spruce 2.2 0.0 0.0 0.0 3.9 0.0 0.0 0.0 0.0 6.1 0.0
wych elm 0.0 0.0 0.0 0.0 0.5 1.0 0.0 0.5 0.0 1.9 0.5
unassigned willow 0.0 1.1 0.0 0.0 0.0 0.0 0.0 0.0 0.0 1.1 0.0
unassigned fir 0.5 0.0 0.0 0.0 0.0 0.0 0.0 0.0 0.0 0.5 0.0
unknown species 0.0 0.0 0.0 0.0 0.0 0.0 0.0 0.0 0.0 0.0 8.7
All species 1,475.4 346.3 391.2 66.8 84.7 161.7 71.2 5.3 9.2 2,611.8 47.4
19Table 2. Summary statistics for the density (per ha) of seedlings, small saplings, large saplings
and all live trees collected from each of the 51 sample plots surveyed.
Statistic
Species Life-class
Mean s.d. Min. 25%tile Median 75%tile Max.
Seedlings 2,641 4,779 0 80 820 3,680 30,100
Small saplings 694 1,497 0 0 80 500 8,400
Large saplings 926 3,280 0 0 0 250 21,000
Density of Pole stage 195 570 0 0 0 0 2,842
all plants Young reprod’ 81 159 0 0 20 65 3,000
of all Mature 164 169 0 40 120 265 802
species Over-mature 76 86 0 0 40 120 406
(per ha) Senescent 2 9 0 0 0 0 40
“Phoenix” 14 47 0 0 0 0 298
All live trees 532 651 0 200 340 606 3,248
All dead trees 46 81 0 0 0 60 341
Seedlings 12 36 0 0 0 0 203
sessile Small saplings 4 15 0 0 0 0 100
oak Large saplings 0.8 3.9 0 0 0 0 20
All live trees 89 127 0 0 40 120 582
Seedlings 1,390 4,506 0 0 199 1,060 30,451
downy Small saplings 659 1,528 0 0 0 391 8,526
birch Large saplings 893 3,274 0 0 0 211 21,315
All live trees 369 643 0 20 140 300 3,045
Seedlings 1,056 1,588 0 0 200 1,634 5,521
Small saplings 27 80 0 0 0 0 441
rowan
Large saplings 29 185 0 0 0 0 1,320
All trees 14 38 0 0 0 0 203
Seedlings 135 828 0 0 0 0 5,887
Small saplings 2 14 0 0 0 0 102
holly
Large saplings 0.4 2.8 0 0 0 0 20
All live trees 2 7 0 0 0 0 40
Seedlings 2 12 0 0 0 0 80
Small saplings 6 39 0 0 0 0 281
alder
Large saplings 5 29 0 0 0 0 201
All live trees 11 47 0 0 0 0 281
Seedlings 51 166 0 0 0 0 1,015
hazel Small saplings 0.8 3.9 0 0 0 0 20
All live trees 9 23 0 0 0 0 100
Small saplings 2 14 0 0 0 0 100
grey
Large saplings 5 31 0 0 0 0 221
willow
All live trees 4 28 0 0 0 0 203
Seedlings 12 60 0 0 0 0 406
ash Small saplings 0.8 4 0 0 0 0 20
All live trees 14 72 0 0 0 0 508
wych elm All live trees 2 9 0 0 0 0 60
Scots pine All live trees 13 41 0 0 0 0 203
Sitka Seedlings 3 15 0 0 0 0 102
spruce All live trees 3 22 0 0 0 0 160
Seedlings 0.4 2.8 0 0 0 0 20
larch
All live trees 7 45 0 0 0 0 321
fir Seedlings 0.4 2.8 0 0 0 0 60
20You can also read