Sacramento Council of Governments Yolo County Transit District
←
→
Page content transcription
If your browser does not render page correctly, please read the page content below
Sacramento Council of Governments
Yolo County Transit District
Long-Range Transit Plan:
FY 2009-10 to FY 2018-19

                                   Presented by:

                               5840 Red Bug Lake Road
                                              Suite 165
                              Winter Springs, FL 32708
                                Phone: (407) 977-4500
                                  Fax: (407) 977-7333
                                   tranrc@earthlink.net
           Final Report    2036 Nevada City Hwy, #200

           October 2009           Grass Valley, CA 95945
                                  Phone: (530) 271-0177
                                    Fax: (530) 271-0626
                            cliffchambers@earthlink.net!

NSIT RESOURCE CENTE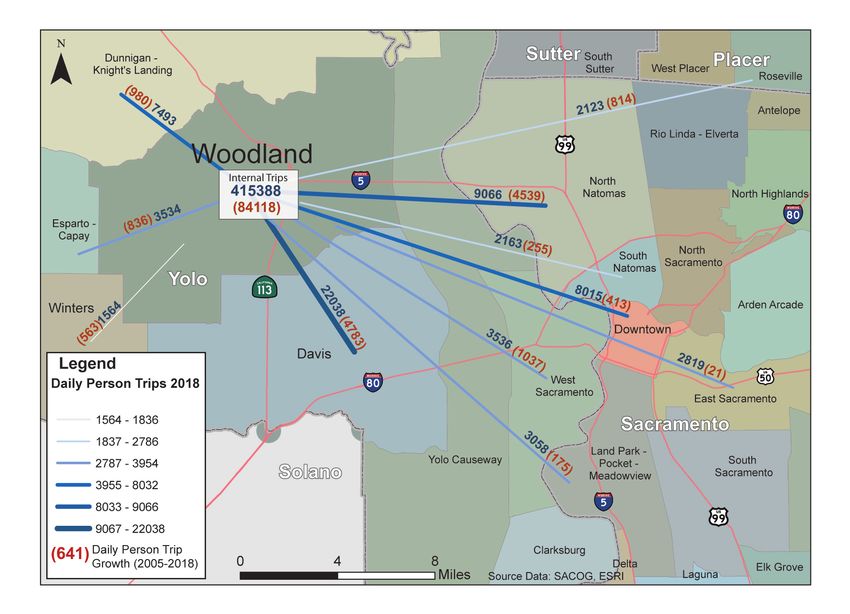
TABLE OF CONTENTS

Executive Summary ........................................................................................... ES-1
Chapter 1: Introduction.....................................................................................    1-1
     Long Range Transit Plan Objective...........................................................               1-1
     Historic Perspective...................................................................................    1-1
     Report Organization ..................................................................................     1-3
Chapter 2: Transit Needs.................................................................................. 2-1
     Community Trends .................................................................................... 2-1
     Population and Employment Trends ......................................................... 2-2
     Yolobus Ridership Trends ......................................................................... 2-8
     Changes in Senior and Disabled Demographics....................................... 2-12
     Annual Unmet Transit Needs Hearings ..................................................... 2-14
Chapter 3: Transit Service and Plan................................................................ 3-1
     Service Improvement by Year ................................................................... 3-7
     Summary by Community ........................................................................... 3-9
     Currently Planned Capital Improvements.................................................. 3-12
Chapter 4: Financial Plan ................................................................................. 4-1
     Introduction and Assumptions ................................................................... 4-1
     Operating Costs......................................................................................... 4-2
     Operating and Capital Revenues .............................................................. 4-8
     Capital Expenditures ................................................................................. 4-10
     Financial Plan Summary............................................................................ 4-16

List of Figures
         2-1. SACOG Population and Employment Projections.............................                          2-2
         2-2. Yolo County Population Growth: 2005-2018 by TAZ ........................                          2-3
         2-3. Yolo County Employment Change: 2005-2018 by TAZ ....................                              2-4
         2-4. Daily Person Trips Growth from Davis: 2005-18 ...............................                     2-5
         2-5. Daily Person Trips Growth within West Sacramento: 2005-18 .........                               2-7
         2-6. Daily Person Trips Growth from Woodland: 2005-18........................                          2-8
         2-7. SACOG Projection of Transit Trips ...................................................             2-9
         2-8. Yolobus Ridership Trends .................................................................       2-10
         2-9. Yolobus Fixed Routes and Ridership ................................................              2-11
         2-10 Department of Finance Projections by Age for Yolo County .............                           2-14
         3-1. Yolobus Revenue Hours: 2009-10 ....................................................               3-1
         3-2. Route 42 Intercity Service Map .......................................................            3-3
         3-3. West Sacramento Route Map ...........................................................             3-4
         3-4. Woodland Route Map........................................................................        3-5
         3-5. Davis Express Route Map.................................................................          3-6
         3-6. Summary of Incremental Fixed Route Revenue Hours and Buses...                                    3-10
         3-7. Future Route Network for West Sacramento ....................................                    3-11
         4-1A Yolobus Changes in Service Supply: FY 2009/10 - FY 2013/14 .....                                  4-4
         4-1B Yolobus Changes in Service Supply: FY 2014/15 – FY 2018/19...                                     4-5
         4-2A Projected Operating Revenue and Operating Costs:
               FY 2009/10 – FY 2013/14 ..............................................................           4-6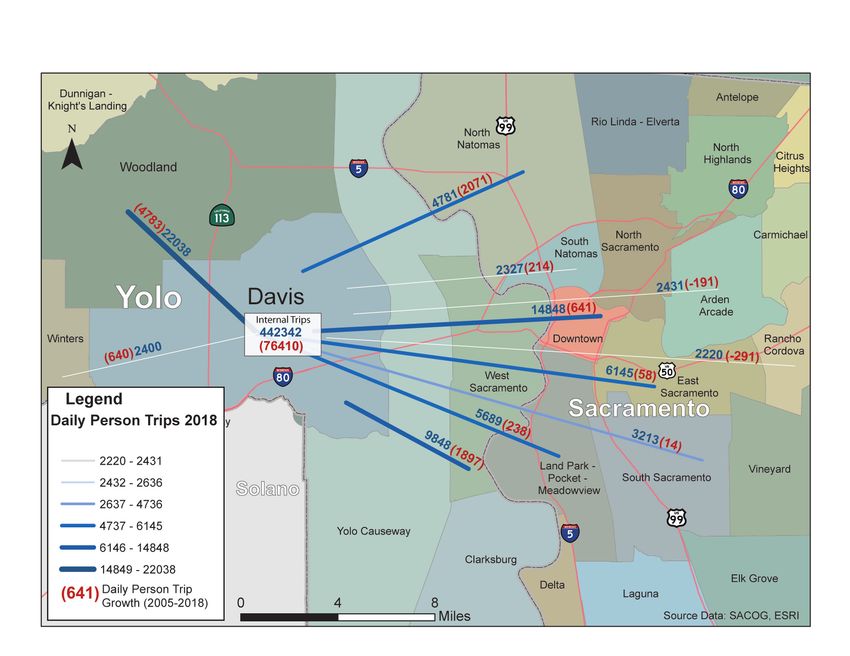
4-2B Projected Operating Revenue and Operating Cost:
      FY 2014/15 – FY 2018/2019 ........................................................... 4-7
4-3. Yolobus Fares ................................................................................... 4-8
4-4. Yolobus Fleet Plan ............................................................................ 4-11
4-5A Capital Expenses and Revenue: FY 2009/10 - FY 2013/14 ........... 4-14
4-5B Capital Expenses and Revenue L FY 2014/15 – FY 2018/19 ........ 4-15
Yolo County Transit District                                           Executive Summary
Long-Range Transit Plan                                                 Final October 2009

Executive Summary

Long Range Transit Plan Objectives
A Short-Range Transit Plan for YCTD was completed in August 2006 with five year
forecasts that anticipated considerable improvements in transit service. In March 2008,
Sacramento Area Council of Governments (SACOG) adopted the Metropolitan
Transportation Plan (MTP) 2035. As succinctly summarized in the MTP:

        “The Metropolitan Transportation Plan 2035 links land use and transportation
        planning with $42 billion in transportation investments in the six county
        Sacramento Region over the next 28 years.”

The MTP provides a framework for significant increases in travel by transit. Region
wide, total transit trips are expected to increase from 101,000 per day in 2005 to
326,000 per day in 2035. Annual growth in transit trips over the planning period is 4%
per year, more than twice the rate of population change. The primary objective of the
Long-Range Transit Plan is to update the Short-Range Transit Plan, providing a ten-
year plan to FY 2018-19, the mid-point of the Metropolitan Transportation Plan 2035.
The Long-Range Transit Plan is meant to expand the planning horizon to FY 2018-19
by:

! Updating the Short Range Transit Plan by expanding the planning horizon from
  FY 2012-13 to FY 2018-19.

! Documenting transit needs by incorporating SACOG 2018 model results.

! Providing service plan and fare recommendations.

! Planning for facility development.

! Establishing a detailed operating and capital financial plan.

Services Provided
The Yolo County Transportation District administers Yolobus, which operates local and
intercity bus service 365 days a year in Yolo County and neighboring areas. Yolobus
consists of 22 fixed routes and provides local, intercity, express/commute and rural
service throughout Yolo County. Outside of Yolo County, Yolobus provides service to
downtown Sacramento, the Sacramento International Airport and Vacaville. Local
service is provided in Woodland and West Sacramento, and is supported by the intercity
Route 42 which provides an hourly loop between Davis, Woodland, West Sacramento,
and downtown Sacramento. It operates in both directions and provides the only public

Transit Resource Center                                                                ES-1
Yolo County Transit District                                              Executive Summary
Long-Range Transit Plan                                                    Final October 2009

bus service to Sacramento International Airport, serving it from both Sacramento and
Woodland. Time transfers to Woodland local service are available at the County Fair
Mall. Express service operates on the freeway between cities during commute periods
with a premium fare, and commute service also operates only during peak periods, but
links closer communities, usually without operating on the freeways.

Yolobus makes connections with other local public transportation systems, including
Unitrans and Fairfield-Suisun Transit in Davis, Vacaville City Coach in Vacaville, as well
as Capitol Corridor trains to Fairfield and the Bay Area, and Regional Transit and Light
Rail in Sacramento. It is possible to make direct connections to other regional operators
that serve downtown Sacramento, such as Yuba-Sutter or El Dorado Transit.

Most of the 48 fixed-route buses use CNG, which is considered one of the lowest
emission buses available in the transit industry. YCTD has ordered several 45-foot
intercity coaches with 57 seats, and these are not available with CNG.

In addition to fixed route service, YCTD is responsible for ADA complementary
paratransit services in Yolo County, which were consolidated in January 1997. The two
main providers are the Yolobus Special paratransit service provided by YCTD and
Davis Community Transit (DCT).

YCTD is responsible for general administration, service and policy planning, contract
oversight, service monitoring and evaluation, preparation of annual operating and
capital budgets, provision of the fixed route and paratransit fleet, and service marketing.
The contract operator is responsible for the hiring, training and supervision of all
operations, maintenance, and road supervisory staff, the operation, fueling, and
maintenance of service vehicles, the booking and dispatching of all Yolobus Special
(Paratransit) trip requests, client registration, and the preparation of management
reports.

During FY 2009-10, YCTD will operate 122,895 vehicle revenue hours of service,
including 106,654 hours of Yolobus service and 16,241 hours of Paratransit.

Market Penetration
Transit ridership has grown rapidly on the local fixed route service. The 1.81 million
riders in FY 2008-09 represented a 22% increase over the previous year. Annual
Paratransit ridership is modest at approximately 18,200 trips, an increase of 1,600 from
the previous year. Total annual transit trips per capita increased from 6.8 to 9.1 during
the past five years. When Davis Unitrans ridership is added (Davis undergraduate
students ride Unitrans for free – supporting the system with their registration fees),
YCTD and Unitrans together account for approximately 24 annual trips per capita for the
County population.

Transit Resource Center                                                                 ES-2
Yolo County Transit District                                           Executive Summary
Long-Range Transit Plan                                                 Final October 2009

Population and Employment Growth
Yolo County, which has four cities and a large unincorporated primarily agricultural
area, had a population of 168,000 according to the 2000 Census, which represented a
growth of 19% compared to 1990. The 2009 population is estimated at approximately
200,000 persons according to the California Department of Finance, of whom 65,000
live in Davis, 54,000 reside in Woodland, and 47,000 live in West Sacramento. Winters,
the fourth city, has about 7,000 residents.

While West Sacramento is adjacent to and across the river from the City of Sacramento,
the other cities are geographically separate and distinct, surrounded by agricultural
land. In terms of transportation access, Davis and West Sacramento are connected to
the region via I-80 while I-5 connects Woodland to the Sacramento Metropolitan Airport
and the City of Sacramento. Route 113 links Davis and Woodland.

Median income in the County was below the regional average, particularly in West
Sacramento, which had a median household income of $31,700 in 1990 compared to
the County average of $40,770 and the Sacramento County average of $43,816. The
West Sacramento proportion of families below the poverty level, at 17%, was almost
double the County proportion of 9%. YCTD ridership reflects both the significant low
income and large student populations, two demographic groups that have higher transit
ridership patterns than the general population.

SACOG projections show Yolo County growing 27% from 2005 to 2018, although the
County is approaching the 2013 forecast of 204,132 people in 2009. West Sacramento
is expected to grow the most rapidly, 50% between 2005 and 2018, compared to 24%
for Woodland and 14% for Davis.

According to SACOG projections, the greatest growth in person trips will be internal
trips within Davis, Woodland, and West Sacramento. Beyond that the largest increase
in travel will be between West Sacramento and downtown Sacramento, North Natomas,
and other nearby Sacramento districts.

Yolobus Plan Recommendations
The key recommendations of this 10-year transit plan include development of new
commute routes serving developing areas of West Sacramento, expanded service to
the Cache Creek Casino, reducing headways to 30 minutes on the Route 42 Intercity
service, and additional commute trips linking downtown Sacramento with each of the
communities. One new local route is also proposed for a developing area on the fringe
of Woodland. An additional 500 hours of Paratransit service are proposed for each year
of the planning period, boosting the current 16,241 annual hours of service to 20,741 by
FY 2018-19.

Transit Resource Center                                                              ES-3
Yolo County Transit District                                              Executive Summary
Long-Range Transit Plan                                                    Final October 2009

The financial analysis indicates that implementing all of these enhancements in the year
indicated would only be feasible with a new source of revenue or high rate of growth in
sales tax. These include the following fixed route changes by year:

FY 2010-11              14 new trips on the Route 215 Cache Creek service from
                        Woodland, adding 6,000 additional revenue hours. The subsidy for
                        this would be contributed by the tribe.

FY 2014-15              Three new routes are programmed between the expanding
                        Southport neighborhood of West Sacramento and downtown
                        Sacramento. Subsidy for the additional 4,950 annual hours should
                        be provided by developer contributions.

FY 2015-16              Doubling the frequency on the West Sacramento new routes
                        created in the previous year, and additional commute service from
                        Woodland and Davis, adding approximately 9,800 hours of service.

FY 2016-17              The largest programmed increase is 8,000 additional hours on
                        intercity Route 42, expanding the span of service hours. Other
                        increases include the new Woodland local route for approximately
                        3,000 annual hours, and smaller increments of Davis and West
                        Sacramento commute services.

FY 2017-18              Another 8,000 hours would start reducing headways on Route 42;
                        other increases include Davis and West Sacramento commute
                        service and additional trips on the Route 220 service which links
                        Vacaville, Winters, and Davis.

FY 2018-19              A final increment of 19,000 annual hours would be added to Route
                        42, bringing headways to 30 minutes. A new local route in West
                        Sacramento would add 10,400 more hours, and the number of
                        Davis commute trips would continue to expand.

Figure ES-1 summarizes the additional revenue hours and vehicles required to
implement the Long-Range Transit Plan for fixed route service. In addition, 4,500
annual hours and three additional Paratransit vehicles are planned to provide
enhancements for the Paratransit service.

Transit Resource Center                                                                 ES-4
Yolo County Transit District Executive Summary
Long-Range Transit Plan Final October 2009
Figure ES-1.
Summary of Incremental Fixed Route Revenue Hours and Buses
Additional Revenue Additional Vehicles
Hours
West Sacramento 22,428 10
Woodland 5,404 4
Davis 8,500 9
Yolo County 42,000 6
Total 78,332 29
Financial Planning Considerations
The financial plan provides the details on costs and revenues from FY 2009-10 to
FY 2018-19 based both on present revenue projections and on the recommendations
described above. Assumptions on cost inflation per hour and other expenditures are
based on past experience and anticipated future trends. Likewise, on the revenue side,
forecasts will be generated starting from the MTP financial projections updated with new
information since the adoption of the MTP 2035. Adjustments to fares are based on
financial needs and in order to achieve farebox recovery objectives.
The capital plan is based on fleet replacement and expansion needs as well as facility
improvements and other capital projects such as park-and-ride lots.
The number of revenue vehicle hours is the primary variable that determines operating
cost. The analysis details the forecasts of revenue hours, broken down by type of
service and geographic location as described in chapter three.
The hourly cost of operations and maintenance, as well as any staffing costs, are
subject to inflation, generally assumed to be 2.5-3% annually unless higher by
contractual arrangement or specifics of the particular operation. The operating cost
projections are based on applying the anticipated number of revenue hours by the
hourly service cost projection. The bus operating cost of approximately $101 per hour
for Yolobus buses and $75 per hour for Paratransit shown in the figure for FY 2009-10
was calculated by dividing total operating costs by revenue hours, so these figures
include all overhead, administrative, and fuel costs. This is a fully- loaded operating
cost including fuel, insurance, and administration as well as operations and
maintenance. This is a very reasonable cost per hour, particularly considering the use
of CNG vehicles for the Yolobus service.
Transit Resource Center ES-5Yolo County Transit District Executive Summary Long-Range Transit Plan Final October 2009 The operating plan shows a significant shortfall of operating funds with the desired service expansions. As cited previously, full implementation will require either an expansion of existing funding sources or a new source of funding. The last three years of the plan show an operating deficit of $880,000, $2.29 million, and $5.6 million respectively. The total 10-year shortfall would be approximately $9.4 million, so almost 60% in the final year of the plan as a result of reducing headways to 30 minutes for several key routes. The capital needs of the District appear to be fundable with existing and programmed sources. The basic adult fare for Yolobus is $2.00, with an additional $1 for express commuter service. The senior and student fare is $1.00 and a student monthly pass is available for $42.50. Fares were increased approximately 25-30% in April 2009. The DAR fare for seniors and disabled is $3 to $5 depending on distance. Fare increases are included in FY 2012-13 and FY 2017-18 to help balance the budget. These would be on the order of $0.25 for adult cash with proportional increases in other fares YCTD does not use all Local Transportation Fund (LTF) funds generated in Yolo County. The plan would increase use of LTF funds from approximately $5.5 million in FY 2008-09 to $8.1 million by FY 2018-19, which represents about 2/3 of the $12.6 million projected LTF revenue in FY 2018-19. Davis uses a portion of its funds to support Unitrans and bikeway maintenance, and Woodland and Yolo County use a portion of their funds for non-transit projects. Transit Resource Center ES-6
Yolo County Transit District                                                    Introduction
Long-Range Transit Plan                                                  Final October 2009

CHAPTER 1: Introduction
This chapter describes the objectives of the Long-Range Transit Plan (LRTP). It then
provides a historical perspective of the development of transit service by the Yolo
County Transit District (YCTD).

Long Range Transit Plan Objectives
A Short-Range Transit Plan for YCTD was completed in August 2006 with five year
forecasts that anticipated considerable improvements in transit service. Some of the
improvements have been implemented but some have been delayed because new
development has slowed somewhat. In March 2008, Sacramento Area Council of
Governments (SACOG) adopted the Metropolitan Transportation Plan (MTP) 2035. As
succinctly summarized in the MTP:

        “The Metropolitan Transportation Plan 2035 links land use and transportation
        planning, with $42 billion in transportation investments in the six county
        Sacramento Region over the next 28 years.”

The MTP provides a framework for significant increases in travel by transit. Region
wide, total transit trips are expected to increase from 101,000 per day in 2005 to
326,000 per day in 2035. Annual growth in transit trips over the planning period is 4%
per year, more than twice the rate of population change. The primary objective of the
Long-Range Transit Plan is to update the Short-Range Transit Plan, providing a ten-
year plan to FY 2018-19, the mid-point of the Metropolitan Transportation Plan 2035.
The Long-Range Transit Plan is meant to expand the planning horizon to
FY 2018-19 by:

! Updating the Short Range Transit Plan by expanding the planning horizon from
  FY 2012-13 to FY 2018-19.

! Documenting transit needs by incorporating SACOG 2018 model results.

! Providing service plan and fare recommendations.

! Planning for facility development.

! Establishing a detailed operating and capital financial plan.

Historic Perspective
Yolo County is one of the counties that make up the Sacramento Metropolitan Area,
which stretches from the central valley to the foothills of the Sierra Mountains. Yolo

Transit Resource Center                                                                  1-1
Yolo County Transit District Introduction
Long-Range Transit Plan Final October 2009
County, which has four cities and a large unincorporated, primarily agricultural area,
has, according to the California Department of Finance, a 2009 population of
approximately 200,000 persons of whom 65,000 live in Davis, 54,000 reside in
Woodland, and 47,000 live in West Sacramento. Winters, the fourth city, has about
7,000 residents.
While West Sacramento is adjacent to and across the river from the City of Sacramento,
the other cities are geographically separate and distinct, surrounded by agricultural
land. In terms of transportation access, Davis and West Sacramento are connected to
the region via I-80 while I-5 connects Woodland to the Sacramento International Airport
and the City of Sacramento. Route 113 links Davis and Woodland. Amtrak and the
Capitol Corridor trains make a stop in Davis on their route between Sacramento and the
San Francisco Bay Area.
The Yolo County Transportation District (YCTD) was created in 1997 to replace an
earlier Transit Authority. The duties of the agency were expanded as described below:
1
! To provide public transit services in Yolo County, both fixed route and paratransit;
! Serve as the Consolidated Transportation Services Agency (CTSA) for the County;
! To act as the Congestion Management Agency for Yolo County;
! Serve as the agency responsible for countywide coordination of transportation
system planning, programming and prioritization of significant projects; and
! Serve as the coordinating agency for all state and federal funding applications,
where appropriate.
The agency budget primarily reflects the transit operating and capital function, although
major transportation planning activities, such as technical and environmental studies for
a potential West Sacramento streetcar, also can affect the budget. The seven person
YCTD Board consists of representatives of the four cities, Yolo County, and the
University of California at Davis and Caltrans, which have ex-officio Board membership.
The Yolo County Transportation District administers Yolobus Special (Paratransit) an
ADA paratransit service which operates local and intercity bus service 365 days a year
in Yolo County and neighboring areas. Paratransit serves Davis, West Sacramento,
Winters, Woodland, downtown Sacramento, Sacramento International Airport, Cache
Creek Casino, Esparto, Madison and Knights Landing. Local bus service within Davis is
1
Source: Yolo County Transportation District, Short-range Transit Plan, August 2006
Transit Resource Center 1-2Yolo County Transit District Introduction Long-Range Transit Plan Final October 2009 primarily operated by the University-operated Unitrans system; Paratransit service within Davis is provided by Davis Community Transit; and YCTD provides the intercity and commute service connecting Davis with Woodland, Sacramento, West Sacramento, and Winters. Yolobus makes connections with other local public transportation systems, including Unitrans and Fairfield-Suisun Transit in Davis, Vacaville City Coach in Vacaville, as well as Capitol Corridor trains to Fairfield and the Bay Area, and Regional Transit and Light Rail in Sacramento. It is possible to make direct connections to other regional operators that serve downtown Sacramento, such as Yuba-Sutter or El Dorado Transit. In 1993, the YCTD was among the first transit agencies in California to use compressed natural gas bus technology, and now most of the 48 fixed-route buses use CNG, which is considered one of the lowest emission buses available in the transit industry. YCTD has ordered several 45-foot intercity coaches with 57 seats, and these are not available with CNG. In addition to fixed route service, YCTD is responsible for ADA complementary paratransit services in Yolo County, which were consolidated in January 1997. The two main providers are Yolobus Special, the paratransit service provided by YCTD and Davis Community Transit (DCT). YCTD provides local ADA paratransit services in Woodland and West Sacramento, inter-city ADA paratransit services between specific Yolo County communities, and rural ADA route deviation services. The Yolobus Special service is provided for persons who are unable to use Yolobus Special or Unitrans wheelchair accessible fixed route service because of a “functional” disability. Applicants are screened based on mobility aid use, and questions pertaining to difficulties getting to and from a bus stop, understanding instructions, waiting at a bus stop, and cognitive capabilities. Professional verification of the applicant’s condition is required. Herein after the ADA paratransit service will be referred to as Paratransit. YCTD is responsible for general administration, service and policy planning, contract oversight, service monitoring and evaluation, preparation of annual operating and capital budgets, provision of the Yolobus and Paratransit fleet, and service marketing. The contract operator is responsible for the hiring, training and supervision of all operations, maintenance, and road supervisory staff, the operation, fueling, and maintenance of service vehicles, the booking and dispatching of all Paratransit trip requests, client registration, and the preparation of management reports. Report Organization Chapter 2 provides an overview of transit needs between 2005 and 2018 in the Yolo County Transit District service area. Forecasts on population and employment increases between 2005 and 2018 provided by SACOG are presented. Origin and destination model data provided by SACOG are mapped to better understand potential growth in transit demand by FY 2018-19. Demographic projections from the SACOG Senior and Disabled Mobility Study are highlighted. Transit Resource Center 1-3
Yolo County Transit District                                                   Introduction
Long-Range Transit Plan                                                 Final October 2009

Chapter 3 is the service plan. Service plan recommendations are provided for the local
routes and paratransit services.

Chapter 4 is a detailed financial plan. A discussion is provided of existing and future
revenue sources. The FY 2008-09 budget and budgeted FY 2009-10 figures are used
as a starting point. Operating cost projections between FY 2009-10 and FY 2018-19
are provided. A capital plan between FY 2009-10 and FY 2018-19 for new buses and
park-and-ride facilities is also provided. The required revenues for both operating and
capital are included.

Transit Resource Center                                                                1-4
Yolo County Transit District                                                Transit Needs
Long-Range Transit Plan                                                Final October 2009

CHAPTER 2: Transit Needs
This chapter presents population and employment trends in Yolo County, transit
ridership trends in the County, and anticipated growth in transit demand based on
SACOG modeling and demographic trends.

Community Trends
Yolo County, which has four cities and a large unincorporated primarily agricultural
area, had a population of 168,000 according to the 2000 Census, which represented a
growth of 19% compared to 1990. The 2009 population is estimated at approximately
200,000 persons according to the California Department of Finance, of whom 65,000
live in Davis, 54,000 reside in Woodland, and 47,000 live in West Sacramento. Winters,
the fourth city, has about 7,000 residents.

While West Sacramento is adjacent to and across the river from the City of Sacramento,
the other cities are geographically separate and distinct, surrounded by agricultural
land. In terms of transportation access, Davis and West Sacramento are connected to
the region via I-80 while I-5 connects Woodland to the Sacramento Metropolitan Airport
and the City of Sacramento. Route 113 links Davis and Woodland. Amtrak and the
Capitol Corridor trains make a stop in Davis on their route between Sacramento and the
San Francisco Bay Area.

The largest employer in the County is the University of California at Davis with about
12,000 employees and 31,000 students, including undergraduate and graduate
programs. UC Davis students represent a substantial percentage of the Yolo County
population although not all live in Davis or the County. The median age in Davis was 25
in 2000, compared to 29.5 for the County. This compared to a median age of almost 34
for Sacramento County and 38 in Placer County which has a significant retiree
population.

Median income in the County was below the regional average, particularly in West
Sacramento, which had a median household income of $31,700 in 1990 compared to
the County average of $40,770 and the Sacramento County average of $43,816. The
West Sacramento proportion of families below the poverty level, at 17%, was almost
double the County proportion of 9%. YCTD ridership reflects both the significant low
income and student populations, two demographic groups that have higher transit
ridership patterns than the general population.

Annual ridership per capita has been increasing for Yolobus. The ridership of 1.81
million trips for 2008-09 represented 9.1 annual rides per capita, compared to 6.8 five
years previously in 2004-05. Since Davis undergraduate students ride Unitrans for free
(they support the system with their registration fees), the three million annual riders

Transit Resource Center                                                              2-1
Yolo County Transit District                                                   Transit Needs
Long-Range Transit Plan                                                   Final October 2009

represents a very high ratio of annual trips per capita within Davis, and adding Unitrans
and Yolobus together would yield approximately 24 annual rides per capita for the
County.

Population and Employment Trends
As shown in Figure 2-1 below, SACOG projections show Yolo County growing 27%
from 2005 to 2018, although the County is approaching the 2013 forecast of 204,132
people in 2009.

              Figure 2-1. SACOG Population and Employment Projections

                                                                Rest of
                                  West                           Yolo         Yolo
    Population                 Sacramento   Woodland   Davis    County       County
            2005                 40,440      50,794    64,330   17,336       172,900
            2013                 57,788      57,464    69,071   19,809       204,132
            2018                 60,825      63,236    73,374   22,597       220,032
     % change 2005-18             50%         24%       14%      31%           27%

    Employment
            2005                 30,736      26,032    28,172   7,598         92,538
            2013                 39,399      28,375    33,748   8,528        110,050
            2018                 42,793      30,858    35,519   9,505        118,675
     % change 2005-18             39%         18%       26%      25%           28%

Transit Resource Center                                                                 2-2
Yolo County Transit District Transit Needs
Long-Range Transit Plan Final October 2009
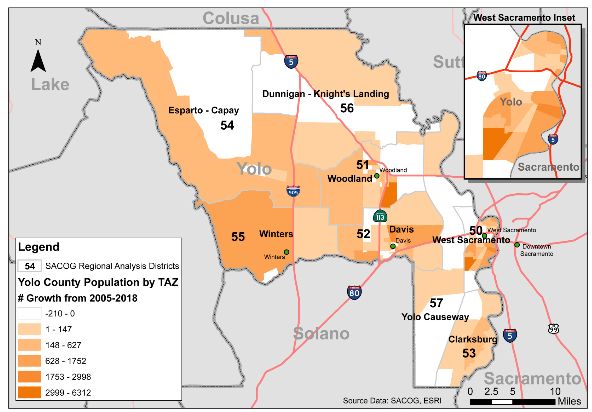
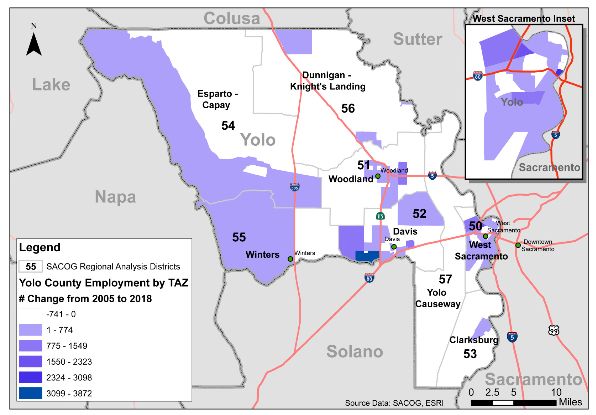
Figures 2-2 and 2-3 show the anticipated growth of population and employment in Yolo
County between 2005 and 2018. Winters, Eastern Woodland, northeast Davis, and
West Sacramento are expected to see the most population growth and presumably
residential development. West Davis and northern and eastern (along the river)
sections of West Sacramento are expected to have the greatest employment growth
during the 13 year time span. While the large Esparto-Capay Valley zone is expecting
both population and employment growth, the employment growth is related to the
expansion of the Cache Creek Casino and does not represent an expansion of jobs
throughout the traffic analysis zone (TAZ).
Figure 2-2. Yolo County Population Growth: 2005 to 2018 by TAZ
Transit Resource Center 2-3Yolo County Transit District Transit Needs
Long-Range Transit Plan Final October 2009
Figure 2-3. Yolo County Employment Change: 2005 to 2018 by TAZ
Transit Resource Center 2-4Yolo County Transit District Transit Needs
Long-Range Transit Plan Final October 2009
Figures 2-4 through 2-6 illustrate the growth in intercity travel between 2005 and 2018
for the three principal cities of Yolo County, and figure 2-7 shows a SACOG projection
of growth of transit trips internally and between communities. In each case, the
numerical increase in travel is greatest for internal trips within the communities.
Figure 2-4 shows project change in travel patterns between Davis and other regional
analysis districts (RAD); analysis zones defined by SACOG. The greatest volume of
travel as well as the largest increase will be between Davis and Woodland with 22,000
daily trips, a growth of almost 5,000 trips a day. The projections also show the volume
of daily trips between Davis and downtown Sacramento growing by 641 trips a day for a
total of 14,848 trips, which is the second largest volume between communities. Travel
between Davis and both North Natomas and West Sacramento is expected to each
grow by approximately 2,000 trips daily.
Figure 2-4. Daily Person Trips Growth from Davis: 2005-2018
Transit Resource Center 2-5Yolo County Transit District Transit Needs
Long-Range Transit Plan Final October 2009
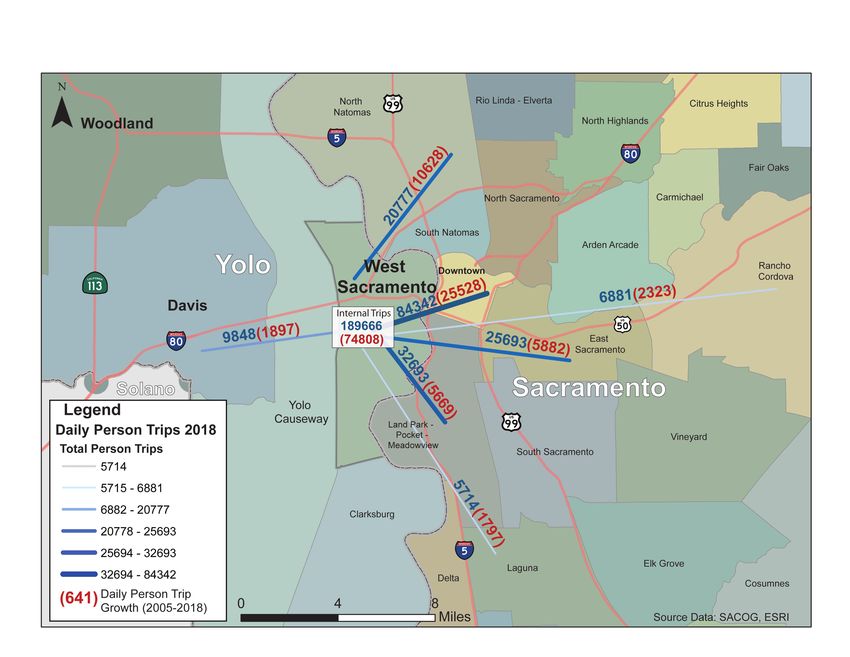
Figure 2-5 shows projected change in travel patterns between West Sacramento and
other RAD’s. Although West Sacramento is in Yolo County, its stronger travel
relationship is with communities in Sacramento County, including 84,342 daily trips to
downtown (a growth of 25,528 daily trips), East Sacramento (25,700 daily trips),
Landpark (32,693), and North Natomas with 20,777 daily trips, a doubling from 2005
volumes.
Figure 2-5. Daily Person Trips Growth from West Sacramento: 2005 to 2018
Transit Resource Center 2-6Yolo County Transit District Transit Needs
Long-Range Transit Plan Final October 2009
Figure 2-6 shows the projected travel patterns between Woodland and other
communities. The largest projected volumes of travel are between Woodland and
Davis, with 22,000 trips, and North Natomas with 9,056 trips, a doubling of 2005 travel.
Although travel to downtown Sacramento is only projected to grow by 413 daily trips,
the volume of 8,000 daily trips is substantial. The 3,536 daily trips between Woodland
and West Sacramento are also substantial, as is the growth of 1,037 trips.
Figure 2-6. Daily Person Trips Growth from Woodland: 2005 to 2018
Transit Resource Center 2-7Yolo County Transit District Transit Needs
Long-Range Transit Plan Final October 2009
Figure 2-7. SACOG Projection of Person Trips
Regional Analysis 2018 Change 2005- % Change
Districts 2018 2005-2018
Between West Sacramento
Internal 189,666 74,808 65%
Downtown Sacramento 84,342 25,528 43%
North Natomas 20,777 10,628 105%
Land Park 32,693 5,669 21%
East Sacramento 25,693 5,882 29%
Davis 9,848 1,897 24%
Between Woodland and
Woodland 415,388 84,118 25%
Downtown Sacramento 8,015 413 5%
North Natomas 9,066 4,539 101%
Davis 22,038 4,782 28%
Between Davis and
Davis * 442,342 76,410 21%
Downtown Sacramento 14,848 641 5%
North Natomas 4,781 2,071 76%
Yolobus Ridership Trends
Yolobus consists of 22 fixed routes and provides local, intercity, express/commute and
rural service throughout Yolo County. Outside of Yolo County, Yolobus provides
service to downtown Sacramento, the Sacramento International Airport and Vacaville.
Local service is provided in Woodland and West Sacramento, and is supported by the
intercity Route 42 which provides an hourly loop between Davis, Woodland, West
Sacramento, and downtown Sacramento. It operates in both directions and provides
the only public bus service to Sacramento International Airport, serving it from both
Sacramento and Woodland. Time transfers to Woodland local service are available at
the County Fair Mall. Express service operates on the freeway between cities during
commute periods with a premium fare, and commute service also operates only during
peak periods, but links closer communities, usually without operating on the freeways.
Figure 2-8 shows ridership trends for Yolobus and Figure 2-9 provides brief route
descriptions along with annual ridership and ridership per hour. As will be noted, the
Intercity Route 42 service accounts for approximately a third of Yolobus ridership, and
Route 215, the intercity route between Woodland and the Cache Creek Casino,
accounts for significant ridership as well. It is unique in that Yolobus receives a
Transit Resource Center 2-8Yolo County Transit District Transit Needs
Long-Range Transit Plan Final October 2009
significant subsidy from the Tribe for both the purchase of buses for the service and
operating assistance.
Route 220 provides local service in Winters, with intercity connections to Vacaville and
Davis. Routes 216 and 217 provide lifeline service between rural communities and the
Woodland County Seat, operating two trips a day twice a week.
Figure 2-8. Yolobus Ridership Trends
FY01-02 FY02-03 FY03-04 FY04-05 FY05-06 FY06-07 FY07-08 FY08-09
Fixed
1,303,657 1,248,883 1,201,697 1,230,312 1,307,400 1,362,732 1,485,782 1,811,716
Route
Paratransit 16,241 14,937 14,417 14,699 12,585 15,028 16,650 18,224
TOTAL 1,319,898 1,263,820 1,216,114 1,245,011 1,319,985 1,377,760 1,502,432 1,829,940
As seen in Figure 2-8, Yolobus ridership has fluctuated somewhat, but has shown solid
increases during the past few years. After Yolobus service generated 1.3 million annual
trips in FY 2001-02, it declined about 8% to 1.2 million trips during the following two-
year recessionary period, before coming back to 1.3 million trips by FY 2005-06. Since
then it gained four percent, nine percent, and had a 22% gain comparing
FY 2008-09 to the previous year. Unlike other recessionary periods, the current one
showed a large patronage increase, presumably related to high gasoline cost during
summer and fall 2008. However, the ridership gains have continued during 2009
despite lower gas prices and rising unemployment.
Because of the large service area, Yolobus does not operate out of one central “transit
center,” but rather has several smaller transfer locations where some routes have timed
connections. Many connections are made via Route 42 at the County Fair Mall in
Woodland, along West Capitol Avenue in West Sacramento, at the Memorial Union in
Davis and at several locations throughout Downtown Sacramento. Connections to
other transit agencies can also be made in Davis (to Unitrans, Fairfield-Suisun Transit
and Amtrak), in downtown Sacramento (to RT and several other providers) and in
Vacaville (to Vacaville City Coach and Fairfield-Suisun Transit).
Transit Resource Center 2-9Yolo County Transit District Transit Needs
Long-Range Transit Plan Final October 2009
Figure 2-9. Yolobus Fixed Routes and Ridership
Annual Ridership
Riders/Hour
Route Description Category Jan 2009 2007-08 2008-09
43 Davis – Sacramento Express 35.7 69,134 89,511
44 South Davis – Sacramento Express 26.6 38,319 42,665
45 Woodland – Sacramento Express 27.9 58,547 70,919
230 W. Davis - Sacramento Express 27.6 36,175 43,091
231 Sacramento - Davis Express 11.0 2,657 3,594
232 Davis - Sacramento Express 27.4 10,513 13,287
39 W. Sac. (Southport) – Commute 17.5 29,269 38,780
Sacramento
241 W. Sacramento – Sacramento Commute 20.4 13,107 15,358
242 Woodland – Davis Commute 34.9 7,823 12,584
42 Intercity Loop Intercity 21.7 551,207 649,885
215 Woodland – Cache Creek Intercity 22.5 237,864 292,734
Casino
220 Vacaville – Winters – Davis Intercity 9.6 15,534 20,677
35 West Sacramento (Southport) Local 8.0 29,134 42,396
40 West Sacramento Loop Local 15.8 68,834 88,955
41 West Sacramento Loop Local 15.8 66,687 78,219
210 West Woodland Loop Local 13.0 90,852 46,852
211 West Woodland Loop Local 16.3 79,942 83,686
212 East Woodland Loop (new 08- Local 12.2 0 54,683
09)
214 East Woodland Loop (new 08- Local 11.8 0 34,832
09)
240 West Sacramento – Sacramento Local 17.6 74,967 83,840
216 Woodland – Knights Landing 2 trips twice a week 1,014 1,302
217 Woodland – Yolo - Dunnigan 2 trips twice a week 797 1,040
340 West Sacramento - Sacramento Commute 273
Total 1,485,044 1,811,716
Transit Resource Center 2-10Yolo County Transit District Transit Needs Long-Range Transit Plan Final October 2009 Comparing the performance and route network in FY 2008-09 to that reported in the August 2006 Short-Range Transit Plan indicates good progress in most respects. The Route 42 Intercity service that links Woodland, Sacramento, West Sacramento and Davis remains the most significant trunk line. Due to an increase in service on other routes, Route 42 has dropped from 43% of total Yolobus patronage in 2004 to 36% by October 2008 during which 61,150 passengers rode the service. Almost 650,000 used the route during FY 2008-09 – an increase of almost 100,000 trips from the previous year. With the development and expansion of the Cache Creek Casino, the 215 route that links it with Woodland has become the second most utilized route, with 292,000 passengers during 2008-09, 16% of total patronage. Several other routes, including Route 43 Davis to Sacramento peak period express route, and two local routes which link West Sacramento to downtown Sacramento (routes 40 and 240) each generate about five percent of the patronage and about 8,000 monthly trips. Like any transit service, there is a great variety in route productivity, with several commute routes showing productivity rates of 34 passengers per hour (routes 43 and 242), and the well utilized 42 and 215 routes which operate every day generating approximately 21-22 passengers per hour. Weekday and Saturday service is much more productive than Sunday, but YCTD operates Sunday service to provide lifeline connections. For example, the route 42 intercity service carries 24 passengers per hour on weekdays, 20 passengers per hour on Saturdays, but only 8 passengers per hour on Sundays. Route 211 local service in Woodland generates 18 passengers per hour on weekdays, 13 per hour on Saturdays, but only six per hour on Sundays. The worst performing route, the 221 Winters local service, generated fewer than one passenger per hour, and was recently eliminated from the route network. Considering future transit demand, the most rapid population growth is anticipated in West Sacramento, in the redevelopment area closest to the river and downtown Sacramento and new development in the Southport area. Figure 2-1 showed the 50% population increase anticipated in West Sacramento between 2005 and 2018. Forecasts of total travel and growth of transit trips indicate significant growth within West Sacramento, across the river to downtown Sacramento, as well as to other Sacramento districts such as Natomas, Land Park, and East Sacramento. While Paratransit is responsible for trips to the downtown area, current plans anticipate the patrons would continue to transfer to Regional Transit for trips to other areas besides downtown. YCTD has evaluated the feasibility of streetcar, linking West Sacramento Transit Center, including West Sacramento City Hall, West Sacramento Los Rios Community College, Yolo County Library and West Sacramento Community Center, and development along Tower Bridge Gateway with downtown Sacramento. The project would be primarily funded through developer contributions and creation of an assessment district. Currently YCTD, City of West Sacramento, City of Sacramento and Sacramento Regional Transit are completing phase 2 of the project which includes Environmental and Preliminary Engineering work. Transit Resource Center 2-11
Yolo County Transit District                                                    Transit Needs
Long-Range Transit Plan                                                    Final October 2009

West Sacramento

YCTD has worked with the City of West Sacramento to require, as part of a
development agreement, that three developments in the Southport area contribute both
capital and operating funds as part of the development approval. However, all three of
the developments are on hold as a result of FEMA’s concerns about the adequate level
of flood protections and the current housing market. When the developments proceed,
YCTD will receive $1.7 million in one-time capital funds and an on-going contribution of
up to $600,000 annually from each development to support operating costs of additional
service.

Paratransit Special Service

The Yolo County Paratransit service is operated by Yolobus, with the exception of trips
within Davis which are operated by Davis Community Transit. YCTD provides ADA
complementary paratransit service within ! of a mile of fixed route service for those
unable to use fixed route service because of a functional disability. Riders need to be
registered and certified as eligible. For the rural areas, including registrants in Winters,
Capay, Dunnigan, Yolo, and Knights Landing, the scheduled buses will divert up to ! of
a mile to accommodate ADA clients.

According to the 2006 SRTP, ridership on the Paratransit service declined 10% over a
five year period ending in 2004, and revenue hours declined by 17% over the same
period. Passenger productivity increased from 1.62 to 1.74 passengers per revenue
hour, but operating cost per passenger increased significantly to a FY 2004-05 subsidy
level of $51.38 per trip. Results since then have been mixed. FY 2008-09 Paratransit
ridership increased to 18,224, an increase of 45% during the past four years. However,
passenger productivity has declined to 1.12 passengers per revenue hour and the
operating cost per passenger was at approximately $70 per trip for FY 2008-09. With
the substantial increase in senior population, increasing demand for Paratransit service
is anticipated.

Changes In Senior And Disabled Demographics
Aging of the population is well documented. In 2005, SACOG completed the regional
Senior and Disabled Mobility Study, which documented the projected increase in the
population aged 65+ for Sacramento and other counties. As the study pointed out:

! Population projections have been developed by the California Department of
  Finance (DoF). DoF projections are from a regional economic model which makes
  assumptions about future levels of migration into each county.

! According to DoF projections, the number of people age 55 or older in the
  Sacramento Region will increase by approximately 580,000, or 153%, between 2000
  and 2030. As shown in Figure 2-10 below, the population of people over 55 and 65

Transit Resource Center                                                                 2-12
Yolo County Transit District                                                   Transit Needs
Long-Range Transit Plan                                                   Final October 2009

    is expected to grow much faster than Yolo County population as a whole. This will
    increase demand for both Yolobus and Paratransit service.

      Figure 2-10. Department of Finance Projections by Age for Yolo County

                  Yolo            2000      2010      2020        2030

                  Total           169,882   222,277   271,040     320,434
                  55+              27,713    41,581    58,936      76,746
                  65+              15,928    19,987    30,952      43,708
                  75+               7,821     8,314    11,030      18,126
                  % 55+              16%       19%         22%       24%
                  % 65+               9%        9%         11%       14%
                  %75+                5%        4%           4%          6%

Local input was received during the study process at Yolo County. Preferred solutions
relevant to transit were mentioned at public meetings and are summarized as follows:

! More emphasis on the needs of elders and persons with disabilities in the
  transportation planning process, including universal design and transit oriented
  development in a way that works for all users.

! Greater public participation.

! Focusing transit funds on more frequent midday, evening, weekend, and
  Neighborhood Ride service, not just commuter services.

! Prioritized bus stop amenities such as shelters and benches, safety mechanisms on
  bus doors to keep them from closing too quickly, low-floor buses, upgrades to
  wheelchair restraints, and real-time transit information technology, safety
  improvements at bus stops and on buses, including improved lighting and visibility at
  stops.

! More “seamless” service with common transfer points for Yolobus and Paratransits
  as well as universal fare cards.

! Better linkages of smaller communities to larger ones.

! For demand-responsive services, smaller vehicle and jitney services, expanded
  demand-responsive and community/volunteer transportation programs.

! More taxis that are regulated, insured, supervised, offer a variety of passenger
  payment options and accessible vehicles, and include discounts/sliding
  scales/subsidies for low-income seniors/persons with disabilities.

Transit Resource Center                                                                2-13
Yolo County Transit District Transit Needs Long-Range Transit Plan Final October 2009 ! More funding for these purposes, as well as looking at distance-based pricing, and priority for rides based on medical need. For Yolobus transit, seniors and members of the disabled community stressed more buses for more service, including nights and weekends and more spaces for wheelchair users, accompanied by enforcement of stop announcements and reserved spaces for seniors and persons with disabilities. Participants also prioritized sensitivity training for all drivers on smooth driving of large buses or paratransit vehicles, and simulations to understand varied impairments. The highest priority for workshop participants was supplemental, subsidized, accessible (ramp-equipped) taxi service, similar to that in San Francisco. The next was for expanded demand-responsive service hours, and greater same-day flexibility for adding riders seeking destinations similar to those with advance reservations. Attendees suggested shuttles to high-demand destinations, and that large medical facilities, such as Kaiser, provide transportation to medical appointments for those needing transportation assistance. Lastly, the group suggested developing a centralized list, managed by a transportation broker or coordinator, of groups or agencies with accessible vehicles which could transport disabled persons during unplanned situations, such as an illness at work or a vehicle break-down. Annual Unmet Transit Needs Hearings Each year SACOG holds unmet transit needs hearings throughout Yolo County including the principal cities and Winters. After reviewing testimony received at the Yolo County hearings in March 2007 and February 2008, the SACOG board found “no unmet transit needs that were reasonable to meet” based on established criteria. Service- related comments in SACOG’s Unmet Needs Hearings Summary included: ! Adding lighting to increase bus stop safety; ! Increasing service on Route 35 in West Sacramento to provide consistent hourly service; ! Increasing service to the Southport area of West Sacramento; and ! Adding 3-bicycle racks to buses since the 2-bicycle racks are sometimes full. YCTD has a program to improve bus stops, has addressed the Route 35 concerns and plans to add service in the Southport area when the level of development and transit demand increases. YCTD has implemented 3-bicycle racks on large Yolobus buses. An additional hearing in October 2008 included requests for expanded midday service in West Sacramento, express service in Woodland from the developing Spring Lake subdivision, and Paratransit service directly to the Amtrak Station in Davis. YCTD is seeking funding in some cases and in others indicates that there is not sufficient development or demand for the requested enhancements at this point. Transit Resource Center 2-14
Yolo County Transit District                                           Transit Service Plan
Long-Range Transit Plan                                                 Final October 2009

CHAPTER 3: Transit Service Plan
There are four elements of transit service for Yolo County residents – commute trips to
jobs in other communities, intercity service between communities, including Sacramento
and Sacramento International Airport, local Yolobus service within the individual cities,
and Paratransit service for seniors and the disabled. As is typical, commute and
intercity service are generally well utilized, and performance on local routes is mixed.
As shown in Figure 3-1, approximately 106,500 annual revenue hours are budgeted for
fixed route service during FY 2009-10. The intercity routes account for almost 50% of
revenue hours, followed by West Sacramento with 25%, Woodland at 19%, and Davis
at 10% - which exclusively represents commute service to Sacramento. The Davis
hours do not include the separate local service provided by Unitrans within Davis.

                     Figure 3-1. Yolobus Revenue Hours: FY 2009-10

                   Fixed Route Area                 Budgeted Hours

                   Yolo County                           49,186

                   West Sacramento                       26,881

                   Woodland                              19,777

                   Davis                                 10,810

                   Total Fixed Route                     106,654

                   Paratransit (Yolobus Special)         16,241

                   Total Revenue Hours                   122,895

The Paratransit service is budgeted for 16,241 revenue hours during FY 2009-10.

As briefly described previously, Route 42, the intercity route that connects Woodland,
Davis, West Sacramento, Sacramento, and Sacramento International Airport with hourly
clockwise and counterclockwise loops is the most important route for YCTD. More than
a half million annual riders use the route, approximately a third of YCTD ridership. The
route makes scheduled transit center stops in Woodland, and interfaces with Unitrans in
Davis at the UC Davis transit center, links to local YCTD routes in West Sacramento,
and links with Sacramento RT and other agencies, including Yuba-Sutter Transit, at
downtown Sacramento stops. When funding is available, YCTD is planning to increase
service on route 42. The first goal is extending the span of service – both on weekdays
and weekends. The next step would be increasing service from hourly trips to trips

Transit Resource Center                                                                3-1
Yolo County Transit District Transit Service Plan Long-Range Transit Plan Final October 2009 every 30 minutes. If funding remains limited, the improvements will be incremental – first during peak ridership times, then the remainder of weekday hours, then weekend hours. Figure 3-2 illustrates route 42. Because the full cycle takes over two hours, each leg of the route turns back in downtown Sacramento, allowing YCTD to operate the hourly service in both directions with five rather than six buses. Route 215, which connects Woodland and the Cache Creek Casino, is well utilized by employees. The Casino is seeking development approval for additional expansion, a project that will increase the labor force by up to an additional 1,000 persons. The geographic span of YCTD, ranging from Vacaville to Sacramento, makes it impossible to graphically illustrate the route structure on a single map. Figures 3-3, 3-4, and 3-5 illustrate the YCTD route networks for West Sacramento, Woodland, and Davis express service respectively. The service to Vacaville, Esparto – Cache Creek, Yolo, Dunnigan, and Knights Landing is not shown on these maps, but can be found at: http://www.yolobus.com/m3.html As shown in Figure 2-1, SACOG projections anticipate West Sacramento to have the highest change in population from 2005 to 2018, 50% compared to 27% countywide, 24% for Woodland, and less for the remaining communities. If this growth occurs, much of it planned for the Southport area of West Sacramento, YCTD will implement both new commute services and additional local service in West Sacramento, connecting the new development with the employment center of downtown Sacramento. With the exception of the new routes in West Sacramento, and possibly splitting the Route 45 Express service from Woodland to Sacramento into two routes serving different parts of Woodland, other YCTD planned service improvements consist of adding trips to existing routes, both commute and local service. The standard local 60 minute headways will be shortened to 30 minutes wherever possible and financially feasible. In general, the transit industry has found that reducing headways on well- used services significantly increases ridership. The following sections lay out anticipated improvements by year. As described further in Chapter 4, this plan will require additional funding to implement. Examples of new sources could include a Yolo County sales tax, a new source related to California S.B. 375 legislation to reduce greenhouse gases or funds resulting from federal cap and trade legislation. Transit Resource Center 3-2
Sacramento Int’l
Airport
Figure 3-2. Route 42 Intercity Service Map Terminal B Terminal A
E. Main & Yolobus-
Matmor YCTD
E. Main
42B 5 42B 42A N
42A
E. Gum
5
Woodland
Matmor
East
T County Fair Mall
Transit Center
Transfers available:
Community
& Senior 42B
210 211
Center Woodland
Local Routes
Route 42A & 42B Map
212 214
Road 25A
Legend
Cache Creek Shuttle
215 Madison, Esparto, Capay
Route 42A & 42B Bus Route 42A
T Transit Centers
Timepoints
Sacramento
Need help planning a trip? Other Bus Stops
Call Yolobus! Merkley & West Capitol
42A Landmarks Transit Center 5
1-800-371-2877 Transfers available:
Light Rail (Sacramento Regional Transit)
?
35 Southport Local
Light Rail Stations West Sacramento Local
40 Counter-Clockwise
42B
West Sacramento Local
This map does not show all bus stops served on the Route 42. 41 Clockwise
¿Necesita ayuda con su viaje? For details on specific stop locations, please contact Yolobus. West Sacramento - Sacramento
240 Shuttle West Capitol
¡Llame a Yolobus! at 5th St.
1-800-371-2877
West Capitol See
113 West Capitol at Harbor
at Enterprise T Downtown
West Capitol Raley Sacramento
Field
Detail Map
West Sacramento
80
F Street Mace Downtown Sacramento Detail
at Covell Covell
at 2nd 42B
Covell To Airport/
Alhambra 42A
Anderson Park & 42B Woodland
Ride Lot
Davis
th
th
th
th
F Stre
th
th
7th
at Hanover
6th
5th
8th
9th
42A
10
11
13
12
15
14
Anderson
H St
J St
et
Mace Amtrak
El Ce
at 8th I St
mon
University Downtown/ & Chiles
te
Mall Russell 5th Central Park Cowell Downtown Sacramento Restriction: Passengers may J St
Old Downtown
NOT travel FROM a bus stop in downtown Sacramento Sacramento Plaza K St
T Amtrak
.
Memorial Union Terminal TO another bus stop in downtown Sacramento via L St
UC Davis Transfers available: Yolobus for a one-way trip. Contact Sacramento Regional 42A State Capitol
Memorial L St.
Unitrans Lines: 42B Capitol
at 13th
Union 220 Winters,
Vacaville
B, E, F, G Transit for local service within downtown Sacramento. To West L St. N St
K, M,P, Q Sacramento/ O St
at 6th
220C Winters
Commute
Route 30:
Dixon, Vacaville,
Davis 3-3
F S FairfieldYou can also read


