Superhomes 2.0 Best Practice Guide for ASHP Retrofi t - LIT
←
→
Page content transcription
If your browser does not render page correctly, please read the page content below
Superhomes 2.0
Best Practice Guide for ASHP Retrofit
Prepared By: Padraic O’Reilly | Michael O’Shea | Seamus Hoyne | Geoff Hunter
Date: 1st March 2019

The IERC acknowledges the support from both the Department of Jobs, Enterprise and Innovation
and the Department of Communications, Climate Action and Environment
2                                                     Superhomes 2.0     |   Best Practice Guide for ASHP Retrofit

    The purpose of the Superhomes
    2.0 (SH2.0) project was to research
    optimisation of real-world residential
    energy retrofit installations that included
    Air Source Heat Pumps (ASHPs).

    The sole responsibility for the content of this publication lies with the authors. It does not
    necessarily reflect the opinion of the International Energy Research Centre or the Tyndall
    National Institute. Neither the International Energy Research Centre or the Tyndall National
    Institute is responsible for any use that may be made of the information contained therein.
Limerick Institute of Technology                                                                   3

Table of Contents
                          Executive Summary  i
                          Nomenclature		ii
                          Abbreviations		iii
                          Table of Contents  iv
                          Table of Figures		 vi
                          Table of Tables		  vii

                  1. Introduction									1

                  2. Heat Pump Selection          						2
                          2.1. Design outside air temperature & ASHP sizing				               2
                    2.2. Frost Build-up & effects of defrosting					                          2
                  		2.2.1. Energy Consumed during defrost				                                 2
                  		          2.2.2. Energy Penalty due to Ice build-up				                   5
                  		          2.2.3. Effect of Defrost operations on Ability
                  		             to achieve target flow temperature				                       5
                          2.3. Over and under-sizing						7
                          2.4. Variable Speed Compressors						9

                  3. Heat Emission System							10
                          3.1. Heat Emission and its effect on Compressor Cycling and COP		   10
                          3.2. Radiator Systems							11
                          3.3. Radiator Connections						11
                          3.4. ASHP and Radiator performance at low heat demand		             13
                          3.5. Matching Heat Pump and Radiator System
                            outputs – HCC Adjustments						                                   15
                          3.6. COP Ratio								16
                          3.7. HCC Adjustment and Zone Stat Satisfaction				                  17
                          3.8. Underfloor Heating vs Radiator Systems				                     19

                  4. Heat Distribution System							22
                          4.1. Zoning
                          4.2. Water flow Rate
                          4.3. Variable Speed Pumps
                          4.4. Hydraulic De-coupling

                  5. Domestic Hot Water (DHW)							28
                  6. Controls									29
                          6.1. Room Temperature Control						30
                          6.2. Heating Compensation Curve					33
                          6.3. Time Control							39
                          6.4. Compressor Control							45
                          6.5. Commissioning							46

                  7. Discussion									47

                  8. Conclusions									49

                  9. References									50

                  10. Appendices								51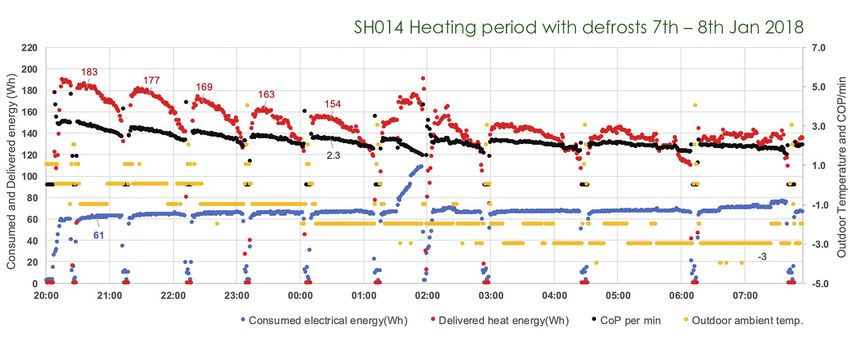
4                                      Superhomes 2.0   |   Best Practice Guide for ASHP Retrofit

Executive Summary

      The guidelines presented in this report refer specifically
      to the 20 homes under investigation in the Superhomes
      2.0 project that may be extended to homes of similar
      construction and heating system layout.

      The key steps in the process of retro fitting a heat pump
      to a domestic dwelling are identified. Analysis of data
      from comprehensive monitoring systems is used to present
      examples of how the completion of these steps in real life
      has affected the performance of the systems.

      Section 2 considers the steps required to determine
      the correct sizing of an ASHP taking into account
      building load, the effect of ice build-up on the evaporator
      and the use of variable speed compressors. As a component
      within a low-temperature heating system, the ASHPs in this
      study were connected to both radiator and underfloor
      heating emission systems. Section 3 deals with the design
      considerations for these emission systems with examples
      from the data showing the effects of installation
      and commissioning set-up on system performance.

      Retrofitted heating systems generally retain some
      or all of the original heating distribution system.
      Section 4 investigates the effect of existing zoning
      and pipework on performance while Section 5 investigates
      how Domestic Hot Water is produced with examples from
      the data and key recommendations. Section 6 discussed
      the main control strategies that were encountered
      in the Superhomes such as room temperature control,
      weather compensation curves and compressor control
      and is followed by the report Discussion and Conclusions.

      Issued by		          Limerick Institute of Technology
      Date:			             1st August 2019
      Version:		Final
      Deliverable number D4.4
      Task number:		       T4.4
      Status:			Final
      Dissemination level: PUBLIC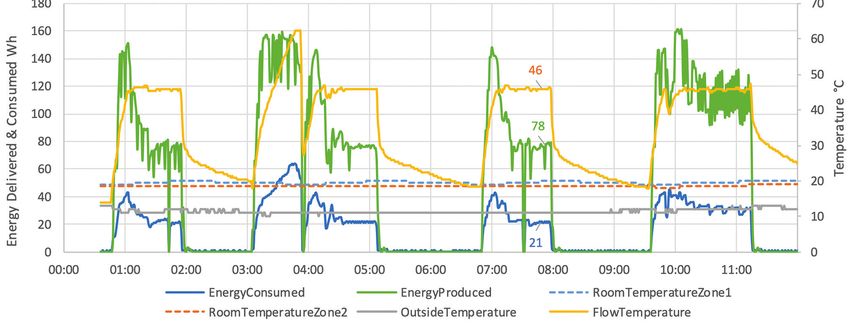
Limerick Institute of Technology                                              5

Nomenclature

                  Symbol 		Description 				Unit

                  Tair		Outdoor air temperature			°C
                  Tdo		  Design outside temperature		       °C
                  Tflow		Flow temperature			°C
                  ∆Tfr		 Flow-return temperature difference °C
                  Tft		Target flow temperature			°C
                  EnPro		Heat Produced				kWhth
                  Tout		Outside air temperature			°C
                  Tret		Return temperature			°C
                  Troom		Room temperature			°C
                  Tsb		  Room temperature setback		         °C
                  ΔTSZ		 Set - zone temperature difference  °C
                  Tsf		Set flow temperature			°C
                  Tsr		Set room temperature			°C
                  ∆T		Temperature difference			°C

Abbreviations

                  A/W		            Outside air temperature/flow temperature
                  ASHP		           Air source heat pumps
                  ASHP Opto        Optimisation module
                  CC		             Compressor cycling
                  COP		            Coefficient of Performance
                  CSD		            Compressor switching delay
                  DHW		            Domestic hot water
                  EnCon		          Energy consumed
                  FFT		            Fixed flow temperature
                  HCC		            Heating compensation curve settings
                  HDD		            Heating degree days
                  HLI		            Heat loss indicator
                  HP		             Heat pump
                  HSFR		           Heating system water flow rate
                  HSWV		           Heating system water volume
                  HSWVmin          Minimum required volume
                  HSWVtot                   Total system volume
                  KPIs		           Key performance indicators
                  LSV		            Lock shield valve
                  RT		             Room temperature
                  SH		             Space heating
                  SH20		           Superhome 2.0
                  SHT		            Space heating time
                  TOU		            Time of Use
                  TRV		            Thermostatic radiator valve
                  TS		             Time schedule
                  UFH		            Underfloor heating
                  Z1		             Zone 1
                  Z2		             Zone 2
                  ZTT		            Zone target temperature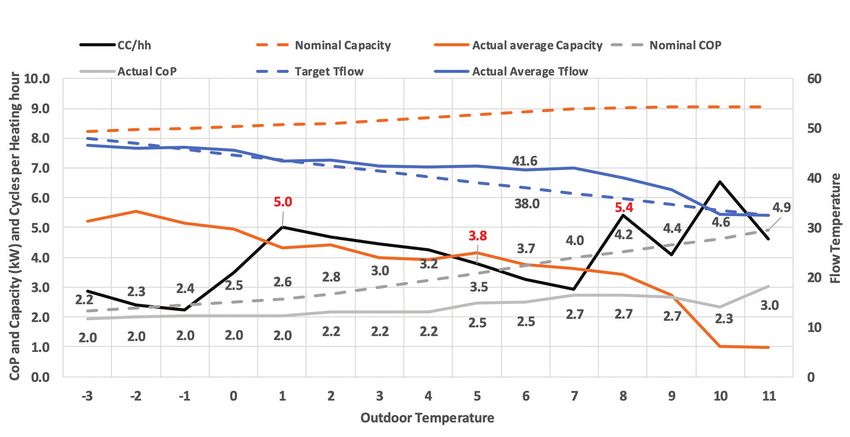
Limerick Institute of Technology 7
Table of Figures
Figure 2.1: Defrost events per Superhome 2017/18 heating season 4
Figure 2.2: Typical defrost cycle 5
Figure 2.3: Defrost operations disrupting heat output and CoP 6
Figure 2.4: Defrost causing failure to achieve target flow temperature 7
Figure 3.1: Variation of radiator heat output with flow rate 11
Figure 3.2: Average flow/return ∆T for SH2.0 systems 12
Figure 3.3: Effect of increasing CC/HH on average ASHP kW output and COP 13
Figure 3.4: SH086 – low HCC 14
Figure 3.5: SH086 – medium HCC 14
Figure 3.6: SH086 – high HCC 15
Figure 3.7: Comparison of COP for Radiator and Underfloor systems 19
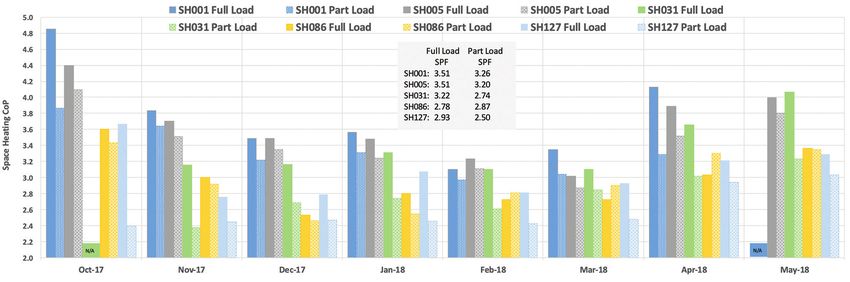
Figure 4.1: Full load vs Part load COP 22
Figure 4.2: (a) SH086 and (b) SH127 Full and Part load 23
Figure 4.3: Buffer vessel in parallel – design by SH2.0 team 26
Figure 5.1: Unique DHW events and total DHW hours (oct-17 to May-18) 27
Figure 6.1: Poorly positioned room sensor – SH086 30
Figure 6.2: Correctly positioned room sensor – SH086 30
Figure 6.3: Time schedule switching off ASHP before target room
temperature achieved 34
Table of Tables
Table 2.1: Defrost event - example of raw data 4
Table 2.2: Effect of undersized heat pump 8
Table 2.3: Daikin catalogue data for 11kW split ASHP 8
Table 3.1: Heat emission system per zone 10
Table 3.2: Mitsubishi W85 minimum heat outputs 13
Table 3.3: COP ratio in shoulder heating month (Oct-17) 16
Table 3.4: COP ratio, core heating month, Jan-18 16
Table 3.5: Example relationship of COP with CC 17
Table 3.6: Range of radiator system output with varying flow temperature 17
Table 3.7: SH127 HCC trial results 18
Table 6.1: Room sensor position comparison – SH086 31
Table 6.2: 10 days pre-post change from Auto Adapt to HCC 32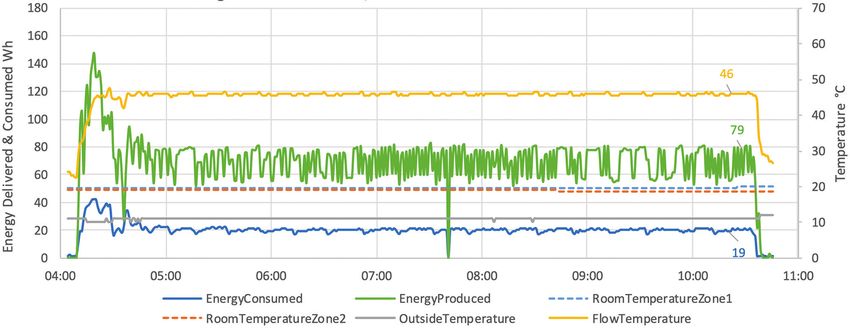
8                                                  Superhomes 2.0     |     Best Practice Guide for ASHP Retrofit

1. Introduction

The purpose of the Superhomes 2.0 (SH2.0) project
was to research optimisation of real-world residential
energy retrofit installations that included
Air Source Heat Pumps (ASHPs).
To this end, the SH2.0 team was         Preliminary research in the            operation on output and COP.
furnished with data, access to          SH2.0 project explored                 During the course of SH2.0, it was
the installations for the purposes      different opportunities for            very evident that the adoption of
of carrying out tests over a two-       optimising ASHP performance.           the ASHP as a “new technology”
year period. Opportunities such         Prominent among these was              was quite daunting for many
as this to assess the energy            the negative affect                    homeowners. For some, there was
                                        of factors such as excessive           a general lack of understanding
performance of systems in real
                                        compressor modulation and              of how the control systems should
world buildings are limited and
                                        compressor cycling (CC).               or could be interacted with in
this is evidenced by the lack of                                               order to optimise performance.
                                        Heat pumps are selected
performance data of ASHPs when          based on heat output                   In many cases, space heating
reviewing the literature. Critically,   and COP, measured in                   operated with no time
the 20 homes that were involved         accordance with EN14511                or temperature setback control,
in the study had extensive              and published by the                   the sole control resting with
monitoring systems in place             manufacturer. These                    the zone thermostats.
that facilitated data collection        performance metrics are
from the buildings and the ASHP.        established when the heat              On the other hand, other homes
In many cases, this data was            pump is operating in a steady          actively employed time schedules,
available at a minute-by-minute         state condition. This report will      in some instances quite effectively,
scale thus allowing for detailed        investigate the effect                 especially where underfloor
analysis of performance factors.        of interruptions to smooth             heating (UFH) was present.

The correct handling of these
key factors will ensure realistic
optimal COP and running cost,
long life for the compressor
and associated electrical
components, and satisfied
homeowners. The aim of this
report is to provide guidance
to designers to help achieve
these goals.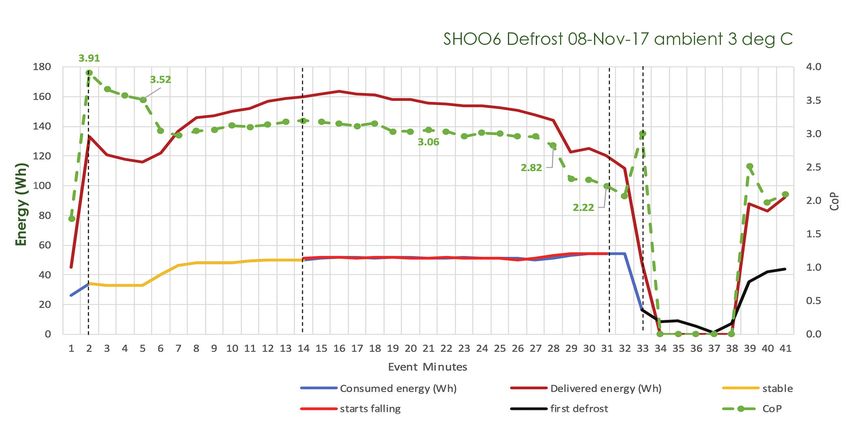
Limerick Institute of Technology                                                                         9

There were however examples where a time            are continuously referred to in the design,
schedule was working well, but if there was a       installation and commissioning stages of the
sudden change in outside temperature, the system    ASHP installation. Budget and other project
was timed to switch off before achieving the        considerations will inform decisions of which
zone thermostat target temperature. This could      type of heat emission system is to be used, but
become problematic for the homeowner if they        once these decisions are made, it is critical that
were not accustomed to regularly interacting        the following key factors are properly managed:
with the schedule. Optimal performance can be       • Correct flow temperature range
achieved when interruptions are minimised. This       for the heat emission system
allows the ASHP to operate as closely as possible   • Appropriate expectations for SPF
to the outputs and efficiencies in manufacturer’s   • Avoidance of excessive
performance charts. In order to achieve this,         compressor modulation
a clear design philosophy is required which sets    • Avoidance of compressor cycling
realistic performance and COP targets for the       • Appropriate time and
system and which ensures that these targets           set-back temperature control
10                                                   Superhomes 2.0   |   Best Practice Guide for ASHP Retrofit

2. Heat Pump Selection

2.1. Design outside air temperature & ASHP sizing

When sizing an ASHP and associated heat distribution and emission system, the first thing
to consider is which design outside air temperature (Tdo) is to be used. This decision should
be taken by the designer in conjunction with the client, taking into consideration issues such
as building thermal mass, control strategy, expected system response time, client’s tolerance
of internal temperature falling short of target, capital and running costs. CISBSE Guide A provides
a method that uses either a 24-hour or a 48-hour mean temperature and then carrying out a risk
analysis of the likelihood of the proposed Tdo being exceeded. The 24-hour mean temperature
would be used for buildings with low thermal mass while the 48-hour temperature is more suitable
for buildings with higher thermal mass. Generally, for the homes in the SH2.0 study, Tdo was in the
range of -2 to -3°C while the construction type in all cases were medium-high thermal mass.

EN12831 sets out a method for calculating the design     a living area, comfort temperature may be 21°C
heat load for a building. A room-by-room heat loss       and setback temperature 19°C. The RHF allows for
calculation should be carried out which will also be     a small additional capacity within the heat pump
used in the design of the heat emission system. This     size to ensure the comfort temperature is achieved
process calculates the building fabric and ventilation   reasonably quickly, especially at lower Tout.
heat losses. In addition, the application of a re-heat   All of the systems in the SH2.0 project are controlled
factor (RHF) is recommended by EN12831. This is an       to prioritise the production of DHW and so the heat
intermittency factor which is based on the thermal       pump is never tasked with simultaneously heating
mass properties of the building, the level of setback    DHW and the Space Heating system. In all cases,
applied and the desired re-heat time. Details can        the output required for space heating exceeds that
be found in Appendix A. For example, when a house        required for DHW and so it is not necessary to add a
is unoccupied, it is good practice to maintain the       DHW factor to the design capacity of the heat pump
room temperature at 1-2°C below comfort level. For       as is suggested in EN12831.

2.2. Frost Build-up & effects of defrosting
At low Tout and high relative humidity (RH), ice starts to build up on the surfaces of the evaporator
during AHSP operation. Eventually this ice causes a reduction in heat transfer from the outside
air to the refrigerant. The ASHP controller will detect this occurrence and initiate a de-frost cycle
whereby the refrigeration circuit is reversed so that hot gas enters the evaporator thus causing
the ice to melt. The process typically lasts 3 – 4 minutes and involves energy consumption
by the compressor as well as a temporary interruption of the ASHP seeking to maintain
the target flow temperature.

The main considerations for the operation of the ASHP system resulting from the defrost process are:
1. The energy required to complete the process with no resultant heat to the house
2. The effect of reducing output on COP as the ice builds up
3. Defrost interruptions prevent the unit from achieving target flow temperatures. In some cases,
  this can lead to insufficient room temperature.
Limerick Institute of Technology                                                                                11

2.2.1. Energy Consumed during defrost
The pattern of the defrost cycle was closely observed for an 8.5kW heat pump, during the SH2.0
study, in an attempt to quantify the energy consumed during a typical defrost event. The data
on a minute-by-minute basis was analysed and relevant flags that identified heating mode
and defrost mode utilised to filter and assess the data. Within the control panel, a signal was
initiated when the controller initiated the defrost cycle. It was noted that for approx. one minute,
the heat pump continued to operate in heating mode that made it difficult to use the data
collected from the controller. As a result the defrost flag was not a reliable means of attributing
energy consumed to the defrost cycle. Had this been done, energy consumed and produced
while in heating mode would have been incorrectly attributed to the defrost cycle.

                                         CONSUMED          DELIVERED
                             MINUTE      ELECTRICAL       HEAT ENERGY    CoP    DEFROST
                                        ENERGY (Wh)           (Wh)

                                1           51               144         2.82      0
                                2           53               123         2.83      0
                                3           54               125         2.31      0
                                4           54               120         2.22      0
                                5           54               112         2.07      2
                                6           16                48         3.00      2
                                7            8                0          0.00      2
                                8            9                0          0.00      2
                                9            5                0          0.00      2
                               10            1                0          0.00      0
                               11            7                0          0.00      0
                               12           35                88         2.51      0
                               13           42                83         1.98      0
                               14           44                92         2.09      0
                               15           44               111         2.52      0
                               16           51               121         2.37      0
                               17           52               127         2.44      0
                               18           52               128         2.46      0

                          Table 2.1: Defrost event - example of raw data

As the defrost cycle continued , approx. 1 minute           events for each of the 19 Mitsubishi ASHPs in the
after the cycle started, the fan switched off and the       study. It should be noted that SH018 was located to
compressor continued to run at a low speed. Some            the South of Cork city and so experiences a slightly
seconds later, the reversing valve was heard to             milder climate that the others which are either in Mid/
operate, thereby diverting hot gas to the evaporator.       North Co. Tipperary or Co. Dublin. Also, SH018 only
This process continued for approx. 2 minutes after          uses the heat pump to cater for a base space heat
which, the defrost signal disappeared and the               load up to 16 or 17°C with wood burning stoves doing
compressor switched off, signifying the end of the          the rest of the work to maintain required comfort
defrost period.                                             levels. Taking the figure of 30Wh/defrost cycle as
                                                            being representative of the energy consumed during
Table 2.1 presents the raw data for a defrost event         a defrost cycle with no associated heat delivered,
for SH006 from the 8th November 2018 when Tout was          then the range for these 18 homes is 31.7 – 55.3kWh
3°C. The controller flags the defrost event in minute       electrical input or an average 1% of overall energy
5 but it is not until minute 7 that it can be said that     consumed within the heating season.
the unit stops delivering heat to the house. Between        In conclusion the data shows that energy
minutes 7 and 11, a total of 30Wh of electrical energy      consumption for defrost cycles should be within the
was consumed without any related heat output.               1% of total energy consumed for a well-designed
From minute 12 onwards, heat is again delivered to          and commissioned system. There will be variations
the house with minute-by-minute COPs that are in            due to external temperatures clearly but this should
keeping with the start-up phase of a heating cycle.         not be excessive on a yearly average basis.
Figure 2.1 presents the overall number of defrost
12 Superhomes 2.0 | Best Practice Guide for ASHP Retrofit
2,000
1,844 1,821
1,748 1,737
1,800
1,600 1,517
1,469
1,421
1,367 1,362
1,400
1,193
1,200 1,094 1,089 1,063
1,000 930 918
830
753
800
633
600
400
200 85
0
6
6
1
1
9
6
9
8
2
3
2
6
3
9
3
7
4
7
5
00
07
00
03
00
01
13
01
20
12
21
08
07
14
10
06
01
12
00
SH
SH
SH
SH
SH
SH
SH
SH
SH
SH
SH
SH
SH
SH
SH
SH
SH
SH
SH
Figure 2.1: Defrost events per Superhome 2017/18 heating season
2.2.2.Energy Penalty due to Ice build-up
Figure 2.2 presents an example of the effect in output is even more severe with the COP
of evaporator ice build-up on the ASHP’s heat dropping from 2.82 to 2.22. At this point, heat
output and consequently on COP for SH006. output drops to zero signifying the beginning
At minute 1, the AHSP commences operating of the defrost period. Analysis of several defrost
in heating mode having come out of a defrost cycles has shown that the average reduction
cycle. The Evaporator is free of ice and so the in COP for the part of the cycle where ice
operation from minutes 1 to 14 can be regarded is forming can be in the region of 12.5%
as normal operation, where the ASHP goes representing an average energy penalty
through a start-up period, adjustment per event in the region of 120Wh/event.
of modulation and then a gradual increase Using SH006 as an example, over the 2018-2019
in heat output to the point where output begins heating season, this penalty represents 6.2%
to level off. From minutes 14 to 31, due to ice of overall electrical energy consumed over
build-up, the COP and heat output gradually the heating season. This loss in performance
fall while the electrical consumption remains would be in addition to the energy consumed
steady at approx. 52 Wh/minute. During this during the defrost process as outlined
period, the COP falls from 3.52 to 2.82. in the previous Section.
Between minutes 31 and 33, the fall
Figure 2.2: Typical defrost cycleLimerick Institute of Technology 13 2.2.3. Effect of Defrost operations on Ability to achieve target flow temperature Figure 2.3 presents a sequence of de-frost operations for a system that periodically falls slightly short of meeting the maximum demand of the house load. As Tout falls over a 12 hour period at night-time from 1˚C to -3˚C the load on the house rises while at the same time the potential heat output of the heat pump falls slightly. The graph shows that heat output and consequently COP, reduce as each heating operation progresses which is a consequence of ice build-up on the evaporator. Thus the heating system is challenged to achieve the internal temperatures required by the homeowner and the overall efficiency of the system is affected. Consideration should therefore be given to slightly over-sizing an ASHP to allow for this performance reduction that results from ice build-up on the evaporator. Factors which might affect this decision are the scale of the deviation of internal temperature from target resulting from this output reduction and the likelihood of occurrence of outdoor temperature ranges. This point is further explored in Section 2.3. Figure 2.3: Defrost operations disrupting heat output and CoP 2.3 Over and under-sizing Selecting a Tdo that is too low can result in a heat pump being oversized, assuming all other inputs to the load calculation are correct. These inputs include building fabric element u-values, building element areas, air tightness level etc. In periods of lower heating demand or in part-load scenarios, despite the presence of a variable speed compressor, the minimum output of the oversized ASHP will be too high compared to the heat load of the house and the heating distribution system output potential, thus resulting in problems such as high CC and reduced COP. If Tdo is too high, the ASHP could be undersized Figure 2.4 compares the achieved flow temperature and so may not maintain the required comfort to the target flow temperature for a system during a levels in the building during cold weather. This will period of frequent defrost evets. Each time Tf drops be further affected by defrost events in cold weather from high to low represents a defrost event. Excluding with high levels of relative humidity as the operation the DHW spike in the middle of the graph, actual flow of the heat pump is interrupted, in some instances temperature is constantly below Tsf . The increase in as frequently as every 45 minutes. Where a heat Tsf after mid night is caused by a drop in Tout . As a pump is sized too closely to the maximum house result the differential between Tsf and Tflow increases. load, it will not have sufficient capacity to quickly The temperature differential can be assumed to be make up the drop in flow temperature. Over time, caused by a combination of the ASHP being slightly this situation could potentially lead to a reduction undersized, the effects of the de-frost interruptions in indoor temperatures until Tout increases and frost and the reduction in output during each heating build-up ceases. cycle due to ice build-up.
14                                                       Superhomes 2.0 | Best Practice Guide for ASHP Retrofit

Figure 2.4: Defrost causing failure to achieve target flow temperature

Table 2.2 presents 2 of the SH2.0 systems in terms         Some heat pump manufacturers publish heating
of maximum ASHP capacity, predicted maximum                capacity tables with both peak and integrated
instantaneous house load as calculated                     outputs are presented, where integrated output
by the Dwelling Energy Assessment Procedure                takes into account the reduction in output
(DEAP) tool and the amount of time whilst                  associated with the defrosting process. In Table 2.3,
in heating mode that internal temperature                  there is a reduction in output for Tout
Limerick Institute of Technology                                                   15

Section 2.1 introduced the concept of the RHF which is intended
to enable the ASHP to re-heat the house from set-back temperature
to comfort level in a reasonable amount of time. The RHF is of similar
magnitude to the defrost allowance demonstrated in Table 2.3
and so there is only a requirement to allow for this factor once
when sizing the ASHP, i.e. heat pump capacity = maximum
instantaneous heat demand + 15 to 20%.

2.2.4. Variable Speed Compressors
All of the ASHPs in the SH2.0 study have variable speed
or modulating compressors. This technology enables
the heat pump to regulate its heat output in response
to varying heat demand from the house. The use of the Heating
Compensation Curve (HCC) method of heat pump control means
that at milder Tout, the target flow temperature (Tft) reduces.
Modulation allows the heat pump’s output to vary in response
to changing house load or due to heating zones switching
on or off. The designer should be conscious of the minimum
output that the heat pump is rated for, and design the heat
distribution system so as to prevent the heat pump from being
connected to a heat load that is less than this minimum output.

Heating distribution and emission system design is critical to the efficient
modulation and operation of the heat pump. While datasheets show that
the COP at the minimum output is higher for the same Air/Water temperatures
than at higher outputs, some instances have been found where extended
periods of constantly modulating operation at low outputs actually yielded
COPs that were well below the expected level.

The pattern of operation for a heat pump with a variable speed compressor
should be as follows:

1. Start up and ramp up output aiming to achieve the target flow temperature

2. As target flow temperature is approached, modulate the compressor
down. The degree to which it modulates back is calculated based on the
difference between flow and return temperatures as well as what happens
to the flow temp after each modulation. If the Tf continues to rise, further
downward modulation is required; if Tf starts to fall, upwards modulation
is required.

3. The system should continue to modulate to maintain a steady Tf until
the internal room temperature (Troom) target is achieved, the level of output
maintained dependent on Tout.

4. If there are problems with heat emission or distribution systems, a different
pattern of modulation could be evident. One example would be where
the output modulates immediately from max to min without any expended
period of operation in the mid output range.
16                                                      Superhomes 2.0 | Best Practice Guide for ASHP Retrofit

3. Heat Emission System

3.1. Heat Emission and its effect on Compressor Cycling and COP
Heat Pump Heating Systems fall under the category of Low Temperature Heating Systems
(BRE, 2013). The primary objectives of designers should be to achieve the client’s desired
comfort level, aim to maximise the system’s SPF while ensuring the heat pump is allowed
to work within certain operating guidelines which prevent the heat pump burning or wearing
out prematurely. This is achieved by operating the system at flow temperatures that are as low
as possible while achieving target comfort levels as well as maximising the time that the system
operates in steady state conditions thus avoiding compressor cycling (CC).

High CC can lead to:
• Reduction in COP and thus an increase in running costs
• Burning out of electrical components
• Reduction in the lifespan of the compressor

CC needs to be taken into account at the design stage. As noted in EN15450, “In order to minimize
cycling, it shall be assured that the heating capacity delivered by the heat pump is completely
transferred to the heating system”. This standard goes on to suggest a target maximum of three
compressor starts per hour.

This can be achieved by ensuring the following:
• that the heat emission system design and target flow temperature (as per HCC) result in a system
 emission capacity (kW) that is as close as possible to the minimum output of the ASHP when Tout
 is in the range 10-15°C.
• that the pipework system linking the heat pump to the emission system is correctly designed
 so as to ensure the correct range of water flow rates can be achieved
• that the heating system is zoned so as to establish a minimum emission system output that
 the heat pump will always be connected to, and that consideration is given to maximising
 the water volume of the system. This point will be dealt with further in Section 4.
Limerick Institute of Technology                                                                              17

A balance must be struck between the competing
objectives of maximising SPF and achieving
adequate system responsiveness. For retrofits                   Zone 1            Zone 2         No. of Houses
with ASHPs, EN15450 sets a target SPF (Space
Heating + DHW) of 2.8 and a minimum SPF of 2.5.
                                                              Radiators          Radiators             12
For new buildings, the target and minimum SPFs
are 3.0 and 2.7 respectively. It should be noted
                                                              Underfloor        Underfloor             3
the SPF figures in EN15450 are for continental
Europe, and so with Ireland’s milder climate,
                                                              Underfloor         Radiators             5
it would be reasonable to expect that higher
target and minimum SPF should apply. However,
there is no guidance document publicly available          Table 3.1: Heat emission system per zone
for Ireland at present as to what these SPFs figures
should be. The breakdown by type of emission
systems within the SH2.0 project is shown in Table 3.1.
Note that a mixture of steel and aluminium radiators
were used depending on the specific design
consideration for each house.

3.2. Radiator Systems
EN442 is the standard which governs the rating of thermal output of radiators. The rated thermal
output is given for the standard operating conditions of 75/65/20, i.e. flow temperature 75°C, return
temperature 65°C and room temperature 20°C. This is presented as ∆T50, the difference, or delta
(∆) between the mean water temperature (MWT) and the room temperature. In addition, EN442
provides guidelines for a standard low temperature output at ∆T30.

For the SH2.0 homes equipped with radiators,              to the catalogue radiator outputs listed at ∆T50.
the design flow temperature was generally                 This correction factor is calculated from F= (∆T/50)n
48°C. If the ∆T across the radiator is 7°C                where n is approximately 1.3 for steel and aluminium
at maximum output, then the radiator MWT                  radiators. Therefore, for the SH2.0 systems,
is 44.5°C for an external design temperature              the correction factor F = (24.5/50)1.3 = 0.396.
of -3°C, which when taken with a target room              If a room requires 1000W, this is corrected by dividing
temperature of 20°C gives a radiator/room                 by the correction factor, 1000/0.396 = 2525W. From
∆T of 24.5°C. When selecting radiators to suit            the ∆T50 outputs in the radiator catalogue, a radiator
the room by room heat loss, as discussed                  with this output is selected. When operated at ∆T24.5,
in Section 2.4, a correction factor is applied            this radiator will emit 1000W.

Designers need to take care to ensure that appropriate
sizing calculations are completed and appropriate selection
of radiators to match the heat load demands. This should
also be balanced with the ability to install the relevant
radiators sizes in the rooms.

3.3. Radiator Connections
When connecting flow and return pipes to radiators, Bottom Bottom Opposite End (BBOE)
connection is the most commonly used configuration in Irish dwellings. As discussed
in Section 3.2, radiators are selected based on the EN442 DT50 catalogue outputs.
These outputs are based on Top Bottom Same End connections (TBSE). The results
of a study carried out by the European radiator manufacturer Rettig is shown in Figure 3.1.
18 Superhomes 2.0 | Best Practice Guide for ASHP Retrofit Figure 3.1: Variation of radiator heat output with flow rate Figure 3.1 presents two issues which should If m/mn is >1, there is a negligible increase in output. be borne in mind by designers of ASHP systems Higher flow rate will cause a reduction in flow/return connected to radiator systems. The first is that ∆T across the radiator and lead to a higher MWT. regardless of flow rate, at best, the thermal However, due to the emissivity characteristics output of a radiator with BOE connections of the radiator, the increase in MWT does not lead will be approx. 9% less than the catalogue, to a significant increase in output once flow rate and so with reference to Section 3.2, the target exceeds the standard water flow rate, i.e. the water output of 1000W used to select the radiator should flow rate relating to standard test conditions. be increased by 9% to 1090W. The second point In order to gain an understanding of how water relates to flow rate. Nominal flow rate is the flow rate flow rate might affect the performance of the SH2.0 that exists when the flow/return ∆T across the radiator systems, a study was carried out into the overall is 10°C as per the standard excess temperature (∆T50) ∆T as measured at the condenser of the ASHPs test for measuring radiator heat output. Note that the connected to radiators systems only, with nominal ∆T across the heat pump’s condenser should the results presented in Figure 3.2. be 5°C . In Figure 3.1, this represents m/mn =1. If this ratio is
Limerick Institute of Technology 19
3.4. ASHP and Radiator performance at low heat demand
In order to investigate system performance at low ASHP output, an analysis was carried
out on SH086 which is fitted with an 8.5kW ASHP with radiators both downstairs and upstairs.
The analysis was conducted for the period from 1/10/18 – 20/12/18.The data is grouped
by CC per heating hour (CC/HH) per day, ordered from left to right according to increasing
CC/hour. The data presented for each point on the CC/HH (x-axis) are manufactuer’s
COP (Specsheet COP) for the average Tout and Tflow for that day, actual COP, average
output (kW) and Tout.
Figure 3.3: Effect of increasing CC/HH on average ASHP kW output and COP
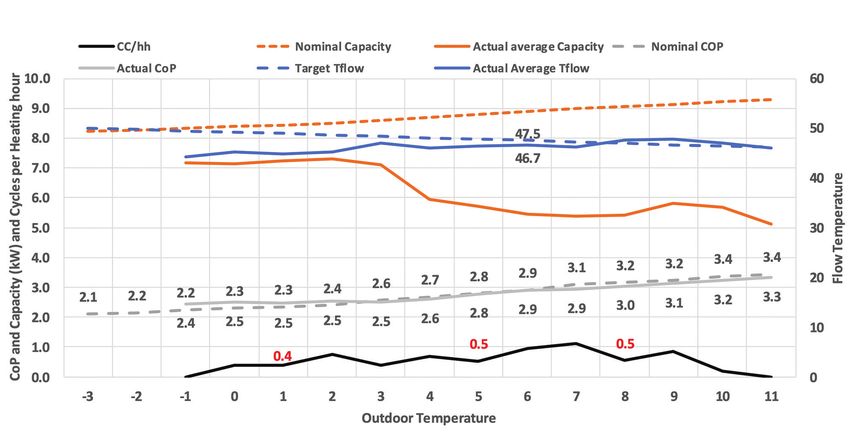
The data presented in Figure 3.3 can be read
in conjunction with the minimum heat output Tflow 35 40 45 50
data presented in table 3.2. Table 3.2 shows that
T air Mitsubishi W85 minimum heat output (kW)
the lowest heat output achieved by the heat pump
should be 3.2kW for the conditions A/W +2/45 -2 3.3 3.4 3.4 3.5
and +2/50, and that the range of minimum outputs
is from 3.2 to 4.9kW for the operating conditions +2 3.3 3.3 3.2 3.2
presented. In Figure 3.3, the horizontal axis presents
the daily totals of compressor cycles per hour. 7 3.9 3.9 3.8 3.8
In the range between 0 and approx. 1.8 CC/HH,
the average output ranges between 3.3kW and 12 4.5 4.5 4.4 4.4
5.1kW which is within the range of Table 3.2. As CC/
HH increases above 1.8, the average output falls to 15 4.9 4.8 4.8 4.8
between 3kW and 2.2 kW, which according Table
3.2., should not be possible. The graph presents
average output which means that heat outputs took Table 32: Mitsubishi W85 minimum heat outputs
place which were even lower than the average
figures and so such outputs should not be possible. The reduction in Tflow, together with increased
These confused heat putput figures are the result of Tout should lead to higher COP, as indicated
excessive stop/start operation where the heat pump by the “specsheet COP” trend. However, the
fails to achieve steady-state operation as a result of “COP/day” trend shows that the actual COP
excessive CC. levelled off at around 3.5, despite the potential
for COP to surpass 5.0. As the CC/HH figure increases,
CC increases proportionally to increases in Tout. As the gap between theoretical and actual COP
Tout increases, the HCC generates a lower Tsf. If only can be seen to increase and the average heat
one zone of the heating system is operating at the output reduces indicating the negative impact
lower Tflow, the output of the ASHP could be much of CC on ASHP heating system performance.
greater than the output of the radiator system thus
leading to higher CC. These themes are further explored in Section 3.5
where the performance of the SH086 system
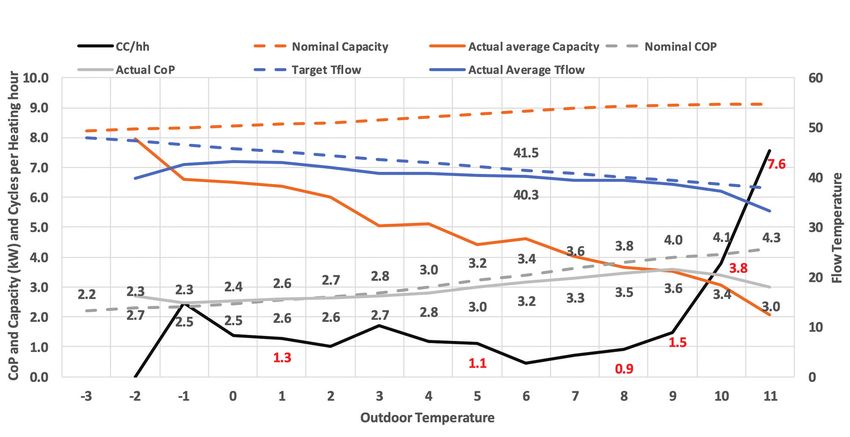
was assessed with three HCC settings.20 Superhomes 2.0 | Best Practice Guide for ASHP Retrofit 3.5. Matching Heat Pump and Radiator System outputs – HCC Adjustments Figure 34: SH086 – low HCC Figure 35: SH086 – medium HCC Figure 36: SH086 – high HCC
Limerick Institute of Technology                                                                                21

Anecdotal evidence from homeowners suggested that some systems, particularly those with
radiators throughout, struggled to achieve target room temperature when Tout was in the range
8-12°C. Figures 3-4, 3.5, and 3.6 present three, 14-day periods where the HDD were very similar
(approx. 155). For the range of Tout, the graphs compare the datasheet nominal heat pump
output to the average actual heat output, datasheet COP to actual COP and the HCC target
flow temperature to the actual average temperature.

Comparing the 45°C and 35°C settings, for the                for longer before having to switch off. The benefits
periods in question, the bulk of the heating took            arising from this are a more predictable COP, much
place when Tout was between 1-6°C. In this range,            less CC and the fact that the higher flow temperature
the actual COP at the higher setting was between             will lead to a more responsive radiator system that
0.1 and 0.2 lower than the datasheet COP. In the             is better able to satisfy room temperature target.
Tout range of 6 - 9°C, the actual COP at the higher          In order to balance these benefits against
setting was 0.3 – 0.5 lower than the datasheet COP.          the need for maximising COP, it is perhaps not
                                                             necessary to increase the lower end of the HCC
For these systems where the heat pumps are directly          as far as 45°C. Section 3.6 will show that 40°C should
coupled to radiator systems, higher target flow              be sufficiently high.
temperature allows the heat pump to operate

3.6. COP Ratio
Heat Pump manufacturers publish performance data including heat output
and COP which is based on tests carried out in accordance with EN14511.
This standard defines a range of A/W operating conditions in terms of source
and sink temperatures (Air and Water in the case of Air-to-Water heat pumps)
for which heat output and energy input are measured. These conditions are carefully
managed so as to ensure a constant ∆T across the heat pump condenser. For low
and medium temperature applications (Tflow = 35 & 45°C), ∆T = 5°C, for high temperature
(Tflow = 55°C) ∆T = 8°C and for very high temperature applications, (Tflow = 65°C) ∆T = 10°C.
Measurements are only taken when the heat pump is operating in what can be called
steady-state at the various operating conditions.

In real-world installations, ASHP system design should try to maximise          The concept of a COP ratio was
the amount of time that the ASHP experiences steady-state operation             introduced during the SH2.0
as this will create the best chance of operational COPs being close             project as a means of checking
to datasheet COP for any given A/W condition. Otherwise, predicting             how close actual COP is to the
performance on the basis of datasheet COP will yield inaccurate COPs            manufacturer’s data sheet for
which will lead to higher than predicted energy consumption by the              a given set of conditions. The
heat pump and thus lower than anticipated CO2 reductions.                       ratio expresses the actual COP
                                                                                as a % of the datasheet COP.
                                                                                Ratios in excess of 90% have
                              Avg.                    Data                      been calculated for systems
                   Avg.                   Avg.                   COP
  SH #     Tout              cycles/                  sheet                     operating for periods with no
                    Tf                    COP                    ratio
                              day                      COP                      CC and very little compressor
 SH127     12.5      29        124         2.6        6.30       41.3%          modulation while ratios below
                                                                                60% were encountered for
 SH103     12.2      25         78         3.2        6.58       48.6%          systems experiencing interruptions
 SH123     11.9      31         35         3.5        5.87       59.6%          caused by high CC and excessive
                                                                                modulation. Tables 3-3- and 3-4
 SH149     12.6      32         15         4.0        5.92       67.6%          present data from 6 homes fitted
 SH001     11.6      27         28         4.3        6.34       67.8%          with ASHP & radiators for what can
                                                                                be considered a shoulder heating
 SH086     11.9      34         39         3.4        4.84       70.2%          month i.e. October and a main
                                                                                heating month i.e. Jan.
Table 3.3: COP ratio in shoulder heating month (Oct-17)
22 Superhomes 2.0 | Best Practice Guide for ASHP Retrofit
From Table 3.3 (shoulder heating month) a general Avg. Data
Avg. COP
trend can be observed where the lower flow SH # Tout Avg. Tf cycles/ sheet
COP ratio
temperatures generated by the HCC in the shoulder day COP
month led to higher CC which in turn led to lower SH127 6.3 34 46 2.7 4.59 58.8%
COP ratios, with the ratio generally improving with SH086 5.6 41 39 2.7 3.88 69.6%
reducing CC. SH103 6.2 36 32 3.1 4.4 70.5%
SH001 5.7 32 10 3.4 4.75 71.6%
The same trend was evident for the main heating
SH123 5.9 36 8 3.2 4.4 72.7%
month (Table 3-4) but COP ratios were generally
much improved. The actual COP figures were slightly SH149 6.4 36 2 3.3 4.4 75.0%
lower than during the shoulder month due to lower
air and higher water flow temperatures. However, Table 3.4: COP ratio, core heating month, Jan-18
cycles are reduced and the COP ratio has improved
for all systems indicating that systems are operating
closer to predicted/designed values.
The application of the COP Ratio is a useful tool to is not always present as evidenced from data from
assess actual COP performance against predicated January 2018, when both zones were open 20% of
(manufacturers test data) performance. This tool can the time, with 66% of the time spent heating zone 1
then be used to highlight operational problems with only and 14% heating zone 2 only.
the system e.g. low flow temperature causing high A trial was commenced in April 2018 whereby the
compressor cycling. HCC was changed to -2/48, 15/40. Table 3-7 presents
the key findings from a comparison of the period
Table 3.3 and Table 3.4, together with the data 1st October to 28th February 2018 & 2019. The table
presented in Figures 3.4, 3.5 and 3.6 from Section 3.5 shows that the higher HCC yielded a significant 97%
demonstrate that it is possible for systems to display reduction in CC, a 100% increase in the number
COPs in the region of 3 to 4. of occasions where the zone target temperatures
were achieved, a 15% increase in COP. All of this
Considering that the minimum heat output of the was achieved with no increase in energy consumed
ASHP at SH127 is approximately 4.5kW, it is clear (EnCon/Degree Day measured in kWh/HDD).
that cycling will start to occur with Tflow < approx. This demonstrates that appropriate commissioning
40°C with all radiators working, i.e. not zoned off. In can result in improved performance of the ASHP with
reality this situation (both zones working together) improved comfort levels.
3.7. HCC Adjustment and Zone Stat Satisfaction
Data recorded from SH127 during the 2017-2018 heating season highlighted this system
as having high CC and low COP. This system was compared with a system which was
performing well (SH001) in Table 3.5. The data used for this comparison is from the period
October 2017 and May 2018. As can be seen CC in SH127 was close to 4 times that of SH001
and COP (Space heating) was >20% below SH001. This significant difference in COP performance
prompted in-depth analysis of the SH127 data.
The HCC setting for SH127 at the start of this study Tflow begins to overshoot its target and so the heat
was -2/48, 15/28 and it was found that the 20°C pump has no choice but to switch off. To further
range in flow temperature yielded very different complicate the matter, the AHSP in question did not
types of ASHP operation at either end of the range. have a safeguard within its control system to limit the
Paradoxically, the system worked better at colder number of compressor starts as evidenced by the
Tout as evidenced by frequent zone stat satisfaction compressor re-starting after only 1 minute in most
events (ZSS) while it was unable to achieve the same cases.
result for milder Tout. At higher Tflow, the radiator
system output was better matched to the range of Table 3.6 provides a sample of the range of heat
ASHP heat output, and so CC disappeared. At lower outputs for a radiator system sized to deliver a
Tflow, the radiators couldn’t dissipate the heat being peak load of 8kW with Tflow set to 48°C, at design
generated by the heat pump even as it modulated conditions.
down to minimum output. In such circumstances,Limerick Institute of Technology 23
3.8. Underfloor Heating vs Radiator Systems
In retrofit scenarios it should be borne
in mind that existing installations may have Space Heat
System Total CC’s
been installed where the building regulations COP
at the time of construction would have required
lower levels of insulation than the current SH001 2,893 3.6
regulations. Indeed, the Part L 2011 calls
for the u-value of a floor with underfloor heating SH127 10,385 2.8
to be better than a standard non-underfloor
heating floor – 0.15W/m2K vs 0.21W/m2K. Underfloor Radiators 5
Accurate information regarding the
build-up of existing underfloor heating
Table 3.5: Example relationship of COP with CC
systems is critical to enable accurate
prediction of running costs and if under
sizing is to be avoided, however this is not ∆T (°C) –
Tflow MWT
always possible in a retrofit scenario. Tret (°C) Rad-Ro- o/p (W)
(°C) (°C)
om
48 41 44.5 24.5 8,000
Underfloor heating systems are
designed to operate at lower 45 40 42.5 22.5 7,162
temperatures than radiator 40 35 37.5 17.5 5,166
systems (30-40°C vs 40-55°C)
35 30 32.5 12.5 3,335
and so could be expected
to deliver higher SPFs. Figure 3.7 28 23 25.5 5.5 1,147
compares the average of the
October and November 2018 Table 3.6: Range of radiator system output
with varying flow temperature
COPs of 14 of the SH2.0 homes
where the hatched bars represent
homes where the majority of the SH127
1/10/17 – 1/10/18 –
28/2/18 28/2/19
space heating is provided by
underfloor heating and the solid HCC
-2/48,
-2/48, 15/40
15/28
bars represent radiator systems.
HDD 1365 1208
Total Heating time
2509 1197
(hours)
Energy Consumed
2284 2021
Space Heating (kWh)
Running Cost (€) 457 404
Total CC 9087 200
Total occurrences of
416 822
zone stat satisfied
Total heat delivered in
6058 6331
SH (kWh)
SH COP 2.7 3.1
EnCon/Degree Day
1.7 1.7
(kWh/HDD)
Table 3.7: SH127 HCC Trial Results24 Superhomes 2.0 | Best Practice Guide for ASHP Retrofit
UFH
Radiators
Figure 3 7: Comparison of COP for Radiator and Underfloor systems
Figure 3-7 shows that three of the underfloor systems are among the highest performers but that
the other three perform less well, with a number of radiator system returning very high COPs.
It has been the experience of the SH2.0 team that a large variety of factors are at play when
considering the range of COPs for the different systems. Two of the underfloor systems pre-dated
the Superhomes upgrade and so it might be expected that these would compare unfavourably.
However, the best performer, SH067 was one of these, the other being SH014.
With regard to the better performing radiator systems;
frequently systems were found to operate with high COPs (>3.5)
but closer examination highlighted that the system may be only
just maintaining internal temperatures, and so these high COPs
might be deemed unrealistic.
In these cases, a sudden drop in Tout often led systems (UFH + radiators) are used in a two storey
to significant periods where internal temperature dwelling, it is advisable that radiators are only
was below target. A number of tests were carried used in first floor sleeping areas where the target
out where the HCC was adjusted to increase temperature is lower, and where there is a tendency
the system operating temperature. Significant for significant heat gain from the lower floor. In such
improvements to internal comfort levels resulted cases, the heat pump can take full advantage
from relatively small increases in energy consumption of the lower operating temperature afforded
and reduction in COP. Examples of these tests have by good underfloor design. Problems can arise
been provided in Section 3.6. if mixed systems involve radiators in core living
areas of the house. Radiators in these locations
Underfloor systems designed for use with heat would have more work to do than those in first
pumps generally have pipes spaced 100-150mm floor bedrooms and so would need flow
apart – greater pipe density allows the screed temperatures higher than the underfloor
to operate at lower temperatures. Where mixed design requires thus reducing COP.Limerick Institute of Technology 25 Care should also be taken where ASHPs between ASHP and emission system outputs. are connected to existing manifolds which High levels of CC were also encountered were designed for boiler temperatures. in underfloor heating systems, with the main These systems were often designed such cause of this being the over-use of room that the water is circulated through the floor temperature controls. Most of the systems circuits by one pump while a second pump had room thermostats in each room controlling elec- circulates between the ASHP and the manifolds tric actuators turning UF heating zones on/off. with a 2 or 3-port mixing valve introducing high In these systems, if only one room calls for heat temperature water as required, while limiting on its own, there is typically a relatively low water the flow temperature to the floor to below 50°C. volume, the benefit of the large thermal inertia It is the recommendation from the SH2.0 project is greatly diminished and the mismatch between a better alternative solution is to have the full ASHP and emission system outputs is created flow from the heat pump pumped directly thus leading to high CC. This can be addressed into the underfloor flow pipes so as to ensure full by reducing the number of thermostats engagement of the ASHP with the heating load. to the minimum required to ensure even However, this was not always the case for room temperatures in the zone, making the underfloor systems in SH2.0. The negative sure that overheating and under heating effect of CC on COP has been discussed is avoided. If this is not possible due to house in Sections 3.1, 3.4 & 3.5 in the context design or orientation, a buffer vessel should of radiator systems where operating radiators be considered. (see Section 4.4). at low temperature can cause a mismatch In addition to the benefit of potentially lower flow temperature, underfloor heating has the advantage of having a far greater thermal inertia compared to radiator systems. This is ideal for heat pumps, especially those fitted with variable speed compressors as it should be very easy for the heat pump to continue to operate without any CC until the room temperature target is achieved.
26                                                    Superhomes 2.0     |    Best Practice Guide for ASHP Retrofit

4. Heat Distribution System
In the context of heating emission system design, Section 3.1 referred to EN15450,
where the importance of ensuring that the heating capacity delivered by the heat
pump is completely transferred to the heating system is noted. Two important ways
where the heating distribution system design can affect this transfer are:
1.The extent to which the emission system output can be reduced through zoning
2.The effect of the distribution system hydraulic design on water flow rate, and the effect
of flow rate on heat pump performance, especially compressor modulation.

4.1. Zoning
As far as zoning of a heating system is concerned, aside from stipulating
that space and hot water heating should be zoned separately, a supplemental
guidance document to Part L of the 2011 building regulations technical guidance
document (TGD) also mentions that:
• The water distribution system should be arranged for reverse return operation
 to maximise efficiency and ease commissioning and future maintenance
• Constant water flow should be maintained through the heat pump
• Pipe sizes should be in accordance with the manufacturer’s recommendations

The experience of the SH2.0 project was that heating system zoning design has a very
significant effect on how the system performs. 18 of the 20 systems in SH2.0 were designed
so that the heat pump is connected directly to the heating distribution system with 2 being
connected to pre-existing buffer vessels. All systems were installed as 2-zone space heating
+ DHW. In the absence of a buffer, 2-zone heating systems regularly create situations where
the heat pump is operating with approx. 50% of the heat emission system volume and emission
capability available to the heat pump. The impact of this is considered here.

In Table 3.1, eight of the SH2.0       and SH212. Building design,               When zoning the heat emission
homes can be seen to have              solar gain and temperature                system, the minimum emission
underfloor heating in the living       settings play significant roles           capacity that the heat pump can
area zone. One of these, SH014,        in determining how best to                be connected to should ideally
also had underfloor in the upstairs    design the control system for an          be equal to or slightly greater
sleeping zone. SH014 and SH067         underfloor heating system, but            than the minimum output of the
differed from the other underfloor     situations where only one room            heat pump at all times. This can
homes in that they did not have        can call the ASHP to operate              be achieved by grouping all
further sub-divisions of control       should be avoided.                        living and circulation areas and
within each zone. When the zone                                                  bathrooms so that they all operate
called for heat, all circuits within   With the radiator systems in the          together, and by controlling
that zone were active. The other       group, living and sleeping zones          bedrooms separately using TRVs
underfloor systems had individual      all had the potential to be further       or room thermostats. The provision
room controls whereby it could         subdivided through the use of             of a buffer vessel also warrants
be possible for the heat pump          thermostatic radiator valves (            consideration. This would provide
to be controlled to operate with       TRV). However, in all cases, the          a thermal inertia to ensure the
only one room calling for heat.        TRV’s were set to maximum and             heat pump can operate a
With a minimum heat output of          so the room temperature would             minimum run-time appropriate
approx. 5kW, and a possible room       have to exceed 25°C before                to the system. This together
load of perhaps only 1.25kW this       switching off a particular radiator,      with control of how long the
control set-up has the potential to    hence TRV’s (set to maximum)              compressor stays off is a common
generate high CC as was found          were not found to cause                   heat pump control strategy
on occasion in SH073                   interruptions to system output.           for minimising CC.

6 Heating and Domestic Hot Water Systems for dwellings – Achieving compliance with Part L 2008
Limerick Institute of Technology                                                                        27

As well as providing a buffer-volume for sustain     above would be when both zones were operating
heat pump operation in times of low demand,          together. This could be described as full-load
the buffer vessel also provides the heating system   operation. The comprehensive data collection
with a thermal inertia which will maintain           system installed on the SH2.0 systems meant that
temperatures in the distribution system when         it was possible to identify when the systems operated
the heat pump is off. If for space or cost reasons   in full or part load. Figure 4.1 presents a comparison
it is decided that a buffer is to be avoided,        of AHSP COP in both scenarios for a selection
the following steps could be considered in order     of homes. The general trend in Figure 4.1 is that
to help avoid CC:                                    the COP is higher when the ASHP operates in full
                                                     load vs part load. This is due to the fact that with
• Minimise zoning                                    a larger heat load relative to the minimum output
                                                     of the heat pump, there is a much better chance
• Oversize radiators even beyond the design
                                                     for the system to operate in steady-state conditions,
 ∆T of 24.5°C                                        i.e. reduced amount of modulation and of CC.
• Provide extra radiators within zones               This enables the ASHP to spend more time operating
• Control strategies that switch the system          closer to the test-house conditions which are the
                                                     basis of published COP figures. Maximising the
 off for periods so that when it becomes active      minimum load that is available to the ASHP is a key
 again, the heat pump must run for longer            step in optimising ASHP retro-fit system design and
                                                     therefore designing should take careful consideration
Given that the SH2.0 homes were designed             of the heating control solutions and set up when
as conventional 2-zone space heating systems,        designing ASHP retrofits.
the closest scenario to the ideal design described

Figure 4.1: Full load vs Part load COP

4.2. Water flow Rate
As noted in Section 3.3, the nominal heat pump flow rate is such that the ∆T at the condenser
is 5°C while design ∆T for radiators is 10°C. This means that at full load, the flow rate through
the heat pump should be twice that through the radiator system. The ASHPs in 18 of the 20
SH2.0 systems were directly coupled to their heating systems meaning that the flow rate through
the heat pump and emission system was the same which led to overall ∆T’s in the range 0.5 - 12°C
during normal heating operation. Anecdotal evidence from heat pump manufacturers suggests
that designers allow for systems to operate with condenser ∆T in the range 5-8°C. However,
∆T above 5-10°C will lead to lower heating system mean water temperature thus reducing
the emission system’s output leading to the heat pump switching off prematurely, increasing
CC and room temperature target not being satisfied. On the other hand, if flow rate through
the heat pump is too high leading to ∆T
28 Superhomes 2.0 | Best Practice Guide for ASHP Retrofit
It has been shown in Section 3.3 that the output
of radiators with flow rate greater than nominal flow
rate does not change significantly and so it could
be argued that it is ok to set the system flow rate
to the higher flow required to maintain a ∆T of 5°C.
In some systems, such as SH127, the existing distribution pipework allowed this to happen. However, an impact
of this setting was a high level of noise at the radiator valves due to water circulation. While the homeowner
in SH127 was not concerned by this noise, other homeowners did raise concerns about similar noise levels.
By contrast, the configuration of pump and pipework in SH086 yielded lower flow rates. While this setup
resulted in lower noise levels at radiator valves, the lower flow rate makes it easier for the heat pump
to achieve its target flow temperature resulting in it operating at minimum output for longer periods
than desired. This leads to long run times before the zone stat is satisfied.
SH086 Average Flowrate and kW output SH127Average Flowrate and kW output
Figure 42: (a) SH086 and (b) SH127 Full and Part load
For both systems, the nominal full and part In systems operating at relatively high flow
load AHSP flow rates should be 0.39 L/s and 0.22L/s, rates, balancing of radiators can be difficult.
respectively. From Figure 4-2, the average actual Instead of achieving ∆Ts of 10°C, it was more
flow rates were 0.23 and 0.17 L/s for SH086 common in the SH2.0 homes to see ∆Ts of 4-7°C.
and 0.3 and 0.28L/s for SH127. For the radiator
systems, the ideal flow rates would be half In some cases, radiators close to the circulating
the heat pump flow rates as the ideal radiator pump were operating with ∆Ts of 1°C, effectively
flow/return ∆T is 10°C as opposed to 5°C acting as a bypass and thus prematurely warming
for the heat pump and so ideal radiator up the return water to the heat pump. This would
system flow rates would be 0.19 and 0.11 L/s give the heat pump a false impression of the house
for full and part load. In both examples presented, heating load and begin to reduce its output.
the full and part load flow rates are higher than Some work was done in one particular building
that required by the radiator system but lower in an attempt to address this situation. However,
than that required by the heat pumps. With while improved ∆T of 2°C was achieved by closing
reference to Section 3.3, the radiator system the lock-shield value the associated noise
output could theoretically be slightly higher was unacceptable.
as m/mn is >1 (at full load, 1.2 for SH086
and 1.6 for SH127) but experience from site In commercial radiator systems, the lock-shield valve
visits has highlighted issues with noisy radiator is not used to regulate the flow through the radiator.
valves due to high flow rate. From the heat Instead it is only used as a service valve to enable
pump point of view, the flow rates are lower a radiator to be removed. In such cases, the system
than ideal and the concern here is that the
heat pump would tend to modulate down
its heat output prematurely leading to longer
than necessary run times before zone target
temperature is achieved.You can also read