The potential of a Solar & Wind Hybrid system in Sri Lanka - Emma Juserius Filippa Ström
←
→
Page content transcription
If your browser does not render page correctly, please read the page content below
The potential of a Solar & Wind
 Hybrid system in Sri Lanka

 Emma Juserius
 Filippa Ström

 Bachelor of Science Thesis
 KTH School of Industrial Engineering and Management
 Energy Technology EGI-2021
 TRITA-ITM-EX 2021:267
 SE-100 44 STOCKHOLM
Bachelor of Science Thesis EGI-2021
 TRITA-ITM-EX 2021:267

 The potential of Solar-Wind Hybrid
 system in Sri Lanka

 Emma Juserius
 Filippa Ström
Approved Examiner Supervisor
Date Peter Hagström Janaka Rathnakumara
 Peter Hagström
 Commissioner Contact person

 -2-
Abstract
As many other countries, Sri Lanka strives to become 100% renewable by 2050 through
reducing their dependence on fossil fuels and implementing more renewable sources such as
solar and wind power. A solution to the problem is therefore to install solar and wind hybrid
systems. The country's geographic location near the equator makes the solar radiation high
and can therefore be used to achieve the energy goal by 2050, both in an economical and
environmental way.

This study is therefore investigating Sri Lanka's potential to implement a solar and wind
hybrid system. The aim of this study is to examine whether it is economically and
environmentally profitable to construct a solar and wind power hybrid system in a household
in Sri Lanka. The goal is to find the most economical optimal dimension of a solar and wind
hybrid system that is also environmentally sustainable.

By compiling a literature study about the solar and wind hybrid system, an optimization could
be made in the optimization programme HOMER. Data was collected for solar and wind
power costs and Sri Lanka’s daily consumption of energy. Then HOMER produced the most
optimal dimension of a solar and wind hybrid system. The economical methods that were
used were the net present value, the payback method and the internal rate of return, which all
were solved in HOMER to reach the optimal dimension. The result showed an optimal
dimension consisting of 5 kW PV and 1 kW wind power, which resulted in a profitable
investment with a payback of 4 years and 10 months, and a NPV of 27,000 USD and also an
internal rate of 20.6%. In addition, the renewable fraction was 48.5% for a household. Beyond
the economical results a sensitivity analysis was made, which did not change the result for the
optimal dimension.

The conclusion can be drawn that the optimal dimension of the hybrid system is economically
profitable and will befriend Sri Lanka’s goal of 100% renewable energy by 2050. However,
even if the result showed a profitable investment, the investment costs are high, which means
that only a few would afford the investment of a solar and wind hybrid system.

 -3-
Sammanfattning
Precis som många andra länder strävar Sri Lanka efter att enbart förlita sig på förnybar energi
till år 2050 genom att ersätta den fossila produktionen med förnybara källor som sol och
vindkraft. En lösning på problemet är därför att installera hybridsystem bestående av sol- och
vindkraft. Landets geografiska placering nära ekvatorn gör att solinstrålningen är hög, vilket
medför att solceller skulle kunna vara en viktig komponent om Sri Lanka ska uppnå
energimålen till 2050 på både ett ekonomiskt och miljövänligt sätt.

Denna studie undersöker därför Sri Lankas potential att implementera ett hybridsystem
bestående av sol- och vindkraft. Syftet med studien är att undersöka om det är ekonomiskt och
miljömässigt lönsamt att konstruera ett sol- och vind- hybridsystem i ett hushåll i Sri Lanka.
Målet är att hitta den optimala dimensioneringen för hybridsystemet som gynnas mest
ekonomiskt och är miljömässigt hållbar.

Genom att sammanställa en litteraturstudie om hybridsystem bestående av sol- och vindkraft
kunde en optimering genomföras i syfte att erhålla det bäst dimensionerade hybridsystemet i
optimeringsprogrammet HOMER. Data samlades in om kostnader för sol- och vindkraft samt
om Sri Lankas dagliga konsumtion av energi i ett genomsnittligt hushåll som HOMER
använde för att framställa den optimala dimensioneringen av ett sol- och vind- hybridsystem.
De ekonomiska metoderna som användes för att beräkna den ekonomiska lönsamheten var
nuvärdesmetoden, återbetalningsmetoden och internräntemetoden, vilka beräknades i
HOMER för att komma fram till den optimala dimensioneringen. Resultatet visade att den
optimala dimensioneringen utgörs av 5 kW solceller och 1 kW vindkraftverk som utgör en
positiv lönsam investering med en återbetalning på 4 år och 10 månader samt ett nuvärde på
27 000 USD och en internränta på 20,6 %. Resultatet visade också en förnybar användning på
48,5 % för ett hushåll. Utöver de ekonomiska modellerna gjordes också en känslighetsanalys
som indikerade på att förändring av de undersökta parametrarna inte hade tillräckligt stor
inverkan på resultatet för att förändra den optimala dimensioneringen.

Slutsatsen kan dras att den optimala dimensioneringen är ekonomiskt lönsam och kommer att
gynna Sri Lanka mot målet att ha 100 % förnybar energi till 2050. Men även om resultatet
visar på lönsam investering är investeringskostnaderna höga, vilket medför att endast ett fåtal
skulle kunna ha råd att investera i hybridsystem bestående av sol- och vindkraft.

 -4-

Table of content
Abstract ......................................................................................................................................................... 3
Sammanfattning ........................................................................................................................................... 4
Tables of figures .......................................................................................................................................... 7
List of tables ................................................................................................................................................. 8
Abbreviations ............................................................................................................................................... 9
Acknowledgment ...................................................................................................................................... 10
1 Introduction ........................................................................................................................................ 11
2 Purpose and Objectives ................................................................................................................... 14
 2.1 Assumptions .............................................................................................................................. 14
3 Method ................................................................................................................................................ 15
 3.1 Limitations ................................................................................................................................. 15
 3.2 Literature study ......................................................................................................................... 15
 3.3 Optimization .............................................................................................................................. 16
 3.4 Economic evaluation................................................................................................................ 19
 3.4.1 Net present value .............................................................................................................. 19
 3.4.2 Discounted payback method .......................................................................................... 19
 3.4.3 Internal rate of return ....................................................................................................... 20
 3.5 Environmental evaluation ....................................................................................................... 20
4 Literature study ................................................................................................................................. 21
 4.1 Solar energy ............................................................................................................................... 21
 4.1.1 Background Solar Energy .............................................................................................. 21
 4.1.2 Photovoltaic cells ............................................................................................................. 21
 4.1.3 Environmental impact of solar cells ............................................................................. 22
 4.1.4 Solar Energy potential in Sri Lanka ............................................................................. 23
 4.2 Wind energy .............................................................................................................................. 24
 4.2.1 Background wind power ................................................................................................. 24
 4.2.2 Wind power technology .................................................................................................. 25
 4.2.3 Wind power potential in Sri Lanka .............................................................................. 26
 4.3 Grid connection ......................................................................................................................... 26
 4.4 Hybrid energy systems ............................................................................................................ 27
 4.4.1 Background of Hybrid energy systems........................................................................ 27
 4.4.2 Technology for Hybrid energy systems....................................................................... 27

 -5-
4.4.3 Optimization of Hybrid energy systems ...................................................................... 28
 4.5 Sensitive values......................................................................................................................... 29
5 Results ................................................................................................................................................. 32
 5.1 Optimization .............................................................................................................................. 32
 5.2 Economic results....................................................................................................................... 36
 5.3 Environmental result ................................................................................................................ 37
 5.4 Sensitivity analysis ................................................................................................................... 38
6 Discussion .......................................................................................................................................... 41
 6.1 Discussion of the results ......................................................................................................... 41
 6.2 Discussion on sensitivity variables ....................................................................................... 43
 6.3 Discussion of limitation of method ....................................................................................... 44
 6.4 Discussion of barriers .............................................................................................................. 45
7 Further work....................................................................................................................................... 47
8 Conclusions ........................................................................................................................................ 48
Appendix ..................................................................................................................................................... 56
 Appendix 1 Photovoltaic potential in Sri Lanka ............................................................................ 56
 Appendix 2 Price of PV cells ............................................................................................................. 57
 Appendix 3 The optimization result ................................................................................................. 58

 -6-

Tables of figures
Figure 1. Electricity generation per source in Sri Lanka ......................................................... 11
Figure 2. UN’s logo of SDG’s seven and eleven ..................................................................... 12
Figure 3. Flowchart of the process ........................................................................................... 15
Figure 4. The model of the energy system ............................................................................... 16
Figure 5. Diagram showing the imported wind data, per month ............................................. 17
Figure 6. Diagram showing the solar data, per month ............................................................. 18
Figure 7. The figure shows the daily load profile .................................................................... 18
Figure 8. Cumulative nominal cash flow over the years for compared energy systems .......... 32
Figure 9. Diagram showing total production during each month.. .......................................... 33
Figure 10. Production from the PV during every day of the year ............................................ 33
Figure 11. Production from the wind turbine during every day of the year ............................. 34
Figure 12. The cash flow for the grid, PV and wind turbine over the system lifetime ............ 36
Figure 13. The cash flow for capital and operating cost during the system lifetime ............... 36
Figure 14. Energy purchased from the grid .............................................................................. 37
Figure 15. Energy sold to the grid ............................................................................................ 37
Figure 16. The photovoltaic potential in Sri Lanka ................................................................. 56

 -7-

List of tables
Table 1. Summary of greenhouse emission per energy source during the entire lifecycle ...... 13
Table 2. Payment scheme in Sri Lanka .................................................................................... 23
Table 3. Table showing the existing tariff for monthly customers .......................................... 27
Table 4. Input variables to HOMER ........................................................................................ 31
Table 5. Result for optimal hybrid system ............................................................................... 32
Table 6. The optimal Generic flat plate PV.............................................................................. 33
Table 7. The optimal wind turbine, Generic 1 kW ................................................................... 34
Table 8. Grid data ..................................................................................................................... 35
Table 9. Electrical production and consumption ...................................................................... 37
Table 10. Sensitive values for the analysis. ............................................................................. 38
Table 11. The payback time for a decreased critical value, an unaltered and a higher. ........... 38
Table 12. The NPC for an increased/decreased parameter, both for base case (the grid) and the
 hybrid system. .................................................................................................................. 39
Table 13. Table of payback time for changes in the nominal discount rate and expected
 inflation rate. .................................................................................................................... 40
Table 14. The NPC for the low and high values of the discount and inflation rate ................. 40
Table 15. The prices on solar cells in relation to their capacity ............................................... 57
Table 16. The result for the optimization from HOMER. ........................................................ 58

 -8-
Abbreviations
AC Alternating current

Ah Ampere hour

CO 2 Carbon dioxide

dBA Decibel A

DC Direct current

DPP Discounted Payback Method

G1 General wind turbine

GNI Gross National Income

HOMER Hybrid Optimization of Multiple Energy Resources

IEA International Energy Agency

IRR Internal Rate of Return

kWh Kilowatt hours

kW Kilowatt

LA Lead-acid battery

LCOE Levelized cost of energy

LKR Sri Lankan Rupee

NASA National Aeronautics and Space Administration

NPC Net Present Cost

NPV Net Present Value

O&M Operations & Maintenance

PV Photovoltaic cells

PVF Present value factor

PVIF Present value interest factor

Rs Indian Rupee

SDG Sustainable development goals

USD United Stated Dollar

 -9-
Acknowledgment
We would like to begin by thanking our supervisor Peter Hagström from the Royal Institute
of Technology in Stockholm, Sweden. Due to the covid-19 pandemic there was no
opportunity for us to apply for a minor field study scholarship, but after reaching out to Peter
he introduced us to Janaka and his projects in Sri Lanka. However, as the situation did not get
better we ended up staying in Sweden, working remotely towards Sri Lanka.

Further acknowledgement we would like to direct towards Janaka Rathnakumara, consultant
at sustainability growth strategist in Sri Lanka, who offered a selection of projects we could
work on for our thesis. When the original plan changed, Janaka kindly offered to guide us
remotely and we are grateful for all the help he has offered.

Lastly we would like to thank Nelson Sommerfeldt, researcher at the Royal Institute of
Technology. Nelson helped us interpret our results in HOMER and thanks to his instructive
video, we could use HOMER unhindered.

 -10-
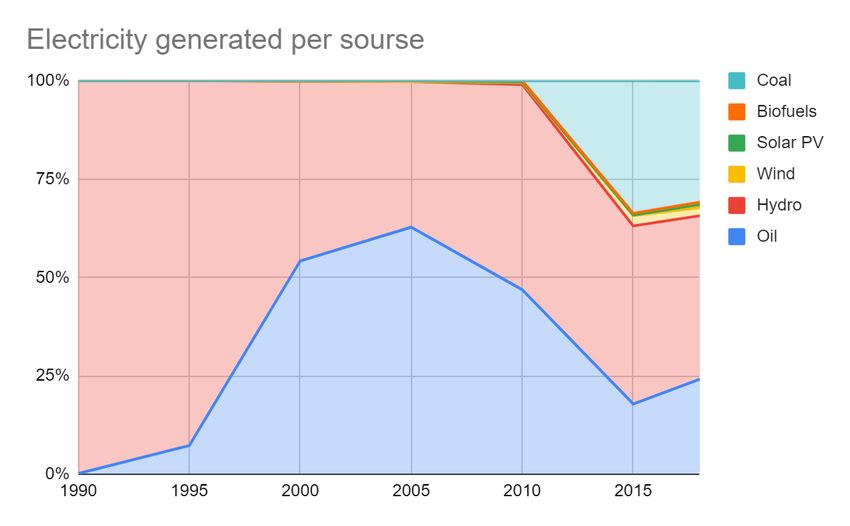
1 Introduction
Sri Lanka is an island, located south of the coast of India, close to the equator with a
population of 21.8 million. It is a lower-middle-income country, with an yearly average
income of 3,900 USD per capita in 2019 (The World Bank 2021), whose economy has grown
after the end of the civil war 2009, and has reached a GNI per capita of 3,800 USD in 2019
(RISE n.d.). The unemployment has during the last centuries decreased, contributing to the
improved living welfare and an increased energy consumption. According to the World Bank
(2020), the welfare in Sri Lanka will suffer greatly from the Covid-19 pandemic.
Furthermore, poverty is estimated to grow, especially among women, as 70% of the
workforce lacks employment protection.

Energy has an important part for shaping a sustainable future for all. To create a sustainable
future the energy sector has to start producing renewable energy and reduce the dependence
of fossil fuels. Despite the Covid-19 pandemic, the total energy usage has increased during
the last centuries, resulting in higher emissions. According to the World bank (n.d.), 99.6% of
the population in Sri Lanka, had access to electricity in 2018, and 99.5% of the population
living in the rural areas. Increased accessibility has resulted in a need for a greater production
and in order to satisfy the consumers, oil and coil have been implemented, which is
demonstrated in figure 1. Hydropower is today the largest source of renewable energy
production in Sri Lanka and has been an important source during the last three decades.

 Figure 1. Electricity generation per source in Sri Lanka (IEA 2018)

 -11-
Sri Lanka is dependent on fossil fuel in their energy generation, which contradicts their strive
to accomplish the United Nations (UN) sustainable development goals (SDG). The SDGs are
implemented to ensure an end to poverty, inequalities, peace and reduced climate change.
Further, the SDGs consist of 17 goals of which this report focuses on three of them, number 7,
affordable and clean energy, number 11, sustainable cities and communities, and number 13,
climate action (which are presented in figure 2).

 Goal number seven - Affordable and clean energy -
 intend to satisfy five sub goals, each focused on different
 aspects of the goal. The main vision is to ensure a secure,
 sustainable valid energy production for everyone (United
 nations n.d.a).

 Goal number eleven - Sustainable cities and
 communities - consist of ten sub goals all of which aims
 to reach sustainable cities. As growing cities creates
 opportunity for economic growth is it critical that it is
 decoupled from carbon emissions in order to create
 sustainable cities (United nation n.d.b).

 Goal number thirteen - Climate action - Aims to take
 immediate actions in order to reduce climate change and
 the consequences. The goal consists of five sub goals
 stretching from increased knowledge to integrate measures
 (United nations n.d.c).

 Figure 2. UN’s logos of SDG’s 7, 11 and 13 (United Nations n.d [d])

 -12-
Table 1. Summary of greenhouse emission per energy source during the entire lifecycle,
data collected from World Nuclear Association (2011)
 Mean Low High
 Technology
 Tonnes CO2 eqv/GWh
 Coal 888 756 1,310
 Oil 733 547 935
 Solar PV 85 12 731
 Hydro 26 2 237
 Wind 26 6 124

Asian Development Bank and United Nations Development Programme article (2017) states
that the governmental vision in Sri Lanka is to implement 100% of renewables by 2050. The
determined generation mix between solar and wind is 50% wind and 30% solar, which both
cause low greenhouse emissions during their lifecycle, see table 1. However, fossil and coal
energy generation is more cost efficient for producers and consumers in Sri Lanka and in
order to justify a renewable option implementation, it must be cost efficient for the final
consumer. According to the article, Sri Lanka has great potential to extract solar and wind
energy, and a mix is essential in order to satisfy the demand during evenings when the sun
does not shine and the demand is high. In order to optimize the production a hybrid energy
system could make use of both the solar and the wind speed, supplying users with electricity
all around the clock.

The definition of a hybrid system is an energy system containing multiple inputs. A hybrid
system could be a mix of wind, solar, biomass or fossil fuels such as diesel (Zohuri 2017).
The main purpose of hybrid systems is to extract the maximum power and consequently the
electricity (Saheb-Koussa et al. 2009). This study considers a solar-wind hybrid system.

 -13-
2 Purpose and Objectives
The main purpose of this study is to evaluate the efficiency of a hybrid system consisting of
wind and solar power for a household in Sri Lanka. This will be considered in an optimization
of such a hybrid system, together with an economic analysis.

A second purpose of this study is to investigate whether it is economically beneficial to
construct such hybrid systems in Sri Lanka as a main energy source. To evaluate the
efficiency of a hybrid system, the size of the solar PV, wind turbine and battery system will be
considered in the optimization being performed. This, together with an economic analysis are
the fundamentals of the result.

Thus, the objectives of this study are:
 • To optimize the most suited hybrid system model containing solar and wind power for
 an on-grid system in Sri Lanka.
 • To assess an economic analysis of implementing a hybrid system consisting of solar
 and wind power in Sri Lanka.
 • To assess the environmental impact of implementing a solar and wind hybrid system
 in Sri Lanka.

2.1 Assumptions
 • The panel slope does not have to be considered due to the geographical location of Sri
 Lanka. If the panel lays flat, it will have a 7.87 degrees inclination (HOMER n.d.).
 • The daily average of energy consumption is 11.27 kWh per household (HOMER n.d).
 • The cost of the converter is included in the battery cost (Sommerfeldt 2021).

 -14-
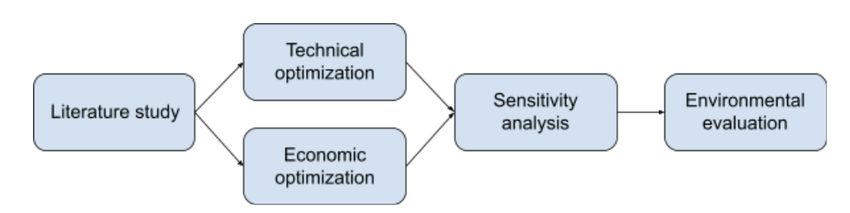
3 Method

 Figure 3. Flowchart of the process

The approach to this study is represented in the chart in figure 3, starting with a literature
study, dimensioning and economic optimization, followed by a sensitivity analysis and an
environmental evaluation. In chapter 3.2 -3.5, the method for each step will be presented.

3.1 Limitations
Limitations have been made to limit the scope of the study. The limitations that have been
made are the following:
 • A national study only considering Sri Lanka.
 • Only hybrid systems containing solar and wind power as sources.
 • The solar energy technology studied are PV cells.
 • No outputs are considered. The customer energy usage is irrelevant, only the total load
 is considered.

3.2 Literature study
A literature study was conducted in order to gather information about hybrid systems and its
components. This was done to receive knowledge about hybrid systems and how it works.
The databases used for the literature study where Primo, DIVA and Google Scholar. The most
common keywords used to find the sources were “hybrid system”, “wind power” and “solar
power”. Primary sources were used as much as possible, but in some cases secondary sources
were used.

 -15-
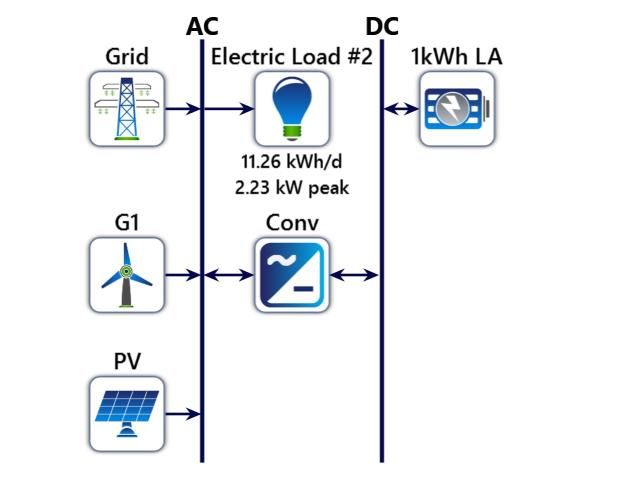
3.3 Optimization

 Figure 4. The model of the energy system

HOMER, a software developed by National Renewable Energy Laboratory is to be used in the
optimization. HOMER is an acronym for Hybrid Optimization of Multiple Energy Resources
and enables users to model on already existing power systems. The meteorology data is
collected from NASA, in order to determine suitability and efficiency for different power
systems on different locations. NASA collects monthly average solar radiation and wind
speed. The monthly average wind speed is taken from 50 meters above the surface over a 30-
year period from 1984 to 2013. The solar data is taken from an average for global horizontal
radiation over a 22-year period, 1983-2005. Further, HOMER provides an optimization both
economical and efficiency, but also a sensitivity analysis (Kassam 2010). The model used for
the optimization is presented in figure 4, where the grid, wind turbine and solar panels are
connected to the AC side and a battery on the DC side. In between the AC and DC there is a
converter connecting to both sides and a load only connecting to the AC side. Both the wind
turbine and the solar cell are considered to be connected to an inverter, allowing them to
connect to the system on the AC side. As the system is connected to the grid this assumption
is common practise in HOMER (Sommerfeldt 2021, 1:25:17).

The software firstly allows for a choice of destination where an arbitrary location, in the
middle of the country, was chosen. HOMER uses imported data in order to assemble an

 -16-
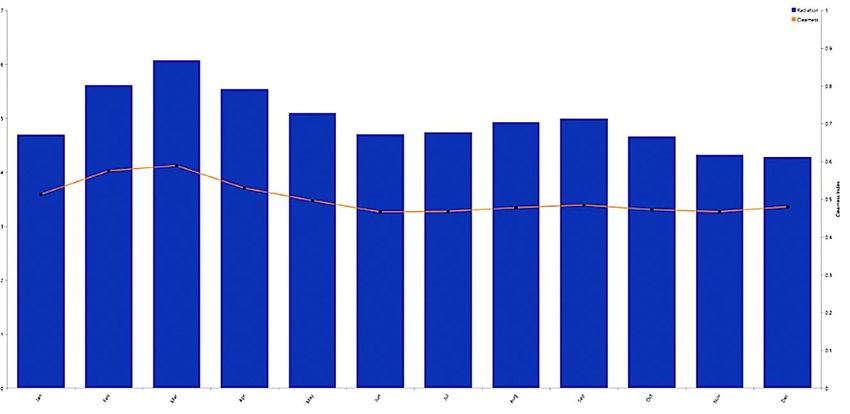
approximate daily load, the data is presented in figure 5 and figure 6 and the load in figure 7.
 The daily load is graphically presented based on the average electricity consumption. Further,
 needed input is the components size, cost and capacity, here multiple inputs allows for
 quantity/capacity optimization. HOMER provides a catalogue with components where prices
 and capacity either can be fixed or personalized. The components used in this project are PV
 cells, wind turbines, battery, inverter and the grid, where of the first two were chosen based
 on a literature study in chapter 4.5. Furthermore, there is a possibility to model the tariff of
 which electricity is sold to or bought from the grid. This tariff can either be set to a simple
 rate (which is used in this project), real time rates, scheduled rate and grid extension. Simple
 rates only require a grid power price and a grid sell back price (USD/kWh) which allows for
 an approximate result.
Average wind speed (m/s)

 Figure 5. The imported wind data, per month in Sri Lanka

 -17-
Daily radiation
(kWh/m2/day)

 Figure 6. The solar data, per month in Sri Lanka
 kW

 kW

 Figure 7. The daily load profile of electricity consumption in Sri Lanka

 HOMER is to be used for the sensitivity analysis in order to estimate outcome if key
 parameters differ from the assumed values. The sensitive analysis is done by entering multiple
 values as the input, and thereafter optimizations are done on all the values (Homer Energy
 n.d.). When each value has been optimized there will potentially be a difference in the result,
 showing the sensible values impact. Examples of key parameters could be wind speed, sun
 hours and fuel price.

 -18-
3.4 Economic evaluation
To evaluate the economic feasibility of installing a hybrid system, following indicators will be
calculated in HOMER.

3.4.1 Net present value

The net present cost, NPV, is an interest calculating method. By using a predetermined
interest rate, the different investment options are recalculated to the year the initial investment
cost was made. An investment where the NPV of the future payment is larger than the initial
investment cost, the investment is profitable (Engwall et al. 2017). HOMER will be able to
calculate the NPV for the correct optimization.

The NPV method:
 = + ∗ + ∗ ( , ) (1)

 =
 =
 =
 =
 ℎ : 1 − (1 + )−
 =

 =
 1
 =
 { (1 + )

3.4.2 Discounted payback method
The payback method (DPP) evaluates the time it takes to payback the invested capital, the
initial investment cost. An investment where the payback time is shorter than the specified
payback time is profitable (Engwall et al. 2017). HOMER will be able to calculate the DPP
for the correct optimization.

The DPP method:

 = (2)

 =
 ℎ : {
 =

 -19-
3.4.3 Internal rate of return The internal rate of return, IRR, is a discount rate, which makes NPV equal to zero for a discounted cash flow analysis. The method uses the same formula as NPV but sets it equal to zero. A higher IRR will make the investment more preferable (Fernando 2021). HOMER will be able to calculate the IRR for the correct optimization. 3.5 Environmental evaluation HOMER has an inbuilt environmental evaluation where the renewable fraction is calculated, however, there is a problem as it includes the sold electricity, which does not give a representative picture of the individual energy consumption (Sommerfeldt 2021, personal communication, 16th April). Therefore, the environmental evaluation will be performed manually using equation 3. The post process calculation will reveal a more accurate renewable fraction allowing for a comparison between energy systems. Further, the post process calculated fraction indicates self-sufficiency. − ℎ (%) = (3) − -20-
4 Literature study

4.1 Solar energy

4.1.1 Background Solar Energy

The sun is the biggest source of energy and the reason for life on earth. Solar power is a
source for renewable energy as photovoltaic technology converts sunlight into electrical
energy. Technological growth has resulted in an increased usage of solar power and
consequently influenced the market prices, which makes solar power a competitor on the
energy market (IEA 2020a). Furthermore, utilization of solar energy conversion to electricity
is to be done by photovoltaic cells as the cells absorb sunlight creating an internal electrical
field (Quaschning 2004). The field is created when the atoms get heated up by sunshine,
creating a movement and allowing it to reject the electrons, producing an electric flow (Sri
Lanka Sustainable Energy Authority u.d. a).

Solar PV’s are not to be studied in depth as it is outside the limitations of the report, a brief
explanation is, however, as follows. The radiated sunlight absorbed by the silicon within the
cells creates the previously mentioned electrical flow which creates a motion due to the
rejected electrons, causing a direct current (DC) (Green Mountain Energy 2019). In order to
supply appliances with electricity, the inverter converts the produced DC to alternate current
(AC).

Solar technology depends on sunlight harvesting, which makes it possible to retrieve energy
globally, however, with varying results. As the solar radiation depends on global location,
season and weather, some climates are more suitable than others. Due to the availability of
solar produced energy and the reduced investment cost the number of solar PV’s has
increased (IEA 2020b). According to IEA, the growth of solar power is estimated to increase
by 15% by 2030, depicted in the Covid-19 pandemic (IEA 2020a). Further, the solar PV cells
are easy to install for private owners and can also be used commercially.

4.1.2 Photovoltaic cells

There are several factors affecting the efficiency of the solar cells and it is measured by the
difference of the amount of solar energy falling on to the panels and the amount of produced

 -21-
electricity, the average efficiency is 15 to 22% of the supplied solar energy (Svarc 2021 &
Vourvoulis 2021). Factors affecting the efficiency are (1) wavelength, (2) reflection, and (3)
temperature. Solar cells are not able to absorb all of the solar radiated as some of the
wavelengths are either too long or too short, which results in reflection or transmission.
Wavelengths separating the electrons from the atoms contain a certain amount of energy.
Additionally, the reflection does affect the efficiency, as material properties impact the
absorption capability. A material with poor absorption capacity does not serve well as a solar
panel as it is inefficient while an absolute black material absorbs more of the radiated solar
energy and therefore increases the temperature and the atoms movement. Lastly, there is an
optimum temperature favourable for solar PV cells, as they function best at low temperatures
(U.S. Department of Energy n.d.a).

For selecting PV cells there are a number of factors that need to be considered, there are the
direct factors as size and quantity and the indirect factors as the efficiency and finances. The
public utilities Commission of Sri Lanka (n.d.) further acknowledges the need for an
understanding of the needed load as it determines the previous mentioned factors. Further, the
commission accounts for multiple services in Sri Lanka, supplying and installing the cells.

According to professor Jenkins and Ekanayake, authors to “Renewable energy engineering”
(2017) establish three generations photovoltaic technologies. The first-generation dominates
the market and uses wafers ether mono- or poly-crystalline silicon. The second generation is
less efficient but cheaper and uses amorphous silicon. Lastly, the third generation combines
technologies for dye-sensitised and polymer. However, the technologies will not be studied
further in depth as the it is not included in the framework of this study.

4.1.3 Environmental impact of solar cells

The environmental impacts of solar cells can be divided into two parts, climate and social
impacts. Social impacts refers to aesthetic and noise disturbance. As solar cells do not make
any noise while operating the noise emission is limited. Further, compared to other energy
sources, such as wind, the solar cells are more aesthetically discrete. In contrast to the
minimal social impacts, there are major climate impacts. Solar energy is to be used to reduce
fossil emission in energy production as the primary emission for solar PV is caused during the
production (Energimyndigheten 2020). To consider solar energy as sustainable, the lifespan
must be greater than the payback time. The energy payback time depends on the geographical

 -22-
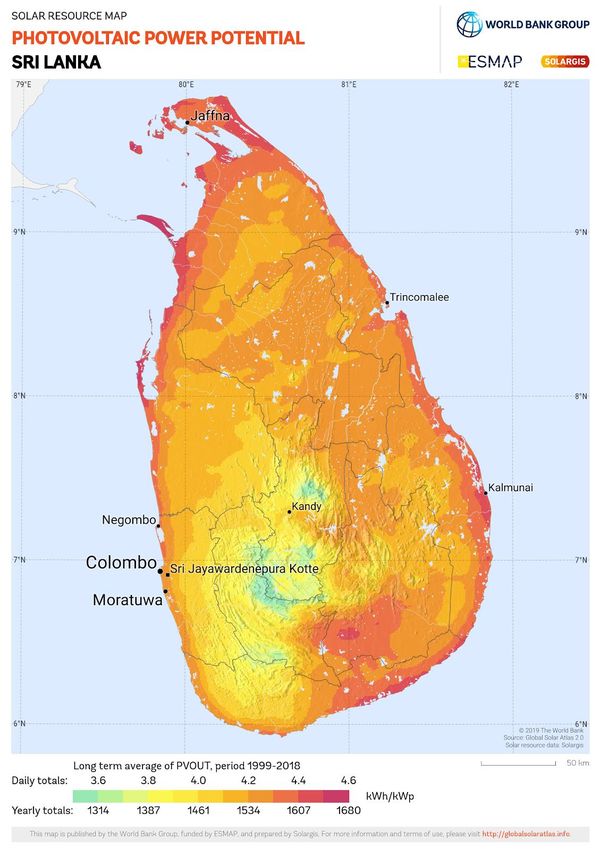
area and is the time it takes for the PV to compensate for the produced energy. Further, the
recycling of solar PV cells results in emissions, the area is however undiscovered as the
modern efficient solar cells still have not reached their life expectancy.

Further, as silicon requires high temperature in order to model the material into proper shape,
there are emissions connected to production (Jenkins & Ekanayake 2017). These are however
dependent on the energy used when heating and could therefore differ dependent on
manufacturer. Moreover, when extracting silicon miners are put at risk, in case of falling
objects and toxic compounds of silicon. When the demand is increasing the production chain
becomes more transparent, resulting in a greater incentive to reduce the carbon dioxide
emissions, and increase the safety, in the production line.

4.1.4 Solar Energy potential in Sri Lanka
Sri Lanka's geographical location, close to the equator, earns the country a significant amount
of solar radiation, see appendix 1, a map containing the potential for photovoltaic power
(Global Solar Atlas n.d.). Due to the location, the angle is of incidence at a direct angle
(almost 90 degrees) causing distinct differences between night and day, and also affecting the
efficiency of solar panels. The government in Sri Lanka aims to install one million rooftop PV
units during the following ten years in their programme “Soorya Bala Sangramaya”
translating to “The battle for Solar Power”. By 2050, the government strives to become
carbon neutral and by implementing the PV cells providing 20% of the total energy
(Powermin n.d.). The initiative finds expression in different generation program schemes
named Net Metering, Net Accounting and Net Plus (Rooftop Solar Power Generation Project.
n.d.). These schemes provide consumers with financing for installation of PV cells and will be
presented, in short and in table 2.

Table 2. Payment scheme in Sri Lanka
 Metering Accounting Plus
 Paid for production X
 Paid for excess
 X
 production
 Pay for electricity X X

 -23-
Net Metering Scheme
Net metering Schemes lets customers pay for the net amount of consumed electricity and if
the production is greater than the consumption it transfers out to the electrical grid (Rooftop
Solar Power Generation Project. n.d.). However, the costumer producing the electricity does
not get paid for the excess electricity but is able to use it as a future credit.

Net Accounting Scheme
Net accounting allows for customers to get paid for the excess electricity transferred to the
grid (Rooftop Solar Power Generation Project. n.d.). During the first seven years one price
excess will be paid with a higher interest and the remaining years with a lower. If the
consumption exceeds the production, electricity has to be bought by the provider to the valid
tariff.

Net Plus Scheme
With the net plus scheme, two separate meters are installed to meet the exported and imported
electricity, so there is no connection between the production and consumption. Therefore, the
customers (the micro-producer) are obliged to pay for the consumed electricity according to
the current tariff, while the provider pays for the generated electricity (Rooftop Solar Power
Generation Project. n.d.).

4.2 Wind energy

4.2.1 Background wind power

Wind power is a renewable energy resource, and in the strive to tackle climate change, it
continues to grow around the world. Vattenfall (n.d), an energy company owned by the
Swedish government, states that it is going to be one of the most important energy sources for
decreasing carbon emissions. Wind power uses wind turbines to generate electricity from the
wind. The wind makes the blades of the turbine spin around a rotor, which makes the
generator spin, resulting in an electricity production. Moreover, to create electricity from
wind, the wind turbines use the aerodynamic force from the rotor blades, the pressure on one
side of the blade will decrease and the other side increase, which will form a lift and a drag
force (U.S. Department of energy n.d.b). The lift force will be stronger compared with the
drag force, which will make the rotor spin and create electricity.

 -24-
The environmental impact of wind power is low, and when the wind turbines create electricity
the carbon emissions are zero, but during the production phase wind power emits small
amounts of carbon emissions, due to transport and production of equipment (Vattenfall n.d.).
Furthermore, the electricity generated varies with wind speed, which makes the system
unpredictable and dependent on weather (Manwell 2004). Additionally, wind power generates
noise, which could be a disturbance to the surrounding, which needs to be considered when
building a wind system (Naturvårdsverket 2020).

If there is enough wind, a small wind system could be cost effective for home based
renewable energy systems (U.S. Department of energy n.d.b). It is a good choice for rural
areas which are not connected to the electrical grid. Wind power systems should last for
around 20 years.

There are some problems with wind power, which needs to be considered when implementing
wind systems. The noise from wind power residences is set to 40 dBA, which is noise from
the wind turbine. In some places the noise factor is more important, for example in the
mountains and therefore the value should be lower than 40 dBA (Bengtsson Rydberg et.al
2013). Concerns over the visual impact is also a problem with wind power and implementing
a wind system for residential use might concern the surrounding (U.S. Department of energy
n.d.c).

4.2.2 Wind power technology

For wind turbines in hybrid energy systems the important features are type of generators and
the rotor controls. There are two types of generators, induction generators and synchronous
generators. The generators can either be connected directly or indirectly to the electrical
network. When connected indirectly, the generator is connected through a power electronic
converter (Manwell 2004).

For rotor controls there are two main forms, stall control and pitch control. The idea with
rotor control, is to protect the wind turbine from high winds (Manwell 2004). Rotor controls
have an important aspect for hybrid systems, it affects the energy flow regulation. It can either
start or stop the production when full output is required.

 -25-
Wind power systems can either have vertical-axis turbines or horizontal-axis turbines. The
most common are horizontal-axis turbines, for these turbines the rotating shafts are parallel to
the wind flow and the turbine's rotors are either up-wind or down-wind. The blades on the
wind power convert the kinetic energy from the wind to rotational energy, and it is most
common to have three rotor blades. The generator will then convert the rotational energy into
electricity through electromagnetic induction (IRENA 2016).

4.2.3 Wind power potential in Sri Lanka

Wind Energy Resource Atlas of Sri Lanka (2003), indicated that Sri Lanka had 5,000 km2 of
windy areas with good to excellent wind potential. The windy areas represented 6% of the
total area of the country. According to the source, the potential wind energy in Sri Lanka
could support 20,000 MW of potential installed capacity.

4.3 Grid connection
An electrical system can either be connected to the grid or not. The difference between the
solutions is that an on grid system is connected to the national grid and could therefore rely on
other sources of power when needed. Off grid systems, on the other hand, stand alone and can
only rely on its production and are therefore dependent on battery storage.

On grid systems do not require individual energy production, but when an individual supplier
produces electricity the excess can be transferred to the grid, and when consumed electricity is
greater than the produced, it can be bought from the supplier at the national grid (Sri Lanka
Sustainable Energy Authority n.d.b). By connecting the system to the grid, the vulnerability
when production is low is reduced. For example, if solar cells are to be used, the production is
low at night, the national grid ensures continuous supply.

A system connected to the grid is bound to a local tariff, stating the selling and purchase price.
Different factors, such as type of building, magnitude of the load and when the load is needed,
determine the valid tariff. For domestic residence producing energy the purchase price differs
from the selling price. In order for a micro-producer to connect to the grid they need a licence,
which is issued over 20 years and the selling price will initially be 22 Rs. per unit during the
first seven years, but the remaining 13 years only get 15,5 Rs. per unit (Public utilities
Commission of Sri Lanka n.d.). Further, grid reliant homes buy energy from it, and in Sri
Lanka there are two major suppliers, Ceylon Electricity board and Lanka Electricity
 -26-
Company. They have together with the Public Utilities Commission of Sri Lanka developed a
tariff, which depends on purpose and load (Ceylon Electricity board n.d.). Table 3 shows the
existing tariff for grid purchases for domestic purposes.

Table 3. The existing tariff for monthly customers with a consumption over 60 kWh per
month. Data from Ceylon Electricity board (n.d.) Rs. is the Indian currency rupee, which
corresponds to 0.013 USD.
 Monthly Consumption Unit change Fixed charge
 (kWh) (Rs/kWh) (Rs/month)
 0-60 7.85 N/A
 61-90 10.00 90.00
 91-120 27.75 480.00
 121-180 32.00 480.00
 >180 45.00 540.00

Off grid solutions are often called stand-alone systems and according to Alliance for rural
electrification (n.d) off grid systems are essential when electrifying rural areas. To enable
continuous consumption these systems require a battery to store energy when the
consumption has been lower than the production.

4.4 Hybrid energy systems

4.4.1 Background of Hybrid energy systems
Hybrid energy systems can operate both off grid or be grid connected. Off grid hybrid energy
systems containing wind power could be practical if the area has an annual wind speed of four
meters per second and in rural areas where grid connection is not available (U.S. Department
of energy n.d. d). A hybrid energy system contains two to three sources of energy used
together, which increases the system efficiency. But this report will only focus on a hybrid
system containing wind and solar power.

The advantages of solar and wind hybrid systems is that they could be used together, when
there is limited sun radiation the wind might be the dominant input and vice versa. Moreover,
the subsystems complement each other and are therefore able to generate an almost constant
input (Saheb-Koussa et al. 2009).

4.4.2 Technology for Hybrid energy systems
A solar-wind hybrid system consists mainly of solar PV, wind turbine, charge controller,
battery bank, inverter and load (Sinha & Chandel 2015). Rotating electrical machinery are
 -27-
used in hybrid systems, and the machines can either be a generator or a motor, this will differ
due to the different applications. There are several different types of generators depending on
the hybrid systems. The most common for a hybrid system containing wind and solar power
are renewable energy generators, which this study will focus on. The renewable energy
generator converts energy from the renewable source to electricity (Manwell 2004).

For hybrid systems there are mainly two energy storages used, convertible storage and end-
use storage. This study will focus on the most common convertible storage for hybrid
systems, batteries (Manwell 2004). Energy storage is used in hybrid systems to power loads
during a longer period, and can be an important factor for stand-alone hybrid systems. The
batteries for the hybrid system need to be maintained, or solar and wind energy could be lost
during the storage time in the batteries (Azoumah et al. 2011). Moreover, the hybrid system
efficiency would decrease.

Furthermore, an inverter is an essential part for hybrid systems. Its main function is to convert
DC to AC. The switching elements for the inverter could either be silicon controlled rectifiers
(SCRs) or power transistors (IGBTs). An oscillating waveform will occur when the switching
elements will be switched on (Manwell 2004). It is most common for households to require
AC current, and therefore the inverter converts DC to AC as the power generated by the
hybrid system is of direct current (Azoumah et al. 2011).

Hybrid systems also contain a control system, it is the batteries in the hybrid system that
usually contain a control system. This is to avoid the batteries from overcharging or avoid
discharge of the batteries (Azoumah et al. 2011).

4.4.3 Optimization of Hybrid energy systems

For optimizing the hybrid system there are several factors that need to be considered. To
begin with, the meteorological data needs to be analysed in the location. The meteorological
data can either be measured from solar and wind data or satellite based data can be used.
Electrical load demand is also an important aspect when optimizing a hybrid system. When
optimizing, daily or hourly load demand is used, because it is too difficult to analyse real load
demand with the minute fluctuation (Sinah & Chandel 2015).

 -28-
When everything above has been made, the system configuration can be considered. Sizing of
the hybrid system is essential and depends on the wind and solar conditions. If the area has
more solar potential, then the hybrid system sizing of solar must have a greater share than of
wind power. An important criteria when designing a hybrid system is that it has to distribute
power for a specific load demand. Moreover, it has to meet the desires between power
reliability and system cost. For optimizing a hybrid system, cost analysis also needs to be
made. This is because the hybrid system should deliver energy at a minimum cost (Sinah &
Chandel 2015).

4.5 Sensitive values
Economy
For the economy HOMER calculates the real interest rate, from the provided nominal
discount rate and the expected inflation rate. The equation HOMER (n.d b) uses for the
interest rate is:
 −
 = (4)
 1+

The inflation rate in varies over the years. Normally the inflation rate is around 2% in Sri
Lanka, but was during 2020 4.6%. (Statista 2021). The nominal discount rate is the rate
before considering inflation rate (Nickolas 2020). The rate is usually set up by banks and
varies a lot, it has been all from 8% (index mundi n.d.) to 15% during the last years (CEIC
n.d.).

Sizing of the load
In Sri Lanka the average person consumed approximately 4,000 kWh during 2019 (Ritchie
and Roser 2019). HOMER calculates an average consumption of 11.27 kWh per day. As
4,000 kWh is an approximate value and gives a daily load of 10.96 kWh, the load is set to a
sensible variable and optimised for the interval of 10 to 12 kWh per day.

Tariff
HOMER provides a present tariff adapted to the geographical area which can be used if the
grid is set to “Simple rates”. These values can from there be adapted to fit a certain profile,
and as the daily consumption in Sri Lanka is set to 11.26 kWh the monthly consumption is
>180 kWh, indicating which unit change is to be used from the table in chapter 4.3. With an

 -29-
exchange rate of 1 USD =75.29 Rs. = 190.96 LKR (Xe currency converter 2021, April), the
input of the power price is set to 0.6 USD (Central Bank of Sri Lanka n.d.). Due to the
fluctuation in revenue earned per produced unit electricity caused by the tariff licence, the
HOMER input was an average. As previously mentioned, during the first seven years micro-
producers get 22 Rs. per unit and 15.5 Rs. the remaining years. In order to insert it to
HOMER an average has to be used, which is 17.8 Rs. per unit (0.24 USD).

PV cells
In the optimization for this project, HOMER assumed a generic PV cell as it allows for users
to customize the performance characteristics based on external data. The software provides a
catalogue with cells from established manufacturers, but as the generic cell is an arbitrary cell
it allows for customization, therefore it is to be used in this study. Further in the report when
generic is mentioned it as an arbitrary component. EcoSolar (n.d.), a Sustainable Energy
Authority of Sri Lanka approved energy provider, provided an estimate of the price in relation
to capacity. For further information regarding the price, see appendix 2. Multiple capacities
options were inserted, allowing for a sizing optimization. Further variable inserted is the
expected lifetime, and according to the Sri Lanka Sustainable Energy Authority (n.d) a PV
cell is estimated to function efficiently for 25 years. In addition HOMER set the panel type to
be flat which indicates an angle of zero degrees.

Wind turbine
In HOMER you are able to select a wind turbine and specify its cost. For the optimization
HOMER assumes a generic 1kW wind turbine. The lifetime of a wind turbine is around 20 to
25 years (TWI n.d.). The cost of a wind turbine can vary depending on source, it can cost
around 2,000 USD for 1 kW (The renewable energy hub n.d.). But a 1 kW wind turbine can
also cost around 1,300 USD and produce 5 kWh daily (Avant Garde innovations n.d.). The
chosen length of the wind turbine is 10 meters.

Battery
In the catalogue of batteries in HOMER there is a generic 1kWh Lead Acid, which is a 12
Voltage battery with the normal capacity of 1 kWh and a maximum of 83,4 Ah (HOMER Pro
Microgrid Analysis Tool, n.d.). This battery has fixed cost, but adaptable factors like lifetime
and throughput, and initial and minimum state of charge. In order to fit the battery to the
schematic of the project, the lifetime was set to 25 years.

 -30-
Converter
HOMER allows for a generic converter of which size is optimised in related to the battery
system (HOMER Pro Microgrid Analysis Tool, n.d.). This can be seen as the converter being
a part of the battery, which results in the converter being set to a cost of zero, but rather
included in the battery price. Further, the generic converter accounts for the losses between
converting between AC and DC.

Table 4. Input variables to HOMER
 Wind
 PV Battery Converter Grid
 turbines
 1
 1 10
 1 1
 Size (kW) 3 2,00 -
 5 8,00
 16,000
 3,500
 7,000
 6,600
 110,000
 Capital cost 9,200 2,000 0 -
 850,000
 14,200
 3,200 000
 6,000 000
 3,500
 7,000
 6,600
 Replacement 110,000
 9,200 2,000 0 -
 cost (USD) 850,000
 14,200
 3,200 000
 6,000 000
 0
 10
 O&M 100 0 0
 30 -
 (USD/year) 1,800
 50
 1,600
 Life time
 25 25 25 25 -
 (yrs)

Table 4 shows input variables for each of the components to HOMER. HOMER will then
optimize the most suitable hybrid system using the input variables.

 -31-
5 Results

5.1 Optimization

 Figure 8. Cumulative nominal cash flow over the years for compared energy
 systems. The diagram shows how the hybrid system saves money over its lifetime
 compared with base case (grid connected system).

Table 5. Result for optimal hybrid system
 Simple payback 4.82 years Net present value 27,264 USD
 Return of investment 16.8% Capital investment 16,200 USD
 Internal rate of return 20.6% Annualized Savings 3,362 USD

HOMER optimised the system in regard to the input values. The system of which the outcome
was greatest was a solar-wind hybrid system containing 5.0 kW of PV and 1.0 kW of wind
generation capacity. This system is represented as the “lowest cost system” in figure 8, and
the “Base case”, represented in grey is the system only containing the grid. The intersect in
figure 8 is the simple payback presented in table 5. Further, table 5 shows the economic
results of the optimised solar and wind hybrid system.

 -32-
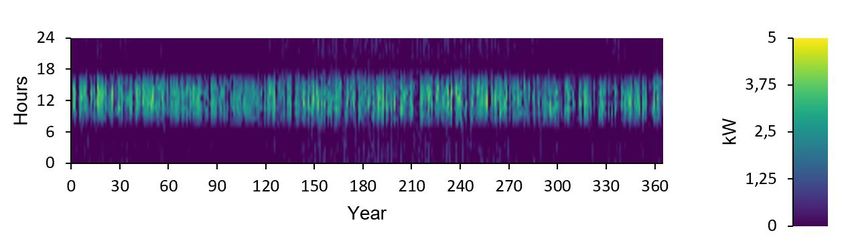
Figure 9. The total production (MWh) during each month. As explained in the
 abbreviations, PV are the PV cells and the G1 is the wind turbine.

The total production from the most optimized system is shown in figure 9. The figure shows
how much is produced from each component of the hybrid system and how much that needs
to be bought from the grid each month. The figure indicates that most production comes from
the PV and the wind power (G1) produces the most during May to September.

Table 6. The optimal Generic flat plate PV
 Rated capacity 5.00 kW Total production 6,586 kW
 Capital cost 14,200 USD Maintenance cost 50.0 USD/year
 Specific Yield 1,317 kWh/kW LCOE 0.174 USD/kWh
 PV Penetration 160%

 Figure 10. Production from the generic flat plate PV during every day of the year

HOMER optimized the Generic flat plate PV to a rated capacity of 5 kW which has a capital
cost of 14,200 USD, which can be seen in table 6. Figure 10 indicates that the solar
production has its peak during day hours and no production during night. The figure also
shows that the production from the PV is higher during the winter months.

 -33-
You can also read