2010-2019REVISION 1 TRANSMISSION DEVELOPMENT PLAN - ESKOM
←
→
Page content transcription
If your browser does not render page correctly, please read the page content below
Transmission Development Plan

     2010-2019          Revision 1
Eskom Transmission Division
Megawatt Park Maxwell Drive Sunninghill Sandton
     PO Box 1091 Johannesburg 2000 SA
               www.eskom.co.za

                                                  Transmission Development Plan
Foreword by Managing Directors
              The Electricity Supply Industry’s value chain consists of generators of electricity, the transmission network
              (or “electricity delivery “highway”) and the distribution network to the end users of electricity. The
              Transmission network, much like road highways, needs to be kept in good condition and sized correctly to
              ensure there are no blockages and that it supports economic growth.

              The National Energy Regulator of South Africa (NERSA), through the Grid Code, has published a set of
              criteria according to which the investments in the Transmission network must be made. Eskom, as the
              licensed Transmission Network Service Provider, develops plans according to this Code and once the
              funding is approved through the regulatory tariff, builds the network according to these plans. These plans
              do take into account resource and funding constraints while trying to meet the reliability criteria as soon
              as possible.

              The Transmission Development Plan (TDP) for the period 2010 to 2019 is the second such plan that is
              being published in the public domain. It follows on the first plan published in 2009. The major focus of the
              plans continues to be to ensure that the new power stations are integrated into the national power system
              and that there is a minimum infrastructure to meet prescribed reliability criteria. Funding constraints mean
              that the time it will take to meet the full requirements of the Grid Code could be as late as 2019.

              The 2010 TDP will be the first plan presented to a Public stakeholder forum following on the first ever
              publication of the 2009 TDP for public comment.

              We estimate that, in nominal terms, an investment of R87.3 billion is needed in the period 2011 to 2015
              and this will increase to R175 billion in nominal terms to the end of the financial year 2020. The expansion
              related component over this period is approximately R145 billion. These are significant investments on
              their own if one compares them to transport and water projects. These investments already consider
              constraints in funding and resource availability as ideally they would have been accelerated. These
              investments will result in the reliability standards only being completely met in the period 2015 to 2020.

              It is clear that the electricity supply industry of South Africa is a key enabler for economic growth and
              that there is a need for the country to understand what is required to ensure a reliable and secure supply
              and what investment levels are required. We hope that this document will assist in this dialogue, and we
              welcome comments and queries on content and format.

              We would also like to take this opportunity to thank the team that has worked and continues to work
              on the development of these plans. It is a difficult and complex process, requiring extensive consultation
              and multiple iterations.

              Kind regards
              Mongezi Ntsokolo and
              Kannan Lakmeeharan

                                     Mongezi Ntsokolo
                                     Managing Director
                                     (Transmission Division)

                                     far left:
                                     Kannan Lakmeeharan
                                     Managing Director
                                     (System Operations &
                                     Planning Division)

2010 - 2019                                                                                                                   i
Disclaimer
     The purpose of publishing the Transmission Development Plan (TDP) is to inform stakeholders about
     the proposed developments in the Eskom transmission network. These plans are subject to change as
     and when better technical solutions are identified or when more accurate developmental information
     becomes available. The information contained in the TDP should therefore not be used for any other
     purpose other than for the sharing of information.

     The contents of this document do not constitute advice and Eskom makes no representations regarding
     the suitability of the information contained in this document to be used for any purpose. All such
     information is provided “as is” without warranty of any kind and is subject to change without notice. The
     entire risk arising out of its use remains with the recipient. In no event shall Eskom be liable for any direct,
     consequential, incidental, special, punitive, or any other damages whatsoever, including, but not limited to
     damages for loss of business profits, business interruption, or loss of business information.

     While the TDP is updated periodically, Eskom makes no representation or warranty as to the accuracy,
     reliability, validity, or completeness of the information in this document. Eskom does, however, endeavour
     to release plans based on the best available information at its disposal at all times to ensure that the
     stakeholders are kept informed about the developments in the transmission network.Thus, the information
     contained in this document represents the most up-to-date information that was available at the time it
     was released.

ii                                                                                                   Transmission Development Plan
Executive                  Summary
              Eskom Holdings is a vertically integrated company licensed to generate, transmit, and distribute electricity
              in South Africa.The Transmission Division of Eskom Holdings is tasked with the responsibility of developing
              the transmission network. The purpose of publishing the TDP is to inform stakeholders about Eskom’s
              plans with regard to the development of the transmission network.This publication fulfils the requirements
              of the South African Grid Code, requiring the Transmission Network Service Provider (TNSP) to annually
              publish plans on how the network will develop. This is the second publication of the TDP.

              A Public forum will be held with identified stakeholders to further disseminate and get feedback about
              the contents herein. These comments will be taken into account when the plan is revised. This publication
              contains projects intended to extend or reinforce the transmission system that have been completed in
              the past year as well as projects that are planned for the next ten years.

              The transmission network is the primary network of interest covered in this publication. This covers
              electrical networks with voltages ranging from 220 kV to 765 kV and transmission substations where these
              networks terminate. A few 88 kV and 132 kV electrical networks are included due to their strategic nature.

              The projects that are covered in this document include, inter alia, generation integration projects required to
              ensure that the network is adequate to evacuate and dispatch power from the source to the load centres.
              The publication also includes transmission network strengthening plans, required to carry the power from
              the new power stations, and reliability projects required to ensure that the reliability and adequacy of the
              transmission network are sustained as load demand increases on the network.

              The estimated rand value of planned projects is approximately R145 billion in the next ten-years, of which
              approximately R 4 billion is Customer related projects, R36 billion is generation integration projects, and
              approximately R105 billion is related to reliability projects. The costs given in the document are, in general,
              high-level estimates and can change as global economic conditions change; that is, costs are sensitive to
              foreign exchange, commodity price fluctuations, and global demand.

              In general, the impact of reliability projects on the customers is to improve availability of supply under
              normal and contingency operating conditions. Customer and generation integration projects allow
              generating plant and the load to be optimally connected to the network.

              Eskom Transmission also undertakes capital expenditure in respect of refurbishment of ageing infrastructure,
              facilities, production equipment, and strategic capital spares. Facilities consist of buildings located at sites
              other than substations that are used by Transmission for offices, operation and control of the system, or
              as maintenance depots and workshops. Production equipment consists of office furniture and equipment,
              computer hardware and software, tools and other equipment used by maintenance personnel, and
              vehicles. Strategic capital spares are items not available from suppliers ex stock (for example, large power
              transformers, circuit breakers, etc.) that are kept as a strategic stock to allow units that fail in service, and
              cannot be repaired on site, to be replaced as soon as practicable, thereby minimising the risk to customers
              of a lengthy outage.

              Projects dealing with refurbishment of ageing infrastructure, facilities, production equipment, and strategic
              capital spares are not included in greater detail in this document, but a summary of their costs is illustrated
              in the chapter dealing with capital expenditure.

2010 - 2019                                                                                                                       iii
Table of              Contents
    Foreword by Managing Directors                                         i
    Disclaimer                                                             ii
    Executive summary                                                      iii
    Table of contents                                                      v
    Table of figures                                                       vii
    List of tables                                                         viii
    Abbreviations                                                          ix

    1.         Introduction                                                1
               1.1 Context of the Transmission Development Plan            1
               1.2 Structure of the document                               1

    2.         Load demand forecast and generation scenarios               2
               2.1 Load forecast                                           2
               2.2 Generation assumptions                                  3

    3.         Major factor changes from previous TDP                      6
               3.1 Geospatial load forecast                                6
               3.2 Generation assumptions                                  6

    4.         Completed projects since last TDP                           7
               4.1 Completed generation integration projects               7
               4.2 Update on transmission reliability projects             8
               4.3 Grid connection applications                            9

    5.           National overview                                         10

    6.         Breakdown of the TDP projects by grid
               6.1 Central grid                                            13
               6.2 East grid                                               19
               6.3 North grid                                              23
               6.4 North east grid                                         28
               6.5 North west grid                                         33
               6.6 South Grid                                              37
               6.7 West Grid                                               43
               6.8 Strategic Servitudes Under Investigation                48

    7.         Capital Expenditure Plan                                    49

    8.         Concluding Remarks                                          50

v                                                                 Transmission Development Plan
Appendices

              Appendix A:        Generation assumptions		                                         51
              Appendix A1:       Generation capacity assumptions – Coal 4                         51
              Appendix A2:       Generation capacity assumptions – Nuclear 1                      52
              Appendix B:        Costing details		                                                53
              Appendix B1:       Costing per project type		                                       53
              Appendix B2:       Costing of reliability projects per cln                          53
              Appendix B3        Costing of reliability projects per grid                         54
              Appendix B3a:      Costing for Central grid projects                                54
              Appendix B3b:      Costing for East grid projects                                   55
              Appendix B3c:      Costing for West grid projects                                   56
              Appendix B3d:      Costing for South grid projects                                  57
              Appendix B3e:      Costing for North East grid projects                             58
              Appendix B3f:      Costing for North West grid projects                             59
              Appendix B3g:      Costing for North grid reliability projects                      59

              Appendix B4:       Summary of Generation integration costs                          60
              Appendix C:        Publication team		                                               60
              Appendix D:        Contact details		                                                60

              Table of         Figures
              Figure 2 - 1:      The Eskom transmission system demand forecast                    2
              Figure 2 - 2:      Power station capacity introduction by year                      4
              Figure 2 - 3:      Planned Power Station Capacity by 2019 (Foundation Plan)         5
              Figure 4 - 1:      Geographical location of Existing and Planned power stations     9
              Figure 5 - 1:      Map showing relative location of the major TDP scheme projects   10
              Figure 6 - 1:      Current Central Grid network and CLNs                            13
              Figure 6 - 2:      Central Grid network diagram                                     18
              Figure 6 - 3:      Current East Grid network and CLNs                               19
              Figure 6 - 4:      East Grid geographical network diagram                           22
              Figure 6 - 5:      Current North Grid network and CLNs                              23
              Figure 6 - 6:      North Grid geographical network diagram                          27
              Figure 6 - 7:      Current North East Grid network and CLNs                         28
              Figure 6 - 8:      North-East Grid network diagram                                  32
              Figure 6 - 9:      Current North West Grid network and CLNs                         33
              Figure 6 - 10:     North West Grid geographical network diagram                     36
              Figure 6 - 11:     Current South Grid network and CLNs                              37
              Figure 6 - 12:     The South Grid networks diagram                                  42
              Figure 6 - 13:     Current West Grid network and CLNs                               43
              Figure 6 - 14:     West Grid geographical network diagram                           47

2010 - 2019                                                                                            vii
List of         Tables
       Table 4 - 1:   Connection Applications Quoted and Accepted                                9
       Table 5 - 1:   Major TDP transmission assets expected to be installed                     11
       Table 6 - 1:   Central Grid CLN load forecast and percentage load increases               13
       Table 6 - 2:   New transmission assets for the Central Grid                               14
       Table 6 - 3:   East Grid CLN load forecast and percentage load increase                   19
       Table 6 - 4:   East Grid new transmission assets                                          19
       Table 6 - 5:   North Grid CLN load forecast and percentage load increases                 22
       Table 6 - 6:   North Grid new transmission assets                                         23
       Table 6 - 7:   North East Grid CLN load forecast and percentage load increases            27
       Table 6 - 8:   Cumulative TDP transmission assets for the North East Grid                 28
       Table 6 - 9:   North West Grid CLN load forecast and percentage load increases            33
       Table 6 - 10: Cumulative assets for North West grid                                       34
       Table 6 - 11: South Grid CLN load forecast and percentage load increases                  37
       Table 6 - 12: Cumulative TDP transmission assets for the South Grid                       38
       Table 6 - 13: West Grid CLN loads and percentage load increases                           43
       Table 6 - 14: Cumulative TDP transmission assets for the West Grid                        44
       Table 7 - 1:   Reliability capital expenditure per project type                           48
       Table 7 - 2:   Reliability capital expenditure per project type                           49

viii                                                                                    Transmission Development Plan
Abbreviations
              CLN (Customer Load Network)
              A network supplying a subdivision of a grid, usually a significant geographical landmass or political boundary
              served, e.g. Johannesburg CLN within the Central Grid.

              TNSP (Transmission Network Service Provider)
              A legal entity that is licensed to own and maintain a transmission network

              MW (Megawatts)
              A million watts – a watt is a unit of electrical power production or demand.

              MVA (Megavolt-amperes)
              A million volt-amperes-volt-ampere depicts vectoral summation of real power (MW) and apparent power
              (Mvars).

              NERSA (National Energy Regulator of South Africa)
              A regulatory body for all forms of energy production and usage in South Africa

              MTS - Main Transmission Substation
              These are mainly substations that step the voltage down to Distribution Voltages.

              RTS - Return to Service
              A previously mothballed Power Station undergoing re-commissioning

              RTS - Return to Service
              A previously mothballed Power Station undergoing re-commissioning

              IPP - Independent Power Producer
              These are power stations owned by independent parties other than Eskom.

              TDP - Transmission Development Plan
              A development plan produced annually by Grid Planning detailing how the network will develop in
              the next ten years. This comprises the proposed new projects listed in this document as well as the
              customer projects omitted from this document due to their commercial sensitivity. The Eskom financial
              year commences in April and concludes in March of the following year, in this case TDP 2010 - 2019
              covers a period from 1st April 2010 to 31st March 2020.

              OCGT - Open Cycle Gas Turbine
              Combustion turbine fuelled by liquid fuel or gas, used to drive a generator.

              CCGT - Combined Cycle Gas Turbine

              OCGT fitted with a waste heat recovery boiler and steam turbines to increase electricity output using the
              combustion turbine’s exhaust gases.

              HVDC - High Voltage Direct Current

              FQ - Feasibility Quote
              Quotation giving customers costs and scope at 65% accuracy level

              BQ - Budget Quote
              Quotation giving customers costs and scope at 85% accuracy level

2010 - 2019                                                                                                                    ix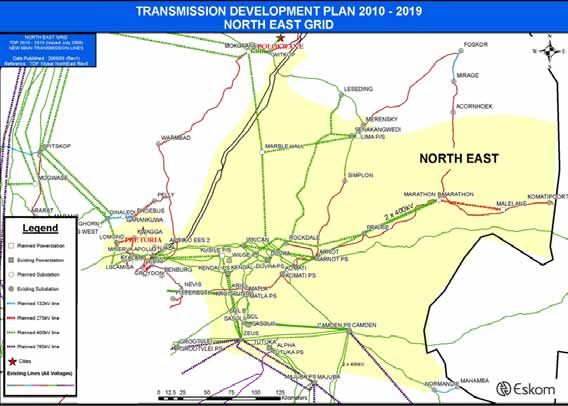
1. Introduction
    1.1. Context of the Transmission Development Plan
    Eskom Holdings is the biggest producer of electricity in South Africa; it is also a sole transmitter of
    electricity via a transmission network which supplies electricity at high voltages to a number of large
    customers and distributors. Eskom is a vertically integrated company licensed to generate, transmit and
    distribute electricity. The transmission licence is held by Eskom Transmission division, the transmission
    network service provider, (TNSP). Planning the transmission network is the responsibility of Grid Planning
    Department, in the System Operations and Planning Division.

    The TNSP is required to abide by the regulatory requirements to annually publish a document detailing
    the plans of how the transmission network will develop in the next five years. The requirements further
    stipulate that the published document should include:
    • the acquisition of servitudes for strategic purposes;
    • a list of planned investments, including costs;
    • diagrams displaying the planned changes to the transmission system (TS);
    • an indication of the impact on customers in terms of service quality and cost; and
    • any other information as specified by the NERSA from time to time.

    A further requirement is that the TNSP holds public forum(s) to share such plans with stakeholders in
    order to facilitate a joint planning process with stakeholders. The first ten-year plan was published in 2009,
    this is the second publication based on the TDP for 2010 to 2019 which was finalised internally in the
    latter parts of 2009.

    1.2. Structure of the Document
    The document is structured in the following way:

    Chapter 2 deals with the electricity demand forecast and generation assumptions. The demand forecast
    determines how the network is planned and it contextualises the planning activity while the generation
    assumptions outlines the generation build that informs some of the planned transmission network, as
    significant transmission network is required to evacuate power from the power stations to the load.

    Chapter 3 focuses on the major changes that have happened since the completion of the previous
    published TDP. The changes that occurred included the enhancement of geospatial forecasting (which
    improves the forecasting of load at a spatial level), and the changes from the previous generation
    assumptions to the ones informing this plan.

    Chapter 4 discusses projects that have been completed in the past year and the impact they have had on
    network reliability. This is partly to demonstrate the value of the projects as they are completed and also
    to inform stakeholders of the progress of projects thus far.

    Chapter 5 deals with the national overview, which gives a high level explanation of the planned transmission
    infrastructure.This is intended to give a snapshot of the major projects that are planned for the entire TDP
    period and a high-level summary of the installed transmission infrastructure.

    Chapter 6 focuses on planned projects in more detail and the impact they will have on the network.
    Generation integration and reliability projects will be discussed per Grid. In both instances, sites and
    servitudes are required to accommodate placement of substations and lines respectively. In either case,
    the Environmental Protection Act requires Eskom to conduct an EIA (environmental impact assessment)
    and obtain environmental approval, which includes the affected public, prior to construction.

    Chapter 7 deals with the capital expenditure of the TDP, while

    Chapter 8 presents various conclusions based on the content in this document

1                                                                                                 Transmission Development Plan
2. Load Demand Forecast
& Generation Scenarios
2.1. Load Forecast
For a transmission network planning cycle, load forecasting is a fundamental requirement. Availability of
sufficient transmission network capacity in any country is important for economic growth. Grid Planning,
in consultation with the relevant Distribution regions and stakeholders, compiles a forecast per point of
supply on an annual basis. The geographically differentiated loads indicate that the growth rates and load
profiles differ substantially from one substation or area to another.
The overall system demand is based on the Eskom 2007 forecast, as the forecast of the overall system
demand has not changed significantly despite the recent economic downturn. These demand figures are
currently under review to determine the exact impact the downturn has had, but this downturn is viewed
as a short-term impact, it is believed that the demand will return rapidly once the economy starts to revive
and quickly get back on track to the forecasted loadings.
Due to the lead times and EIA requirements the transmission planning studies were based on this
load forecast to provide enough time to initiate the necessary transmission infrastructure projects. The
forecasted system peak demand for each year is given in Figure 2 - 1 below.
Figure 2 - 1 : The Eskom transmission system demand forecast
The planning studies for the TDP were based on meeting the load forecast in Figure 2 - 1. Further
monitoring and analysis of the load growth are being undertaken to determine more accurately the
location of the new loads as a result of the economic recovery and progress on customer-initiated
developments.
2010 - 2019 22.2. General Assumptions
The existing generation capacity was included as full installed generation capacity in the year of the study.
Cahora Bassa power import was modelled at a maximum of 1200MW. The future approved power plant
integration projects were incorporated in the year in which they are expected to be commissioned.
Two scenarios were considered, the Foundation Plan, which assumes that all the new generation will be
coal based, and the Nuclear B Plan, which assumes that the first new nuclear power station will be started
by 2018, known as Nuclear 1. In both cases the proposed Coal 3 power station will be required. Thus for
this TDP the main power corridor transmission infrastructure for Coal 3 was included in both scenarios.
The installed capacity of this corridor will be able to be used to integrate the first two units from Coal 4
and is therefore common to both scenarios.
The main difference between the two scenarios is the local 400kV infrastructure required to connect
either Coal 4 or Nuclear 1. As Nuclear 1 is well understood and likely to be more than what is required
for Coal 4 the 400kV infrastructure for Nuclear 1 has been included in the TDP to cater for either project
in terms of major equipment, lengths of line and costs. This is discussed in more detail below.
Coal 3 base load generation and the Waterberg
There is a 4800MW (6 x 800MW units) base load coal-fired power station that is required to come on
line by 2016, referred to as Coal 3. For the purposes of this TDP it has been assumed that the proposed
Mmamabula power station in Botswana is limited to 1200MW in line with the current negotiations for a
power purchase agreement. For the Foundation Plan option the first two units of Coal 4 (2 x 800MW)
will also be required to be in service by 2019.
Nuclear 1 generation
Regarding the proposed Nuclear 1 power station the major assumption is that the power station will
be located at the proposed Thuyspunt site near Port Elizabeth. Although the site selection process is
underway and not concluded it was felt prudent that the Nuclear 1 power station be included in the
TDP to give an indication of the expected transmission requirements. If the nuclear option materialises
it has been assumed that 3150MW will be available from the Nuclear 1 power station at the proposed
Thuyspunt site, based on 3x 1050MW units. The first units will come on line in 2018 and Coal 3 will still
be required.
Cogeneration initiative
Eskom has embarked on a cogeneration programme to attract new cogeneration partners onto the
Eskom system. From a transmission system view most cogeneration projects are reflected as a reduction
of the demand in the area where they are connected. The transmission system still has to be planned to
be able to supply the connected loads if the cogeneration is not available. Therefore no cogeneration is
considered in the TDP or included in the TDP projects. However there is opportunity to optimise and if
found viable and achievable, this will be reflected in the next TDP update.
Renewable generation
Eskom is pursuing a number of renewable generation pilot projects which include wind generation and
solar power. There are a large number of potential wind energy facilities that have applied for connection
to the transmission grid, especially on the West Grid. These are under investigation and there is no clarity
on how much will have to be connected and when. The initial wind farm connections should be those
closest to the transmission system which will result in the least amount of new infrastructure required.
Therefore only 132kV feeder bays are expected for the first connections and will not impact the TDP
significantly. Larger connections requiring a new 400/132kV substation to collect the power will take time
to initiate and implement due to environmental impact assessment (EIA) regulations. They will only have
an impact in the later stages of the TDP.
3 Transmission Development PlanThe transmission system still has to be planned to be able to supply the connected loads if connected
renewable generation plant is not available. Therefore no renewable generation is considered in the TDP
studies or included in the TDP projects at this stage. However it is anticipated that renewable generation
projects and their associated transmission projects will be included in future updates of the TDP.
Conversion of Gourikwa from OCGT to CCGT
There is a proposal to convert some or all of the OCGT units at Gourikwa to CCGT by adding waste
heat recovery boilers and steam turbo-generator sets.This would have the effect of increasing the station’s
total output without increasing fuel consumption. Running cost per kWh of output would be reduced, but
would still be higher than coal fired stations, however, its carbon footprint would be smaller. No date has
been set, so it is assumed for purposes of this document that it will be in 2019. It has not been included
in the generation scenarios used to compile this TDP due to the high level of uncertainty associated with
the project, but has been included in this document to give stakeholders an idea of associated transmission
requirements.
Ingula power station
Ingula power station will be a pumped-storage scheme located in the Eastern Region; it will primarily be
used during peak times.
New Generation summary
A summary of the new plant and the year that the last unit at the power station becomes commercially
available is given in Appendix A. These generation units were assumed to be in service at the expected
dates. This is graphically illustrated in Figure 2 - 2 and Figure 2 - 3 below.
Figure 2 - 2: Power station capacity introduction by year
The proposed OCGT IPP plants to be provided by the Department of Energy (DOE) are not specifically
included in the studies. However, the two known sites in the East and South Grids have been studied, and
effectively only the feeder bays at the relevant Eskom MTS substations are required to integrate them into
the network. These plants are designed for operation only during peak load periods or in emergencies,
making it necessary to plan the network to meet local load without them being available for use.
2010 - 2019 4Figure 2 - 3: Planned Power Station Capacity by 2019
It is also acknowledged that the Tubatse (or Lima) pumped-storage scheme project near Steelpoort has
been put on hold, but the transmission studies were undertaken before this decision, and most of the
infrastructure will still be required for system reliability purposes to meet the needs of local loads.
5 Transmission Development Plan3. Major factor changes
from previous TDP
There have been some changes in the factors influencing the selection and timing of projects for the TDP
from the previous TDP. The main factors were related to an improved understanding of the geospatial
load centres and forecast, the Strategic Grid Study of the main power corridors to 2030, and the potential
generation scenarios. These three factors are briefly discussed in this section as background to the
motivation of the projects and their timing in the TDP.
3.1. Geospatial Load Forecast
There was no overall change to the system peak load forecast as the forecast for total system demand
has not changed significantly despite the recent economic downturn. These demand figures are currently
under review to determine the exact impact the downturn has had, but this downturn is viewed as a
short-term impact and it is believed that the demand will return rapidly once the economy starts to
recover and quickly get back on track to the forecasted loadings
The changes in the load forecast from the previous TDP are largely based on newly available information.
As a result, some of the load has moved between substations and the need for new substations has been
identified. The revision of the demand forecast resulted in a number of new projects required within the
TDP period as well as several of the projects identified in the previous TDP being reconfigured or re-
phased.
3.2. Generation Assumptions
The major changes in the generation assumptions from the previous TDP are the inclusion of Coal 3 and
the optional scenario of Nuclear 1.
The Coal 3 generation is assumed to be in the Waterberg area close to Medupi in line with the current
project development with the target date for the first units in 2016. The integration of the first units at
Coal 3 will utilise the new Delta 765/400kV substation and the Delta-Epsilon lines will be energised at
765kV. It is proposed to implement two HVDC schemes with an HVDC converter station in the vicinity
of Coal 3 to cater for the final configuration of six 800MW units.
The HVDC lines will connect to terminal stations in the Central Grid and the East Grid.These HVDC lines
should cater for the first two 800MW units for a proposed Coal 4 power station in the same area. The
Coal 4 units could be replaced by IPP units in the same area. This is in line with the long-term integration
requirements identified in the Strategic Grid Plan for 2030 for future large generation in the Waterberg
area.
Mmamabula will be limited to 1200MW (2 x 600MW) in line with the current power purchase agreement
negotiations. The first unit will be connected in 2014 and the second unit in 2015.
Nuclear 1 is considered, as in the previous TDP, to be located at the Thuyspunt site. As the transmission
integration requirements only need around 300km of new 400kV line (some of which will still be required
for the new Port Elizabeth 400/132kV substation if Nuclear 1 does not materialise) and a new 400kV
switchyard, the projects have been included in the TDP. Their overall impact on the TDP requirements is
relatively small and only in the last years of the TDP period. They will provide an indication of the lengths
of line that will be required on other projects if Nuclear 1 does not happen, such as the lines from the
Coal 4 power station or IPP developments in the Waterberg area to Delta substation and the HVDC
terminal station.
2010 - 2019 64. Completed projects
since last TDP
This chapter contains a list of projects completed since the last TDP. A project may consist of a number
of sub-projects, which may be placed into commercial operation before the entire project is completed.
This is done to ensure that the network and customers enjoy the benefits of the new assets as soon as
practicable.
4.1. Completed generation integration projects
According to the TDP 2009 - 2018, some RTS power stations were anticipated to be completed in 2009.
Parts of some of these projects have since been completed, and the resultant benefits are being realised.
The completion status of the projects is as follows:
Camden RTS: this power station has now been fully returned to service and the project is complete.
Grootvlei RTS: only generator bays 5 and 6 are still outstanding and completion anticipated in 2010/11
financial year.
Komati RTS: only generator bays 1, 2, 3, 4, and 5 are still outstanding, and completion is anticipated in the
2010/11 financial year.
7 Transmission Development Plan4.2. Update on transmission reliability projects
This section discusses all the projects that were reflected in the TDP 2009 - 2018 for commissioning in
FY2009/10. Over and above that, there are other projects that were not mentioned in that plan (due to
the fact that they were near completion) that have since been concluded.
Central Grid
The project to install a 3rd 315MVA 275/88kV transformer at Rigi Substation near Van der Bijlpark has
been completed.
Johannesburg North Strengthening Phase 1 entailed installation of additional transformation capacity
at Lulamisa substation (Fourways area), Craighall substation (Bryanston) and Lepini (Tembisa). The
transformation installations at Lulamisa substation (3rd transformer) and at Craighall substation (3rd
transformer) have been completed. The installation of the 3rd and 4th transformers at Lepini substation
is outstanding.
East Grid
The implementation of Empangeni Phase 1 Scheme is in progress. The construction of the Majuba -
Umfolozi 400 kV (765 kV design) is nearing completion, and is expected to be completed in June 2010.
The project to introduce 400kV into Eros substation has been completed, with the planned 400/132kV
transformer having been commissioned.
North East Grid
The projects for the installation of additional transformation capacity at Malelane (1 x250 MVA) and
Marathon (2 x 500 MVA) substations are in progress, but are running behind schedule.The Sol B switching
station project has been cancelled, and is being reconfigured into a full substation. This project is linked to
developments in the Secunda supply area.
North Grid
A number of projects to upgrade transformation capacity in the North Grid have either been completed or
are at finalisation stage. These include the Spitskop 3rd 500MVA transformer and Marang 4th transformer,
both of which are at finalisation, as well as the Witkop 3rd transformer project, which is completed. The
Tabor-Spencer Scheme, which entailed constructing the Tabor-Spencer 1st 275kV line as well as a 2nd
transformer at Spencer has been completed.The commissioning of the Bighorn 2nd transformer has been
delayed to 2011.
South Grid
The integration of Dedisa 400/132 kV substation is at the finalisation stage. A number of projects relating
to the South Grid Strengthening Scheme have been deferred.This is primarily as a result of the uncertainty
surrounding the establishment of an Aluminium Smelter in the Port Elizabeth area, as well as potential
substantial step loads in this supply area.
2010 - 2019 84.3. Grid connection applications
A total of thirteen feeder bays were completed to connect customers to the network. Details are however
withheld to protect the confidentiality of the customers concerned. Table 4 - 1 outlines the number of
Feasibility Quotations (FQ’s) and Budget Quotations (BQ’s) that have been processed during the period
January 2009 to February 2010. These are as a result of applications for grid connections, as per the Grid
Code.
Table 4 - 1: Connection Applications Quoted and Accepted
Grid Feasibility Quotations Budget Quotations
Applications Accepted Applications Accepted
Central 8 4 4 3
East 8 2 4 1
North East 14 4 7 0
North West 0 0 2 0
North 21 2 6 1
South 11 0 2 0
West 4 1 3 1
Total 66 13 28 6
% Acceptance 20% 21%
As shown in Table 4 - 1 above, the number of customer applications for grid connections processed is
fairly high, while the acceptance rate is low. The results above indicate that there is potential wasteful use
of scarce resources to process quotes which are not accepted. Further analysis and consultation with
customers is required to understand opportunities to improve this performance.
9 Transmission Development Plan5. National Overview
The map below in Figure 5 - 1 shows a high-level view of the major TDP scheme projects where the relative
location of the new transmission lines and the associated MTS substations are indicated schematically.
Figure 5 - 1: Map showing relative location of the major TDP scheme projects
2010 - 2019 10A summary of the major new assets that are either approved or proposed to be added to the transmission
system over the next ten years are listed in Table 5 - 1 below.
Table 5 - 1: Major TDP transmission assets expected to be installed
TDP New Asset Total
HVDC Lines (km) 1 700
765kV Lines (km) 6 770
400kV Lines (km) 8 355
275kV Lines (km) 831
Transformers 250MVA+ 103
TransformersA significant amount of new transmission lines is being added to the system with over 6,700 km of 765kV
and over 8,300 km of 400kV lines either approved or proposed over the ten-year TDP period. This is
due to the major network reinforcements required for the supply to the Cape (South and West Grids)
and the supply to the East Grid. The integration of new power stations in the developing Limpopo West
Power Pool (Medupi and Coal 3 close to Matimba and the IPP Mmamabula in Botswana) also requires
significant lengths of transmission line as the power stations are very remote from the main load centres.
New HVDC lines are required to export the excess power from Coal 3 in the Waterberg directly to load
centres in the Central and East Grids, requiring 1,700km of 800kV constructed HVDC lines.
The large amount of 400kV transmission lines is also as a result of a more meshed transmission 400kV
network being developed to provide higher reliability within the grids and thus improve the levels of
network security.
These new transmission lines form part of the long-term strategy to develop a main transmission backbone
from which regional power corridors can be supported. These power corridors will connect generation
pools to each other and to the major load centres in the country. This backbone and regional power
corridor network structure will allow for the increasing system demand to be supplied and the power
from new power stations to be integrated more efficiently into the transmission network and distributed
where required, both under system healthy and system contingency conditions.
The development of the transmission backbone and the associated regional power corridors was
reviewed as part of the Strategic Grid Study which considered the potential development scenarios
beyond the ten-year horizon of the TDP up until 2030. The objective of this strategic study was to align
the transmission network with the requirements of the generation future options and the growing and
future load centres. This Strategic Grid Study has enabled the ten-year TDP to be aligned with the future
long-term development of the whole Eskom system.
The addition of over 67000 MVA of transformer capacity to the transmission system is an indication of
both the increasing load demand and the increasing firm capacity requirements of the customers. The
2,366 MVars of capacitive support are required to support areas of the network under contingency
conditions to ensure that the required voltage levels are maintained.
The 14600 MVArs of reactors are a direct result of the long lengths of both 765kV and 400kV transmission
lines that will be constructed over this period. There are a number of series compensation projects
required on the 765kV and 400kV lines required to improve the power transfer capability of the Cape
power corridors.
Currently six new SVCs have been identified in the TDP; two large SVCs with a range of +350/-100
MVAr in the Eastern Cape (South Grid) to support the Coega demands, two new SVCs are proposed to
support the Northern Cape (West Grid) and the proposed Sishen-Saldhana Spoornet expansion, namely
a +200/-100 MVAr SVC at Aries and a smaller one of +45/-100 MVars at Garona. Two +100/-100 MVAr
SVCs are required for dynamic voltage support in the North West Grid at Ferrum and Merapi. There is a
seventh SVC project to decommission the existing 132kV SVC at Grassridge.
2010 - 2019 126. Breakdown of the TDP Projects
by grid
6.1. Central grid
The Central Grid consists of four customer load networks (CLNs), namely; Johannesburg, Vaal Triangle,
West Rand and Nigel. The current transmission network and CLNs are shown in Figure 6 - 1 below.
Figure 6 - 1: Current Central Grid network and CLNs
The expected peak CLN demands by 2019 and the average percentage load increase for the period for
each CLN are given in Table 6 - 1 below.
Table 6 - 1: Central Grid CLN load forecast and percentage load increases
Actual Peak Load Forecasted Load (MW) Ave. Annual %
CLN
2008 (MW) 2009 2015 2019 Load Increase
Johannesburg 4106 5139.4 6165 7448.4 4.11
West Rand 1935 2147.3 2327 2400.7 1.18
Nigel 1666 1879 1989 2037.6 1.05
Vaal Triangle 1443 1929.4 2047 2122.5 1.09
13 Transmission Development PlanThe TDP schemes for the Central Grid consist of extending the 275kV network (built at 400kV insulation
level) the installation of additional transformers at existing substations, as well as the construction of seven
new substations.The integration of Medupi and Kusile power stations will result in the Central Grid 400kV
network being strengthened as well. The increase in transmission assets by end 2014 and end 2019 and
the cumulative total are shown in Table 6 - 2.
Table 6 - 2: New transmission assets for the Central Grid
Transmission Asset New Assets expected New Assets expected Total New
for Central Grid in 2010 - 2014 in 2015 - 2019 Assets expected
Total kms of line 633 346 979
765kV Lines (km) 0 0 0
400kV Lines (km) 625 296 921
275kV Lines (km) 8 50 58
Total installed
3 285 7 860 11 145
Transformer MVA
Transformers (no. of) 11 18 29
Capacitors (no. of) 2 0 2
Reactors (no. of) 0 0 0
6.1.1. Johannesburg CLN
The customer load network (CLN) maximum load for 2008 was 4106 MW. The loads are forecasted for
a ten-year period from 2010 to 2019. Lepini, Lulamisa, Craighall and Croydon substations have the highest
annual load increases for the ten-year period. Especially in the Lulamisa and Lepini supply areas (Midrand
and Johannesburg North), the energy growth has been increasing for the past five years at 5.7% per
annum, with an associated increase of 6% per annum in the demand. The City Power substations Delta,
Fordsburg, and Prospect will also be experiencing considerable load growth. The Kelvin power station is
still assumed to be in service.
The main drivers behind the load growth in the Johannesburg CLN are:
• Craighall/Croydon (Randburg, Sandton and Kempton Park): urban development mainly housing and
extensions to existing shopping malls and development of new ones, as well as office blocks and
office parks. The trend of companies relocating from the Johannesburg city centre, especially to the
Sandton CBD, has also created a demand for additional hotel accommodation.
• Lepini/Lulamisa (Midrand and Johannesburg North): expansion of existing affordable housing
in Ivory Park, Diepsloot and emerging affordable housing in Cosmo City (25 000 affordable
houses are planned for the next five years). New residential developments (high and very high
income) in Johannesburg North and part of Midrand. Development of commercial office blocks,
shopping centres, and light industrial loads is also on the increase.
• Delta/Fordsburg/Prospect: mainly residential development and light industrial loads.
2010 - 2019 14The type of load supplied by the Johannesburg CLN is very important in terms of the profile of the
businesses in the area, including many national and regional company head offices.
The main projects in the Johannesburg CLN are described below. Almost all of the projects are the same
as those in the previous TDP but most of the dates have changed. This is due to a number of reasons
such as increased certainty where projects are done in collaboration with customers, delays in servitude
acquisitions and reprioritisation of projects. A similar trend is noticeable for all other grids and CLNs.
Croydon Transformation strengthening
• Third 275/132kV 250MVA transformer at Croydon MTS. 2010
Johannesburg North – Phase 2 Network Strengthening
• Apollo-Lepini 275kV line 2013
• Lepini Ext 275kV 2x 150MVar capacitors 2013
Johannesburg Reactive Power Project
• Eiger and Jupiter 88kV 48MVAr shunt capacitor bank 2012
• Croydon and Benburg 132kV 72MVAr shunt capacitor 2012
Johannesburg East Strengthening
• Phase 1A: Esselen second 275/88kV 315MVA transformer 2010
• Phase 1B: Esselen–North Rand 275kV line strengthening 2015
• Phase 2: North Rand MTS strengthening 2016
• Phase 3 A-D: Jupiter B MTS integration 2014
• Phase 3 E-F: Sebenza integration 2017
Johannesburg Strengthening
• Establish Sebenza-Craighall 275kV lines 2017
• Establish 1x 275kV GIS feeder at Craighall MTS 2017
• Establish new 400/132kV Craighall B GIS MTS 2019
• Loop Craighall–Lepini/Sebenza lines into Craighall B 2019
Soweto Strengthening Phase 1 (built at *400kV, operated at 275kV)
• Establish new Quattro MTS 275kV *busbar 2014
• Build 2x 275kV Quattro-Etna 15km *lines 2014
Soweto Strengthening Phase 2 (built at *400kV, operated at 275kV)
• Install 2x500MVA 275/132kV transformers 2016
• Build 6x132kV new feeder bays at the Quattro substation 2016
Simmerpan MTS Strengthening – Phase 1(built at *400kV, operated at 275kV)
• Establish new Simmerpan MTS 275kV *busbar 2015
• Operate Jupiter–Simmerpan 2x88kV lines at 275kV 2015
• Install 2x275/88kV 160MVA transformers 2015
Simmerpan Strengthening – Phase 2(built at *400kV, operated at 275kV)
• Install 2x250MVA 275/132kV transformers 2016
• Build 6x 132kV new feeder bays at the Simmerpan 2016
Kyalami 400kV Strengthening
• Construct the new Kyalami 275/132kV GIS station 2014
• Loop the Kusile-Lulamisa 400kV line into Kyalami MTS 2014
Lulamisa MTS Transformation Strengthening
• Install a forth 400/88kV 315MVA transformer. 2019
HVDC Terminal B
• Establish an HVDC converter station close to Jupiter B MTS 2017
• Build an 800kV line from Terminal B to Coal 3 via Epsilon 2017
15 Transmission Development Plan6.1.2. West Rand CLN
This CLN consists of six transmission substations supplying both residential and industrial loads. The CLN
maximum load for 2008 was 1935 MW at time of area peak, and the loads are forecasted for a ten year
period from 2010 to 2019. In 2019 the CLN load is expected to reach 2400 MW at time of CLN peak.
The load growth in this CLN is stable; no new large loads are expected.
The main projects in the West Rand CLN are as follows:
Establishment and Integration of Demeter 400 kV Substation
• Install new Demeter 400/88kV MTS 2x 315MVA transformers. 2015
• Construct Demeter-Lulamisa 400kV line (30km) 2015
• Construct Demeter-Lomond 400kV line (50km) 2015
• Construct Etna-Taunus 400kV line (energised at 275kV) 2015
West Rand Reinforcement
• Establish Westgate B 400/132kV substation 2017
• Install first 400/132kV 500MVA transformer 2017
• Construct Hera-Westgate B first 400kV line 2017
• Construct Taunus-Westgate B first 400kV line 2017
• Construct Taunus Ext 400/132kV transformation (1 x 500MVA) 2017
• Construct Etna-Taunus first 400kV line (energised at 400kV) 2017
• Construct Glockner-Hera first 400kV line 2017
6.1.3. Nigel CLN
This CLN consists of six substations which are supplied from Lethabo power station (via Brenner), Matla
power station (via Nevis and Benburg) and Kriel (via Zeus-Grootvlei). The CLN maximum load for 2008
was 1666 MW. In 2019, the CLN load is forecasted to be 2037 MW. Grootvlei and Benburg show
considerable load increases.
The load growth in the Nigel CLN is driven by the following:
• Residential loads (normal load growth), some of which are: Boksburg North, Boksburg, Meyerton,
Heidelburg and Vosloorus.
• Light industrial loads (normal load growth): for example, Paper and Concrete industries.
• Mining (Normal Load growth); Gold mining and ferrous metals smelting
The main projects in the Nigel CLN are as follows:
Snowdon Transformation Upgrade
• Replace 4x 275/88kV 90MVA with 3x 160MVA transformers 2012
Benburg Transformation Strengthening
• Install a third 275/132kV 250MVA transformer at the Benburg MTS. 2017
Nevis Transformation Strengthening
• Install a third 275/132kV 500MVA transformer at the Nevis MTS. 2017
Siluma 275/88kV MTS Establishment
• Establish new Siluma MTS 2017
• Loop the Lethabo–Eiger, Snowdon–Brenner into Siluma 2017
• Loop the Brenner–Eiger 275kV line into Siluma 2017
• Install 2x 275/88kV 315MVA transformers 2017
2010 - 2019 166.1.4. Vaal CLN
This CLN consists of seven transmission substations and one power station supplying both residential and
heavy industrial loads. The CLN maximum load for 2008 was 1443MW at time of CLN peak. In 2019, the
CLN load is expected to reach 2122MW at CLN peak. The anticipated high load growth nodes are at
Makalu and at Verdun MTS.
The major contributors to the load growth are,
• Residential/Commercial load (normal growth): Boipatong, Sebokeng, Vaalpark, Vanderbijlpark etc,
and
• Industrial light and heavy load (high load growth)
The Makalu transformation project that was in the last TDP has been cancelled as it is no longer needed
due to load shifts. The main projects in the Vaal CLN are as follows:
Vaal Strengthening Phase 1 (closing of the Hera-Bernina 275kV link)
• Replacement of underrated equipment due to high fault levels 2011
• Glockner third 400/275kV 800MVA transformer 2011
• Glockner 275kV busbar replacement to tubular 2011
Vaal Strengthening Phase 2
• Construct Glockner-Etna 2x 400kV lines operated at 275kV. 2011
Vaal Strengthening Phase 3
• Operate Glockner-Etna 2x400kV lines operated at 400kV 2017
• Construct Etna 2x800MVA 400/275kV. 2017
Kookfontein Transformation Phase 1
• Install 2 x 88kV 48 MVar capacitor banks at Kookfontein 2011
Kookfontein Transformation Phase 2
• Install a third 275/88kV 315MVA transformer 2015
• Build a third Glockner-Etna 275kV line 2015
Olympus Transformation Strengthening
• Install a third 275/132kV 250MVA
transformer 2017
17 Transmission Development PlanA network diagram showing the major projects in the Central Grid is shown in Figure 6 - 2 below.
Figure 6 - 2: Central Grid network diagram
2010 - 2019 186.2. East Grid
The East Grid consists of four CLNs namely, Ladysmith, Newcastle, Empangeni and Pinetown. The current
transmission network and CLNs are shown in Figure 6 - 3 below.
Figure 6 - 3: Current East Grid network and CLNs
The expected area peak demands by 2014 and 2018 and the average percentage load increase for the
period for each CLN are given in Table 6 - 3 below.
Table 6 - 3: East Grid CLN load forecast and percentage load increase
Peak Load Forecasted Load (MW) Ave. Annual %
CLN
(MW) 2008 2015 2019 Load Increase
Ladysmith and
1158 1392 1513 2.3 %
Newcastle
Empangeni 2049 3110 3303 4.0%
Pinetown 3212 3724 3922 2.0%
19 Transmission Development PlanThe TDP scheme projects for the East Grid consist primarily of the strengthening of the 400kV networks
that transmits power into Empangeni and Pinetown CLNs and the introduction of 765kV.
In addition to the above TDP scheme projects, there are other projects as listed in the project summary
list that are required to strengthen the network.
The increase in transmission assets by end 2013 and end 2018 and the cumulative total are shown in
Table 6 - 4.
Table 6 - 4: East Grid new transmission assets
Transmission Asset New Assets expected New Assets expected Total New
for Eastern Grid in 2010 - 2014 in 2015 - 2019 Assets expected
Total kms of line 1 690 620 2 310
765kV Lines (km) 990 530 1 520
400kV Lines (km) 700 85 785
275kV Lines (km) 0 5 5
Total installed
7 145 1 475 8 620
Transformer MVA
Transformers (no. of) 10 5 15
Capacitors (no. of) 1 0 1
Reactors (no. of) 7 2 9
6.2.1. Ladysmith and Newcastle CLNs
The average annual load growth in Ladysmith and Newcastle CLNs is projected at about 2.31% (35MW)
over the next ten years. The Tugela third transformer project in the previous ten-year plan has been
cancelled as load can be shifted to other stations during contingencies. The following projects are planned:
Install a Shunt Capacitor at Bloedrivier 2013
Install Incandu third 315MVA-400/132kV transformer 2015
Ingula Power Station Integration (Generation Integration)
• Establish a 400kV busbar at Ingula 2012
• Loop Majuba-Venus 400kV line into Ingula 2012
• Construct Ingula-Venus 78km 400kV line 2012
2010 - 2019 206.2.2. Empangeni CLN
The Empangeni CLN consists mainly of industrial load. The load profile for this area is fairly flat. There are
four 400kV lines that supply power into this network, with 275kV lines linking this CLN to Pinetown CLN
via Impala substation.
The projects planned in this CLN are discussed below. The Empangeni 400/132kV transformation
project that was in Empangeni Phase 3 in the previous TDP has been cancelled, as it is no longer needed;
consequently Empangeni Phases 4, 5, and 6 have been changed to Empangeni Phases 3, 4, and 5.
Empangeni Strengthening Phase 1 (under construction)
• Completion of the Majuba-Umfolozi 765kV line operated at 400kV 2010
Empangeni Strengthening Phase 2
• Establish Theta 400kV switching station 2012
• Construct Umfolozi-Theta 765kV line to be operated at 400kV 2012
• Loop Umfolozi-Athene 400kV line into Theta 2012
• Loop Umfolozi-Invubu 400kV line into Theta 2012
• Construct Theta-Invubu 400kV line 2012
Empangeni Strengthening Phase 3
• Establish 765/400kV at Theta 2015
• Convert Majuba-Umfolozi-Theta line to Zeus-Theta to 765kV 2015
Pinetown-Empangeni Interconnection (previously Pinetown Phase 3)
• Construct Sigma–Theta 400kV first and second Lines (double circuit) 2015
Empangeni Strengthening Phase 4
• Construct Camden–Theta 765kV line to be operated at 400kV 2015
Empangeni Strengthening Phase 5
• Establish 765kV at Camden 2017
• Operate Camden–Theta 765kV line at 765kV 2017
6.2.3. Pinetown CLN
The Pinetown load is mostly residential and commercial in nature. There are four 400kV and two 275kV
lines that supply power into this network. As mentioned under Empangeni CLN, the Pinetown and
Empangeni CLNs are linked with a 275kV line via Avon substation. The following projects are planned:
Pinetown Strengthening Phase 1
• Establish Sigma 400kV switching station 2013
• Construct Majuba-Sigma 765kV (via Venus) line operated at 400kV 2013
• Construct new Sigma-Hector 2x 400kV lines. 2013
Pinetown Strengthening Phase 1B
• Recycle Venus –Georgedale line into second Venus–Ariadne 400kV line 2013
Pinetown Strengthening Phase 2 2015
• Establish 765/400kV at Sigma 2015
• Convert Majuba-Sigma line to Zeus-Sigma and operate at 765kV 2015
21 Transmission Development PlanA geographical network diagram indicating the major projects in the East Grid for the ten-year period is
shown in Figure 6 - 4.
Figure 6 - 4: East Grid geographical network diagram
2010 - 2019 226.3. North Grid
The North Grid consists of five CLNs namely, Waterberg, Rustenburg, Lowveld (northern part), Warmbad
and Polokwane. The current transmission network and CLNs are shown in Figure 6 - 5 below.
Figure 6 - 5: Current North Grid network and CLNs
The expected peak demands by 2015 and 2019 and the average percentage load increase for the period
for each CLN are given in Table 6 - 5 below.
Table 6 - 5: North Grid CLN load forecast and percentage load increases
Peak Load Forecasted Load (MW) Ave. Annual %
CLN
(MW) 2008 2015 2019 Load Increase
Waterberg 618 1322 1927 21.2
Rustenburg 1880 2891 2956 5.7
Lowveld North 581 1150 1210 10.8
Warmbad 543 682 704 3.0
Polokwane 1010 1495 1639 6.2
23 Transmission Development PlanThe North Grid load is mainly platinum group metals (PGM) and ferrochrome mining and processing
located in Rustenburg, Polokwane and Lowveld North (Steelpoort area). The Waterberg CLN has had
the highest average annual growth of about 21% followed by Lowveld with 10.8%, Polokwane with 6.2%,
Rustenburg with 5.7% and Warmbad with 3.0%. The average annual growth for the North Grid for the
period 2009 to 2019 is expected to be 8.2%.
The TDP scheme projects for the North Grid consist of extending the 400kV and 275kV networks as well
establishing the 765kV network, the integration of two power stations (Medupi and Mmamabula), and the
installation of additional transformers at existing and new substations. The increase in transmission assets
by end 2013 and end 2018 and the cumulative total are shown in Table 6 - 6.
Table 6 - 6: North Grid new transmission assets
Transmission Asset New Assets expected New Assets expected Total New
for Northern Grid in 2010 - 2014 in 2015 - 2019 Assets expected
Total kms of line 2 551 1 170 3 721
765kV Lines (km) 350 350 700
400kV Lines (km) 1 966 820 2 786
275kV Lines (km) 235 0 235
Total installed
5 370 9 500 14 870
Transformer MVA
Transformers (no. of) 12 8 20
Capacitors (no. of) 0 0 0
Reactors (no. of) 5 3 8
6.3.1. Waterberg CLN
The Waterberg CLN contains the Medupi 4800MW coal-fired power station that is under construction.
It is also the where two additional coal-fired power stations are likely to be developed. They are referred
to as Coal 3 and Coal 4, with six 800MW units and two 800MW, respectively, expected to be in service
by 2019.
The Waterberg coal bed extends westwards across the Limpopo River to neighbouring Botswana. The
shallow coal deposits in the Waterberg area have attracted extensive explorations that have resulted in an
independent power producer proposing to establish the Mmamabula power station some 80km west of
Medupi. At one stage, this was proposed to be 4200MW, but has now been reduced to 1200MW, which
is currently under negotiation for power purchase agreement.
The Waterberg generation pool will integrate with the Polokwane, Rustenburg, West Rand, and Brits areas
through 400kV and 765kV lines. The 400kV lines will radiate to substations within 300km, and beyond
300km, the 765kV network will eventually form the main backbone down the north-west side of the
country.
2010 - 2019 24You can also read