Cost and Effectiveness Analysis of Select New Jersey Living Shoreline Projects - SIT-DL-20-9-CV5 June 30, 2020
←
→
Page content transcription
If your browser does not render page correctly, please read the page content below
Cost and Effectiveness Analysis of Select New Jersey
 Living Shoreline Projects

 Prepared for:

 The Nature Conservancy (TNC)

 Prepared by:

 Laura Kerr, DanaRose Brown
 and Jon K. Miller, PhD

 SIT-DL-20-9-CV5

 June 30, 2020
Executive Summary
The costs and the effectiveness of five recently constructed living shoreline projects in New Jersey were
evaluated. The projects selected are representative of the diversity of the project types found in New
Jersey. They range in size from large to small, from simple to complex, and from relatively inexpensive to
costly. At several sites, cost information was also obtained for nearby conventional gray shoreline
treatments. This allowed for a qualitative comparison between green and gray alternatives. The cost
information for each project was provided by organizations involved in their funding, design, and
construction. The level of detail provided varied significantly. All provided costs were compiled and
grouped into categories for analysis and comparison. It should be noted that not all of the cost estimates
included enough detail for a complete cost breakdown, therefore the results need to be interpreted
cautiously.

The total cost for the five living shoreline projects in the study ranged from $88 per linear foot to $2,018
per linear foot. The five conventional alternatives ranged in cost from $462 per linear foot to $3,448 per
linear foot. In general, the smallest, least complex project of each type was the least expensive, and the
largest, most complex project was the most expensive. Overall, design and permitting costs, maintenance
and adaptive management costs and monitoring costs were higher for the living shoreline projects than
for conventional projects; however, construction costs for the living shoreline projects were generally
lower. Some of the living shorelines projects were constructed either partially or wholly with volunteer
labor which helped reduce costs.

In terms of the distribution of the costs associated with each project type, significant differences were
found. For the living shoreline projects, materials and labor made up a wide range (34.5% to 91.8%) of
the total project costs. For the conventional projects, materials and labor consistently made up the largest
proportion (88.9% to 98.6%) of the total cost. The split between materials and labor was different as well;
construction costs were more evenly split between materials and labor for the living shoreline projects,
while they were more heavily weighted towards material costs for the conventional projects. Design and
permitting, monitoring, maintenance, and adaptive management costs, all made up a greater proportion
of the cost of the living shoreline projects. This is driven in part by the relative inexperience with living
shoreline projects within the state that often increases the permitting and monitoring costs, and in part
by the way in which maintenance and adaptive management is viewed/interpreted. For living shoreline
projects, maintenance and adaptive management is often considered up front, as a part of the initial
planning process and the collected cost information reflects that; whereas for conventional projects,
maintenance and adaptive management are often considered separate projects entirely and therefore
these costs are not contained in the information provided. For some of the living shoreline projects, the
non-construction costs were found to be more than double the construction costs.

The long-term costs of all the projects were estimated using a framework developed as a part of the
Hudson River Sustainable Shorelines Project (HRSSP). The framework was chosen because of its
adaptability, including the ability to modify and add new cost categories. The framework requires a set
of assumptions related to interest and discount rates, sea level rise, damage potential, and maintenance
including replacement. One of the main conclusions from the long-term cost analysis was that the costs
of the living shoreline projects are more evenly distributed through time, while the costs for the
conventional shoreline stabilization approaches are more concentrated. The major costs associated with
all of the conventional structures were associated with initial construction costs and replacement costs,
while the living shoreline projects were more influenced by maintenance, monitoring, adaptive
management, and damage costs.

The effectiveness of the living shoreline projects was evaluated by analyzing and comparing pre- and post-
construction shoreline changes and comparing them to a nearby control site. Overall, three of the five
living shoreline projects (Berkeley Island, Gandys Beach, and Matts Landing) were found to be clearly
effective at stabilizing the shoreline in their respective project areas, and in some cases even promote
shoreline advancement (Gandys Beach and Matts Landing). The results of the shoreline stability analysis
at the other two sites are less obvious due to the lack of high-quality historical imagery prior to project
installation. These two sites exhibited the lowest pre-construction rates of shoreline change and standard
deviations of 40 to 65% of their annual rate of shoreline change post-construction.

A second measure of effectiveness was evaluated for the three living shoreline projects that contain
feature wave dissipation structures (Gardner’s Basin, Gandys Beach, and Berkeley Island). For these
projects, waves were measured offshore and inshore of the wave dissipation elements, and wave
attenuation was calculated. All three projects were found to be effectively attenuating waves. At
Gardner’s Basin, the majority of wave heights were reduced by 50% or more, while wave heights at
Berkeley Island were reduced between 25% and 75%. At Gandys Beach, the wave attenuation was more
variable, due to the complexity of the hydrodynamic conditions at the site; however, attenuation of
between 0% and 50% was most common.

The effectiveness of the gray alternatives was not evaluated as a part of this study because comparing the
results to the living shoreline projects could result in misleading conclusions. While bulkheads and
revetments are generally very effective at maintaining the shoreline (particularly when newly
constructed), the length of the study precludes consideration of some of the other long-term, effects
which need to be considered if their effectiveness is to be directly compared to living shoreline projects.

Overall, some of the key takeaways from the analysis of the cost and effectiveness data for the five living
shoreline and five conventional shoreline stabilization projects were:

 1. Costs for both living shoreline and conventional shoreline stabilization projects were found to
 vary widely; however, the living shoreline project costs were generally lower.
 2. The distribution of costs for living shoreline and conventional shoreline projects were found to
 be different, with design and permitting, monitoring, maintenance, and adaptive management
 costs making up a larger proportion of the living shoreline project costs.
 3. The long-term cost of living shoreline projects was determined to be more evenly spread over
 time, while the costs of conventional projects were concentrated at discrete times representing
 initial construction and replacement.
 4. Three of the five living shoreline projects were found to be effective in reducing erosion
 compared to a nearby control.
 5. All three living shoreline projects containing wave-attenuating structures effectively attenuated
 waves although the degree of attenuation was found to vary.
Contents
Executive Summary ....................................................................................................................................... 1
Project Overview ........................................................................................................................................... 1
Methodology................................................................................................................................................. 2
 Cost Analysis ......................................................................................................................................... 2
 Description of HRSSP Cost Analysis Framework ................................................................................... 3
 Cost Analysis Updates ........................................................................................................................... 4
 Effectiveness ............................................................................................................................................. 6
 Shoreline Stability ................................................................................................................................. 6
 Wave Attenuation ................................................................................................................................. 8
Berkeley Island County Park ......................................................................................................................... 9
 Site Description ......................................................................................................................................... 9
 Cost Analysis ........................................................................................................................................... 10
 Long-term Cost Estimate..................................................................................................................... 12
 Effectiveness ........................................................................................................................................... 13
 Shoreline Stability ............................................................................................................................... 13
 Wave Attenuation ............................................................................................................................... 15
Gardner’s .................................................................................................................................................... 16
 Site Description ....................................................................................................................................... 16
 Cost Analysis ........................................................................................................................................... 19
 Long-term Cost Estimate..................................................................................................................... 19
 Effectiveness ........................................................................................................................................... 21
 Shoreline Stability ............................................................................................................................... 21
 Wave Attenuation ............................................................................................................................... 22
Strathmere .................................................................................................................................................. 24
 Site Description ....................................................................................................................................... 24
 Cost Analysis ........................................................................................................................................... 25
 Long-term Cost Estimate..................................................................................................................... 26
 Effectiveness ........................................................................................................................................... 27
 Shoreline Stability ............................................................................................................................... 27
Gandys Beach .............................................................................................................................................. 30
 Site Description ....................................................................................................................................... 30
 Cost Analysis ........................................................................................................................................... 32
Long-term Cost Estimate..................................................................................................................... 32
 Effectiveness ........................................................................................................................................... 35
 Shoreline Stability ............................................................................................................................... 35
 Wave Attenuation ............................................................................................................................... 37
Matts Landing ............................................................................................................................................. 39
 Site Description ....................................................................................................................................... 39
 Cost Analysis ........................................................................................................................................... 40
 Long-term Cost Estimate..................................................................................................................... 41
 Effectiveness ........................................................................................................................................... 42
 Shoreline Stability ............................................................................................................................... 42
Summary of Results .................................................................................................................................... 45
 Cost Analysis ........................................................................................................................................... 45
 Long-term Cost Estimate..................................................................................................................... 48
 Effectiveness ........................................................................................................................................... 49
 Shoreline Stability ............................................................................................................................... 49
 Wave Attenuation ............................................................................................................................... 49
References .................................................................................................................................................. 51
APPENDIX A ................................................................................................................................................. 52
Interpreting the Long-term Cost Analysis Tables ........................................................................................ 52
APPENDIX B ................................................................................................................................................. 55
Wave Attenuation Summary Plots .............................................................................................................. 55
APPENDIX C ................................................................................................................................................. 63
Field Site Photographs ................................................................................................................................ 63
 Berkeley Island Site Photos ..................................................................................................................... 64
 Gardner’s Basin Site Photos .................................................................................................................... 65
 Matts Landing Site Photos ...................................................................................................................... 67
 Gandys Beach Site Photos ....................................................................................................................... 68
 Strathmere Site Photos ........................................................................................................................... 70
Glossary ....................................................................................................................................................... 75
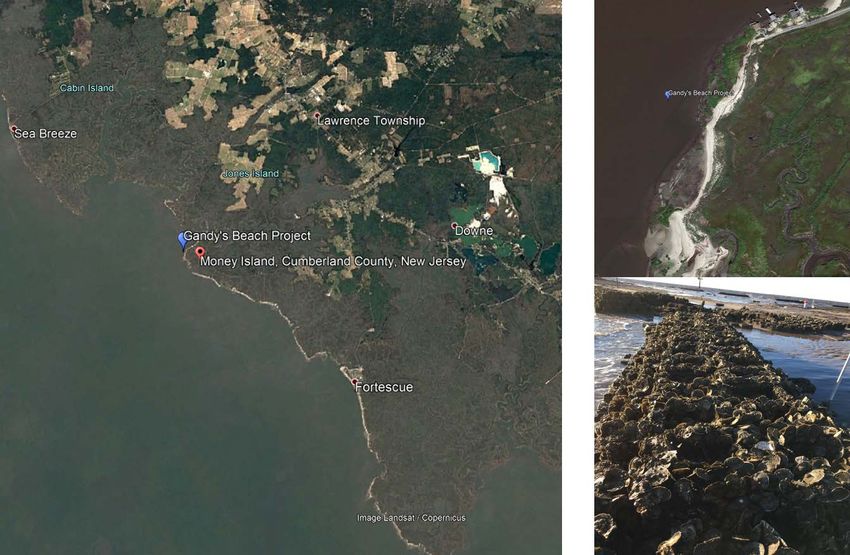
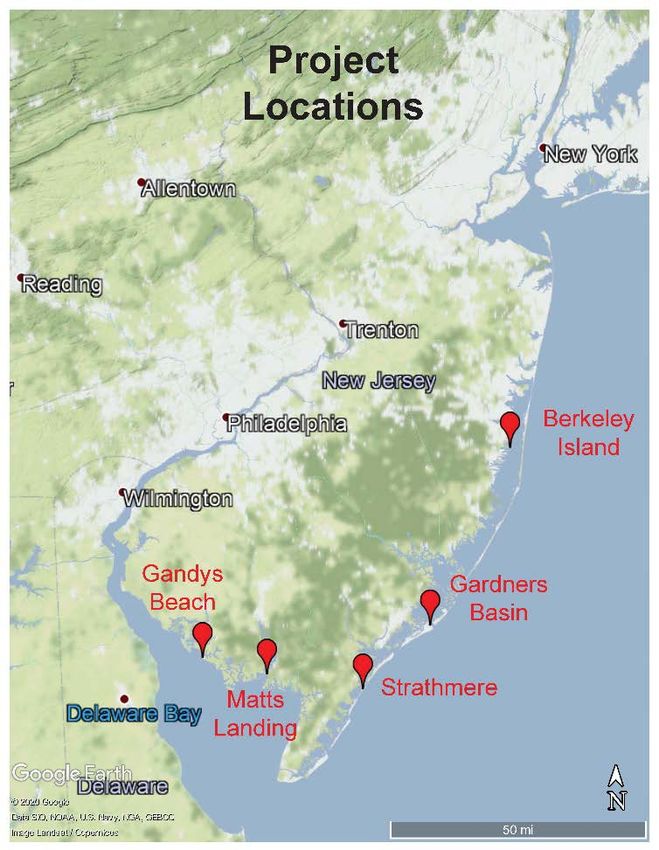
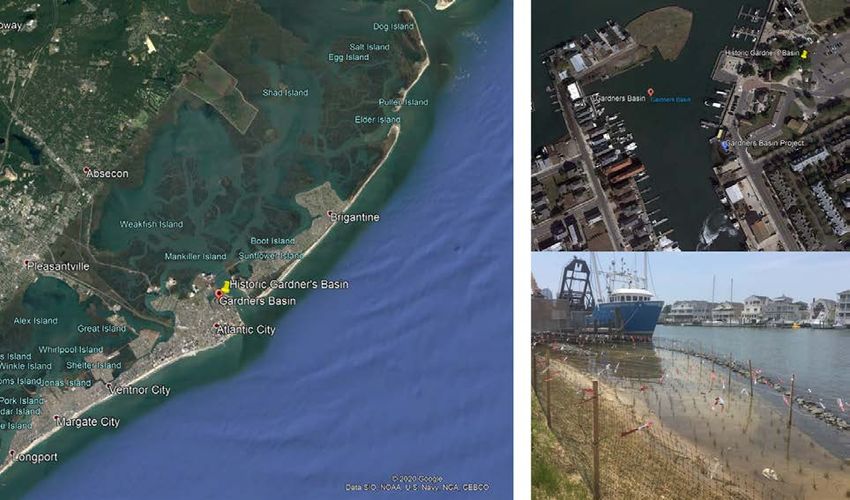
Project Overview
Coastal communities have conventionally responded to coastal hazards like erosion, flooding, and sea
level rise with gray infrastructure such as bulkheads and seawalls. However, these “hard” structures often
cause unintended adverse impacts, as wave energy is reflected into the surrounding environment, and
the interface between land and water is obstructed, resulting in damage to aquatic and terrestrial
habitats. As awareness of the value of marshes and other coastal habitats grows among New Jersey’s
coastal communities, there is increasing demand for “living shorelines” and other risk mitigation
approaches that provide protection from coastal hazards while also preserving coastal habitats. Amid this
increasing demand, state regulatory authorities have moved to enable the first generation of “living
shoreline” projects with the passage of the “Living Shorelines General Permit” (N.J.A.C. 7:7-6.24) in 2013.
This has led to a proliferation of projects in various phases ranging from initial conception to constructed,
and in some cases, even monitored.

In the process of working with communities and shepherding these projects through the design process,
a number of impediments have been identified which cause people to choose conventional gray shore
protection over living shoreline projects in spite of the clear ecological benefits. Two of the most
commonly cited are 1) uncertainty related to the costs and 2) uncertainty related to the effectiveness of
living shoreline projects. The goal of the current project is to reduce some of this uncertainty by examining
the costs and effectiveness of several projects recently constructed in New Jersey. Projects were selected
in consultation with The Nature Conservancy (TNC) and were chosen to highlight the diversity of living
shoreline projects in the state. The five projects selected were:

 1. Berkeley Island County Park segmented sill in Berkeley Township, NJ,
 2. Strathmere Boat Ramp terraced slope in Strathmere, NJ,
 3. Gardner’s Basin sill in Atlantic City, NJ,
 4. Gandys Beach Oyster Castle breakwater in Downe Township, NJ, and
 5. Matts Landing coir roll edge protection in Heislerville, NJ.

A site location map is provided as Figure 1. The sites are distributed throughout southern New Jersey,
and are situated in diverse environments, ranging from extremely low energy to moderately high energy.
While the goal of each project was to stabilize the shoreline, typically consisting of a marsh edge, the
approach differed from site to site. Two of the projects (Matts Landing and Strathmere) directly addressed
the edge, while three of the projects attempted to reduce the energy reaching the shoreline through the
construction of an offshore breakwater or sill (Berkeley Island, Gardner’s Basin, and Gandys Beach).
Materials used in the construction of the projects ranged from coir rolls, to rock, to augmented concrete.

 1|Page
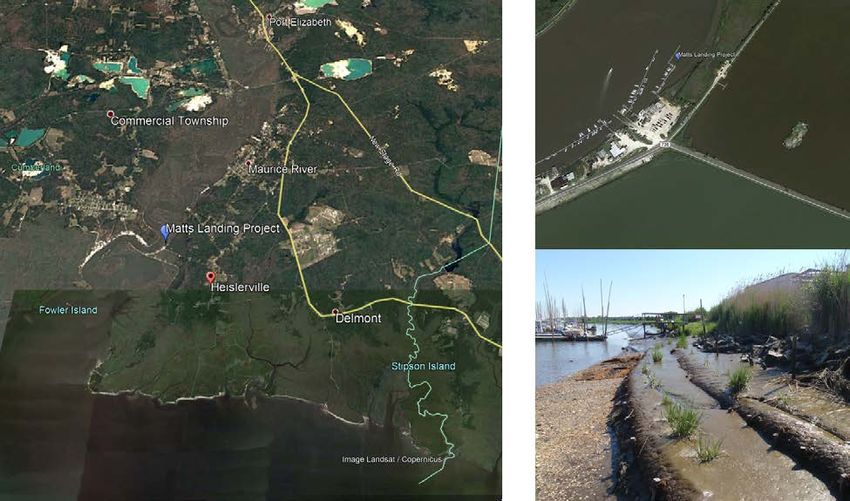
Figure 1: Project location map.

Methodology
The main objectives of the study were to evaluate the costs and the effectiveness of each of the five
projects. Due to the inability of a single metric to adequately capture the performance across the range
of project types selected, the costs and the effectiveness were considered separately. The methodologies
for the independent cost and effectiveness analyses are described below.

Cost Analysis
The cost analysis consists of two separate parts. The first part is a compilation of the actual costs involved
in the design, permitting, construction, and management of each project. Cost information for each of
the projects was solicited from a variety of sources including project funders, project engineers, and the
New Jersey Department of Environmental Protection (NJDEP). Cost information was obtained for each
project; however, the type of information and the level of detail provided varied from project to project.
In some cases, actual costs were provided in extreme detail, in others, only a high-level breakdown of
estimated costs was provided. To supplement the analysis and enable a comparison between the costs
of living shoreline projects and conventional gray shoreline stabilization projects, cost information was
also solicited for nearby, recently constructed conventional, gray shoreline stabilization projects. The
information obtained for each project was broken down and categorized into the following groupings:

 ● Mobilization
 ● Materials

 2|Page
● Labor
 ● Design and Permitting
 ● Maintenance
 ● Adaptive Management
 ● Monitoring

Tables containing the cost information for each project are provided in the body of the report, in as much
detail as possible. This is done to provide guidance for planning future projects; however, the reader is
cautioned that costs for similar items can vary widely from project to project. As an example, some cost
estimates do not separate out labor and materials, while others do. A cost for “living shoreline plantings”
may refer to just the plants, or the plantings and the labor to plant them. Throughout the document, a
consistent color scheme (Mobilization - yellow, Materials – light green, Labor – orange, Design and
Permitting - blue, Maintenance - gray, Adaptive Management - violet, Monitoring - dark green) is used for
the various cost categories.

The second part of the cost analysis is an adaptation of the long-term cost framework developed by Rella
and Miller (2014) for the Hudson River Sustainable Shorelines Project (HRSSP). The framework was
developed to compare the costs of ten different shoreline stabilization approaches at three sites within
the Hudson River Estuary under two sea level rise scenarios. The ten stabilization approaches considered
consisted of a mix of conventional, gray methods and ecologically enhanced, green approaches. The
framework was conceived with the objective of making it adaptable such that updated or new information
could easily be integrated. A brief description of the HRSSP framework and the updates incorporated into
the current analysis is provided below. Information on interpreting the long-term cost analysis tables is
provided in Appendix A.

Description of HRSSP Cost Analysis Framework
The HRSSP cost analysis framework evaluated the long-term costs of ten different shoreline stabilization
options at three sites, under two sea level rise scenarios. For simplicity, costs were broken into four main
categories: Initial Cost (IC), Maintenance and Repair Cost (MC), Damage Cost (DC), and Replacement Cost
(RC). IC were developed by considering each individual site and either developing a “reconnaissance level”
cost estimate based on material and labor, or by direct application of a bulk cost (i.e. $X/linear foot). All
of the other costs were formulated as a percentage of the IC using the best available information and
engineering judgement. Maintenance and Repair Costs (MC) were described as the costs associated with
inspecting and performing basic maintenance on the project. Damage Costs (DC) were described as the
costs to repair a project after a storm event. DC fall outside of the scope of typical MC and were calculated
as the DC associated with a single occurrence of an event multiplied by the most likely number of
occurrences of that event over a specified period. The final cost category considered was Replacement
Cost (RC). RC was only applied to the specific approaches that would likely need to be replaced during
the period considered in the analysis. In the HRSSP report, sea level rise was taken into consideration
through an assumed increase in the frequency of damaging storms and a corresponding increase in the
amount of DC incurred over time. All costs presented in the HRSSP report used a present value approach
with 2012 as the base year. Discounting and inflation were applied using the methodology and data
contained in Construction Cost Estimating Guide for Civil Works (USACE, 2008) and Economic Guidance
Memorandum, 12-01, Federal Interest Rates for Corps of Engineers Projects for Fiscal Year 2012 (USACE
2012). Based on the information in those documents, a discount rate of 4.0% and inflation rate of 1.7%
were utilized.

 3|Page
Cost Analysis Updates
The approach taken in the present work is to utilize the HRSSP cost analysis framework described above,
but to update it and make it more locally relevant by using the cost information obtained for the five
projects selected for this study. Each of the updates that were incorporated into the framework are
described below.

Time Frame Adjustment
The original HRSSP methodology used a 70-yr period for consistency with other planning efforts taking
place in NY State at the time. This necessitated using uneven intervals in the analysis with Period 1 and
Period 2 being 25 years, and Period 3 being 20 years. In the present analysis, a 60-year period was selected
so that three consistent 20-year intervals (Period 1 - 2020-2040; Period 2 - 2040-2060; Period 3 - 2060-
2080) could be defined.

Discount Rate Adjustment
The discount rate was updated to reflect the most recent federal guidance contained in Economic
Guidance Memorandum (EGM), 18-01, Federal Interest Rates for Corps of Engineers Projects for Fiscal
Year 2020 (USACE, 2020a). In accordance with the information provided in the document, the discount
rate was adjusted from 4.0% to 2.8%.

Inflation Rate Adjustment
The inflation rate was updated to be consistent with the most recent guidance contained in the US Army
Corps of Engineers planning document, Civil Works Direct Program Development Policy Guidance (USACE,
2020b). In accordance with the information provided in the document, the inflation rate was adjusted
from 1.7% to 2.9%.

Sea Level Rise Adjustment
The sea level rise and storm encounter scenarios used in the original HRSSP report were updated to reflect
more recent, local information. In the original HRSSP report, the probability of specific water levels being
exceeded (corresponding to storm induced flooding) were based on water level data from The Battery, NY.
The present study uses information from the Atlantic City tide gauge maintained by NOAA
(https://tidesandcurrents.noaa.gov/est/stickdiagram.shtml?stnid=8534720). A curve fit is used to obtain
the water levels for the 25-yr and 40-yr return period storms. The annual exceedance probability (AEP),
return period (Tr), and corresponding water level (in meters above Mean Sea Level - MSL) at Atlantic City
are shown in Table 1.

The water levels for the 10, 25, 40, and 50-yr storms were then adjusted for future seal level rise using the
moderate emissions scenario from (Kopp et al., 2019). The expected sea level rise (from present day) at
the midpoint of each analysis period are shown in Table 2.

Table 3 combines the information in the previous two tables, and details the resulting modified return
periods and expected number of storm encounters for each of the design storms during each of the
analysis periods.

 4|Page
Table 1: Annual water level exceedance probabilities (AEP) as determined by NOAA for Atlantic City, NJ.

 Table 2: Sea level rise (SLR) estimates under a moderate emissions scenario according to Kopp et al., 2019.

 Table 3: Expected frequency of 10, 25, 40 and 50-year return periods (Tr) under a moderate sea-level rise scenario.

Additional Costs
Based on recent experience in New Jersey, several new categories of costs were identified and included
in the analysis. The first relates to design and permitting. Some of the early New Jersey living shoreline
projects experienced significant delays in permitting which increased the overall costs. Although recent
experience suggests this has improved since the adoption of N.J.A.C. 7:7-6.24 (commonly known as the
living shorelines general permit), the costs associated with engineering design and permitting continue to
be an impediment for many small projects. The costs associated with design and permitting are
incorporated into the long-term cost analysis by including them as a separate one-time cost incurred at
the start of the project.

A new category of damage costs related to ice was also added. This category was added based on recent
experience where ice has caused significant damage to several New Jersey projects. Because relatively
little information on the likelihood of ice damage exists, ice damage costs were treated differently than
wave/surge damage costs. For all projects susceptible to ice damage, it was assumed that two icing events
would occur during the first period (2020-2040), one would occur during the second period (2040-2060)
and none would occur during the third period (2060-2080). The incidence of ice damage was assumed to
decrease over time due to global warming. Since little information is available on the costs related to ice
damage, an engineering estimate was used based on the assumed potential impacts to each type of

 5|Page
project from ice. This is consistent with the approach taken in the HRSSP analysis to assign damage costs
to wave/surge damage.

Finally, a new cost category was added which includes monitoring and adaptive management (MA). The
decision was made to add this category as it is becoming increasingly obvious that monitoring and
adaptive management are critical to the success of living shoreline projects. MA costs are included in the
long-term cost analysis as a one-time cost incurred during the first period. While it could be argued that
monitoring needs to be continued beyond that, the reality is that most projects are only monitored very
early on. For the purposes of the cost analysis, any modification to a project occurring during the second
or third analysis period are assumed to be either Maintenance Costs (MC) or Damage Costs (DC) and not
adaptive management.

Local Costs Adjustment
All costs were updated to reflect the most recent costs contained in the information provided for each
project. In cases where more up-to-date local information was not available, the default values used in
the HRSSP report were utilized. For the new cost categories, engineering estimates were used if specific
project data was not available (same approach as HRSSP).

Effectiveness
Each of the selected project sites is situated in a diverse environment; however, all share the common
objective of reducing shoreline/edge erosion. Several of the projects attempt to do this by lining the edge
with an erosion resistant material (coir roll and/or stone). The others attempt to reduce the incident
energy (typically wave) before it reaches the shoreline. The effectiveness of the projects was evaluated
by measuring how well they 1) stabilize the edge and 2) reduce wave energy.

A two-year field campaign spanning fall 2018 to spring 2020 focused on monitoring the effectiveness of
each site is detailed below. The field campaign included at least biannual surveying of the shoreline and
water level/wave attenuation data collection (at the sill and breakwater sites). Data collection campaigns
were performed on the following schedule: fall/winter 2018 (F/W 2018), spring/summer 2019 (S/S 2019),
fall/winter 2019 (F/W 2019) and spring/summer 2020 (S/S 2020).

Shoreline Stability
One of the most common engineering objectives of living shoreline projects is to reduce erosion along
exposed shorelines, while at the same time preserving or creating habitat. The effectiveness of a
particular project can be determined by comparing the shoreline change rate at the location of interest
and a nearby control site, to the historical shoreline changes. Comparing post-construction changes to
historical changes provides information as to whether conditions are improving, while comparing to an
adjacent site puts this information into context with changes occurring in the system as a whole. In other
words, if things have improved, is it due to the project, or a change in the conditions experienced
throughout the larger system. Surveys intended to capture both the temporal and spatial context are
commonly referred to as following the BACI (Before, After, Control, Impact) approach (Yepsen et al.,
2016).

Shoreline stability has been evaluated over the duration of this project using a combination of RTK GPS
(real-time kinematic global positioning system) surveying and UAV (unmanned aerial vehicle; or drone)
imagery. Shorelines, vegetation lines, and/or the extent of any vertical scarps at some project sites were
tracked using RTK GPS and used to supplement the UAV imagery collected at all sites. Images captured

 6|Page
by the UAV were post-processed using a technique called Structure from Motion (SfM) to derive
orthomosaic images and surface elevations from which Digital Elevation Models (DEMs) were
constructed. This technique is considered complementary to the RTK GPS technique as there are some
limitations related to dealing with dense vegetation in the imagery. The RTK GPS (applicable only at
Berkeley Island and Matts Landing) and UAV surveys collected during the study are detailed in Table 4. All
surveys were performed at low tide to capture the greatest amount of exposed intertidal area.
Table 4: Unmanned aerial vehicle survey dates for the five project sites. Real-time kinematic global positioning system (RTK GPS)
 data were collected simultaneously at some locations.

Historical Imagery Analysis
To better understand the effectiveness of the living shoreline projects, it is necessary to consider them in
the context of the historical changes that occurred before the installation of the project. Information on
the historical changes at each site was obtained by analyzing Google Earth images. Prior to using each
image, a quality control check was performed. Poor quality images, or images where the shoreline was
not clearly visible, were not included in the analysis and only “good” images were analyzed. It should be
noted that even the better-quality images need to be interpreted cautiously, because imagery taken at
different times of the year or different stages of the tide will often be misleading. The results presented
in the report are based on the subset of images that are considered most representative.

At each site, baselines were established for both the project and control sites. These baselines were
situated such that, despite fluctuations, the shoreline would rarely, if ever, intersect the baseline.
Perpendicular transects were defined at regularly-spaced intervals along these baselines. For each
acceptable image, the distance between the baseline and the shoreline was measured and recorded at
each transect. Specific information on each baseline, transect spacing, and shoreline identification are
given in the results section for each project site.

Drone Imagery Analysis
The high-quality high-resolution orthomosaics produced from the UAV imagery collected at low tide were
analyzed using a similar approach as detailed for the historical imagery. The same project and control
baselines were used, and in most cases the same transects and methodology for choosing the shoreline
were used. At sites where additional RTK GPS data were available, it was used to aid in the determination
of the shoreline at that site.

Combined Shoreline Stability Analysis
For all sites, the pre-construction shoreline stability analysis is based entirely on the results obtained from
the analysis of historical Google Earth imagery. For two of the most recently constructed projects
(Strathmere and Gardner's Basin), the post-construction trends are based solely on the analysis of UAV
imagery collected as part of this study. For the other three projects (Berkeley Island, Gandys Beach, and

 7|Page
Matts Landing) the post-construction” analysis includes a combination of historical imagery collected after
the project’s installation and the UAV images collected as part of this project.

To summarize the changes over time, a linear least-squares regression was used to find the pre- and post-
installation rates of shoreline change at each transect. These values were averaged across the site to
determine the average shoreline change rate for both the project site and the control site. Standard
deviations were also calculated to provide an estimate of the longshore variability of the shoreline
changes.

Wave Attenuation
Three of the selected projects (Berkeley Island, Gandys Beach, and Gardner’s Basin) include offshore
structures intended to reduce wave energy at the shoreline. At these sites, wave attenuation was selected
as a second measure of effectiveness. Sills and breakwaters function by attenuating wave energy prior to
it reaching some landward feature such as a beach or marsh edge. For each of the sites containing a sill
or breakwater (Gardner’s Basin, Berkeley Island, Gandys Beach), waves were measured both offshore and
inshore of the wave attenuation structure. Ocean Sensor Systems Wavelogger IIIs (waveloggers) were
used to measure total water level at a sampling frequency high enough to extract the wave climate in
post-processing. A typical wave sampling transect is shown in Figure 2. As illustrated in the figure, it was
common for there to be no water at the inshore wavelogger during periods of low tide. During these
periods, inshore waves could not be measured, and wave attenuation statistics could not be calculated.
The actual duration of each data collection period was based on the expected dominant contributor to
wave energy at each site. Table 5 summarizes the deployment and retrieval dates for wave data collection
at each of the sites throughout the study period.

 Figure 2: The effectiveness of a sill or breakwater can be evaluated by measuring the waves both in-front-of (offshore) and
 behind (inshore) the sill or breakwater to calculate effectiveness at attenuating waves under various conditions. Above shows
two Wavelogger IIIs deployed at Berkeley Island, NJ, for such purpose in January 2019. The waveloggers are mounted to posts,
 which are pounded into the ground.

 8|Page
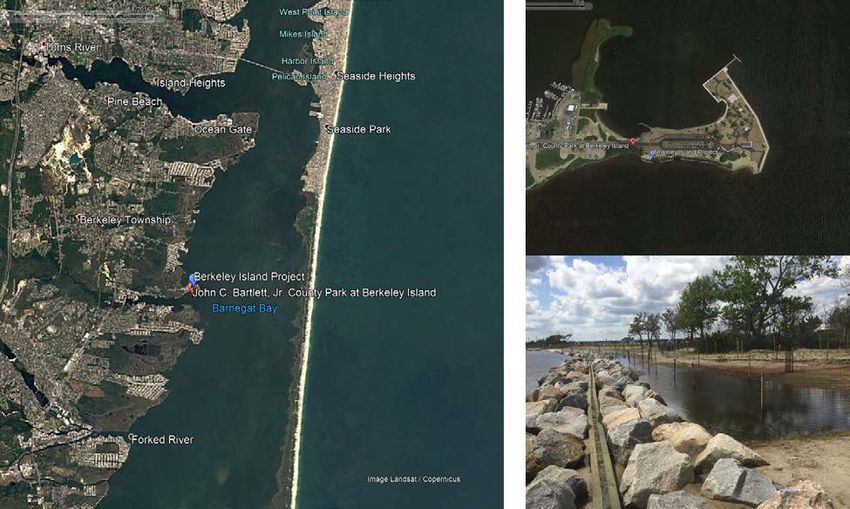
Table 5: Wave attenuation data collection dates. Two datasets were collected at Berkeley Island during the spring/summer of
 2019; they are differentiated in name as A and B.

During each instrument deployment, the waveloggers sampled at a minimum of 10 Hz for 59 minutes
every hour. The near-continuous water-level time-series at each location were divided into synchronous
18-minute bursts starting at minute 1:30, 21:30, and 40:30 during post-processing. These bursts were
processed to remove the tidal signal. A 60-second moving average was used on each burst to approximate
the mean water surface, which was then subtracted from the readings. The moving average filter shortens
each burst to 17 minutes. Once the mean water level was removed, a zero upcrossing approach was used
to identify individual wave events. Wave statistics were calculated for each burst including both
significant wave height (average of the highest 1/3rd of the measurements) and maximum wave height.

Wave attenuation can be reported in several ways. In this analysis, attenuation is presented as percent
reduction, which is defined as:
 −
 = 100

where Ho and Hi are the wave heights offshore and inshore of the structure, respectively. Waves
measuring less than 1 cm were not included in the analysis as they are near the sensitivity limit of the
instruments. At Berkeley Island and Gandys Beach, the percent reduction calculation was based on the
significant wave height for each sampling period. At Gardner’s Basin, the maximum wave height during
each sampling period was used instead, because the majority of the wave energy is related to boat wakes.
Boat wakes are episodic events, which would not be accurately represented by an average wave height
statistic such as significant wave height.

Berkeley Island County Park
Site Description
Berkeley Island is located in Berkeley Township along the western shore of Barnegat Bay in Ocean County.
Originally an island, the landmass that is currently home to the John C. Bartlett, Jr. County Park was
connected to the mainland at some point between 1956 and 1963 (Miller et al, 2014). In the early 2010’s
Ocean County began to develop plans to restore several eroding shorelines within the park. Of immediate
concern was the southern facing shoreline, which by 2010 had eroded to the extent that it was threatening
the main parking lot. Rather than simply constructing a bulkhead or placing riprap along the shoreline,
the county collaborated with the NJDEP and Stevens to develop one of the first large scale living shoreline
projects in a moderate-high energy environment in the state. Stevens developed a conceptual design for
a stone sill structure with several gaps using their engineering guidelines (Miller et al., 2014). The county
then worked with their consulting engineer (T&M Associates) to refine and ultimately build the project.
During the design phase, the consulting engineer identified extremely unstable subsurface conditions
during its geotechnical investigation. The creative solution proposed and ultimately constructed by the
design engineer was to introduce a low-crested wooden bulkhead spine. The spine runs through the

 9|Page
middle of the original stone sill and ensures that if the rocks settle over time, the structure will still
dissipate enough energy to prevent the interior shoreline from eroding. Several of the gaps were also
modified during construction based on observed erosion. A site location map and project photos are
presented in Figures 3 and 4; additional site photos can be found in Appendix C.

Cost Analysis
The costs for the Berkeley Island project were not made available; however, T&M Associates provided the
costs for a similar structure built at Iowa Court in Little Egg Harbor Township. T&M was the design
engineer for both projects, and the design for the Iowa Court project was nearly identical to that used at
Berkeley Island. Therefore, it is expected that the costs for the Iowa Court project can be considered
representative of the type of structure constructed at Berkeley Island. The costs for the Iowa Court project
are provided in Table 6, and represent costs billed by the contractor. Minor adjustments were made to
remove costs clearly associated with repairing the roadway, which was also part of the Iowa Court
contract. On the surface it appears as though materials represent the bulk of the cost; however, labor is
likely included in several of the lump sum cost items. As the project is recently constructed, no
information is available regarding maintenance or adaptive management. In comparison to many of the
other projects, monitoring represents a significant cost component, as both pre- and post-construction
monitoring are included in the total project cost.

 Figure 3: Site map and project photo of the Berkeley Island living shoreline site.

 10 | P a g e
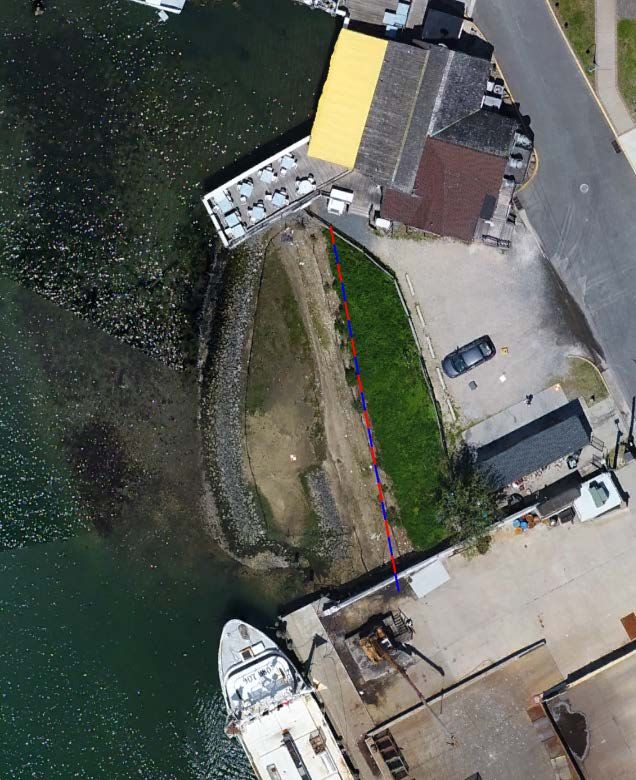
Figure 4: Google Earth Image (May 2019) showing Berkeley Island County Park, Berkeley Township, NJ, at two scales. The red
and blue lines on the left in the top image are the baseline for the control area of the shoreline stability analysis. The red and
blue line, landward of the breakwater/sill structures, is the baseline for the project area used in the shoreline stability analysis.

 11 | P a g e
Table 6: Berkeley Island living shoreline project costs. LS – Lump Sum.

Long-term Cost Estimate
The long-term cost estimate for the Berkeley Island/Iowa Court project is given below in Table 7. Of the
five living shoreline projects evaluated in this study, Berkeley Island was the most expensive overall, and
the most expensive per linear foot due to the complexity of the project. As the project contains elements
of both a conventional rock sill as well as a wooden bulkhead, the long-term cost analysis reflects that.
Damage costs are assumed to be associated with replacing or moving rock and vegetation during storms
with a longer than 40-yr return period. Due to the bulkhead core and rock exterior, the Berkeley island
project is not expected to experience significant ice damage and annual maintenance is anticipated to be
minimal. A key factor increasing the long-term cost of the Berkeley Island project is deterioration of the
wooden bulkhead, which is expected to need replacement at some point during the 60-year period
considered.
 Table 7: Long-term cost estimate for the Berkeley Island living shoreline project. Ext – Extended.

 12 | P a g e
Effectiveness
Shoreline Stability
Transects perpendicular to the pre-defined baseline (shown in Figure 4) used in the Berkeley Island
shoreline stability analysis were spaced at 25-foot intervals. The shoreline feature selected for analysis at
this location was the wet/dry line, where available, and, otherwise, the vegetated edge. The vegetated
edge is particularly relevant/useful in areas of marsh erosion and scarp formation. The shoreline
identified as the control area is located to the east of the project area. Figure 5 and Figure 6 show the
pre- and post-installation shoreline positions at each transect relative to the project and control baselines.
Figure 5 illustrates that before installation of the living shoreline project, changes throughout the area
were relatively homogenous with the exception of the eastern tip of the area; in this location, there is a
hardened edge where no change is observed. Figure 6 shows that that there is an initial adjustment of
the shoreline to the project in the project area (May 2018 to June 2019), after which the shoreline
stabilizes. This commonly occurs during/immediately after the construction of nearshore structures, as
the sediment adjusts to the presence of the structures. In the case of segmented breakwaters, it is typical
for the shoreline to accrete behind the structure and retreat to a stable position behind the gaps, as shown
in Figure 4.

 Project Area

 Control Area

 Figure 5: Pre-installation shoreline stability analysis for Berkeley Island County Park living shoreline. Analysis is based on
 historical imagery provided in Google Earth. Historical Imagery is shown as a solid line; drone surveys are shown as dashed
 lines.

 13 | P a g e
Control Area Project Area

Figure 6: Post-installation shoreline stability analysis for Berkeley Island living shoreline. Analysis is based on imagery collected
 by the UAV as part of this study. Historical Imagery is shown as a solid line; drone surveys are shown as dashed lines.

Shoreline change rates at the site are summarized in Table 8. The average rate of shoreline change in the
project area was found to be -1.7 ft/year (erosion) prior to the project installation and 0.0 ft/year (stable)
after installation. This contrasts with the control site where the average rate of change was measured at
-3.1 ft/year (erosion) before project installation and -5.8 ft/year (erosion) after. These numbers indicate
that the project is having a positive impact on the shoreline, effectively stabilizing it during an otherwise
erosive period. The standard deviation of the shoreline change rates was also calculated and is presented
in Table 8. The larger values after project construction are thought to be related to the adjustment
process as the shoreline strives to find a new equilibrium to a non-uniform structure.
 Table 8: Summary of the Berkeley Island shoreline stability analysis for the project and control areas both before and after the
 installation of the project in 2017. Negative rates of change represent net erosion of the shoreline. Standard deviation is a
 measure of uniformity with low values indicating the changes are uniform across the site and large values indicating a high
 degree of variability.

Overall, it appears as though the living shoreline project at Berkeley Island has been successful in
stabilizing the shoreline in the project area, essentially stopping the retreat of that shoreline inshore of
the structure while the unprotected area (i.e., the control area) continues to retreat. The variability seen
in the rate of change post-installation in both the control and project areas is likely an adjustment of the
shoreline in response to the structure. At least in the short term, it is expected that the control area will

 14 | P a g e
continue to erode, and the project shoreline will remain stabilized. In order to more fully understand how
the project will maintain its functionality given projected rises in sea level and increased storminess,
continued monitoring is required

Wave Attenuation
Water level measurements for calculating wave attenuation were collected offshore and inshore of the
sill at Berkeley Island County Park over five data collection periods as detailed in Table 5. An example of
the results for one of the five deployments is shown below in Figure 7. The complete results for all
deployments appear in Appendix B. During the F/W 2019 deployment shown in Figure 7, 43.4% of the
wave heights (significant) recorded offshore of the breakwater exceeded 5 cm, and 23.63% of the waves
exceeded 10 cm. This deployment includes a significant wave event on October 31 - November 1 that
clearly illustrates the wave attenuation capability of the structure. The average percent reduction during
the F/W 2019 deployment was 42.7% overall and 51.4% when the offshore wave heights exceeded 5 cm.

 Figure 7: Significant wave heights, percent reduction and inshore water level for Berkeley Island during the fall/winter 2019
 monitoring period. All percent reduction values are shown in gray, and purple stars were added to highlight periods when
 offshore significant wave heights exceeded 5 cm.

When considering data collected during all five Berkeley Island deployments, on average 42.5% of the
offshore wave heights exceeded 5 cm and 16.2% exceeded 10 cm. The distribution of the percent
reduction values during all five of the deployments is summarized in the histogram shown in Figure 8. All
waves were positively attenuated at Berkeley Island during all deployments. The average percent
reduction measured during the study was 48.8%, with over half of the values falling between 25% and
75%. The distribution of the percent reduction values during only the larger wave events (offshore

 15 | P a g e
significant wave heights greater than 5 cm) is additionally shown. The average percent reduction for just
these larger wave events was 52.1%.

Figure 8: Histogram describing the distribution of percent reduction values at Berkeley Island during all deployments for offshore
 significant wave heights greater than 1 cm (gray) and greater than 5 cm (purple).

Gardner’s
Site Description
Gardner’s Basin is located on the waterfront in the northwestern corner of Atlantic City. Located just off
of Absecon Inlet, the basin itself is home to the Atlantic City Aquarium, and a variety of recreational and
commercial businesses. Among these are a number of recreational boating and commercial fishing
businesses. The majority of the shoreline within Gardner’s Basin is bulklheaded to support these interests.
In 2016, Atlantic City collaborated with the NJ DEP to construct a living shoreline project to reduce flooding
and protect the shoreline along one of the last remaining non-bulkheaded shorelines within Gardner’s
Basin. The project, which was funded by the town with a grant from the National Fish and Wildlife
Foundation (NFWF) administered by the New Jersey Department of Environmental Protection (NJDEP),
resulted in the construction of a low crested sill, planted marsh, and berm. The sill design at the site is
unique in that it incorporates a gap and sloping beach section to preserve access for horseshoe crabs,
which were found in abundance during site visits. A site location map and project photos are presented
in Figures 9 and 10; additional site photos can be found in Appendix C.

 16 | P a g e
Figure 9: Site map and project photo of the Gardner’s Basin living shoreline site.

 17 | P a g e
Figure 10: Orthomosaic from Imagery collected on May 7, 2020, showing Gardner’s Basin, Atlantic City, NJ. The red and blue
line located landward of the sill is the baseline for this project site that was used in the shoreline stability analysis. There is no
 suitable control area for this project site as the surrounding region is bulkheaded and developed.

 18 | P a g e
Cost Analysis
Cost data for the Gardner’s Basin living shoreline project was taken from a budget prepared by the project
engineer, Arthur W. Ponzio and Company Associates. The budget included a basic breakdown of costs
related to the construction of the project. The total construction cost was estimated at $135,000 and was
split between the municipality and the NJDEP. Separate estimates were provided for design, permitting,
surveying, and construction management. Those costs were estimated at $39,000. All of the costs are
summarized below in Table 9. No information was provided on maintenance and adaptive management
costs.
 Table 9: Gardner’s Basin living shoreline project costs. LS – Lump Sum.

Cost information in the form of contractor bids was also obtained for a 1,000 linear foot conventional
bulkhead/revetment shoreline stabilization project for a second property within Gardner’s Basin. For
comparison purposes, that information was compiled and the average bid price for each item was
calculated. The results are given in Table 10.
 Table 10: Gardner’s Basin bulkhead/revetment project costs. LS – Lump Sum.

Long-term Cost Estimate
The long-term cost estimate for the Gardner’s Basin living shoreline project is given below in Table 11.
Consistent with the HRSSP analysis, the major damage cost is assumed to be associated with replacing or
rehandling rock during storms with a 40-yr or greater return period. Due to the potential for ice to form
in the basin and for the ice to displace some of the rocks and vegetation, 10% of the IC were assumed to
repair ice damage. The damage cost associated with ice formation is consistent with that used for the 40-
yr storm, as the impacts are expected to be similar. Consistent with the assumptions used in the HRSSP
analysis for sills, MCs of 10% of the IC were included for each period. This covers the cost of general site

 19 | P a g e
maintenance including trash removal and limited replanting of vegetation and rehandling of rock. While
MA costs were not provided, a nominal amount of 5% of the IC was assumed. Design and permitting costs
were taken from the engineer’s cost estimate and makeup approximately 8% of the long-term cost.
 Table 11: Long-term cost estimate for the Gardner’s Basin living shoreline project. Ext – Extended.

The long-term cost estimate for a nearby conventional shoreline stabilization project consisting of a
bulkhead and a revetment is provided in Table 12. The project was by far the most expensive of all the
projects reviewed, but also the longest. Few details on the structure other than the cost estimate were
provided. For the purposes of assigning costs, it was assumed that a revetment fronting a bulkhead would
protect the shoreline, and thus the structure would be very resilient. Damage costs of 5% of the IC,
potentially associated with scour and overtopping, were assumed during a 50-yr storm. MCs of 5% of the
IC were assumed during each period related to stone movement and general degradation of the materials.
MA costs as well as design and permitting costs were taken directly from the cost estimates provided. The
biggest post-construction cost is associated with the replacement of the steel bulkhead, which is assumed
to occur in Period 3.
Table 12: Long-term cost estimate for a nearby conventional shoreline stabilization project within Gardner’s Basin consisting of
 a bulkhead and a revetment. Ext – Extended.

 20 | P a g e
You can also read