An Authoritative Study on a New Approach to Enhance Traditional Project Risk Identification Process in a VUCA World - Master of Science (MSc) in ...
←
→
Page content transcription
If your browser does not render page correctly, please read the page content below
An Authoritative Study on a New Approach to Enhance
  Traditional Project Risk Identification Process in a
                    VUCA World

                   Agnes Ýr Gunnarsdóttir

                   Thesis of 30 ECTS credits
     Master of Science (MSc) in Engineering Management

                         June 2021
An Authoritative Study on a New Approach to Enhance
  Traditional Project Risk Identification Process in a
                    VUCA World
                                      by

                         Agnes Ýr Gunnarsdóttir

   Thesis of 30 ECTS credits submitted to the School of Science and
     Engineering at Reykjavík University in partial fulfillment of
                  the requirements for the degree of
            Master of Science (M.Sc.) in Engineering
                         Management

                               June 2021

   Supervisors:
   Dr. Helgi Þór Ingason, Supervisor
   Professor, Reykjavík University, Iceland

   Dr. Þórður Víkingur Friðgeirsson, Supervisor
   Assistant Professor, Reykjavík University, Iceland

   Examiner:
   Dr. Haukur Ingi Jónasson, Examiner
   Professor, Reykjavík University, Iceland
                                       ii
Copyright
Agnes Ýr Gunnarsdóttir
      June 2021

       iii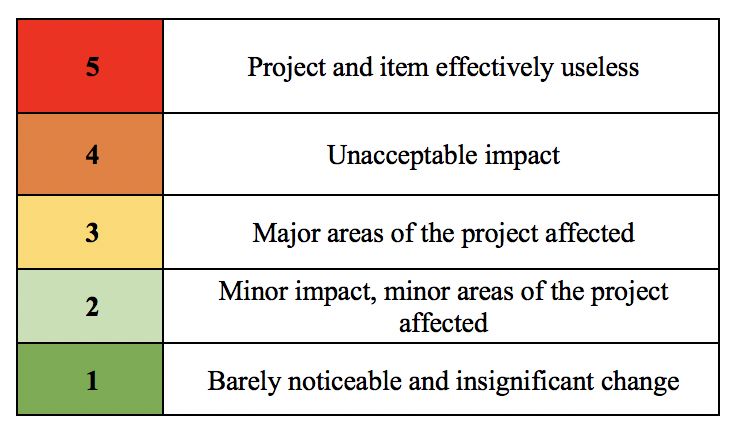
An Authoritative Study on a New Approach to Enhance
  Traditional Project Risk Identification Process in a
                    VUCA World
                              Agnes Ýr Gunnarsdóttir

                                     June 2021

  Abstract
  In this rapidly changing and fast-growing world, the level of complexity is
  constantly increasing. VUCA is often used to define the time people in this
  continually evolving world face times of volatility, uncertainty, complexity, and
  ambiguity. It results in a growing need for a more effective and extensive
  approach for identifying project risk. The purpose of this study is to test whether
  the VUCA meter recently presented by Fridgeirsson, Ingason, Jonasson, and
  Kristjansdottir can be developed to be a significant improvement on the
  conventional risk identification process.
  A qualitative research method was used in this study, where two workshops were
  set up, one based on traditional risk identification and assessment method
  currently in place. The other one was based on a VUCA meter designed based on
  VUCA. Five participants joined each workshop, and they answered predefined
  focus questions. The sample was carefully selected according to predefined
  criteria.
  The results clearly showed that the VUCA meter can be developed to be a
  significant addition to the current conventional risk identification process for big
  projects that are at an early stage. The VUCA method based on the VUCA meter
  gets people to think a little beyond this traditional framework used when
  identifying risk factors for a project and capture events that are not captured with
  the conventional method. The results did also show correspondence with the
  results and the literature review.

  Keywords: project management, risk management, risk identification, risk
  assessment, VUCA

                                         iv
Rannsókn á nýrri aðferð til að bæta áhættugreiningu við
aðstæður þar sem óstöðugleiki, óvissa, flækjur og óræði
                     eru ráðandi
                              Agnes Ýr Gunnarsdóttir

                                      júní 2021

   Útdráttur
   Í síbreytilegu umhverfi samtímans hefur flækjustig verkefna sífellt færst í
   aukanna. VUCA er hugtak sem oft hefur verið notað til að lýsa aðstæðum sem oft
   virðast raungerast; aukinn óstöðugleiki, óvissa, flækjustig og óræði. Þessi
   breyting verður til þess að fram kemur þörfin fyrir áhrifaríkari og víðtækari aðferð
   til að skilgreina og meta áhættu verkefna.
   Markmiðið með þessu verkefni er að kanna hvort VUCA mælinn sem þau Þórður
   Víkingur Friðgeirsson, Helgi Þór Ingason, Haukur Ingi Jónasson og Bára Hlín
   Kristjánsdóttir kynntu í nýlegri grein megi þróa þannig að hann geti bætt
   hefðbundið áhættugreiningarferli.
   Eigindleg rannsóknaraðferð var notuð við framkvæmd þessarar rannsóknar. Tvær
   vinnustofur voru haldnar fyrir eitt og sama verkefnið. Í annarri þeirra fór fram
   áhættugreining byggð á hefðbundinni aðferð. Í seinni vinnustofunni var sama
   verkefni tekið fyrir en þar var áhættugreiningin byggð á VUCA mælinum. Úrtak
   rannsóknarinnar var vandlega valið út frá ákveðnum fyrirfram skilgreindum
   viðmiðum.
   Niðurstöður rannsóknarinnar leiddu í ljós að VUCA mælirinn getur nýst sem
   áhrifarík viðbót við hefðbundið núverandi ferli áhættugreiningar fyrir stór
   verkefni á byrjunarstigi. Samkvæmt niðurstöðum rannsóknar fær VUCA aðferðin
   fólk til að hugsa út fyrir þann hefðbundna ramma sem notaður er við greiningu á
   áhættu verkefna og nær þar af leiðandi að fanga atburði sem ekki næst að fanga
   með hefðbundinni aðferð. Niðurstöður eru í góðu samræmi við það sem kom í
   ljós við fræðilega samantekt um viðfangsefnið.

   Efnisorð: verkefnastjórnun, áhættustjórnun, áhættugreining, áhættumat, VUCA

                                          v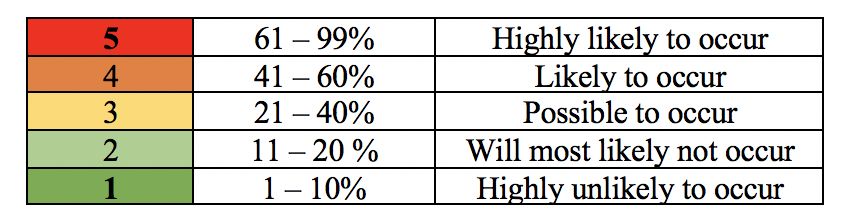
An Authoritative Study on a New Approach to Enhance
Traditional Project Risk Identification Process in a VUCA
                          World

                            Agnes Ýr Gunnarsdóttir

Thesis of 30 ECTS credits submitted to the School of Science and Engineering
               at Reykjavík University in partial fulfillment of
                     the requirements for the degree of
         Master of Science (M.Sc.) in Engineering Management

                                       June 2021

Student:

               Agnes Ýr Gunnarsdóttir

Supervisors:

               Dr. Helgi Þór Ingason

               Dr. Þórður Víkingur Friðgeirsson

Examiner:

               Dr. Haukur Ingi Jónasson

                                          vi
The undersigned hereby grants permission to the Reykjavík University Library to reproduce
single copies of this Thesis entitled An Authoritative Study on a New Approach to
Enhance Traditional Project Risk Identification Process in a VUCA World and to lend
or sell such copies for private, scholarly or scientific research purposes only.

The author reserves all other publication and other rights in association with the copyright
in the Thesis, and except as herein before provided, neither the Thesis nor any substantial
portion thereof may be printed or otherwise reproduced in any material form whatsoever
without the author’s prior written permission.

 date

 Agnes Ýr Gunnarsdóttir
 Master of Science

                                              vii
Acknowledgements
I would like to start by thanking my supervisors Þórður Víkingur Friðgeirsson and Helgi
Þór Ingason for their support and guidance throughout the process of writing this Master
thesis. I also want to thank all the people who took the time to participate in the research.
Last but not least, I would like to thank my family for their support throughout the process.
viiiContents
Acknowledgements .......................................................................................................... viii
Contents ............................................................................................................................... ix
List of Figures ..................................................................................................................... xi
List of Tables ......................................................................................................................xii
1 Introduction ...................................................................................................................... 1
1.1 Background ................................................................................................ 1
1.2 Aim and Objectives .................................................................................... 2
1.3 The Structure of the Thesis ........................................................................ 3
2 Literature review .............................................................................................................. 4
2.1 Risk Management in Projects ..................................................................... 4
2.2 Conventional Method for Risk Management ............................................. 5
2.3 VUCA......................................................................................................... 7
2.3.1 VUCA Definition ....................................................................................... 7
2.3.2 A VUCA World.......................................................................................... 9
2.3.3 VUCA and Risk Management .................................................................. 10
2.3.3.1 The VUCA Meter ...................................................................... 10
3 Methodology .................................................................................................................... 12
3.1 Research Approach................................................................................... 12
3.2 Research Design ....................................................................................... 13
3.2.1 Case Study Design.................................................................................... 13
3.3 Sampling ................................................................................................... 13
3.4 Data Collection ......................................................................................... 14
3.4.1 Workshops ................................................................................................ 15
3.4.2 Questionnaires .......................................................................................... 15
ix3.5 Conduct of the Research........................................................................... 18
3.6 Data Analyzing and Display..................................................................... 19
3.7 Quality of Research .................................................................................. 19
4 Results .............................................................................................................................. 21
4.1 Background Information .......................................................................... 21
4.2 Results from the Conventional Risk Identification Process ..................... 21
4.3 Results from the VUCA Risk Identification Process ............................... 30
4.4 Comparison of the Conventional and the VUCA Risk Identification
Processes 35
5 Discussions....................................................................................................................... 40
6 Conclusion ....................................................................................................................... 44
Bibliography ....................................................................................................................... 46
Appendix A: The VUCA meter ........................................................................................ 49
Appendix B: Scale for evaluating impact and likelihood of occurrence ...................... 50
Appendix C: Agenda for the workshops ......................................................................... 51
Appendix D: Workshops .................................................................................................. 52
Appendix E: Results – Conventional risk identification process .................................. 53
Appendix F: Results – VUCA risk identification process ............................................. 56
xList of Figures
Figure 3.1: Methods of data collection [25] ............................................................................14
Figure 4.1: Number of risk factors – Conventional risk identification method ......................23
Figure 4.2: Average likelihood of occurrence for each category ............................................24
Figure 4.3: Average impact for each category ........................................................................25
Figure 4.4: Risk assessment of risk factors in each category ..................................................27
Figure 4.5: Range in the evaluation of impact and likelihood for each category ....................29
Figure 4.6: Number of risk factors – VUCA risk identification method .................................33
Figure 4.7: Average impact of risk factors for each category .................................................33
Figure 4.8: Range in the evaluation of the impact for risk factors for each category .............34
Figure 4.9: Number of risk factors obtained using each risk identification method ...............36
Figure 4.10: Average range in the evaluation of impact and likelihood for each method ......38
Figure 4.11: Word cloud – results from the conventional risk identification process ............39
Figure 4.12: Word cloud – results from the VUCA risk identification process ......................39
Figure B.1: Scale for the likelihood of occurrence ..................................................................50
Figure B.2: Scale for the impact ..............................................................................................50
Figure C.3: Agenda for the workshops....................................................................................51
Figure D.4: The conventional risk identification workshop ....................................................52
Figure D.5: The VUCA risk identification workshop .............................................................52
xiList of Tables
Table 4.1: Risk factors that can impose operational risk.........................................................22
Table 4.2: Risk factors that can impose financial risk .............................................................22
Table 4.3: Risk factors that can impose legal and regulatory risk ...........................................23
Table 4.4: Risk factors that can impose strategic risk .............................................................23
Table 4.5: Nine risk factors having the highest value of likelihood of occurrence .................25
Table 4.6: Around ten risk factors having the highest value of impact ...................................26
Table 4.7: Ten risk factors having the lowest likelihood of occurrence..................................28
Table 4.8: Ten riskiest factors for the project according to the conventional method ............29
Table 4.9: Risk factors related to volatility .............................................................................30
Table 4.10: Risk factors related to uncertainty ........................................................................31
Table 4.11: Risk factors related to complexity ........................................................................31
Table 4.12: Risk factors related to ambiguity .........................................................................32
Table 4.13: The riskiest factors for the project according to the VUCA method....................35
Table 4.14: Risk factors only captured using the conventional risk identification method ....36
Table 4.15: Risk factors only captured using the VUCA risk identification method..............37
Table A.1: VUCA meter [5] ....................................................................................................49
Table E.2: Results from the conventional risk identification workshop .................................53
Table F.3: Results from the VUCA risk identification workshop ...........................................56
xiiChapter 1
1Introduction
1.1 Background
The world we live in is constantly changing, becoming faster and riskier. More and more
unexpected events occur; changes in politics and businesses are examples of occurring
changes. A study by Bennett and Lemoine [1] states that we live in a VUCA world, where
volatility, uncertainty, complexity, and ambiguity prevail.
In this rapidly changing environment, the need for a comprehensive risk
identification process has become more remarkable and more significant in any project
preparation [2]. The conventional risk assessment model has two key variables to
evaluate, the likelihood of the occurrence and the impact the risk event would have if it
occurs. These two values are then used to rank the possible risk events to determine the
most significant risk events [3].
However, studies, such as Ackermann et al. [4], mention that the conventional
approach used to identify and assess risk is too narrow and might not detect a “wider set
of risks”. For instance, it is questionable that the conventional approach would detect a
low probability and high impact risk event like the COVID-19 pandemic. This requires
further considerations of whether a traditional risk identification and assessment can be
improved to ensure it covers all possible risk factors, not only risk factors that score high
in the likelihood of occurring and the impact.
In a recent study by Fridgeirsson et al. [5], they discussed the rapidly growing need
to strengthen the conventional method used to identify and assess project risk. That is
1due to its limitations to risk factors having a low probability of occurrence but a high
impact on projects and events that are more psychological and social than technical. In
response to this need, they presented the VUCA meter, intended to complement the
conventional risk identification and assessment. The meter is based on the VUCA
concept explained later in this text, which stands for volatility, uncertainty, complexity,
and ambiguity. The VUCA meter endeavors to investigate the VUCA’ility of the project.
An example could be a search for items that pertain to the volatility of a particular project,
the uncertainty, etc. In short, the VUCA meter is designed to measure project risk with
VUCA as a point of view.
1.2 Aim and Objectives
This research aims to test whether the VUCA meter can improve the conventional risk
identification process. It was done by selecting one large project currently under planning
and test the VUCA meter by using workshops as a research method. People involved in
the chosen project were divided into two workshops. Several focus questions were
designed for each workshop. The purpose of the first workshop was to perform a risk
identification and assessment based on the traditional framework presented in The
Standard for Risk Management in Portfolios, Programs, and Projects [3]. The purpose of
the second workshop was to perform a new method for identifying and assessing risk
based on the VUCA meter presented by Fridgeirsson et al. [5].
The hypothesis of this study is as follows: The application of the VUCA meter will
add value to the risk identification procedure currently in place as projects are prepared
and planned.
The results of the workshops were compared and evaluated if the hypothesis is
valid or should be rejected. The study will indicate if the VUCA meter can be developed
to be a significant improvement on the risk identification process in times of volatility,
uncertainty, complexity, and ambiguity. Moreover, the study will mature the VUCA
meter, e.g., by improved semantics that capture essential risk factors that would arguably
be undetected.
21.3 The Structure of the Thesis
The thesis starts with an introductory chapter where the topic and the hypothesis are
introduced. The following chapter includes a literature review of the subject where
previous scientific research studies are examined, and the conventional risk
identification process is defined theoretically and the new VUCA method. In the third
chapter, the methodology used in this thesis is described and how the research was
conducted. In the following chapter, the results are analyzed and presented. In chapter
five, the results are discussed, and finally, there is a conclusion where possible further
research of the topic will be addressed.
3Chapter 2
2Literature review
This literature review chapter further introduces the terms discussed in this thesis and
previous scientific research studies related to the terms. The focus is on risk management
in projects; the conventional risk identification and assessment method and the VUCA
concept will be discussed. The VUCA concept will be addressed both by itself and how
it has been linked to risk management. The aim is to understand risk management in
projects and how VUCA can be related to risk management by outlining existing
researches.
2.1 Risk Management in Projects
Projects have become highly intricate due to rapid changes in a complex business
environment. Therefore, risks can be hidden in many areas. The risks can be associated
with many different parts of the project, the technical part, the cultural part, the social
part, or the organizational part. Consequently, risk management is becoming a more and
more essential part of preparing a project, and there is an increased demand for a quick,
intelligent, and cheap solution [2].
Several techniques are used to identify risk factors for projects, such as
brainstorming methods, workshops, diagramming techniques and other methods. No
matter what approach is chosen to identify risk events for projects, the most important
aspect is to ensure that the participants are clear about what to identify [6]. In existing
scientific researches, it has been discussed how vital risk management is as a part of
project management [7], [8]. All the tools and techniques used in risk management for
projects are designed to help ensure that the project's delivered results are as expected and
4within identified constraints for the project. In the generic life cycle of projects, it is
considered most effective when the risk events are identified and dealt with at an early
stage of the project to be able to avoid big problems occurring in the process and to be
aware of the risk events throughout the process [2]. In the recent study by Fridgeirsson et
al. [5], they also argued for the importance of identifying the risk at the beginning of
projects. It allows the project managers and decision-makers to respond appropriately
during initial analysis when shaping the project and making decisions. Making the wrong
decisions when preparing the project can be costly and cause problems in executing the
project.
Morris et al. [8] argues for the seven characteristics of project management; the first
one is the interest in the theoretical part of project management and the history. Secondly,
he argues for being aware of and realizes the importance of the project context, for
example, societal context and sectoral enterprise context. The third one is to understand
the linkage between firms and projects, and the fourth is to understand how strategy and
projects are related and how projects are used in innovation in the future. The
characteristic number five of project management is to appreciate governance and control
to ensure the resources are used effectively. The sixth is to understand leadership and
behavior in creating trust and shaping projects. In the seventh and last characteristic, he
argues for seeing the project as a cross-firm relationship that must face uncertainty,
novelty, and particular challenges of learning and knowledge integration that can be
complex and risky. The last characteristic is the one that has the most to do with this
study, and there is a special interest in looking at that one.
2.2 Conventional Method for Risk Management
There is a specific process that is generally gone through when conventional risk
management is applied to a project. The process is mainly divided into six steps, and it
starts with an identification process, where all possible risks that can have a negative
impact on the project are identified. Then the potential risk events are analyzed, and a risk
assessment is performed to determine which factors are the riskiest ones for the project.
Then a strategy and actions are developed and implemented to act against the risk. The
fourth step of the process is to monitor and control the risk. The final step is to support
risk management, for example, with periodic project- and risk meetings [9]. For this
study, the interest is mainly in the beginning of the risk management process, where the
risk events are identified and assessed. The risk identification process is when the project
5risks are identified using tools and techniques such as expert judgment, data gathering,
data analysis, interpersonal and team skills, prompt lists, and meetings. A large part of
those involved in the project can contribute to the risk identification process, such as the
project team members, customers, project manager, operations managers, stakeholders,
end-users, and of course, the project risk specialist if assigned. Generally, the risk
assessment is done by assessing the likelihood of each risk event occurring and the impact
of each risk event [10].
According to The Standard for Risk Management in Portfolios, Programs, and
Projects [3], the evaluated likelihood of risk events and the impact the events may have
on the project are the two main variables used to assess the most significant risk events.
The impacts are evaluated by checking whether they are within the limit of the project
manager’s, the team’s accountability, and the project budget. It is also examined whether
the impacts of the risk events affect the ability of the organization to obtain or sustain the
expected benefits. The likelihood of occurrence is obtained by evaluating how likely it is
that the event will occur.
This conventional approach to assess risk as described above is disputed. As the
projects are getting bigger and more complex, their execution is getting riskier. Therefore,
there has never been more need for an effective approach to managing project risk [11].
There are several scientific research studies where it is being argued that this approach
does not capture all the risk events that may affect the project, and significant risk events
may be overlooked by using this conventional risk assessment only [4], [5], [12].
Cirillo and Taleb [12] published an article arguing for the tail risk of contagious
diseases. They discussed that the risk events that are not likely to occur are rare but have
a huge impact are the risk events that shape our world. This type of risk event is identified
as “tail risk” referring to events that befall several standard deviations from a mean of a
statistical distribution. These events are unlikely to be captured using the conventional
risk identification and assessment approach, despite their severe impact on the project.
That is because the likelihood of events to occur is one of the critical variables in the
calculation when assessing the most significant risk events for the project.
A case study was published online in 2007 [4], where the systemic risk assessment
is discussed. The authors argue that the most attention in the systemic risk assessment is
paid to the technical risk in projects, not other risk categories, such as political risk,
6customer risk, partner and supplier risk, people risk, reputation risk, market, and financial
risk. These categories are often known as soft categories, and technical risk is one of the
traditional hard categories. However, based on the forensic analyses conducted by the
authors, the soft categories can often have as much or even more impact on the project
than the hard categories, which attention is paid to in the conventional risk assessments.
Therefore, there is a need for impressive changes to the traditional risk identification
method to improve the method and expand the horizon of those attempting to assess risk.
There is not only an argument for the wider range of risk categories but also the
importance of understanding the interaction between the risk categories, their impact on
another. When one risk category impacts another, it can lead to a network of interrelated
possible risk events. Therefore, the impact of the network can be greater than the sum of
the parts because the occurrence of one risk event may lead to an increase in the likelihood
of other risk events occurring. Their response to this limited range of risk categories is a
tool called “Risk filter”, which is used to create a framework for investigating future
projects and identifying areas of risk areas.
2.3 VUCA
This subsection aims to define the subject called VUCA, a VUCA world, and the VUCA
meter. The definition of VUCA used in this study will be based on Bennett’s and
Lemoine’s definition in an article published in 2014 [1]. After defining the VUCA
concept, and the VUCA world, the VUCA meter presented in the study by Fridgeirsson
et al. [5] will be described.
2.3.1 VUCA Definition
The VUCA term was first cited in 1987 in Army War College and did not become popular
in strategic and leadership research until around 1990 [13]. The VUCA acronym stands
for volatility, uncertainty, complexity, and ambiguity. The third concept of VUCA has
received considerable attention, the complexity of projects [14]. However, it has been
challenging for researchers to define project complexity [5].
In 2011 Geraldi, Maylor and Williams published an article where they reviewed the
complexities of projects systematically and point out that complexity is a key variable
that impacts decisions in project management. The type of complexity that is mentioned
7most often is structural complexity. Still, uncertainty is a relevant type of complexity and
is one of the four concepts VUCA consists of. Since 1920, the internal connection
between uncertainty and risk has been present [15]. In 2004 Linehan and Kavanagh
defined projects as a confusing phenomenon that contains a lot of complexity and
ambiguity, and the idea of a single clear goal is not realistic [16]. Still, even though
complexity is such a challenging concept to study in project management, it is only one
of the four concepts VUCA consists of.
The four components of VUCA are defined based on Bennett’s and Lemoine’s [1]
discussions and definition in their article from 2014. Bennett and Lemoine define each
part carefully, as well as how to address them, and give clear examples to explain. Each
part must be addressed individually since they require a unique response. Definition of
each part of VUCA has been summarized as follows to understand what is behind this
acronym:
• Volatility: Unstable or unpredictable are words that can be used to define a
volatile situation. There are relatively unstable changes, or, more specifically,
there are frequent changes, and they can be unpredictable, but the situation is
understandable, and the information is available. The key to address volatility is
agility.
Commodity pricing is an example of volatility; there has for instance been much
volatility in jet fuel cost this last century.
• Uncertainty: Uncertainty is not like volatility, where changes are likely. The term
is used to describe a situation where there is a lack of knowledge and the impact
of changes is unclear. The cause and effects are known and understood. The key
to address uncertainty is information.
An example of uncertainty is terrorism; it is hard to know when and how.
• Complexity: Complexity is when no unpredictable changes occur. The network
of information is formed by many interconnected parts, and there is no lack of
crucial information like in uncertain situations. The amount of hard information
makes it complex to process them all. The key to address complexity is
restructuring.
8Doing business in foreign markets in a new country can be an example of
complexity due to complex laws, regulations, and more.
• Ambiguity: An ambiguous situation is where cause and effect are not understood.
Difficult to plan or predict due to lack of historical information. The key to address
to ambiguity is experimentation.
An example of ambiguity is the development that is taking place in technology,
for example the transition from printing everything out on paper to digital media.
When dealing with all parts of VUCA, it is crucial to understand them and see the
opportunities and threats in every situation. For example, to see the profit opportunity in
the volatility situation to see the uncertainty as an opportunity, to see the opportunity in
simplifying the complexity, and that ambiguity equals opportunity. In this context, it is
often discussed that we all live in this VUCA world together. Therefore, there must be an
understanding of these parts of VUCA [1].
2.3.2 A VUCA World
In the section above, each of the four components of VUCA is defined; in this section,
the VUCA effects and the forms the effects may appear in are explained along with
examples.
The year 2020, when the COVID-19 pandemic was imminent can be considered a
case that made VUCA more real for everyone, and it shows the evolution of the VUCA
world. The conditions that the world has had to deal with in the wake of the pandemic
affect all four aspects of VUCA. Volatility is everywhere due to the pandemic, and no
one knows what happens next or what to do next; there is a lot of uncertainty imminent.
Therefore, the situations are very complex, and it is hard to respond to them. No one
fully understands this pandemic, and ambiguity is prevailing [17]. The COVID-19
pandemic can lead to multiple paradigms shifts in the organization. The pandemic has
already resulted in very high unemployment and many stay-at-home orders [18], as
many businesses have received the stay-at-home order, which will probably be new
technology. Surveys show that a large proportion of those who have been sent home
want to keep working from their home [19]. The human resources strategy within
9organizations must be made to respond to such situations by ensuring safety for the
employees [20].
Social media is no less an excellent example of something instrumental in
developing the VUCA world. Rozgonjuk et al. [21] explained the concept of FOMO,
which stands for fear of missing out and is an effect of social media. It is believed to
significantly impact peoples lives, increasing the stress level and reducing people’s
attention at work. The reliability of the information received from social media should
also be kept in mind as fake news and conspiracy theories are considered as one of the
threats in todays society. Thus, social media can quickly increase the volatility and
uncertainty in the community [22].
2.3.3 VUCA and Risk Management
In an article by Szpitter and Sadowska [23], they argued for using the VUCA matrix for
assessing the risk in the project environment. All types of businesses face rapid changes
in the project environment that require differences in the approaches used by the project
manager and the project teams. In the study, it is pointed out that the classic process to
identify and analyze the project risk does not take into account the characteristics of the
environment. They propose to use the VUCA matrix to study the risk in the project
environment by identifying and divide the risk into four categories, volatility,
uncertainty, complexity, and ambiguity. Therefore, the impact of the risk event is seen
as a consequence of these four concepts VUCA consists of. The benefit of using the
VUCA matrix is to be able to see an opportunity to respond to each component of
VUCA.
2.3.3.1 The VUCA Meter
Fridgeirsson et al. [5], presented an alternative and complementary method to assess risk
based on VUCA. In this method, the risk is categorized in predefined risk groups related
to the assessed project. The VUCA’ility of the project is being investigated by
semantically pre-designed statements instead of searching for the risk events that can
affect the project by an open approach. The VUCA’ility of the project indicates which
of the VUCA concept does affect the project and how much impact they have.
10To measure the severity of each VUCA dimension of a project, they presented the
VUCA meter. The VUCA meter is defined as a questionnaire with closed questions,
where each question is having specific attributes referring to a VUCA scenario in the
project. A Likert rating scale is used for the answers, and the VUCA rating scale is a
five-point range that indicates the severity of each of the five subjects in each VUCA
concept [24]. It is also assumed that all the questions have the same weight on the total
score. The numbers indicate the following answers to the closed questions: (1) Strongly
agree, (2) Agree, (3) Neither agree nor disagree, (4) Disagree, and (5) Strongly disagree.
The evolution is based on the person answering the questions. Finally, the total average
score indicates how VUCA the project is derived by summing and averaging the scores
in each category. Using this method, project managers and decision-makers can allocate
limited resources more effectively [5].
The authors of the study have tested the VUCA meter already. It was tested by
choosing five project managers with extensive experience in leading large projects to try
it out on their projects belonging to one globally operating organization. All the projects
used to test the VUCA meter were sharing characteristics, including complex and
budget. They all also did involve project teams from different parts of the world. The
questionnaire was sent via email with a link to the project managers due to restrictions
in the wake of the pandemic COVID-19 that has been looming over the past year. The
data were collected through an online survey, and the interviews were not taken in
person. However, the project managers felt that the overall result of the questionnaire
gave a good picture of the project challenges and indicated clearly where they must take
a deeper look at the risks. Still, they did not think there is much value in a single
numerical score. As a result of their study, it can be valuable to use the VUCA paradigm
to evaluate risk and gather information. The study did also indicate that it can be
beneficial to use the VUCA meter in addition to the conventional risk assessment since
the VUCA meter can provide helpful information about the possible risk events and their
impact [5]. A detailed version of the VUCA meter can be found in Appendix A.
11Chapter 3
3Methodology
In this chapter the research approach and design are described and how the sample was
selected. The techniques used to collect data are discussed and how the research was
conducted. The way the data were analyzed and displayed is explained, and finally, the
quality of the research is evaluated.
3.1 Research Approach
The purpose of the research was to test whether the VUCA meter can improve the risk
identification process for projects by designing a risk identification and assessment
method based on the VUCA meter. Two workshops were conducted where two risk
identifications and assessments were performed for the same project with two different
methods. The main goal of the workshops was to obtain two types of risk identifications
for an extensive infrastructure project, carefully selected based on predefined practical
criteria. Firstly, a conventional risk identification where the main risk factors are
identified based on given focus questions and given specific values for the likelihood of
them occurring and the impact, they would have [3]. Secondly, a VUCA risk
identification based on the VUCA meter [5], where potential risk factors are identified
based on five focus questions for each part of VUCA and given specific values for the
impact they would have.
The research method used for this study was a qualitative method. There was a
choice between quantitative and qualitative research, but the qualitative method was
more appropriate. The main difference between these two research methods is that the
12study design in qualitative research is usually more flexible and more emergent than in
the quantitative method, which can often be more specific [25].
3.2 Research Design
The study design used in this research is a commonly used design in qualitative research
and is prevalent in quantitative research. A case study was used as a study design as this
research focuses only on one particular case.
3.2.1 Case Study Design
A case study is an approach where one particular case or few carefully selected cases
are studied in detail, and the focus should be on a bounded subject. In case studies, it is
assumed that the particular case that is being studied belongs to a specific type of
category. This single case can provide insight into events and circumstances prevalent
in this category of cases. The main focus in case studies is on exploring and
understanding [25]. The case in this research is the project that was selected.
3.3 Sampling
When using a case study as a research method, it is crucial not to select a random sample
for the research. It is essential to choose the sample carefully because it must provide as
much information as possible about the case [25].
It was decided to research by studying one project that meets all the criteria that
have been lined up. The reason for that it was decided to test the meter on one project,
not many is because it is possible to perform a more significant study with more depth
and precision using only one case instead of many due to limited time. A convenience
sample was used in this research; a convenience sample is a nonprobability or
nonrandom sampling where the sample is gathered using predefined criteria, which
means that not everyone has an equal chance to participate in the research [26]. The
sample in this research was based on predefined practical criteria. The criteria that were
kept in mind when a project was selected for the research were that the accessibility to
parties involved in the project is easy. The people involved in the project are willing to
participate in the research, see its benefit in participating, and are available in April 2021.
It was also important that the implementation of the project has not come very far. The
13project is at an early stage of the process, but a conventional risk assessment for the
project may be available.
One appropriate project was chosen to be risk analyzed and used to test the VUCA
meter. As previously mentioned, the project is an extensive infrastructure project that
meets all the predefined criteria. Those selected to participate in the research and attend
the workshops on behalf of the project were ten people working for the project and have
extensive knowledge about it. They were chosen carefully by a person in charge of the
project and care was taken that participants could be divided into two groups who had
similar knowledge of the project.
3.4 Data Collection
According to Kumar [25], it is important to use multiple methods to collect data when
using case studies as a study design. The methods used to collect data are usually divided
into primary data collected from primary sources and secondary data collected from
secondary sources, see Figure 3.1. The data for this research were collected from
primary sources as they were collected through questionnaires lined up for this research
with focus questions answered by people who attended two workshops.
Figure 3.1: Methods of data collection [25]
143.4.1 Workshops
When workshops are used as a research method, they are designed to fulfill the purpose
of the study and used as a tool to collect data about a certain subject [27]. Two workshops
were lined up for the research. The main goal of the workshops was to obtain two types
of risk identifications for the selected project, firstly the conventional risk identification,
which is the traditional one where the main risk factors are identified on the basis on given
focus questions and given certain rating scale for the likelihood of them occurring and the
impact they would have. Secondly, the VUCA risk identification method where the main
risk factors are identified based on five focus questions for each part of the term VUCA,
twenty questions in total and the questions were made based on the VUCA meter
presented in the study by Fridgeirsson et al. [5]. A group of ten people involved in the
project attended and were divided equally into these two workshops, and it was important
that no one participated in both workshops. It was done to prevent people from being
biased by one of the risk assessments when performing the other. The workshops were
well organized and were estimated to take around three hours each. It was made sure that
everyone had the opportunity to pre-prepare so that the workshops would run as smoothly
as possible.
3.4.2 Questionnaires
A questionnaire is one of the methods used to collect data for this research. According
to Kumar, it is important that the questions are understandable, clear and the layout
should be user-friendly and easy for the respondents to read. Two different
questionnaires were developed for the workshops in this research, one for each type of
risk identification [25]. The questionnaires may not have been like traditional
questionnaire. The questions that were written in each questionnaire were designed to
be focus questions for each workshop and each question was answered with multiple
answers, not one as is usually the case.
The questionnaire developed for the conventional risk identification was based on
the traditional method presented in The Standard for Risk Management in Portfolios,
Programs, and Projects [3]. The questionnaire is divided into four focus questions and
is answered by listing up factors that could be risky for the project related to each focus
question. The focus questions are:
15• What risk events can impose operational risk?
• What risk events can impose financial risk?
• What risk events can impose legal and regulatory risk?
• What risk events can impose strategic risk?
Then each risk factor is given value for the likelihood of occurring and for the
impact the factor would have if it occurs. The values given for the probability and the
impact are in the range of 1 to 5. The numbers indicate the following: (1) Very low, (2)
Low, (3) Medium, (4) High, and (5) Very high. More detailed information about the
rating scale can be found in Appendix B.
The questionnaire developed for the VUCA risk identification was based on the
VUCA meter presented by Fridgeirsson et al. [5], as previously mentioned. The
questionnaire is divided into four categories, where each category represents one of the
four concepts VUCA consists of and each consist of five focus questions, they are:
Volatility
• What complexity factors could lead to the need for many interfaces with
other technologies, projects or operations?
• What volatility elements could lead to the need for more resources than
expected?
• What from the perspective of volatility could cause the project to take
longer than planned?
• What volatility factors could impact solid contract situation throughout
the project timeline?
• What volatility factors could cause the need for major changes in the
objectives of the project?
Uncertainty
• What uncertainty factors could lead to the need for more information
about technology components of the project?
• What uncertainty factors could lead to the need for many stakeholders
from different time zones?
16• What could cause the access to information to be limited due to
uncertainty?
• What uncertainty factors could impact well defined and approved
scope?
• What uncertainty factors could impact well defined risk management?
Complexity
• What could lead to a complex political environment with many
regulations to follow?
• What complexity factors could lead to the need for many
subcontractors, organizational departments and cultural differences?
• What complexity factors could lead to the need for many interfaces with
other technologies, projects or operations?
• What are the factors of complexity making this a unique project not
done before?
• What complexity factors could make the decision-making not to be
straightforward?
Ambiguity
• What could cause the deliverables not to be as defined in the beginning
due to ambiguity?
• What ambiguity factors could cause the connections between tasks to
become unclear?
• What could lead to unexpected and unforeseen risk factors in an
ambiguity environment?
• What could cause hidden agenda due to ambiguity?
• What could lead to the need for unexpected/unknown stakeholders due to
ambiguity?
The questions are answered with appropriate risk factors and a number on the
scale of 1 to 5, which indicates how severe impact each factor would have on the project.
The same scale is used for evaluating the impact as in the questionnaire mentioned above
and can be seen in Appendix B.
173.5 Conduct of the Research
It was decided that the research would be conducted so that a group of people involved
in the project would be divided into two workshops. In one workshop, a traditional risk
identification and assessment was performed, and in the other workshop, the VUCA
method was used to identify and assess risk for the same project. This was done to
prevent the same people from performing both types of risk assessments. That is because
if the same people would have performed both assessments, it could give a wrong
impression of the results because the people could be biased by one of the assessments.
The research was performed on April 27th and 28th. Five people from the project attended
each workshop, four Icelanders and one Dane in each group. The Danes participated via
Zoom, which means that they needed to send the risk factors via Zoom and they had to
be written down on a post-it note on their behalf. The workshops were well organized
and scheduled, and they lasted for around three hours each. Each participant had
received a letter a few days before containing all the basic information about the
workshops, the workshop's objective, focus questions and the schedule for each
workshop. The questionnaires were not answered in the traditional way where each, and
everyone is handed a questionnaire to answer. A method was used where the focus
questions from the questionnaire were written on a board in the room where the
workshop took place. Then a post-it notes were used, and everyone wrote down their
suggested risk factors, and they were posted on the wall with the relevant focus
questions. In the conventional risk identification workshop, one focus question was
answered at a time, and then the answers were categorized before moving on to the next
focus question. When all five focus questions had been answered, the likelihood of
occurring and the impact were assessed for each risk factor obtained by answering the
focus questions. The assessments were done individually by each and everyone
participating in the workshop without consultation.
In the VUCA risk identification each category of VUCA, which consisted of 5
focus questions each, was answered at a time. After each category, the answers were
categorized within the category. When all categories had been answered, the impact was
assessed for each risk factor. It was done the same way as mentioned above and without
consultation.
The risk assessment had to be conducted in a different way for those who
participated via Zoom in both workshops. It was decided to send them an excel sheet
18with all the risk factors that came up on the white board and they were asked to evaluate
the risk factors afterwards. The schedule for the workshops can be seen in Appendix C
and pictures from the workshops can be seen in Appendix D, the pictures are blurred to
show respect to the participants.
3.6 Data Analyzing and Display
The data obtained from the study were analyzed by reviewing the answers to the
questionnaires. The main objective was to look at and compare the risk events obtained
using each risk identification method to see whether the hypothesis is valid or not. In
other words, to see whether the VUCA risk identification method can capture risk events
that the conventional risk identification method does not capture. Even though they can
have a significant impact on the project.
The data was analyzed by moving all the results obtained from both workshops to
excel. There they were processed and simplified as one event was found that covered all
the events that had been categorized together by the participants, etc. However, the data
was processed as little as possible in order to maintain neutrality. After the data had been
simplified and processed, it was possible to start viewing the results of the research
properly. It was done by analyzing the results for each workshop and by compare them.
There are many ways of displaying the data, but it is important when selecting a
method that the presentation of the data is clear and easy to understand [25]. For this
research, it was decided to use text and graphs to present the results. The graphics were
considered the best way to display the results obtained from the two workshops since it
is an effective way to display data clearly and visually in an easily understandable way.
3.7 Quality of Research
The quality of the research is based on its validity and reliability. The validity of the
research indicates how well the research is answering the research question. The
reliability indicates how reliable the research is by checking if the research tool is
consistent and stable. The research tool is reliable if it gives similar results when used
under similar conditions more than once. Several things can affect the reliability of
research, such as the wording of the questions and the mood [25]. The research
instrument in this research is questionnaires.
19The research is considered valid as both questionnaires are based on reliable
citations. One of the questionnaires is based on The Standard for Risk Management in
Portfolios, Programs, and Projects [3]. The other one is based on the VUCA meter
presented by Fridgeirsson et al. [5]. The questionnaires measure what they are supposed
to measure, and they meet the objective of the research, which is to receive these two
risk assessments to compare. The questionnaires were prepared and developed in
collaboration with the supervisors of this thesis, who are project management experts.
Among other things, they have experience in performing traditional risk assessments.
Still, they are also co-authoring the article where the VUCA meter is introduced, and one
of the questionnaires is based on.
20Chapter 4
4Results
In this chapter, the results from the research will be reviewed. Firstly, the participant’s
backgrounds will be discussed shortly, and then the results obtained from using each
risk identification method will be reviewed. Finally, the results will be compared.
4.1 Background Information
The participants in the research were divided into two groups, each group consisted of
5 people who are all participant in the project, therefore they have a very extensive
knowledge about the project. 80% of each group were Icelanders and 20% from
Denmark and living there, therefore they joined the workshop via Zoom. The majority
of participants were male. The gender ratio in the first workshop where the conventional
risk identification and assessment were performed was 20% female and 80% male. The
gender ration in the second workshop where the VUCA risk identification and
assessment were performed was 40% female and 60% male.
4.2 Results from the Conventional Risk Identification
Process
The conventional risk identification process had four focus questions, and the risk factors
were obtained by answering these focus questions. When the results from the
conventional risk identification process were viewed, it showed that all the risk factors
divided fairly between the focus questions. In total 52 risk factors were obtained using
the conventional risk identification method. When the number of risk factors obtained
in each focus question are viewed, it shows that 15 risk factors or 29% of the total
21You can also read