RAPID BENCHMARKING AT FONTERRA USING THE TRADE BEST PRACTICE BENCHMARKING METHODOLOGY - BPIR Blog
←
→
Page content transcription
If your browser does not render page correctly, please read the page content below
RAPID BENCHMARKING AT FONTERRA
 USING THE TRADE BEST PRACTICE
 BENCHMARKING METHODOLOGY

                            Authors:

     Rubab Malik, PhD Student, COER Massey University, NZ
  Rebecca Knapman, Senior Supply Chain Specialist, Fonterra, NZ
     Dr Robin Mann, Director, COER, Massey University, NZ

                         18 March 2018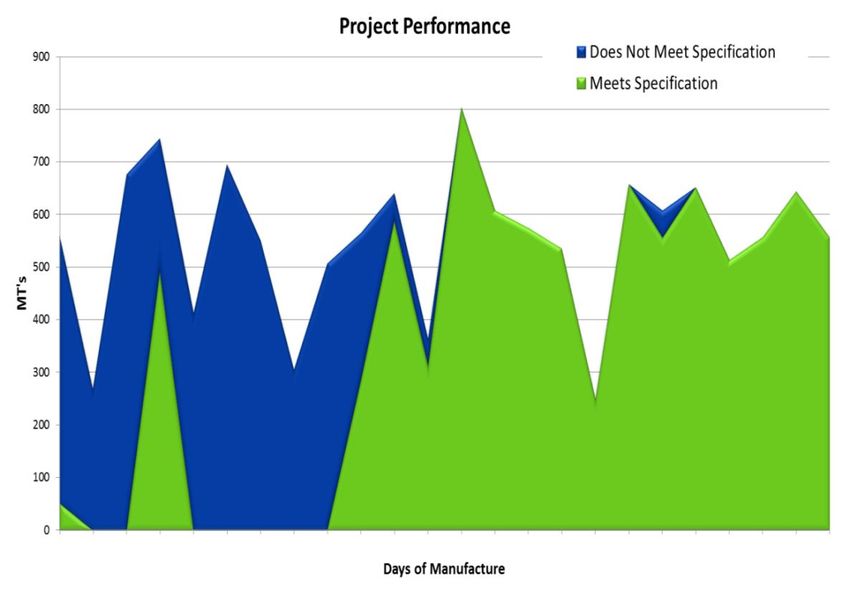
COER Research Report

                                         EXECUTIVE SUMMARY

This report describes how the TRADE Best Practice Benchmarking Methodology has been
used for rapid benchmarking by Fonterra, a multinational dairy co-operative and New
Zealand’s largest company. TRADE is a benchmarking methodology consisting of 5 stages;
Terms of Reference, Research current state, Acquire best practices, Deploy best practices and
Evaluate. The methodology is prescriptive in its approach with 5 to 9 steps for each stage of
TRADE. The methodology includes a project management system to guide users through a
project.

Normally the TRADE Best Practice Benchmarking Methodology is used for projects that
require a team approach with projects typically taking 2 to 5 months to identify best practices
and develop an implementation plan. The term “rapid benchmarking” is used for Fonterra’s
approach as Fonterra uses TRADE to identify best practices and develop an implementation
plan within 5 days.

This report describes how Fonterra organises the 5 days, provides three case studies showing
how rapid benchmarking was used and the results achieved, and describes the success factors
for rapid benchmarking.

A key reason for the speed and success of Fonterra’s rapid benchmarking projects has been due
to the skill-set and experience of the project facilitator in benchmarking, project management
and team dynamics. The facilitator was able to undertake a substantial amount of project
preparation work including the selection of benchmarking partners prior to the official start of
the project. Another key reason was the strong leadership support for the projects enabling the
selection of the right team members who could then dedicate 5 consecutive days towards the
project.

Published as a Centre for Organisational Excellence Research Report:
Malik, R. Knapman, R. and Mann, R.S. (2018). Rapid Benchmarking at Fonterra using the Trade Best Practice Benchmarking
Methodology. Centre for Organisational Excellence Research Report, Massey University, New Zealand.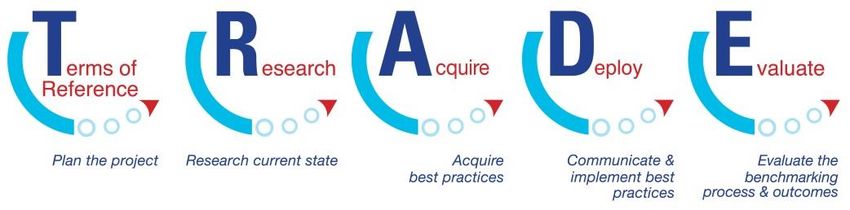
TABLE OF CONTENTS
1)     INTRODUCTION ............................................................................................................................... 1
2)     BENCHMARKING ............................................................................................................................. 1
     2.1      DEFINITIONS OF BENCHMARKING .......................................................................................... 1
     2.2      TYPES OF BENCHMARKING ..................................................................................................... 2
3)     OVERVIEW OF THE TRADE BEST PRACTICE BENCHMARKING METHODOLOGY.............................. 3
4)     DESCRIPTION OF FONTERRA’S RAPID BENCHMARKING APPROACH .............................................. 7
     4.1      INTRODUCTION TO FONTERRA ............................................................................................... 7
       4.1.1         FONTERRA’S IMPROVEMENT APPROACH ........................................................... 9
     4.2      FONTERRA’S RAPID BENCHMARKING APPROACH .................................................................. 9
       4.2.1         PREPARATION WORK (PRIOR TO DAY 1)............................................................ 10
       4.2.2         DAY 1: TERMS OF REFERENCE (MORNING) ....................................................... 15
       4.2.3         DAY 2 - RESEARCH AND ACQUIRE (MORNING) ................................................ 19
       4.2.4         DAYS 3 AND 4 - RESEARCH AND ACQUIRE ........................................................ 20
       DAY 5 - ACQUIRE (MORNING) ............................................................................................... 21
       4.2.5         FOLLOW ON WORK AFTER DAY 5 (DEPLOY AND EVALUATE) .................... 23
5)     FONTERRA CASE STUDIES ON RAPID BENCHMARKING ................................................................ 24
     5.1      CASE 1: BENCHMARKING OF EDENDALE AGAINST CLANDEBOYE ........................................ 24
     5.2      CASE 2: BENCHMARKING OF WYNYARD AGAINST HAUTAPU .............................................. 26
     5.3      CASE 3: BENCHMARKING PROJECT WITH AN AWARD WINNING AIRLINE ........................... 27
6)     DISCUSSION................................................................................................................................... 28
7)     CONCLUSION ................................................................................................................................. 30
8)     REFERENCES .................................................................................................................................. 31
ABOUT THE AUTHORS ........................................................................................................................... 32
APPENDIX A – TRADE BEST PRACTICE BENCHMARKING METHODOLOGY ........................................... 33
COER Research Report

1) INTRODUCTION

This report aims to show how Fonterra has used the TRADE Best Practice Benchmarking
Methodology to undertake rapid benchmarking projects.

To achieve this aim, the report will cover the following topics.
   •   Benchmarking
   •   Overview of the TRADE Best Practice Benchmarking Methodology
   •   Description of Fonterra’s rapid benchmarking approach
   •   Fonterra’s case studies on benchmarking
   •   Discussion
   •   Conclusion

2) BENCHMARKING

This section introduces benchmarking and explains its various types.

2.1 DEFINITIONS OF BENCHMARKING

Benchmarking is ‘learning through the experience of others’. It includes identifying, adapting,
and implementing high performing practices to produce superior performance results. Through
comparing performance and processes the creativity of the benchmarking team (and others
linked to the project) can be unleashed to develop higher performing practices and
breakthrough improvements.

Benchmarking, as a systematic process, was developed in the early 1980s at the Xerox
Corporation in response to increased competition and a rapidly declining market (Camp 1989).
Dr Robert Camp, who was the benchmarking manager at Xerox, wrote the first book on
benchmarking and contributed the following definition.

        Benchmarking is the search for the best industry practices which will lead to
       exceptional performance through the implementation of these best practices.

                                                                                        Page 1
COER Research Report

The benchmarking philosophy asserts that it is important to recognize and understand an
organisation’s shortcomings and be open to learn from other organisations (APQC, 1993). This
approach of acknowledgement and learning has to be inculcated into an organization’s culture
in order to experience maximum benefits of benchmarking. The notion of benchmarking is
based on the belief that there is no need to “reinvent the wheel” or in this case “reinvent a best
practice”. Benchmarking is not the process of competitive analysis, copying or spying. It is an
opportunity to learn from others through a collaborative effort.

2.2 TYPES OF BENCHMARKING

The Global Benchmarking Network (GBN) has been helping countries to learn about and use
benchmarking methods since 1994. Its honorary life-time President is Dr Robert Camp. The
GBN has provided a glossary of terms that describes many different types of benchmarking
(GBN, 2015) however in most of its reports (such as Searles, Mann & Kohl, 2013) it
recommends to divide benchmarking into two main types, formal and informal. These
definitions of formal and informal benchmarking were first developed by Dr Robin Mann and
are further explained below.

INFORMAL BENCHMARKING
Informal benchmarking can be defined as an unstructured approach to learn from the
experience of other organisations; therefore not following a defined process. This is the most
common type of benchmarking. This type of benchmarking is used by everyone, whether one
realizes it or not. Informal benchmarking may involve comparing one’s knowledge with an
expert’s knowledge, learning from colleagues in informal discussions, learning through
networking or through asking colleagues and managers about how they perform a particular
activity and then comparing it with their own. Books, journals and the internet provide
benchmarks and best practices that support informal benchmarking.

FORMAL BENCHMARKING

Formal benchmarking is a conscious and structured approach to learn from the experience of
other organisations and consists of two types:

                                                                                           Page 2
COER Research Report

         Performance Benchmarking
Performance benchmarking aims at comparing performance between similar processes or
activities. The aim is to find performance gaps by comparing performance with another
company and identifying opportunities for improvement. Performance benchmarking involves
comparison but does not provide a structured process for identifying and implementing best
practices.

         Best-practice Benchmarking
Best-practice benchmarking is the most powerful type of benchmarking. Best-practice
benchmarking searches for the best way or solution by studying the practices of other
organisations that are high performers in a particular area of interest. There are different
systematic methodologies for best practice benchmarking. Some of the well-known
methodologies are listed in table 2.

Table 1: Examples of best practice benchmarking methodologies
   BEST PRACTICE BENCHMARKING METHODOLOGIES                            STEPS INVOLVED
 Xerox                                                          4 stages comprising 10 steps and 39
                                                                sub-steps
 IBM                                                            5 phases / 15 steps
 AT&T                                                           9 and 12 stages (two models)
 APQC                                                           4 stages comprising 10 steps
 TRADE Best Practice Benchmarking Methodology                   5 stages comprising 34 steps

All methodologies aim to improve performance by learning and applying best practices. In this
report the TRADE Best Practice Benchmarking Methodology will be described in detail with
its interpretation and application at Fonterra.

3) OVERVIEW OF THE TRADE BEST PRACTICE BENCHMARKING
    METHODOLOGY

The TRADE Best Practice Benchmarking Methodology was developed by Dr Robin Mann for
the New Zealand Benchmarking Club which existed between 2000 and 2004. Initially the
methodology was called the New Zealand Benchmarking Club’s benchmarking methodology
but was later changed to TRADE when Bronwen Bartley, one of Dr Mann’s doctoral students,

                                                                                               Page 3
COER Research Report

suggested that “TRADE” would be a more memorable name and it could be used to symbolise
the “trading of information and knowledge” between organisations.

In 2007 the methodology was significantly enhanced when Centre for Organizational
Excellence Research (COER) was commissioned to provide the benchmarking methodology
for Singapore’s public sector. In 2009 further developments to the methodology were made
with the introduction of a certification scheme to increase the professionalism of
benchmarking. Individuals now trained in TRADE can advance from benchmarking “Trained”
to “Proficiency” to “Mastery” level as shown in figure 1. The status of Trained is given based
on an individual attending a two or three-day training course on TRADE by an approved
training instructor. The status of Proficiency is granted based on the submission of a completed
benchmarking project which needs to meet a base-line standard. The status of Mastery is
granted based on the submission of two completed benchmarking projects which both need to
be graded at a “Commendable” level. Individuals that reach Mastery have the skills and
experience necessary to facilitate or lead benchmarking projects in such a way that they are
likely to lead to significant operational and financial gains.

Figure 1: TRADE certification levels

From 2015 to 2018 further enhancements to the TRADE methodology were made as a result
of its use in the “Dubai We Learn” initiative as part of the Dubai Government Excellence
Programme (DGEP) (Mann et al, 2017). In particular, the project management system which
utilises Excel Spreadsheets has been strengthened with more benchmarking resource
worksheets added. In addition, the training and methodology were made available in Arabic.
The TRADE Best Practice Benchmarking Methodology consists of the following five stages:

    1. Terms of Reference Stage: The first stage is to plan the project. This stage involves
         selecting the aim of the project, forming a project team and developing the Terms of
         Reference. The Terms of Reference provides the foundation for a successful project
         and should include a clear scope, expected benefits, resources required, expected time-
                                                                                         Page 4
COER Research Report
line and identification of stakeholders who will be impacted by the project to ensure
that their needs are considered.
2. Research Stage: The second stage involves researching the extent of the current
problem/issue and what practices are currently in place. This stage ensures that the
project team has a thorough understanding of its own organisation’s systems, processes
and performance before learning from other organisations and helps to identify
precisely the areas for which best practices will be sought.
3. Acquire Stage: This stage involves the comparison of performance with other
organisations and then learning from them. It involves identifying which organisations
are likely to have superior practices and finding out what they do differently. Various
methods can be used for learning from other organisations such as internet research,
surveys and site visits.
4. Deploy Stage: This stage involves communicating the best practice findings from the
Acquire Stage to the relevant stakeholders, deciding what should be changed with the
current practice(s)/process(s) and implementing the changes. This stage involves
adapting the best practices to fit the organisation’s profile and may involve piloting the
change before full deployment.
5. Evaluate Stage: This stage is designed to make sure the project has delivered the
expected benefits that were outlined in the Terms of Reference. It involves undertaking
a cost/benefits analysis and a general review on how well the process is performing. If
the expected benefits are not being realised an investigation needs to occur to find out
why not and may require further learning from the benchmarking partners.
Figure 2: TRADE best practice benchmarking methodology
Page 5COER Research Report
The TRADE methodology, shown in Figure 2 is not dissimilar in concept to others but the
difference lies in its prescriptive nature, accompanying project management system and a
certification system to ensure that project team members understand how to use the
methodology. Underneath each of the 5 key stages are 4 to 9 steps, refer to Table 3, which
describes what needs to be done before proceeding to the next step and stages (see Appendix
A for a more detailed description of each stage).
Table 2: TRADE stages and steps
STAGE STAGE NAME STEPS INVOLVED
NO.
1 Terms of Reference (Plan the 1.1 Determine area of focus for benchmarking project
project) 1.2 Develop project brief
1.3 Form project team
1.4 Train project team
1.5 Understand benchmarking code of conduct
1.6 Prepare Terms of Reference (TOR)
1.7 Develop documentation system
1.8 Review project progress and TOR
1.9 Obtain approval to start the next stage of TRADE
2 Research (Research current 2.1 Understand area of focus to be benchmarked
state) 2.2 Define performance measures
2.3 Identify current performance
2.4 Prioritise and finalise the practices to be benchmarked
2.5 Review project progress and TOR
2.6 Obtain approval to start the next stage of TRADE
3 Acquire (Acquire best 3.1 Establish criteria for selecting benchmarking partners
practices) 3.2 Select potential benchmarking partners
3.3 Invite and acquire benchmarking partners
3.4 Prepare for data collection
3.5 Collect and store data
3.6 Analyse data
3.7 Formulate recommendations
3.8 Review project progress and TOR
3.9 Obtain approval to start the next stage of TRADE
4 Deploy (Communicate & 4.1 Communicate findings
implement best practices) 4.2 Develop action plan
4.3 Obtain approval for action plan
4.4 Implement actions
4.5 Review project progress and TOR
Page 6COER Research Report
4.6 Obtain approval to start the next stage of TRADE
5 Evaluate (Evaluate the 5.1 Perform cost /benefit analysis
benchmarking process & 5.2 Review TRADE process
outcomes) 5.3 Share experiences and project outcomes
5.4 Close project
Due to the prescriptive nature of the TRADE methodology it is intended that benchmarking
teams are able to focus on maximising the learning from each step and stage rather than
becoming confused or distracted as to “what should be done next”. The methodology ensures
a systematic and professional research approach is undertaken. Without this discipline, there is
a danger that projects will not be successful as teams may take short-cuts with steps being
missed out. For example, common issues are that projects start without conducting a
cost/benefit analysis or have unclear specifications or do not have the required buy-in from key
stakeholders (projects often fail even when best practices are identified as key stakeholders
have not been involved in the project and their commitment cannot be gained for
implementation).
The discipline of following a methodology is important if organisations are to be successful at
formal benchmarking. It is paramount that a consistent methodology is used otherwise each
project will follow a different approach with varying levels of success. A standard but flexible
approach will lead to a greater transfer of knowledge between projects and also an improved
methodology over time based on the learning from each project.
4) DESCRIPTION OF FONTERRA’S RAPID BENCHMARKING
APPROACH
This section provides an introduction to Fonterra and explains its rapid benchmarking
approach.
4.1 INTRODUCTION TO FONTERRA
Fonterra is New Zealand’s multinational dairy co-operative founded in 2001 with 18,000
employees and owned by 10,000 New Zealand dairy farmers. Fonterra collects 22 billion litres
of milk and produces more than two million tonnes of dairy ingredients, specialty ingredients
and consumer products each year and 95 per cent of these products are exported to 140
Page 7COER Research Report
countries every day. Fonterra’s dairy products include milk, cheese, butter and ice-cream.
Fonterra plants are located in New Zealand, Australia, China, Asia, North America, Europe,
Middle East, Africa and Latin America. Across New Zealand, Fonterra operates at more than
30 manufacturing sites (see Figure 3).
Fonterra has the vision to be the world’s most trusted source of dairy nutrition and this vison
is greatly reflected in their values (Fonterra, 2016). The values shared at Fonterra are:
• Challenge boundaries
• Co-operative spirit
• Do what’s right and
• Make it happen
Figure 3: Fonterra's plants in New Zealand
Page 8COER Research Report
4.1.1 FONTERRA’S IMPROVEMENT APPROACH
Fonterra’s improvement approach is called the ‘Fonterra Way’. Within each Operations Team
there is an Operational Excellence Group that is responsible for implementation of the Fonterra
Way. New managers learn the Fonterra Way through a two-week training course. A key
element of the orientation course is acquaintance with the TRACC methodology. TRACC,
developed by Competitive Capabilities International, is an integrative improvement
management system that focuses on continuous improvement and supply chain optimisation.
The TRACC methodology encourages benchmarking and this led to Fonterra’s interest in the
TRADE Best Practice Benchmarking Methodology.
4.2 FONTERRA’S RAPID BENCHMARKING APPROACH
This section explains Fonterra’s rapid benchmarking approach with reference to the TRADE
Best Practice Benchmarking Methodology.
Fonterra has been familiar with performance benchmarking for many years but less so with
best practice benchmarking. It was in 2010 that Fonterra began to trial best practice
benchmarking as a way to solve problems and improve practices that had proven difficult to
address through established means. The benchmarking approach was developed through
learning from a number of benchmarking books, notably Sylvia Codling’s book “Best Practice
Benchmarking” and combining this with learning from Phillip Clampitt’s book
“Communicating for managerial effectiveness: problems, strategies, solutions”. The change
management expertise of Fonterra’s technical staff facilitated this process. One of the specific
considerations for Fonterra was that the approach should be rapid and minimise the level of
time invested by key staff in the projects and yet produce major benefits.
Initial results from two projects that were conducted within a 5 day time period were positive.
However, there was recognition that the approach needed more structure and that formal
training in benchmarking would assist Fonterra’s technical staff to facilitate these projects.
With this in mind, two of Fonterra’s staff members were trained on TRADE Best Practice
Benchmarking in 2011. A decision was then made to use the TRADE methodology for rapid
benchmarking projects.
Page 9COER Research Report
As of 2015, Fonterra has undertaken more than 10 successful benchmarking projects using the
TRADE methodology. Two of the benchmarking projects have won best initiative awards at
internal Fonterra Operations Awards.
Fonterra’s rapid benchmarking approach is shown in Figure 4. This approach is designed to
make best use of team members’ time to rapidly identify best practice solutions within a 5 day
period. The 5 day period does not include preparation, deployment or evaluation time. A full
explanation of the process and the people involved is described below.
Figure 4: Fonterra’s rapid benchmarking approach and its relationship with the stages of TRADE
4.2.1 PREPARATION WORK (PRIOR TO DAY 1)
The preparatory work before day 1 includes selecting the area of focus, identifying the project
sponsor (if different than the project initiator), obtaining project approval, forming the project
team, preparing a project brief and selecting appropriate benchmarking partners. These tasks
are primarily done by the facilitator working with the initiator of the project.
Page 10COER Research Report
The preparation work prior to day 1 primarily addresses these steps of the TRADE
methodology.
Terms of Reference
1.1 Determine area of focus for benchmarking project
1.2 Develop project brief
1.3 Form project team
Research
2.1 Understand area of focus to be benchmarked
2.2 Define performance measures
2.3 Identify current performance
Acquire
3.1 Establish criteria for selecting benchmarking partners
3.2 Select potential benchmarking partners
3.3 Invite and acquire benchmarking partners
The preparatory activities will now be described in detail.
DEVELOPING A PROJECT BRIEF AND PROJECT GATING
Project gating is the process of approving a potential project. Every benchmarking project
begins with selecting an area of focus and developing a project brief by the initiator. The project
brief specifies:
• The name of the project
• The name of the sponsor
• The size of the project team
• The members of the project team
• The aim and scope of the project (including timeline and resources)
The initiator is the person who identifies an issue or opportunity for improvement, conducts
the cost/benefit analysis and seeks a sponsor’s support for the project. An initiator could be any
person from the organization who has identified a problem. The sponsor is typically a senior
manager who ensures the project is aligned to Fonterra’s business objectives and can approve
the project’s scope, budget and deliverables. All projects whether identified from the top or
Page 11COER Research Report
bottom of the organisation need to pass through a gating system to obtain approval. Project
gating ensures the relative feasibility and significance of each proposed project. The project
brief includes the following information:
• Business assessment
• Commercial analysis
• Risk assessment
• Milestone development
• Impact tracking
• Project plan
TEAM BUILDING AND ROLES OF TEAM MEMBERS
Once an area of focus is identified, the next step is building a benchmarking team. The team
size ranges from 5-8 members (and does not include the sponsor). Team members are elected
on the basis of the problem at hand. People integral to the team are:
• Facilitator
• Technical expert
• Project team members
The roles of team members are as follows:
• The facilitator is a benchmarking expert who undertakes the preparation work for the
project before the official start on day 1 and explains to team members their roles and
sets expectations. The facilitator guides the project team through the benchmarking
stages.
• A technical expert is a specialist with a deep understanding of the process, system or
issues being examined. The technical expert is independent and not a process owner
which enables them to stay objective. The technical expert provides assistance with
conversion of information into knowledge. The job of the facilitator is to focus on the
benchmarking process whereas the technical expert focuses on the problem at hand.
• The rest of the project team members are selected by the facilitator and sponsor and
include people related to the issue, these may also include people from the
benchmarking partner(s) (the organisation(s) being learnt from).
Page 12COER Research Report
Due to the short-time frame of the project it is critical that the right team members are selected
and the facilitator is highly skilled at managing small teams. In the case of Fonterra, the person
that facilitated the projects had extensive experience in managing teams and was particularly
skilled in understanding team dynamics and power relationships (that is, the causes and
consequences of behaviour). The facilitator’s approach was developed with influence from
Craig Harper, a change management expert from Australia, and from Shawn Kent Hayashi’s
book “Conversations for Change”.
Understanding of Maslow’s hierarchy of needs greatly influenced Fonterra’s benchmarking
approach. Benchmarking projects need a high level of self-actualisation so that ideas, sharing
and creativity can flourish. Therefore, a conducive environment to develop confidence in team
members is essential. According to Maslow’s hierarchy of needs, if individuals are fearful
about the safety and security of their job they are less likely to operate at the top level of
hierarchy, that is, self-actualization (refer to figure 5). An effective benchmarking activity
expects team members to be at the pinnacle of their creativity and problem solving skills but if
the team members do not feel safe and secure in their decisions they will not be able to perform
at their fullest. To address this issue, the sponsor is involved at the project inception when the
Terms of Reference is set to demonstrate support but then the team are left alone to review
current practices and identify best practices. This time alone by the team is important as it
allows team members to express their views openly. The sponsor then re-joins the project team
when the solutions or changes to the process are decided to garner his/her support.
Figure 5: Maslow's hierarchy of needs
Page 13COER Research Report
UNDERSTANDING PROBLEMS THROUGH D-I-K-A (DATA, INFORMATION, KNOWLEDGE
AND ACTION) MODEL
Prior to day 1 the facilitator needs to understand as much about the project as possible through
meeting with the initiator, project sponsor, technical experts and process owners and those
affected by the process. This is necessary to ensure the right project team members and
benchmarking partner(s) are selected.
To assist with this Fonterra uses the D-I-K-A model. D-I-K-A stands for Data, Information,
Knowledge and Action (Clampitt, 2012). The D-I-K-A paradigm can be described as the
acquisition of data, its processing, maintenance and interpretation, and its application in the
form of an action to resolve an issue. Every benchmarking project begins with the collection
of data related to the issue at hand, which is then translated into information. The facilitator
may collect some initial data or review what data is available in preparation for day 1. Any
gathered information will later enable the team to generate knowledge about the problem,
which provides a basis for taking actions to resolve the issue.
The D-I-K-A Model in figure 6 is explained through a real example that occurred at Fonterra
with the actual costs and percentages changed for confidentiality.
Data: The data may show a regular failure to meet the specifications required for milk powder
causing $100,000’s of wastage for the business per month (identified prior to the benchmarking
study).
Information: The majority of specification failures are identified as relating to failures
concerning a specific test (identified prior to the benchmarking study).
Knowledge: Causes of the failure are identified as relating to subtle configuration differences
compared to a benchmark plant (identified by the benchmarking study).
Action: Implement process changes to address specific differences (implemented as a result of
the benchmarking study).
It is an iterative process that facilitates the transition from data to action. The final actions are
validated by revisiting the data to ensure that the required improvements have occurred.
Page 14COER Research Report
Figure 6: D-I-K-A Model
PARTNER SELECTION
Depending on the project scope, one or more benchmarking partners may be selected. To
ensure that the right benchmarking partners are selected it is important that the facilitator has a
clear understanding of the problem at hand. The benchmarking partners are generally selected
through word of mouth rather than through performance benchmarking due to a number of
reasons, such as, lack of data, differences in the performance measures used or their formulae
or in many cases the performance measure is unique to Fonterra’s process. Fonterra’s
benchmarking projects usually involve one partner so the facilitator spends considerable time
and effort in selecting the right partner and qualifying their best practices before the official
start of the project. The partner is often selected from within the Fonterra group where there is
good knowledge on each plant and their best practices.
Completion of all the above activities marks the end of the preparatory work. After preparation,
the 5 days rapid benchmarking approach begins.
4.2.2 DAY 1: TERMS OF REFERENCE (MORNING)
The morning of day 1 concentrates on preparing and reaching agreement on the Terms of
Reference (TOR) for the project. The following steps of the TRADE methodology are
undertaken:
Terms of Reference
1.4 Train project team
1.5 Understand benchmarking code of conduct
1.6 Prepare Terms of Reference
Page 15COER Research Report
1.7 Develop documentation system
1.8 Review Terms of Reference
1.9 Obtain approval to start the next stage of TRADE
The key activities that Fonterra undertakes in the morning of day 1 will now be described in
detail. The morning starts with the facilitator introducing the team members and explaining the
benchmarking process and the benchmarking code of conduct. If the benchmarking process
involves external partners, a non-disclosure agreement is signed. Clear expectations are set at
the start of the project in terms of what needs to be achieved and the level of commitment
required from the team members (that is they need to fully focus on the project for the whole
week with no distractions).
The team and the sponsor work together towards developing the TOR based on the initial
project brief. The sponsor attends the morning of day 1 to show commitment to the project.
The sponsor together with the facilitator and team members finalise the aims and objectives of
the project. The presence of the sponsor during the development of the TOR creates
understanding between the sponsor and the team and clarifies the expectations of the sponsor
with the team members. In addition, other stakeholders may be invited to all or parts of the
morning meeting to obtain their support and input to the project.
The TOR form that Fonterra completes uses simple language to aid understanding of the team
as team members come from different levels within the organization. The TOR form consists
of five simple questions, see figure 7.
Name of Project:
1. Why are we doing this benchmarking?
2. What would we like to achieve?
3. What will we do/not do?
4. How will we communicate?
5. How will we report the benchmarking findings?
Names of Project Sponsor and Team Members:
Figure 7: Fonterra’s simplified Terms of Reference form
The TOR template used by Fonterra is a simplified version of the TRADE TOR form. The
TRADE TOR form is shown in figure 8.
Page 16COER Research Report
TERMS OF REFERENCE (TOR)
Organisation: Last Date Revised:
Project Name:
Project Sponsor and Team Members
Name Position Telephone Email Project Role
Sponsor
Team Leader
Benchmarking Facilitator
Administrator
Team Member
Document Revision History Project Sponsor
Version Date File name Revision Notes - Reason for change Reviewed? Yes/No
1 First Draft
Aim Describe the purpose of the project in one
sentence e.g. "To identify & implement best practices
in X to improve performance from Y to Z"
Scope What Is included & excluded from the
project? Clearly define the boundaries of the project &
any time-line/resource constraints
Background Why is the project needed? What is
the extent of the challenge/ opportunity? Who
determined the need?
Objectives Include SMART objectives w ith at
least one objective per TRADE stage as w ell as
outcome objectives to be measured in the Evaluate
stage.
Expected Non-Financial Benefits What problems /challenges/ opportunities and Expected Financial Benefits For every non-financial benefit there is
performance levels do you expect improvements in? What are the benefits for your stakeholders? a potential financial benefit. Financial benefits should be show n as monetary
Ideally the benefits should be quantifiable show ing current performance (and date measured) and values otherw ise include in the non-financial column. Financial benefits for your
expected future performance (by a stated date). stakeholders may be included.
Expected Cost Completing the cost items in the TRADE-T w orksheets w ill generate a Cost Analysis (CA) A. Expected Financial Cost B. Expected Financial
w orksheet that can assist in estimating the cost items below . (excluding Deploy Stage) Cost of Deploy Stage
Labour - Estimate how many man hours need to be invested in the project by your project team and other staff and
multiply by an appropriate hourly pay rate
Expenses - Estimate the cost of any incidental/consumable expenses such as food, travel, accommodation, training,
consultant fees that may be spent during the project
Capital - Estimate the cost of any equipment/infrastructure items that may need to be purchased. This is usually only
applicable for the deploy stage
Colum n Totals:
Expected Cost (A+B):
Stakeholders List the stakeholder groups that w ould be interested or impacted by the Stakeholder Impact Describe w hy each stakeholder group w ould be
project interested or impacted by the project
Communication Plan How w ill each group
of stakeholders be involved in the project,
communicated w ith & how often?
Task Management How w ill project tasks be
allocated & managed? Indicate if the TRADE Task
Worksheets w ill be used or another method.
Change Management How w ill changes
to the project's purpose or approach be managed so
that all stakeholders remain engaged.
Risk Identification Describe the key Risk Risk Management For any risk that scores 3 or
Med=2 Low=1
risks that could delay or reduce the impact of
Consequen
Moderate=2
Likelihood
(L) High=3
the project? Use the next 3 columns to assess the likelihood of each risk and the potential (LxC) above describe how the team w ill manage or mitigate the risk
Major=3
consequences.
ce (C)
1) 1)
2) 2)
3) 3)
Training Do team members require any specific
training to fulfil this project? Have all team members
been trained in benchmarking?
Benchmarking Project Agreement Form Has a benchmarking project agreement form been
developed that stipulates adherence to the Benchmarking Code of Conduct and provides ground rules on how
the project team should perform its duties? Has it been signed by all team members? Yes/No
Figure 8: Standard TRADE Terms of Reference form
Page 17COER Research Report
For each benchmarking project the TRADE project management system is used which consists
of an excel spreadsheet and worksheets for different parts of the project. All the documents
related to the benchmarking project are maintained and filed, such as, the TOR and progress
updates.
DAY 1: RESEARCH (AFTERNOON)
The afternoon of day 1 is spent on researching the current process. The afternoon of day 1
primarily addresses these steps of the TRADE methodology:
Research
2.1 Understand area of focus to be benchmarked
2.2 Define performance measures
2.3 Identify current performance
2.4 Prioritise and finalise the practices to be benchmarked
2.5 Review Research stage
2.6 Obtain approval to start the next stage of TRADE
The afternoon of day 1 begins by focusing on researching the current process through process
mapping. An example of a process map is shown in figure 9. Process mapping helps team
members to obtain a common understanding of the process and its sequence. In addition,
Fishbone diagrams (also known as Ishikawa diagram or Cause and Effect diagram, shown in
figure 10) are used to help to understand and prioritise the challenges faced. Fishbone diagrams
provide an effective means for investigating the root causes of an issue, as it explores the issues
leading to a problem.
Figure 9: Example of a process map created at Fonterra as part of a benchmarking project
Page 18COER Research Report
Figure 10: Template form for a Fishbone diagram
Process mapping helps to clarify the process and ensures that there is common understanding
of what is currently happening. Sometimes after process mapping the TOR is changed as the
problems or opportunities become more apparent. At the end of day 1 the TOR is reviewed,
finalized and signed by the Project Sponsor.
4.2.3 DAY 2 - RESEARCH AND ACQUIRE (MORNING)
The morning of day 2 is spent on understanding the area of focus and preparing for data
collection. The morning of day 2 primarily addresses these steps of the TRADE methodology:
Research
2.1 Understand area of focus to be benchmarked
Acquire
3.4 Prepare for data collection
The morning of the second day begins by the team developing questions to investigate the
current process and the benchmarking partner’s process. The process map and fishbone
diagram help the team to develop useful questions. The facilitator encourages the team to come
up with a minimum of 100 questions. The nature of the problem helps to decide whether to
question Fonterra’s staff first of all or to question the benchmarking partner. Sometimes the
partner’s location and availability affects the order of the site visits. Usually the current process
is the first one to be investigated.
Page 19COER Research Report
DAY 2: RESEARCH AND ACQUIRE (AFTERNOON)
The second half of day 2, and days 3 and 4 are usually allocated to answering questions on both
the current process and benchmarking partner’s process. The afternoon of day 2 usually
addresses these steps of the TRADE methodology:
Research
2.1 Understand area of focus to be benchmarked
Acquire
3.5 Collect and store data
3.6 Analyse data
Normally the afternoon of day 2 begins by the project team, facilitator and technical expert
visiting the current process to watch it in action and collect data and information as necessary.
Staff that are responsible for the process are asked questions. Questions may also be asked to
the internal suppliers or customers of the process. Day 2 ends with a team debrief at which
findings to date are discussed.
4.2.4 DAYS 3 AND 4 - RESEARCH AND ACQUIRE
Activities for day 3 and 4 involve answering questions and visiting benchmarking partner(s).
Days 3 and 4 primarily address these steps of the TRADE methodology:
Research
2.1 Understand area of focus to be benchmarked
Acquire
3.5 Collect and store data
3.6 Analyse data
On day 3 the team usually visits the partner’s location. The day begins with an introduction
followed by creating a process map of the partner’s processes. These activities are led by the
facilitator and technical expert. Interestingly, half the ideas for process improvement and
implementation are usually generated through comparing differences in physical configuration
of the processes with the help of process mapping. After process mapping the project team
conducts a physical walk-through of the process to gain a deeper understanding of the process
and for finding answers to some of the questions. During the walk-through, the project team
Page 20COER Research Report
ask questions to the process owner and operators. The questioning aims to identify performance
gaps and the reasons for these gaps. Common questions asked are;
• What leads to a difference in performance?
• What is the difference in control philosophy?
• What is the difference in technical equipment, training in staff or materials used?
• Are there any negating factors that show that the gap is not the cause of the performance
difference?
The framework used for comparing processes depends on the nature of the project. When it is
important to compare the physical configuration of a plant a comparison model showing
differences to the desired set-up against the benchmarking partner is built into a spreadsheet.
In the case of projects focussing on soft issues other approaches are used. For instance, when
Fonterra was reviewing its company culture it used a diagnostic tool called the “High
Performance Environmental Structure” designed by Elkiem (a consultancy). This tool had been
developed from research to identify high performing individuals and organisations. By using
this tool, Fonterra obtained useful insights into its culture and opportunities for improvement
that could be investigated further by learning from benchmarking partners that were strong in
these areas.
Throughout days 3 and 4 the emphasis is on finding performance gaps and potential solutions.
Performance gaps are welcomed as these indicate the need to find out the reasons why there is
a gap (questions can then be asked to the benchmarking partner and the partner’s processes
studied) and this leads to brainstorming how to close the gap. A debrief is held at the end of
each day to discuss what was found and plan the next day. Potential best practices and actions
are discussed and their expected contribution towards performance improvement is predicted.
DAY 5 - ACQUIRE (MORNING)
The morning of day 5 is spent on identifying the recommended actions to be taken to address
or surpass the performance gap. The morning of day 5 primarily addresses these steps of the
TRADE methodology:
Acquire (acquire best practices)
3.10 Formulate recommendations
Page 21COER Research Report
During the morning of day 5 the identified best practices are communicated and discussed
among the team and recommended actions are formulated. These actions are a combination of
what was learnt from the benchmarking partner(s) and other ideas the team may have had. Each
action must have a rationale (for instance, that shows its likely impact on closing or surpassing
the performance gap) and consideration must have been given to the time and resources
required for implementation.
DAY 5: DEPLOY (AFTERNOON)
The afternoon of day 5 is spent on prioritizing the recommended actions and obtaining
approval. The afternoon of day 5 primarily addresses these steps of the TRADE methodology:
Deploy (communicate & implement best practices)
4.7 Communicate findings
4.8 Develop action plan
4.9 Obtain approval for action plan
In the afternoon, the sponsor and appropriate stakeholders are invited to join the team. The
team present their findings from the four days of the benchmarking study. The next step is for
the sponsor, stakeholders and the team collectively to reach consensus on prioritizing the
recommended actions. The method used for reaching agreement on the actions is interesting.
Each action is presented to the sponsor as a post-it note and the sponsor needs to physically put
the action on a prioritization matrix consisting of four quadrants representing different
combinations of ease of implementation and impact (refer to Figure 11). The four quadrants
represent high impact and easy to implement, low impact and easy to implement, high impact
and hard to implement, or low impact and hard to implement. The process of the sponsor
physically putting the recommended actions on the prioritization matrix demonstrates his/her
agreement to the actions and their importance. This activity ends with all the actions allocated
to the quartiles on the prioritization matrix. Prior to reaching final agreement on which actions
to proceed with and in which order, the time frame for implementation is considered for each
action (from short to medium to long time). With an agreement reached the team disbands back
to their departments.
Page 22COER Research Report
Figure 11: An example of a prioritization matrix used at Fonterra
4.2.5 FOLLOW ON WORK AFTER DAY 5 (DEPLOY AND EVALUATE)
At the end of day 5 the sponsor hands over the actions (or best practices) to a project manager
(this may or may not be someone from the benchmarking team).
The work after day 5 primarily addresses these steps of the TRADE methodology.
Deploy (communicate & implement best practices)
4.10 Implement actions
4.11 Review Deploy stage
4.12 Obtain approval to start the next stage of TRADE
Evaluate (evaluate the benchmarking process & outcomes)
5.5 Perform cost /benefit analysis
5.6 Review TRADE project
5.7 Share experiences and project outcomes
5.8 Close project
The key activities that Fonterra undertakes after day 5 will now be described in detail. The
sponsor selects a project manager to be responsible for implementing the selected actions.
Firstly, the project manager identifies the time frame, the people, and the resources required to
Page 23COER Research Report
successfully implement the actions. If specific actions require resources the actions will need
to go through Fonterra’s official project management system for sign off and project
monitoring purposes. The actions are then implemented.
For project monitoring, the facilitator contacts the project manager after about 3 months to
review the implementation of the actions and the achievement of deliverables. Dependent on
the project and progress of implementation further checks may be required. The project
manager closes the project once the deliverables have been met and results achieved to the
satisfaction of the project sponsor and facilitator. The facilitator then writes a closing report.
5) FONTERRA CASE STUDIES ON RAPID BENCHMARKING
The following case studies describe Fonterra’s application of rapid benchmarking using the
TRADE Best Practice Benchmarking Methodology.
5.1 CASE 1: BENCHMARKING OF EDENDALE AGAINST CLANDEBOYE
Introduction
This benchmarking project is an example of internal benchmarking where the benchmarking
partner was another Fonterra plant. Fonterra’s Edendale plant in Invercargill has the second
largest milk powder drier in the world and was in its second year of operation but was not
performing as expected. Fonterra’s Clandeboye plant was performing to specifications and was
introduced as a benchmarking partner.
Problem
The benchmarking project aimed to quantify the operational differences between Edendale and
Clandeboye and identify solutions to raise Edendale’s performance. Specifically, the areas
which needed immediate improvement were out of specification bulk density and chamber
fouling as shown below:
• Only 24% of a specific type of milk powder was made to specification and therefore
76% of milk powder was downgraded every time. The problem arose due to the
inability to fit the right amount of milk powder from bags into cans at customer’s end
due to its bulk density.
Page 24COER Research Report
• There was a need to wash the dryers every week due to chamber fouling, resulting in
downtime of 12-16 hours per week.
Solution
The solution was identified through a detailed comparison of process maps and specific running
conditions and parameters between the two plants. Whilst comparisons and investigative work
had been conducted previously to identify potential solutions it was only through the rapid
benchmarking approach (and following the structure of TRADE) that solutions were found.
The precise solution cannot be detailed in this report for commercial reasons. Benchmarking
helped to compare specific parameters that enabled the project team to find small differences
in the configuration of a piece of equipment and the difference in their control philosophy.
Outcomes
As a result of addressing the problem through rapid benchmarking there was a quick
improvement in performance with the product meeting specifications 99.6% of the time (see
figure 12) and resulting in an additional $200,000 contribution to the business in a year.
% performance on specification
Benchmarking carried out here
Figure 2: Improvement in performance through Rapid Benchmarking
Page 25COER Research Report
Other achievements as a result of this project were:
• Downtime on the plant was reduced by 269 hours per year
• Production increased by 7.97% (from 85.15% to 93.12%)
• Chamber cleaning frequency was reduced from a 14 day average to a 21 day average
• Achieved a new monthly production record of 20,826 million tonnes of milk powder
5.2 CASE 2: BENCHMARKING OF WYNYARD AGAINST HAUTAPU
Introduction
This benchmarking project is another example of internal benchmarking. Fonterra’s Wynyard
plant was facing issues of yeast and mould in their dairy production processes. Another
Fonterra plant, in Hautapu, was selected as a benchmarking partner. A benchmarking team
consisting of staff from both plants undertook the rapid benchmarking project to investigate
how the yeast and mould can be reduced.
Problem
The Wynyard plant had excessive growth of yeast and mould. The Wynyard and Hautapu
(partner plant) were operating at different hygiene and air quality standards and had different
levels of knowledge about optimising their processes.
Solution
Through detailed process mapping and physical walk-throughs differences in plant
configuration were identified. Questioning the process owners (operators) further helped to
understand the reasons for mould and yeast production. Furthermore, the control philosophy
adopted at both the plants was compared to identify points of variation. This resulted in
identifying opportunities for optimizing the use of automation.
Outcomes
As an outcome of this benchmarking project 88 actions were identified and prioritized based
on impact, ease of implementation and timeframe for implementation. The project helped to
reduce mould spores entering the building by 35% (on average) and 66% of critical
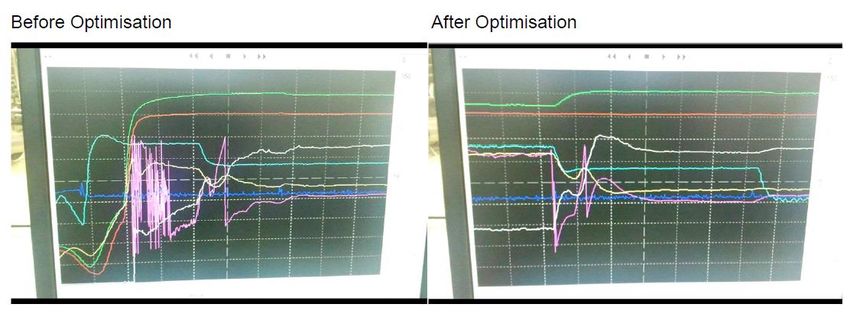
contamination areas were eliminated or minimised. In addition, the running conditions of the
plant were optimised to ensure a smoother start-up. The improvement in process control for
Page 26COER Research Report
dryer start up is shown in Figure 13 with the reduced variation in the purple line indicating
greater control of air movement.
Figure 3: Improvements in air control as a result of the benchmarking project
Other achievements as a result of this project were:
• 83% reduction in yeast and mould downgraded product
• Risk reduction of AUD$500k per year
• Project initiated to recover baghouse fines – 1% yield gain
• Manual handling step removed from the process
5.3 CASE 3: BENCHMARKING PROJECT WITH AN AWARD WINNING
AIRLINE
Introduction
This is an example of an external benchmarking project undertaken to improve tool control
and maintenance. An airline was chosen as a benchmarking partner as it had been recognized
as an award winning organisation for maintenance repair.
Problem
The purpose of this project was to observe the partner facilities and learn maintenance best
practices.
Page 27COER Research Report
Solution
Fonterra’s rapid benchmarking team visited the airline’s facilities and questioned their staff.
The team learned lessons regarding health and safety standards, culture and values,
maintenance operations and performance recording systems. The following lessons were
learned:
• Obvious pride in their company
• Respect for their leadership team
• Real pride and personal responsibility for each individual’s function
• Respect for other departments – treating them as their customers
• Leadership commitment to their charter
• Consultative approach to change, leaders get involved with their teams and use
outside facilitation to steer their thinking
• Effective tool control system with names engraved and barcodes on significant tools
• Colour coding of maintenance activities based on the level of planning
• Use of software to spot damage areas and for identifying trouble patterns
Outcomes
As a result of this benchmarking study Fonterra developed a new Operations and Quality
Strategy that incorporated the learning from the airline. A whole range of practices were
modified or introduced in the areas of health and safety, engagement measurement, values
and culture, security and the intranet.
6) DISCUSSION
This report has described the application of rapid benchmarking within Fonterra. All the
projects, and not just the ones described in this report, were considered to be very successful
resulting in improved processes and practices. In some cases solutions were found to problems
that had existed for many years and could not be solved through other methods.
On reflection it is evident that Fonterra’s approach was successful due to the following factors:
Page 28COER Research Report
1. The skill set of the facilitator. The facilitator had a solid understanding and experience
of benchmarking, project management and team dynamics. The facilitator had been
through both in-house and external training programs on these subjects and had the
opportunity to be involved in many projects prior to facilitating the rapid benchmarking
projects.
2. The preparation work undertaken by the facilitator prior to the 5 days of benchmarking.
The facilitator spent considerable time in understanding the problem, identifying the
right team members for the project and communicating with them, identifying and
communicating with other stakeholders that have an interest in the project, identifying
relevant benchmarking partners and securing their participation in the benchmarking
project.
3. The strong support of project sponsors. Project sponsors played a crucial role in
allowing project teams to devote 5 days of time to the project, visibly supporting the
projects in those 5 days, and engaging with the team members and project manager at
relevant points in the project.
4. The setting of clear expectations to project team members. It was important that
everyone knew their role whether they were a project sponsor, team leader, technical
expert or project team member and everyone knew the level of commitment expected
of them.
5. A clear process was in place showing how best practices and solutions were going to
be identified through having a defined agenda for the 5 days and knowing which tools
and techniques to use. For most projects Fonterra used process mapping, fishbone
diagrams, developed over 100 questions to ask about their own process and the
benchmarking partner’s, and used a prioritisation matrix to decide on which ideas and
practices to implement.
6. A clear process was in place for implementation. Project actions are transferred into
Fonterra’s official project management system and assigned to a project manager who
may or may not have been part of the benchmarking team.
7. Project monitoring is incorporated into Fonterra’s project monitoring system. In
addition, the facilitator follows up and tracks progress and determines with the project
sponsor and project manager when the project should be closed off.
8. Use of the TRADE methodology and its step by step approach to ensure that the project
progressed in a logical fashion. TRADE also ensured that information and data on the
Page 29You can also read