Overview of retrospective data harmonisation in the MINDMAP project: process and results
←
→
Page content transcription
If your browser does not render page correctly, please read the page content below
Original
Original research
research
Overview of retrospective data harmonisation in the
MINDMAP project: process and results
Tina W Wey ,1 Dany Doiron,1 Rita Wissa,1 Guillaume Fabre,1 Irina Motoc,2
J Mark Noordzij ,3 Milagros Ruiz ,4 Erik Timmermans ,2 Frank J van Lenthe,3,5
Martin Bobak,4 Basile Chaix,6 Steinar Krokstad ,7,8 Parminder Raina,9,10,11
Erik Reidar Sund ,7,8,12 Marielle A Beenackers,3 Isabel Fortier1
►► Supplemental material is ABSTRACT effects of social, environmental and lifestyle deter-
published online only. To view Background The MINDMAP project implemented minants of mental health outcomes across different
please visit the journal online
a multinational data infrastructure to investigate the cities, to facilitate both comparative work and
(http://dx.doi.org/10.1136/
jech-2020-214259). direct and interactive effects of urban environments and pooled analysis of outcomes. To create the
individual determinants of mental well-being and MINDMAP infrastructure, cohort-specific data
For numbered affiliations see cognitive function in ageing populations. Using a rigorous had to be harmonised (processed under a common
end of article. process involving multiple teams of experts, longitudinal format allowing co-analysis of data across studies),
data from six cohort studies were harmonised to serve which is important for ensuring content equivalence
Correspondence to MINDMAP objectives. This article documents the
Tina W Wey, Maelstrom
and reducing bias due to methodological differ-
retrospective data harmonisation process achieved based ences, but presents multiple challenges.1
Research, Research Institute
on the Maelstrom Research approach and provides
of the McGill University Population sampling frames, participant follow-
Health Centre, 1650 Cedar a descriptive analysis of the harmonised data generated.
ups, types of information collected, and variable
Ave, Montreal, QC H3G 1A4, Methods A list of core variables (the DataSchema) to be
formats and content vary extensively across cohort
Canada; generated across cohorts was first defined, and the
t wey@maelstrom-research.org studies. It was thus essential to implement a rigorous
potential for cohort-specific data sets to generate the
DataSchema variables was assessed. Where relevant, process to harmonise, integrate and document the
Received 3 April 2020 core data to be generated.
Revised 9 July 2020
algorithms were developed to process cohort-specific
data into DataSchema format, and information to be MINDMAP implemented such a process,2 and its
Accepted 12 July 2020
provided to data users was documented. Procedures and current data platform supports a broad range of
Published Online First
12 November 2020 harmonisation decisions were thoroughly documented. research activities. The harmonisation teams com-
Results The MINDMAP DataSchema (v2.0, April 2020) prised multiple research groups with a wide range of
comprised a total of 2841 variables (993 on individual expertise, who contributed to harmonising data
determinants and outcomes, 1848 on environmental from six population-based cohort studies3–8 across
exposures) distributed across up to seven data collection Western and Eastern European countries and
events. The harmonised data set included 220 621 Canada. The current article details the harmonisa-
participants from six cohorts (10 subpopulations). tion process and provides a descriptive analysis of an
Harmonisation potential, participant distributions and early version of the MINDMAP data set (v2.0,
missing values varied across data sets and variable April 2020). It describes the harmonisation proce-
domains. dures, summarises variables that were harmonised
Conclusion The MINDMAP project implemented across studies and provides an overview of key infor-
a collaborative and transparent process to generate a rich mation useful for understanding results presented in
integrated data set for research in ageing, mental well- this special issue and by future projects using the
being and the urban environment. The harmonised data MINDMAP data set. More broadly, this article illus-
set supports a range of research activities and will trates challenges in retrospective harmonisation and
continue to be updated to serve ongoing and future considerations for promoting a transparent process
MINDMAP research needs. to produce collaborative data resources.
METHODS
INTRODUCTION The harmonisation process was informed by the
The MINDMAP (promoting mental well-being retrospective harmonisation guidelines1 and used
and healthy ageing in cities) project offers the open-source software Opal 2.16 and Mica 3.9
a multinational data infrastructure to help investi- developed by Maelstrom Research.9 The harmoni-
gate the opportunities offered by urban environ- sation teams were composed of epidemiologists,
ments for the promotion of mental well-being and social scientists and statisticians from specialised
© Author(s) (or their
employer(s)) 2021. Re-use cognitive function of older individuals. This infra- scientific domains. University College London
permitted under CC BY. structure allows multiple investigators to securely (UK) harmonised mental health outcomes; VU
Published by BMJ. and remotely analyse harmonised cohort study University Medical Center Amsterdam
To cite: Wey TW, Doiron D, data across European and Canadian populations. It (Netherlands) harmonised social factors and per-
Wissa R, et al. J Epidemiol also provides approved MINDMAP researchers ceived environment variables, and linked and
Community Health access to the longitudinal data items and statistical derived social-environmental variables; the
2021;75:433–441. power required to investigate direct and interactive Research Institute of the McGill University Health
Wey TW, et al. J Epidemiol Community Health 2021;75:433–441. doi:10.1136/jech-2020-214259 433Original research
Centre (Canada) with Erasmus University Medical Center mental health status across participating cohorts included the
(Netherlands) harmonised sociodemographic, lifestyle and beha- following steps.
vioural, and health variables; and Erasmus University Medical 1. Assemble cohort-specific information and select studies
Center linked and derived physical-environmental variables. All For each MINDMAP participating cohort, study designs (eg,
harmonisation work was done in collaboration across as well as number of data collection events, population sampling frame,
within subject areas to ensure a consistent and coordinated pro- participant selection criteria) and variable data dictionaries
cess, and the harmonisation team had weekly to monthly video- were gathered and catalogued online following Maelstrom
conference calls as needed throughout the process. Research standards.10 English versions of documentation were
available for all studies, and any ambiguities in language were
Individual-level determinants and outcomes data clarified with the cohort study teams. Six studies (including 10
The process to harmonise data on individual risk factors (eg, subpopulations) were included in this version of the MINDMAP
sociodemographic characteristics, life habits) and physical and data set (v2.0, April 2020) (table 1). Three studies that are part of
Table 1 Overview of MINDMAP participating cohort designs and subpopulations included in the harmonisation project
Participants
Subpopulation (n)* Country Recruitment Data collection mode Inclusion/exclusion criteria
CLSA_COP 30 097 Canada Provincial health registries and telephone In-depth interview in participants’ 45–85 years old; able to give consent;
sampling using random digit dialing of homes; physical and biological excluding residents in the three
residents within 25–50 km of 1 of 11 data measurements at data collection sites territories, persons living on federal First
collection sites across seven Canadian Nations reserves and other First Nations
provinces (Alberta, British Columbia, settlements in the provinces, full-time
Manitoba, Nova Scotia, Newfoundland and members of the Canadian Armed Forces,
Labrador, Ontario, Quebec) and individuals living in institutions
CLSA_TRA 21 241 Canada Canadian Community Health Survey (CCHS)— Telephone interview 45–85 years old; able to give consent;
Healthy Aging cycle 4.2, provincial health excluding residents in the three
registries and telephone sampling using territories, persons living on federal First
random digit dialing across the 10 Canadian Nations reserves and other First Nations
provinces settlements in the provinces, full-time
members of the Canadian Armed Forces,
and individuals living in institutions
GLOBE 22 721 Netherlands Municipal registries of the city of Eindhoven Postal questionnaire (baseline); in- 15–75 years old; non-institutionalised
and 15 surrounding villages in the Southern depth interviews for two subsamples at baseline
part of the Netherlands (random and chronically ill)
HAPIEE_CZ 8857 Czech Population registers from Havirov/Karvina, Structured questionnaire at home; 45–69 years old
Republic Hradec Kralove, Jihlava, Kromeriz, Liberec and examination in clinic; face-to face
Usti nad Labem computer-assisted personal interviewing
(follow-up); death registers
HAPIEE_LT 9360 Lithuania Population registers from Kaunas Structured questionnaire in clinic; 45–69 years old
examination in clinic; face-to face
computer-assisted personal
interviewing (follow-up); death registers
HAPIEE_RU 7151 Russia Population registers from Novosibirsk Structured questionnaire in clinic; 45–69 years old
examination in clinic; face-to face
computer-assisted personal
interviewing (follow-up); death registers
HUNT 106 429 Norway Postal invitation to all citizens of Nord- Questionnaires and physical and 20+ years old
Trøndelag County (24 municipalities) biological measurements taken at
health examination sites in each
municipality
LASA1 3107 Netherlands Municipal registries from three geographic Face-to-face interview; medical in-home 55–85 years old
regions: Amsterdam, Wormerland, Waterland interview; telephone interview
(three municipalities in the West), Zwolle, Ommen,
Genemuiden, Zwartsluis, Hasselt (North-East), and
Oss, Uden, Boekel (South); oversampling of older
people and older men in particular
LASA2 1837 Netherlands Municipal registries from three geographic Face-to-face interview; medical in-home 55–65 years old
regions: Amsterdam, Wormerland, Waterland interview; telephone interview
(three municipalities in the West), Zwolle, Ommen,
Genemuiden, Zwartsluis, Hasselt (North-East), and
Oss, Uden, Boekel (South); oversampling of older
people and older men in particular
RECORD 9821 France Invitation to all clinic patients at general health Questionnaires filled at health centres; 30–79 years old; residing in 1 of
check-ups from four Centre d’Investigations physical and biological measurements the112 preselected municipalities;
Préventives et Cliniques (IPC) centers (Paris, during check-up able to answer questions themselves
Argenteuil, Trappes, Mantes-la-Jolie) or with minimal help in French
*This represents the total number of unique participants, which includes sample boosting in follow-ups for some cohorts (GLOBE, HUNT, LASA1, RECORD).
CLSA_COP, Canadian Longitudinal Study on Aging (CLSA)3 comprehensive (in-depth); CLSA_TRA, CLSA tracking (telephone interview); GLOBE, Health and Living Conditions of the Population of
Eindhoven and Surroundings (Gezondheid en Levens Omstandigheden Bevolking Eindhoven en omstreken)4; HAPIEE_CZ, The Health, Alcohol and Psychosocial Factors in Eastern Europe Study5—
Czech Republic; HAPIEE_LT, HAPIEE—Lithuania; HAPIEE_RU, HAPIEE—Russia; HUNT, Nord-Trøndelag Health Study (Helseundersøkelsen i Nord-Trøndelag)6 1–2–3 Cohort; LASA1, Longitudinal
Aging Study Amsterdam (LASA)7 first cohort; LASA2, LASA second cohort; RECORD, Residential Environment and CORonary heart Disease Study.8
434 Wey TW, et al. J Epidemiol Community Health 2021;75:433–441. doi:10.1136/jech-2020-214259Original
Original research
research
the MINDMAP consortium were not included in the harmonisa- algorithmic transformation, calibration (converting units),
tion project due to inaccessibility of relevant study-specific indi- rescaling and standardisation methods.1 In most domains, har-
vidual participant data. monisation was achieved predominantly through algorithmic
2. Define core variables and evaluate harmonisation potential transformations. More complex algorithms were required to
MINDMAP investigators collaboratively defined an initial tar- account for longitudinal data in harmonising lifestyle and beha-
geted set of variables that they considered relevant for addressing vioural variables and health variables (eg, ‘Ever smoked’ or ‘Ever
selected research questions, through discussion and drawing on had a stroke’ in follow-ups used information from earlier data
study teams’ expertise and the Maelstrom catalogue to identify collection events). Mental well-being scores measured with dif-
available data. The harmonisation teams then used study docu- ferent scales were harmonised by collapsing scores into quantiles
mentation and data dictionaries to examine cohort-specific infor- or cases/non-cases based on cutoffs. Cognitive measures were
mation collected in greater detail, and, in collaboration with harmonised using rescaling methods or by converting to z-scores.
Maelstrom Research, generated the final list of core variables (ie, 4. Explore quality and content of harmonised data sets generated
the harmonised variables to be generated across studies) and their Descriptive statistics were used to summarise final harmonisa-
specifications (the DataSchema),11 which was adjusted from the tion statuses of DataSchema variables across cohort-specific data
initial list of target variables based on the available study-specific sets and scientific domains. First, to explore harmonised data
data. The DataSchema includes, for each variable, the name, defi- content within each subpopulation, univariate distributions were
nition, format (eg, integer, decimal) and units (eg, years, drinks/ generated for each DataSchema variable and reviewed for correct
week), and rules for harmonisation were defined and documented. participant numbers, distributions and missing values, compared
Rules for harmonisation refer to specifications for making deci- to the initial cohort-specific data provided. Harmonisation algo-
sions about whether and how particular variables are harmonised rithms were validated for logic and script syntax, and correspon-
(eg, occurrence of angina must be diagnosed). Separate dence of variable metadata with DataSchema specifications was
DataSchema variables were defined for baseline and each partici- verified. Outliers were retained but noted to inform researchers.
pant follow-up (data collection events). DataSchema variables Next, multivariate cross-checks were performed to validate coher-
targeting equivalent content at different time points were distin- ence among related variables (eg, ‘current average number of
guished by the variable name suffix (eg, participant age was cigarettes smoked per day’ only greater than 0 if ‘currently smokes
‘sdc_age_0’ for baseline, ‘sdc_age_1’ for first follow-up, etc). any tobacco product’ is true). Finally, variability in participant
After finalising the DataSchema, the harmonisation teams distributions and missing values was examined across subpopula-
assessed and documented the potential for each cohort-specific tions. This helped identify additional corrections (eg, frequencies
subpopulation to generate the DataSchema variables defined (ie, that were very different for one subpopulation revealed an error in
the harmonisation potential).1 11 Input from cohort teams (which cohort-specific coding) and variability across subpopulations to
included principal investigators, researchers and data managers, consider. Potential effects of factors such as cohort sampling and
and could overlap with harmonisation team members) was reg- recruitment, data collection methods and harmonisation decisions
ularly sought to address questions regarding missing metadata or on variable heterogeneity across subpopulations were explored
unclear information. Harmonisation potential was considered (see online supplemental tables S4 and S5, figure S1) and will be
‘complete’ if cohort-specific variables were the same as the part of ongoing discussions with researchers to improve utility of
DataSchema or could be transformed to generate DataSchema the harmonised data.
variables. Harmonisation potential was deemed ‘impossible’ if 5. Preserve and disseminate harmonisation products
relevant cohort-specific data were not collected or incompatible A MINDMAP work repository was created on Github to docu-
with DataSchema variable definitions. Variables were only ment harmonisation decisions and processing scripts, and an
retained in the DataSchema if they could be generated for two interface was created on the Maelstrom Research catalogue
subpopulations or across two time points within a subpopulation. (https://www.maelstrom-research.org/mica/network/mindmap)
An example outlining harmonisation potential of cohort-specific to collate and disseminate information about the cohort-specific
variables and proposed algorithms to generate a DataSchema designs and variables collected, DataSchema variables generated
variable is provided in online supplemental table S1. and harmonisation potential across studies. Secure access to the
3. Process data under common format harmonised data for approved MINDMAP researchers is mana-
Cohort-specific data required to generate the DataSchema ged through the Opal data repository.
variables were transferred to a central data server at Erasmus
Medical Center, in accordance with consortium data-sharing
policies.2 A central RStudio server allowed authenticated harmo- Area-level environmental-exposure data
nisation team members to securely access and process cohort- Information on social- and physical-environmental exposures
specific data under the DataSchema format.12 The harmonisation came from publicly available resources and were linked to cohort
teams assessed the quality of data provided for their domain of participant data using residential locations of cohort participants.
interest by checking univariate distributions and coherence To protect participant privacy, a series of steps were taken to
among related variables (eg, skip patterns and consistency of blind the geospatial information, and linked data including only
participant responses among data collection events). Any ques- participant ID and environmental-exposure data (without any
tions were clarified with cohort study teams and documented. To geospatial information) were transferred to the MINDMAP cen-
explore representativeness of the populations, age and sex dis- tral server. More details on the sources of information and pro-
tributions at baseline were compared with national statistics from cedures used to link data are available elsewhere.2 14 15
the same year for each subpopulation. Availability of area-level data was limited, and years of
Harmonisation teams verified the harmonisation potentials collection did not necessarily correspond to the timing of
attributed and, where relevant, developed algorithms (eg, online the cohorts-specific data collection events (figure 1). Area-
supplemental table S1) using R13 scripts to process cohort- level data were thus linked using information collected at the
specific data into the DataSchema format. Processing methods closest year to each data collection event. Harmonisation of
included direct mapping (target variable same as source variable), the environmental-exposure DataSchema variables followed
Wey TW, et al. J Epidemiol Community Health 2021;75:433–441. doi:10.1136/jech-2020-214259 435Original research
Physical-environmental data linked
CLSA_COP 2012 2015
Social-environmental data linked
CLSA_TRA 2011 2015
GLOBE 1991 1997 2004 2011 2014
HAPIEE_CZ 2002 2006
HAPIEE_LT 2005
HAPIEE_RU 2002 2006
HUNT 1984 1995 2006
LASA1 1992 1995 1998 2001 2005 2008 2011
LASA2 2002 2005 2008 2011
RECORD 2007 2011
Figure 1 Overview of start years of data collection events in cohort studies and of time points with linked area-level information. Note that these do
not reflect the time span of each data collection event.
the approach used for the individual-level cohort data. time intervals). Table 3 provides the distribution of DataSchema
Processing of physical-environmental data and social- variables by domain and subdomain of information, following
environmental variables to a common format included direct Maelstrom Research’s cataloguing classification.10
mapping and more complex transformations (eg, dichoto- The 10 subpopulations differed in the number of data collec-
mised variable of average income of area residents below/ tion events (from 1 to 7) and in the number of time points with
above country-specific household mean). linked area-level environmental-exposure data (from 0 to 4).
This resulted in a total of 30 cohort-specific data collection
RESULTS events, 13 of these with linked area-level data on social- and/
Cohort-specific data or physical-environmental exposures (figure 1). Harmonisation
Cohort baseline data collection years ranged from 1984 to 2012, potentials of DataSchema variables were evaluated only where
and the number of data collection events ranged from 1 to 7 applicable, that is, where the cohort collected data for that time
(figure 1). The number of participants in each of the 10 cohort point (eg, not considering sdc_age_6 for subpopulations with-
subpopulations ranged from 1837 to 106 429, with a total of out six follow-up events) and, for environmental-exposure vari-
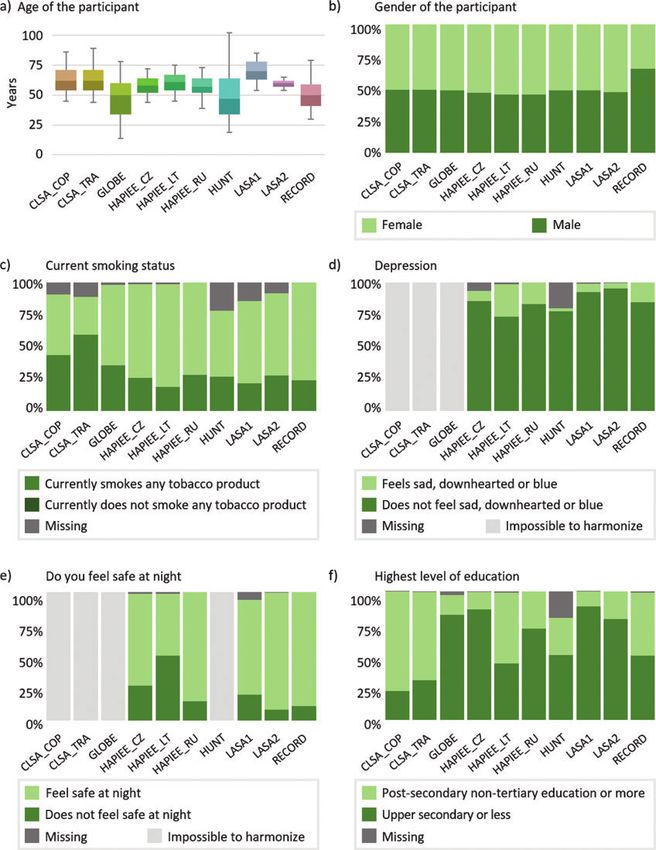
220 621 participants (table 1). Participant sex distributions (over- ables, if area-level data were linked. This resulted in 8165
all 50.7% female, 49.3% male) were generally similar to con- harmonisation potentials to evaluate. The overall percentage
temporary age-matched national populations, with the exception of complete harmonisation statuses was 63.0% (5144 complete
of Residential Environment and CORonary heart Disease Study statuses/8165 evaluated). Individual determinants and outcome
(RECORD), which recruited a larger proportion of males relative variables accounted for 4733 harmonisation statuses, of which
to the general French population (34.5% female, 65.5% male at 2523 (53.3%) were complete and 2210 (46.7%) were impossi-
baseline) (table 2, figure 2). The participants median age at base- ble. Environmental-exposure variables accounted for 3432 sta-
line was 56 years (range 14–102 years). Age distributions at tuses, of which 2621 (76.4%) were complete and 811 (23.6%)
baseline varied widely across sampled subpopulations, frequently were impossible. Harmonisation potential also varied across
differing from contemporary national populations (table 2). domains of information, ranging from 26.4% in life events,
beliefs and values to 73.3% in physical measures and 78.6% in
physical environment (table 3). Finally, harmonisation potential
varied across subpopulations, ranging from 34.7% in HUNT to
DataSchema variables and harmonisation potential
80.6% in LASA1. All harmonisation statuses are presented in
The DataSchema (v2.0) included a total of 2841 variables: 993
online supplemental table S3 and are also available on the
from individual-level determinants and outcome data; 1848 from
Maelstrom catalogue.16 Complete statuses reflect harmonised
environmental-exposure data. As individual-level determinants
variables achieved with processing methods ranging from direct
and outcome variables were only defined for data collection
mapping to complex algorithms using information and condi-
events if they could be generated for more than one subpopula-
tions from many cohort-specific variables, and the complexity
tion or more than one data collection event within subpopula-
of harmonisation algorithms required and any important deci-
tions, numbers differed across time points. There were 166
sions taken in harmonising each variable are available in
individual-level determinants and outcome variables at baseline
RMarkdown files.
and 165, 159, 139, 134, 112 and 105 at follow-ups 1, 2, 3, 4, 5
and 6, respectively. For environmental-exposure variables, 41
social-environmental and 223 physical-environmental (264 Harmonised data content
total) variables were defined for each time point. Online supple Participant distributions and missing values varied across the 10
mental table S2 provides DataSchema information for baseline subpopulations. For example, figure 2 presents participant dis-
variables and administrative variables (data collection years and tributions at baseline for several variables, including feeling
436 Wey TW, et al. J Epidemiol Community Health 2021;75:433–441. doi:10.1136/jech-2020-214259Table 2 Baseline sex and age distributions in the MINDMAP subpopulations and in contemporaneous national populations
CLSA_COP CLSA_TRA GLOBE HAPIEE_CZ HAPIEE_LT HAPIEE_RU HUNT LASA1 LASA2 RECORD
Recruited ages (years) 45–85 45–85 15–75 45–69 45–69 45–69 20+ 55–85 55–65 30–79
Baseline year 2012 2011 1991 2002 2005 2002 1984 1992 2002 2007
Cohort Canada Cohort Canada Cohort Netherlands Cohort Czech Republic Cohort Lithuania Cohort Russia Cohort Norway Cohort Netherlands Cohort Netherlands Cohort France
Sex
ߓFemale 50.9 51.5 51.0 53.4 51.5 49.9 53.4 51.9 54.6 55.9 54.4 53.4 51.0 50.9 51.5 55.5 52.6 53.7 34.5 51.6
ߓMale 49.1 48.5 49.0 46.6 48.5 50.1 46.6 48.1 45.4 44.1 45.6 46.6 49.0 49.1 48.5 44.6 47.4 46.3 65.5 48.4
Ages (years)
15–24 – – – – 11.7 19.2 – – – – – – 7.2* 10.5 – – – – – –
25–34 – – – – 13.2 22.1 – – – – – – 19.4 20.8 – – – – 9.9* 11.5
35–44 – – – – 12.5 20.1 0.5 – – – 0.3 – 19.6 18.9 – – – – 25.6 24.6
45–54 25.2 37.2 27.4 37.7 24.3 16.0 35.8 49.9 25.2 46.9 36.1 52.4 13.8 13.2 0.1 – 0.5 – 27.2 23.7
Wey TW, et al. J Epidemiol Community Health 2021;75:433–441. doi:10.1136/jech-2020-214259
55–64 32.8 31.1 30.9 31.1 22.3 12.2 41.7 36.8 39.5 36.2 40.4 32.2 16.3 14.9 31.1 43.8 99.4 92.7 25.5 20.2
65–74 24.5 19.6 21.8 18.9 15.7 9.7 22.0* 13.4 35.3* 17.0 23.3* 15.3 14.4 12.7 31.2 35.1 0.1* 7.3 9.6 13.9
75–84 16.9 11.3 18.8 11.5 0.1* 0.7 – – – – – – 7.6 7.2 36.5 20.0 – – 2.2* 6.2
≥85 0.6* 0.8 1.1* 0.8 – – – – – – – – 1.7 1.9 1.2* 1.1 – – – –
*Cohort age range limits fall within this age bin.
National statistics were drawn from the United Nations Statistics Division’s Demographic Statistics Database (http://data.un.org/Data.aspx?d=POP&f=tableCode%3A22), which compiles data from questionnaires dispatched annually to national statistical offices.
Distributions are calculated for national data restricted to the same age ranges represented in the cohorts.
Percentages may not add up to 100% due to rounding.
CLSA_COP, Canadian Longitudinal Study on Aging (CLSA) comprehensive (in-depth); CLSA_TRA, CLSA tracking (telephone interview); GLOBE, Health and Living Conditions of the Population of Eindhoven and Surroundings (Gezondheid en Levens Omstandigheden
Bevolking Eindhoven en omstreken); HAPIEE_CZ, The Health, Alcohol and Psychosocial Factors in Eastern Europe Study—Czech Republic; HAPIEE_LT, HAPIEE —Lithuania; HAPIEE_RU, HAPIEE —Russia; HUNT, Nord-Trøndelag Health Study (Helseundersøkelsen i
Nord-Trønelag) 1–2–3 Cohort; LASA1, Longitudinal Aging Study Amsterdam (LASA) first cohort; LASA2, LASA second cohort; RECORD, Residential Environment and CORonary heart Disease Study.
Original
Original research
research
437Original research Figure 2 Participant distributions at baseline for selected harmonised variables. ‘Impossible to harmonise’ indicates variables that could not be harmonised for a subpopulation data set. ‘Missing’ indicates missing values within a subpopulation data set for variables with complete harmonisation status. depressed, feeling safe at night, current smoking status and highest Note that missing values in harmonised data can result from miss- level of education. These illustrate variability in harmonisation ing values in cohort-specific data or harmonisation processing (eg, potential, distribution of participants across categories, and per- cohort-specific values of ‘Don’t know’ and ‘Prefer not to answer’ centage of missing data. Current smoking status and highest level were coded to missing in harmonised variables). of education could be created for all subpopulations, while depres- Various factors can explain the observed subpopulation varia- sion was impossible for three subpopulations and feeling safe at bility including, but not limited to the population sampling night was impossible to generate for four. The percentage of frame, recruitment procedures, data collection methods and participants with secondary-level education or more ranged from question format. An example of exploring the potential influence 11.4% in LASA1 to 77.6% in CLSA_COP, and the percentage of of such factors using a cognitive functioning variable is provided missing data ranged from 0.2% in CLSA_COP to 42.5% in HUNT. in online supplemental tables S4 and S5, figure S1. 438 Wey TW, et al. J Epidemiol Community Health 2021;75:433–441. doi:10.1136/jech-2020-214259
Original
                                                                                                                                                      Original research
                                                                                                                                                               research

 Table 3 Distribution of DataSchema variables and average per cent complete harmonisation potential by domains of information
                                                                                                                                      N DataSchema variables % Complete
 Domain of information (N DataSchema variables per subdomain)                                                                         (% total)              statuses
 Sociodemographic and economic characteristics                                                                                            120 (4.2)           64.1
 Age/birthdate (7), sex/gender (7), marital status (14), family and household structure (20), education (10), residence (28), labor
 force and retirement (17), income, possessions and benefits (17)
 Lifestyle and behaviours                                                                                                                 190 (6.7)           53.7
 Tobacco (45), alcohol (37), nutrition (16), physical activity (73), sleep (12) and leisure activities (7)
 Perception of health, quality of life, development and functional limitations                                                             55 (1.9)           71.4
 Perception of health (21), quality of life (24) and functional limitations (10)
 Diseases, ICD-10                                                                                                                          31 (1.1)           68.0
 Circulatory system disease (19), endocrine, nutritional and metabolic diseases (12)
 Medication and supplements                                                                                                                15 (0.5)           45.7
 Medication and supplement intake (15)
 Physical measures and assessments                                                                                                         91 (3.2)           73.3
 Anthropometry (91)
 Life events, life plans, beliefs and values                                                                                               33 (1.2)           26.4
 Life events (33)
 Cognition, personality and psychological measures and assessments                                                                        171 (6.0)           52.7
 Cognitive functioning (84), psychological distress and emotions (81), other psychological measures and assessments (6)
 Social environment and relationships                                                                                                   523 (18.4)            42.1
 Social network (42), social participation (110), social support (50) and other social environment characteristics (321)
 Physical environment                                                                                                                  1599 (56.3)            78.6
 Housing characteristics (7), built environment/neighborhood characteristics (1592)
 Administrative information                                                                                                                13 (0.5)          100.0
 Date and time (13)
 Total                                                                                                                                2841 (100)
 ICD-10, International Statistical Classification of Diseases and Related Health Problems, 10th Revision.

Documentation of harmonised data sets                                                              data, while protecting participant privacy, and now provides
Information about the MINDMAP project, participating cohort                                        investigators with an efficient means to readily access and analyse
designs and harmonisation potential is available on the Maelstrom                                  the harmonised data set.2
Research catalogue.16 The web interface includes the capacity to                                      The MINDMAP-harmonised data supports exploration of
search cohort-specific and DataSchema variables and documents                                      the impact of social and physical environments from 10
data harmonisation potential across cohort subpopulations. In                                      subpopulations in seven countries, which is quite novel
addition, harmonisation outputs and annotated R processing                                         and critical for studying the influence of urban environment
scripts are available on the MINDMAP GitHub repository.17 As                                       on healthy ageing. Including diverse urban populations pro-
documentation is updated regularly to reference the most recent                                    vides a wide range of exposures to inform how structural
version of harmonised data sets, current online information will                                   differences between countries or cities influence mental well-
vary from the information reported in this article.                                                being and health. While not all core variables could be created
                                                                                                   across all cohort-specific data sets (the global harmonisation
DISCUSSION                                                                                         potential was 62.8%), the data set generated supports valuable
MINDMAP implemented a rigorous multinational collaborative                                         subanalysis across selected variables and/or studies (eg, analyses
process to generate a large harmonised data set, which serves as                                   to date by JM Noordzij et al 2020, M Ruiz et al 2020, EJ
a valuable resource for research on urban environments and                                         Timmermans et al 2020). However, the utility for each research
mental health in ageing adults. The current harmonised data set                                    question needs to be carefully examined, and it is essential to
(v2.0) includes 2841 harmonised variables from 30 data collec-                                     recognise the potential and limitations of the data used.
tion events across six cohort studies (including 10 subpopula-                                     Researchers using the harmonised data set should consider mul-
tions). The breadth of information, diversity of cohort studies                                    tiple potential sources of subpopulation variability, where rele-
and availability of longitudinal and environmental data are                                        vant, for their specific research needs. For example, where data
important strengths of the project. The success of the harmonisa-                                  collection methods and harmonisation processing vary among
tion process depended on the collaborative work of several inter-                                  cohorts, heterogeneity in variable distributions could reflect
national research teams contributing methodological and content                                    a combination of underlying subpopulation differences and
expertise (cognition, environmental exposure, etc). This colla-                                    methodology, which could affect decisions such as selecting
boration was enacted through a rigorous methodological                                             data to analyse, choosing an analytical approach and interpret-
approach and close communication among the domain experts,                                         ing subpopulation heterogeneity.
Maelstrom Research team and cohort study teams. In parallel, the                                      The harmonised data generated presents important limita-
technological infrastructure implemented allowed the interna-                                      tions. Definition of the target variables required a balance
tional teams to work remotely on a central server to harmonise                                     between ensuring integrity of scientific content (being as

Wey TW, et al. J Epidemiol Community Health 2021;75:433–441. doi:10.1136/jech-2020-214259                                                                                 439
Original research
homogenous as possible across studies) and the need to allow
a certain level of heterogeneity (combining information col- What is already known on this subject
lected in different formats).18 These trade-offs were apparent,
► Retrospective data harmonisation is important for achieving or
for example, in mental well-being and cognitive performance
improving comparability of similar data items collected by
variables. Choosing to harmonise only information from
different studies. It enables leveraging existing cohort data
identical scales provides more homogeneity but, as cohorts
resources to address research questions that are difficult or
rarely use common scales, results in including fewer studies.
impossible to address in single studies and has become an
On the other hand, using methods that increase the potential
important tool in collaborative research initiatives.
to integrate information across cohorts (eg, applying cut-offs,
► Harmonisation of existing data raises major challenges, and
standardisation models) generally results in loss of informa-
transparent and thorough documentation of the harmonisation
tion, increased heterogeneity and reduced ability to examine
process is required for researchers to understand and use
certain population differences.19 20 Creation of the initial
harmonised data.
DataSchema (v2.0) attempted to find this balance, but further
exploration of the data content remains essential to better
understand the quality of the variables generated.21–24 This
will entail updates of the harmonised data set, optimising What this study adds
data content to better support current and upcoming research
needs. ► The MINDMAP team harmonised data from six international
Several additional factors should be considered by inves- cohort studies to examine the individual and environmental
tigators aiming to understand and use MINDMAP data. determinants of mental well-being in older adults in diverse urban
These factors include, but are not limited to, the following. populations.
First, subpopulation backgrounds, sampling frames, recruit- ► This article describes the collaborative harmonisation process
ment procedures and data collection profiles are, as implemented and serves to inform researchers on how large
expected, different. Second, subpopulations differ in their multinational collaborations can successfully implement and
representativeness of national populations. Summaries in the document retrospective harmonisation to generate valuable
current article come from raw sample data, but researchers epidemiological data sets.
should consider adjustments for analysis and inference about
underlying populations. For example, CLSA data were
designed to be analysed as one cohort (rather than the two Author affiliations
samples presented here for harmonisation purposes) and 1
Maelstrom Research, Research Institute of the McGill University Health Centre,
with sampling weights (inflation weights for descriptive ana- Montreal, Canada
2
lysis and analytic weights for statistical testing). Third, the Department of Epidemiology and Biostatistics, Amsterdam UMC, VU University
quality and variable resolution of the cohort-specific data Medical Center, Amsterdam Public Health Research Institute, Amsterdam,
Netherlands
provided varied. For example, outliers were noted but left in 3
Department of Public Health, Erasmus University Medical Center, Rotterdam,
the data set, and the impact of missing values was not Netherlands
4
examined. Fourth, the number and timing of data collection Research Department of Epidemiology and Public Health, University College London,
events varied across cohorts. Longitudinal data offers impor- London, UK
5
tant advantages over cross-sectional analyses but introduces Department of Human Geography and Spatial Planning, Utrecht University, Utrecht,
Netherlands
other complexities to be considered during analyses. 25 6
Sorbonne Université, INSERM, Institut Pierre Louis d’Épidémiologie et de Santé
Interpretation of results must be made in consideration of Publique, Nemesis research team, Paris, France
7
such factors. HUNT Research Centre, Department of Public Health and Nursing, Norwegian
The MINDMAP process followed Maelstrom Research guide- University of Science and Technology, Levanger, Norway
8
Levanger Hospital, Nord-Trøndelag Hospital Trust, Levanger, Norway
lines for rigorous retrospective data harmonisation,1 9–11 which 9
Department of Health Research Methods, Evidence, and Impact, McMaster
have also been used by other retrospective harmonisation endea- University, Hamilton, Canada
vours across population-based studies.26–29 The approach 10
McMaster Institute for Research on Aging, McMaster University, Hamilton, Canada
11
ensured generation of comprehensive and searchable documen- Labarge Centre for Mobility in Aging, McMaster University, Hamilton, Canada
12
tation, including (1) cohort-specific designs and variables col- Faculty of Nursing and Health Sciences, Nord Universitet—Levanger Campus,
Levanger, Norway
lected; (2) definition and characteristics of the DataSchema
variables; (3) harmonisation potential across studies; and (4) Twitter Tina Wey @tina_wey.
algorithms used to process cohort-specific data into
Acknowledgements The authors would like to thank Asli Gurer and Aliou Sarr for
DataSchema variables. We hope that the information provided their contribution to data harmonisation work at Maelstrom Research; Dr Mauricio
will help to properly understand, optimally use and further Avendano Pabon for general feedback on manuscript content; Dr Martijn Huisman for
develop the MINDMAP data set. his assistance with data procurement; and Dr Ivet Bayes Marin, Professor Michael
Dewey, Dr Lauren Griffith, Professor Scott Hofer, Dr Graciela Muniz Terrera and Dr Albert
Sanchez Niubo for their invaluable input and expertise on the harmonisation of mental
health and cognition data. This research was made possible using the data/
CONCLUSION biospecimens collected by the Canadian Longitudinal Study on Aging (CLSA). The CLSA
The MINDMAP team implemented a collaborative and transpar- is led by Drs Parminder Raina, Christina Wolfson and Susan Kirkland. We also thank two
ent process to generate a valuable harmonised data set to be used anonymous reviewers for constructive feedback on an earlier version of the manuscript.
for research on ageing and mental well-being across different Contributors IF conceptualised the manuscript. TWW drafted and developed the
country and urban contexts. The current article describes the manuscript with IF. DD, RW and GF contributed to manuscript development and content.
harmonisation process and harmonised data generated. More MAB, DD and RW coordinate the MINDMAP harmonisation infrastructure and database.
MAB, RW, IM, JMN, MR and ET were the leads on harmonisation subject domains.
broadly, it provides an example of how large multinational colla-
Harmonisation leads and GF, AG and AS performed technical harmonisation work. IF
borations can successfully implement and document retrospective coordinates the development of Maelstrom Research harmonisation guidelines and tools
harmonisation to generate valuable epidemiological data sets. that were applied. FJvL and MA coordinate the MINDMAP project. FJvL, MB, BC, SK, PR,
440 Wey TW, et al. J Epidemiol Community Health 2021;75:433–441. doi:10.1136/jech-2020-214259Original
Original research
research
ERS and MH coordinate the included cohort studies and were involved in study design and REFERENCES
data collection. MAB, IM, JMN, MR and ET were also members of cohort study teams. 1 Fortier I, Raina P, Van den Heuvel ER, et al. Maelstrom research guidelines for rigorous
MAB, IM, JMN, MR, ET, FJvL, BC, PR and ERS provided critical feedback on the retrospective data harmonization. Int J Epidemiol 2017;46:103–5.
manuscript. All authors reviewed and approved the manuscript. 2 Beenackers MA, Doiron D, Fortier I, et al. MINDMAP: establishing an integrated
Funding MINDMAP is supported by the European Commission HORIZON 2020 database infrastructure for research in ageing, mental well-being, and the urban
Programme under grant agreement #667661. The article does not reflect the environment. BMC Public Health 2018;18:158.
Commission’s views and in no way anticipates the Commission’s future policy in this 3 Raina PS, Wolfson C, Kirkland SA, et al. The Canadian Longitudinal Study on Aging
area. MAB was funded by a Netherlands Organization for Scientific Research (NWO) (CLSA). Can J Aging 2009;28:221–9.
VENI grant on ‘DenCityHealth: How to keep growing urban populations healthy?’ 4 Kamphuis CBM, Turrell G, Giskes K, et al. Life course socioeconomic conditions,
(grant number 09150161810158). Funding for the Canadian Longitudinal Study on adulthood risk factors and cardiovascular mortality among men and women: a 17-year
Aging (CLSA) is provided by the Government of Canada through the Canadian follow up of the GLOBE study. Int J Cardiol 2013;168:2207–13.
Institutes of Health Research (CIHR) under grant reference: LSA 94473 and the 5 Peasey A, Bobak M, Kubinova R, et al. Determinants of cardiovascular disease and
Canada Foundation for Innovation. The opinions expressed in this manuscript are the other non-communicable diseases in central and Eastern Europe: rationale and design
authors’ own and do not reflect the views of the Canadian Longitudinal Study on of the HAPIEE study. BMC Public Health 2006;6:255.
Aging. PR holds the Raymond and Margaret Labarge Chair in Optimal Aging and 6 Krokstad S, Langhammer A, Hveem K, et al. Cohort profile: the HUNT study, Norway.
Knowledge Application for Optimal Aging, is the Director of the McMaster Institute for Int J Epidemiol 2013;42:968–77.
Research on Aging and the Labarge Centre for Mobility in Aging, and holds a Tier 1 7 Huisman M, Poppelaars J, van der Horst M, et al. Cohort profile: the longitudinal aging
Canada Research Chair in Geroscience. study Amsterdam. Int J Epidemiol 2011;40:868–76.
8 Chaix B, Kestens Y, Bean K, et al. Cohort profile: residential and non-residential
Competing interests None declared. environments, individual activity spaces and cardiovascular risk factors and diseases:
Patient consent for publication Not required. the RECORD cohort study. Int J Epidemiol 2012;41:1283–92.
9 Doiron D, Marcon Y, Fortier I, et al. Software application profile: Opal and Mica:
Ethics approval Secondary use of cohort data for the MINDMAP harmonisation open-source software solutions for epidemiological data management, harmonization
project received a declaration of no objection from the Medical Ethical Committee of and dissemination. Int J Epidemiol 2017;46:1372–8.
Erasmus University Medical Centre. Data transfer agreements were established 10 Bergeron J, Doiron D, Marcon Y, et al. Fostering population-based cohort data
between all partners providing or analysing harmonised data. Cohort studies originally discovery: the Maelstrom research cataloguing toolkit. PLoS One 2018;13:
received informed consent of participants and ethical approval from their respective e0200926.
institutions. CLSA received ethical approval from the Hamilton Integrated Research 11 Fortier I, Burton PR, Robson PJ, et al. Quality, quantity and harmony: the DataSHaPER
Ethics Board. This research has been conducted using the CLSA data set, Baseline approach to integrating data across bioclinical studies. Int J Epidemiol 2010;39:1383–93.
Comprehensive Dataset version 4.0, under Application Number 171013. GLOBE 12 RStudio Team. RStudio: integrated development environment for R. Boston, MA:
received a declaration of no objection from the Medical Ethical Committee of Erasmus
RStudio, Inc, 2016. Available http://www.rstudio.com/
MC. HAPIEE received ethical approval from the Joint UCL/UCLH Committees on the
13 Core Team R. R: A language and environment for statistical computing. Vienna,
Ethics of Human Research. Ethical approval was also received from all local institutes:
Austria: R Foundation for Statistical Computing, 2019. Available https://www.
the Jagiellonian University’s Committee on the Ethics of Clinical Research, the Kaunas
R-project.org/
Regional Biomedical Research Ethical Committee and the Institution Ethical
14 Timmermans EJ, Lakerveld J, Beulens JWJ, et al. Cohort profile: the Geoscience
Commission of the Czech Republic—National Institute of Public Health. HUNT
and Health Cohort Consortium (GECCO) in the Netherlands. BMJ Open 2018;8:
received ethical approval from the Regional Committee for Medical Research Ethics,
e021597.
Mid-Norway, and MINDMAP-specific approval was received from the same
15 Rodgers SE, Demmler JC, Dsilva R, et al. Protecting health data privacy while using
committee. LASA received ethical approval by the Medical Ethical Committee of the
residence-based environment and demographic data. Health Place 2012;18:209–17.
Vrije Universiteit medisch centrum. RECORD received ethical approval from the
16 MINDMAP harmonization project: Maelstrom research [Internet]. Available https://
Commission Nationale de l’Informatique et des Libertés.
www.maelstrom-research.org/mica/harmonization-study/mindmap-hp (accessed 21
Provenance and peer review Not commissioned; externally peer reviewed. Feb 2020)
Data availability statement MINDMAP-harmonised data are not publicly 17 MINDMAP R Markdown repository: GitHub [Internet]. Available https://github.com/
available. Access to harmonised data for MINDMAP researchers is requested through mindmap-cities ((accessed 20 Feb 2020)).
the MINDMAP coordinators and from individual cohort studies following existing 18 Fortier I, Doiron D, Burton P, et al. Invited commentary: consolidating data harmoni-
data-access policies. CLSA study-specific data are available from the Canadian zation: how to obtain quality and applicability? Am J Epidemiol 2011;174:261–4.
Longitudinal Study on Aging (www.clsa-elcv.ca) for researchers who meet the criteria author reply 265–6.
for access to de-identified CLSA data. 19 Griffith LE, van den Heuvel E, Raina P, et al. Comparison of standardization methods
for the harmonization of phenotype data: an application to cognitive measures. Am
Supplemental material This content has been supplied by the author(s). It has not J Epidemiol 2016;184:770–8.
been vetted by BMJ Publishing Group Limited (BMJ) and may not have been peer- 20 Van den Heuvel ER, Griffith LE. Statistical harmonization methods in individual
reviewed. Any opinions or recommendations discussed are solely those of the participants data meta-analysis are highly needed. Biom Biostat Int J 2016;3.
author(s) and are not endorsed by BMJ. BMJ disclaims all liability and responsibility 21 Friedenreich CM. Methods for pooled analyses of epidemiologic studies. Epidemiology
arising from any reliance placed on the content. Where the content includes any 1993;4:295–302.
translated material, BMJ does not warrant the accuracy and reliability of the 22 Curran PJ, Hussong AM. Integrative data analysis: the simultaneous analysis of
translations (including but not limited to local regulations, clinical guidelines, multiple data sets. Psychol Methods 2009;14:81–100.
terminology, drug names and drug dosages), and is not responsible for any error and/ 23 Basagaña X, Pedersen M, Barrera-Gómez J, et al. Analysis of multicentre epidemio-
or omissions arising from translation and adaptation or otherwise. logical studies: contrasting fixed or random effects modelling and meta-analysis.
Open access This is an open access article distributed in accordance with the Int J Epidemiol 2018;47:1343–54.
Creative Commons Attribution 4.0 Unported (CC BY 4.0) license, which permits others 24 Gelman A, Hill J. Data analysis using regression and multilevel/hierarchical models.
to copy, redistribute, remix, transform and build upon this work for any purpose, New York, NY: Cambridge University Press, 2006.
provided the original work is properly cited, a link to the licence is given, and 25 Roux AVD, Mair C. Neighborhoods and health. Ann N Y Acad Sci 2010;1186:125–45.
indication of whether changes were made. See: https://creativecommons.org/licenses/ 26 InterConnect : global data for diabetes and obesity research: InterConnect [Internet].
by/4.0/. Available http://www.interconnect-diabetes.eu/((accessed 22 Feb 2020)).
27 Doiron D, Burton P, Marcon Y, et al. Data harmonization and federated analysis of
ORCID iDs population-based studies: the BioSHaRE project. Emerg Themes Epidemiol
Tina W Wey http://orcid.org/0000-0002-1928-5881 2013;10:12.
J Mark Noordzij http://orcid.org/0000-0001-8580-1365 28 Sanchez-Niubo A, Egea-Cortés L, Olaya B, et al. Cohort profile: the Ageing Trajectories
Milagros Ruiz http://orcid.org/0000-0001-7492-9873 of Health: Longitudinal Opportunities and Synergies (ATHLOS) project. Int J Epidemiol
Erik Timmermans http://orcid.org/0000-0002-3414-7196 2019;48:1052–1053i.
Steinar Krokstad http://orcid.org/0000-0002-2932-6675 29 Integrative Analysis of Longitudinal Studies of Aging (IALSA) [Internet]. Available
Erik Reidar Sund http://orcid.org/0000-0002-0736-5139 http://www.ialsa.org/ (accessed 22 Feb 2020)
Wey TW, et al. J Epidemiol Community Health 2021;75:433–441. doi:10.1136/jech-2020-214259 441You can also read