MultiCharts .NET Programming Guide
←
→
Page content transcription
If your browser does not render page correctly, please read the page content below
MultiCharts, LLC

MultiCharts .NET
Programming Guide
Version 1.1

11/19/2014
Contents
1      Basic Skills .................................................................................................................................................. 4

2      Basic Definitions ........................................................................................................................................ 4

    2.1        Indicator .............................................................................................................................................. 4

    2.2        Signal/Strategy .................................................................................................................................... 5

    2.3 Inputs......................................................................................................................................................... 6

3      Tutorial ....................................................................................................................................................... 7

    3.1        How to Create a C# Indicator .............................................................................................................. 7

    3.2        How to Create a C# Strategy ............................................................................................................. 11

    3.3        Debugging ......................................................................................................................................... 13

4      Understanding PowerLanguage .NET .................................................................................................... 14

    4.1        How Indicators and Signals are Calculated ....................................................................................... 14

    4.2        Data Access ....................................................................................................................................... 19

    4.3        Plotting on the Chart ......................................................................................................................... 23

       4.3.1           Plot and PlotPaintBar ................................................................................................................ 23

       4.3.2           Drawings .................................................................................................................................... 27

    4.4        Output, Alerts and Expert Commentary. .......................................................................................... 29

       4.4.1           Output ....................................................................................................................................... 29

       4.4.2           Alerts ......................................................................................................................................... 31

       4.4.3           Expert Commentary .................................................................................................................. 33

    4.5        Functions and Special Variables ........................................................................................................ 34

       4.5.1           Functions ................................................................................................................................... 34

       4.5.2           Variables .................................................................................................................................... 34

       4.5.3           Barsback .................................................................................................................................... 36

    4.6        Strategies ........................................................................................................................................... 37

       4.6.1           Orders ........................................................................................................................................ 37
                                                                                                                                                                        2
4.6.2 Special Orders ........................................................................................................................... 40
4.6.3 Strategy Performance ............................................................................................................... 43
4.6.4 Backtest and Optimization ........................................................................................................ 46
4.6.5 Real-time ................................................................................................................................... 48
4.6.6 Calculation per Bar .................................................................................................................... 48
4.6.7 Price Movement Emulation within the Bar at Backtest and Optimization ............................... 50
4.6.8 Commissions and Slippage ........................................................................................................ 53
4.6.9 Advanced. How The Strategy Backtesting Engine works .......................................................... 53
4.6.10 Advanced. Portfolio ................................................................................................................... 57
4.6.11 Advanced. AutoTrading ............................................................................................................. 62
4.7 Advanced. Special Features............................................................................................................... 67
4.7.1 Chart Custom Draw ................................................................................................................... 67
4.7.2 Chart ToolBar............................................................................................................................. 69
4.7.3 Access to the data outside the chart window. DataLoader & SymbolStorage ......................... 70
4.7.4 Receiving the data for any symbol and any resolution. DataLoader. ....................................... 71
4.7.5 Extended Trading Possibilities. TradeManager. ........................................................................ 76
4.7.5.1 Basic statements. ...................................................................................................................... 76
4.7.6 Volume Profile ......................................................................................................................... 83
5 Compilation. Modules and assembly handling. ........................................................................................ 86
6 Integration with Microsoft Visual Studio 2010/2012/Express .................................................................. 87
6.1 Debugging with Microsoft Visual Studio 2010/2012 ........................................................................ 88
6.2 Debugging with Microsoft Visual Studio Express .............................................................................. 89
31 Basic Skills
Indicators and signals for MultiCharts .NET can be written using the C# and VB.NET programming languages.
The following information requires that the reader has basic knowledge of any of the C# or VB.NET
programming languages. If not, then we recommend reviewing the following reference before continuing.
This Programming Guide describes the process of creating and applying studies in MultiCharts .NET. For
general information on how to use MultiCharts .NET (i.e. how to create charts, scanner and DOM windows
etc.) please refer to MultiCharts Wiki.
Description of all PowerLanguage .NET methods and classes can be found in Power Language .NET Help (in
PoweLanguage .NET main menu select Help and click PowerLanguage .NET Help).
2 Basic Definitions
NOTE: Both indicators and signals can be referred to as studies or techniques.
2.1 Indicator
Indicators in MultiCharts .NET allow the user to analyze price and trade information and to graphically
display it on the chart. To add an Indicator on a chart, right-click on the chart, click Insert Study, select the
Indicator tab, then select the required Indicator and click OK.
For example, the ADX indicator calculation results will appear in a graph displayed at the bottom of the
chart.
4In MultiCharts .NET indicators are objects of the class, inherited from IndicatorObject class. Indicators,
unlike other types of studies (functions, signals), can create and use plot objects (IPlotObject). These
objects allow indicators to draw graphs, histograms, bars, etc. Before using plots, they should be created in
the Create () method of indicator class using the AddPlot() method.
Here is an example of a simple indicator, which draws a gaps graph of day bars (the difference between the
current bar open and the previous bar close in percent) in the form of histogram at the bottom of the chart:
public class DAY_GAP : IndicatorObject {
public DAY_GAP(object _ctx):base(_ctx){}
private IPlotObject plot_gap;//Plot object for graph drawing
protected override void Create() {
//Adds a graph to the chart
plot_gap = AddPlot(new PlotAttributes("GAP",
EPlotShapes.Histogram, Color.Red));
}
protected override void CalcBar(){
// Determines next bar plot value
plot_gap.Set(100*((Bars.Open[0] -
Bars.Close[1])/Bars.Open[0]));
}
}
2.2 Signal/Strategy
Trade strategies in MultiCharts .NET consist of one or several signals which are algorithms for order
generation based on the analysis of price information on the chart.
For example, a strategy consists of one or more signals (algorithms) as shown in the chart below.
Bollinger_Bands_LE signal is an algorithm of order generation for long position entry.
5Bollinger_Bands_SE signal is an algorithm of order generation for short position entry.
Profit_Target signal is an algorithm of profit fixation.
Stop_Loss is an algorithm protecting the position from a loss.
A signal is able to generate orders in accordance with a built-in algorithm, which will be executed by the
strategy.
Signals have access to the information about the current condition and performance of a strategy.
To add a strategy with one or several signals to a chart, right clink on the chart, select Insert Study, then
select the Signals tab.
After the strategy calculation you can see markers of orders executed by the strategy. A report upon the
results of strategy calculation can be found in the View menu in the Strategy Performance Report.
In MultiCharts .NET signals are objects of the class, inherited from SignalObject.
In the process of the signal calculation orders will be generated according to the algorithm as described in
the CalcBar () method. These orders will subsequently be executed by the strategy.
Here is an example of a simple signal:
public class TestSignal : SignalObject
{
public TestSignal(object _ctx):base(_ctx){}
// Declaring orders-objects
private IOrderMarket buy_order;
protected override void Create() {
buy_order = OrderCreator.MarketNextBar(new
SOrderParameters(Contracts.Default, EOrderAction.Buy));
}
protected override void CalcBar(){
// Signal’s algorithm
//…………………………
//Order Generation
buy_order.Send();
}
}
2.3 Inputs
Inputs in MultiCharts .NET are user-defined options of the studies. Almost no indicators or signals exist
without them. Inputs in PowerLanguage .Net are a public property of a study class, marked with an attribute
[Input]. There are different types of inputs: int, double, string, DateTime, Color, Enum.
6An example of integral type input in the study:
[Input]
public int length { get; set; }
Now this input will be available in Format Study dialog on the Inputs tab under the name “length”. Input
values, chosen by the user in “Format Study” dialog, become available in the protected override void
StartCalc() class study method.
Default values can be set in study constructor.
Example:
A study has one adjustable double type parameter:
public class Test : IndicatorObject {
public Test(object _ctx):base(_ctx) {
Percent = 10; // Default value
}
[Input]
public double Percent {get; set;}//Input in percent.
}
3 Tutorial
3.1 How to Create a C# Indicator
Let’s say that we want to write an indicator showing trend strength (please note that it is just an example
and this indicator does not show true trend strength) in the form of a histogram. It will be calculated on the
average price difference for a fast and a slow period and expressed in percent from the Close price of the
current bar.
To create a new indicator, it is necessary to start PowerLanguage .NET Editor. In the editor main menu,
select File, then select New, then New Indicator.
In the dialog window below:
7Choose C# language and enter the name of the new indicator, i.e. TrendPower.
The PowerLanguage Editor will automatically create a template of an indicator class with one plot.
Let’s rename it for our convenience:
private IPlotObject power_line;
In the Create() method choose the histogram style, color and add a text marker:
protected override void Create() {
power_line = AddPlot(new PlotAttributes("Power",
EPlotShapes.Histogram, Color.Cyan));
}
Two inputs will also be necessary for setting the quantity of bars for the calculation of the average price for
fast and slow periods:
[Input]
public int fastLength { get; set; }
[Input]
public int slowLength { get; set; }
Assume that fastLength = 7, slowLength = 14 and are set as the default values. This is done in the indicator
constructor:
public TrendPower(object _ctx):base(_ctx)
{
fastLength = 7;
slowLength = 14;
}
Write a private function that calculates average median price for the period:
private double AvgVal( int length )
{
double aval = 0.0;
for (int i = 0; i < length; ++i)
aval += Bars.AvgPrice(i);
return aval / length;
}
The logic of plot value setting on each bar should be described in the CalcBar() method:
protected override void CalcBar(){
double afast = AvgVal(fastLength);//Average price for a short period
double aslow = AvgVal(slowLength);//Average price for a long period
//Calculation of trend strength in percent from a close price of the
current bar
double power = Math.Abs(100*(afast - aslow)/Bars.Close[0]);
power_line.Set(power);//Plot value setting for the current bar.
}
As a result, we have an indicator, plotting a trend strength histogram upon two averages:
public class TrendPower : IndicatorObject {
8public TrendPower(object _ctx):base(_ctx)
{
fastLength = 7;
slowLength = 14;
}
private IPlotObject power_line;
[Input]
public int fastLength { get; set; }
[Input]
public int slowLength { get; set; }
private double AvgVal( int length )
{
double aval = 0.0;
for (int i = 0; i < length; ++i)
aval += Bars.AvgPrice(i);
return aval / length;
}
protected override void Create() {
power_line = AddPlot(new PlotAttributes("Power",
EPlotShapes.Histogram, Color.Cyan));
}
protected override void CalcBar(){
double afast = AvgVal(fastLength);
double aslow = AvgVal(slowLength);
double power = Math.Abs(100*(afast - aslow)/Bars.Close[0]);
power_line.Set(power);
}
}
Press F7 button for compilation of the indicator. It can now be plotted on the chart. Choose it in the Insert
Study dialog window on the Indicator tab.
9Next, we will highlight the areas of the histogram with a strong trend. Once the limits for what is to be
considered as a strong trend and what is to be considered as a weak trend and their corresponding colors
are determined inputs can be created as follows.
[Input]
public double strongLevel { get; set; }
[Input]
public Color strongColor { get; set;}
[Input]
public Color weakColor { get; set;}
In the indicator logic the plot color will be chosen depending on the trend strength:
protected override void CalcBar(){
double afast = AvgVal(fastLength);
double aslow = AvgVal(slowLength);
double power = Math.Abs(100*(afast -
aslow)/Bars.Close[0]);
Color pl_col = weakColor;
if (power >= strongLevel ) pl_col = strongColor;
power_line.Set(power, pl_col);
}
Now the indicator highlights red areas with a strong trend:
103.2 How to Create a C# Strategy
The indicator, which shows the strength trend has been created and defined. Now, on the basis of this
indicator, we will build a strategy that will open a position at the beginning of a strong trend and close the
position when the trend weakens.
In the PowerLanguage .NET Editor main menu, select File, then select New, then click New Signal and create
a new signal with the name TrendPower. Next, copy the trend strength calculation logic with inputs from
the previous indicator. As a result, the following signal will be created:
public class TrendPower : SignalObject {
public TrendPower(object _ctx):base(_ctx)
{
fastLength = 7;
slowLength = 14;
strongLevel = 0.9;
}
[Input]
public int fastLength { get; set; }
[Input]
public int slowLength { get; set; }
[Input]
public double strongLevel { get; set; }
protected override void Create() {
}
private double AvgVal( int length )
{
double aval = 0.0;
for (int i = 0; i < length; ++i)
aval += Bars.AvgPrice(i);
return aval / length;
}
protected override void StartCalc() {
}
protected override void CalcBar(){
double afast = AvgVal(fastLength);
double aslow = AvgVal(slowLength);
double power = Math.Abs(100*(afast - aslow
/Bars.Close[0]);
}
}
Add strong trend direction definition method. The method returns:
1 if High and Low of the current bar are higher. In this case, the trend is considered to be an uptrend,
-1 if High and Low of the current bar are lower. In this case the trend is considered to be a downtrend.
110 if the trend is not specified.
private int TrendDir(){
if ((Bars.Low[0] < Bars.Low[1])&&(Bars.High[0] <
Bars.High[1])) return -1;
if ((Bars.Low[0] > Bars.Low[1])&&(Bars.High[0] >
Bars.High[1])) return 1;
return 0;
}
A long position will be opened by trend_LE market order, a short position by trend_SE market order. The
position will be closed by one of the following orders: long position by trend_LX, short position by trend_SX.
Let’s create these objects in our signal:
private IOrderMarket trend_LE;
private IOrderMarket trend_SE;
private IOrderMarket trend_LX;
private IOrderMarket trend_SX;
protected override void Create() {
trend_LE = OrderCreator.MarketNextBar(new
SOrderParameters(Contracts.Default, "Tend LE", EOrderAction.Buy));
trend_SE = OrderCreator.MarketNextBar(new
SOrderParameters(Contracts.Default, "Tend SE", EOrderAction.SellShort));
trend_LX = OrderCreator.MarketNextBar(new
SOrderParameters(Contracts.Default, "Tend LX", EOrderAction.Sell));
trend_SX = OrderCreator.MarketNextBar(new
SOrderParameters(Contracts.Default, "Tend SX", EOrderAction.BuyToCover));
}
The logic of this signal should be written in the CalcBar() method. If the trend is weak and becomes strong
or if the trend is strong and becomes weak a long or short position will be opened depending upon the
direction of the trend with the option to close any position. A Local variable should be created to save the
previous strength trend value and its value will be reset before the beginning of every calculation of the
strategy:
double old_power;
protected override void StartCalc() {
old_power = 0;
}
protected override void CalcBar(){
double afast = AvgVal(fastLength);
double aslow = AvgVal(slowLength);
double power = Math.Abs(100*(afast - aslow)/Bars.Close[0]);
if ( (power >= strongLevel)&&(old_power < strongLevel) ){
switch(TrendDir()){
case -1:
trend_SE.Send();
break;
case 1:
trend_LE.Send();
break;
}
}
if ((CurrentPosition.Side != EMarketPositionSide.Flat)
12&&(old_power >= strongLevel)
&&(power < strongLevel))
{
trend_LX.Send();
trend_SX.Send();
}
old_power = power;
}
To compile the signal, press F7. Once this is complete you can apply the signal to the chart. After the
calculation you will see the order markers on the chart.
The results of the strategy can be seen in Strategy Performance Report by selecting View in the main menu
and clicking on the Strategy Performance Report.
3.3 Debugging
Sometimes an indicator or signal may not work properly. So it will require some additional debugging. This
can be done in two ways:
1) Using Microsoft Visual Studio. It is a good professional tool and it is much easier to debug the
code there. The procedure is described in the following chapter: Integration with Microsoft
Visual Studio 2010/2012/Express.
2) Without using a special debugger. In this case the default PLEditor .NET Editor can be used. It is
possible to trace necessary values of variables to either a previously created file or to the
Output of the editor by means of scripting language.
#if DEBUG
Output.WriteLine("CurrentBar = {0}; Close = {1}",
Bars.CurrentBar, Bars.CloseValue );
#endif
134 Understanding PowerLanguage .NET
4.1 How Indicators and Signals are Calculated
4.1.1 Basics
In MultiCharts .NET all studies (indicators and signals) are applied to the chart via the Insert Study window.
Indicators can be applied to any chart symbol by clicking the right mouse button on the subchart to see the
shortcut menu and selecting Insert Study. The constructor and the Create() method for study classes will be
executed once when a study is selected, now indicators will create plots and signals will create orders. The
StarCalc() method of study class is called every time before the calculation starts. The script begins to work
through all of the historic bars of the symbol and on each bar the CalcBar() method is called. After the
calculation of all historic bars, studies switch to the Real-time calculation on Close of every bar mode. For
indicators, calculation on every tick received in real time can be selected. To do so, right-click on the chart to
see the shortcut menu, select Format Indicators, select the indicator, then select Format, select the Properties
tab and check the Update on Every Tick check box.
4.1.2 For Advanced Users
MultiCharts. NET is a multithread application and it is important to know in which threads studies are
created, executed and deleted. There is a main thread (UI) and working threads, where the calculation of
indicators and signals is executed.
14Starting from the moment of applying a study to a chart, scanner or portfolio, several stages occur before
receiving the calculation results.
4.1.2.1 Construction.The Create() method
.
During this stage a new study object is created. Study object is created in the main thread and includes
constructor and the Create() method calling. This process can be managed by the user through declaring
and implementation of the method:
protected override void Create();
The Create() method is called first and only one time, immediately after the creation of a new study object.
Here, the following is available: variables creation methods, adding plots function for indicators and strategy
order creation factory:
a) PowerLanguage.CStudyControl.CreateSimpleVar and
PowerLanguage.CStudyControl.CreateSeriesVar for variable creation (please see description of
these variables below).
private VariableObject m_testVar;
private VariableSeries m_seriesVar;
private VariableSeries m_seriesVar2;
protected override void Create()
{
m_testVar = (VariableObject)CreateSimpleVar();
m_seriesVar = (VariableSeries)CreateSeriesVar();
m_seriesVar2 = new VariableSeries(this);
}
b) Adding plots to an indicator, for example, for MACD indicator:
private IPlotObject Plot1;
protected override void Create() {
Plot1 =
AddPlot(new PlotAttributes("MACD", 0, Color.Cyan,
Color.Empty, 0, 0, true));
}
c) Strategy and signal order creation, using the OrderCreator property, for example, for RSI
signals:
private RSI m_RSI;
private VariableSeries m_myrsi;
private IOrderMarket m_RsiLE;
protected override void Create(){
m_RSI = new RSI(this);
15m_myrsi = new VariableSeries(this);
m_RsiLE = OrderCreator.MarketNextBar(new
SOrderParameters(Contracts.Default, "RsiLE", EOrderAction.Buy));
}
Please note, that all the listed methods and properties will be available ONLY at the stage of study
construction (the Create() method). If they are used in the initialization or calculation stages, the study will
compile and will be ready for application, but if applied to a chart or scanner window, they will generate an
error message.
For example, plot addition is taken out of the Create() method in StarCalc():
private IPlotObject Plot1;
protected override void StartCalc() {
Plot1 =
AddPlot(new PlotAttributes("MACD", 0, Color.Cyan,
Color.Empty, 0, 0, true));
}
If this study is applied to a chart or a scanner, a new study will be created, but when it comes to the
initialization stage (the StarCalc() method), the AddPlot instruction, which can be applied only in the
Create() method, will be detected and the study will switch to offline mode. The following error message
will appear:
Error message.
Caption: "Error in study "MACD" :";
Message: "Unaccessible property(method): AddPlot. Construct only."
There are properties, available from the moment of object construction through its full life cycle:
a) Graphic renderers of the following objects: texts, trend lines, arrows – these are the properties
of DrwText, Drw, TrendLine, DrwArrow.
b) The read-only Output property gives access to the Output window that displays study logs.
c) The read-only Alerts property gives access to alerts (pop-up messages, sound signals and e-
mails).
d) The read-only Name property is the study name.
4.1.2.2 Initialization. The StartCalc() method
The StartCalc() method is called only once, before the every calculation.
The StartCalc() method is executed in the working thread and can be called repeatedly during the object life
cycle (unlike the Create() method). To do this you must initialize the start values for study variables, the
inputs for functions used in it and other custom objects in the StartCalc() method.
16We can take the ADX indicator as the simplest example. One function, one serial variable and one plot are
used here:
private Function.ADX m_adx1;
private VariableSeries m_adxvalue;
private IPlotObject Plot1;
In object creation stage (Create), we create the the objects of the function and variable and also add a new
plot object. In initialization stage (StartCalc) we create the initial value of this variable and initialize the
function input with a user input of the indicator itself:
[Input]
public int length { get; set; }
protected override void Create(){
m_adx1 = new Function.ADX(this);
m_adxvalue = new VariableSeries(this);
Plot1 =
AddPlot(new PlotAttributes("ADX", 0, Color.Cyan,
Color.Empty, 0, 0, true));
}
protected override void StartCalc(){
m_adx1.Length = length;
}
In initialization stage there is access to the price data through the Bars property and the BarsOfDate ()
method.
Also, in this stage other indicator and strategy properties become available:
a) The read-only Environment property – environment information
b) The read-only MaxDataStream property – maximum number of data series, used by the study
c) The bool IsExist method defines whether data series with a specified number exists on the chart (or in
portfolio)
d) The read-only ExecInfo property – current calculation context information (calculation data series
number, execution offset, MaxBarsBack and MaxBarsForward properties )
e) The read-only ExecControl property – allows the user to interrupt the calculation, recalculate the
study, or force the study to calculate over a given period of time
f) The read-only VolumeProfile and VolumeProfileOfDataStream properties – access to volume profile
g) The read-only TradeManager property – access to trade information
h) The read-only StrategyInfo property – access to strategy information
i) The read-only Portfolio property – access to portfolio performance
17j) The read-only Commission, InitialCapital, InterestRate, Account, Profile, Slippage properties – current
strategy properties
k) The write-only CustomFitnessValue property sets custom value for optimization
l) The ChangeMarketPosition method – market position change without sending an order.
All of the above listed properties and methods are available from the moment of initialization and
during the calculation. Calling on them in the construction stage (the Create () method) will result in
an error message being generated. For example:
Message: "Unaccessible property (method): ExecControl. Initialize or
Execute."
4.1.2.3 Study Calculation on Data Series.The CalcBar() method
After the previous two stages (Create, StartCals) have finished their operations, let’s move to bar-by-bar
calculation of the study. The CalcBar() method will be called on for each bar of the data series, on which the
study is applied, from left to right, in its turn. On each bar we have access to the data for that bar and for
the previous bars on which the calculation was made (the CalcBar() method was called).
NOTE: All price data series where FullSymbolData of the IInstrument property was used will be available;
this will be discussed separately.
Here is a simple example:
namespace PowerLanguage.Indicator {
public class _plotAvgPrice : IndicatorObject {
public _plotAvgPrice(object ctx) : base(ctx) {}
private IPlotObject Plot1;
protected override void Create() {
Plot1 = AddPlot(new PlotAttributes("Close"));
}
protected override void CalcBar() {
Plot1.Set(0, (Bars.HighValue + Bars.LowValue) / 2 );
}
}
}
The CalcBar() method is called starting from the first bar of the calculation and all following bars. This
means the study calculation is in the context of the current bar, that is why the expression (Bars.HighValue +
Bars.LowValue) / 2 will be calculated for the current bar, and Plot1.Set instruction will draw the calculated
value also on the current bar. After the calculation on the last bar the final graph of average prices for the
whole chart will be generated (scanner will show the last calculated value).
184.1.2.4 Calculation Stop. The StopCalc() method.
This method is called when the study calculation has finished, the study is in off mode or deleted from the
price data series. The StopCalc() method can be called in the main or working thread.
4.1.2.5 Object Removal. The Destroy() method.
Study removal is executed in the main thread. The Destroy() method will be called before the removal. This
method is called only once during the life circle of an indicator object (signal).
In the calculation process various .NET exceptions can be generated. It can be easily seen during debugging.
You should not intercept any exceptions other than yours, as many mechanisms, for example, BarsBack
auto detect, are realized through the generation and further processing of a specific exception. Please,
remember, that an exception is NOT always an ERROR FLAG!
4.2 Data Access
Any study, whether it is an indicator or a signal, is an object that is applied to a price data series.
Consequently, data and attributes of this data series are available from any study. Therefore, it is not
important, which type of application we are working with in MultiCharts .NET: a chart, a scanner or a
portfolio.
Data. A basis which all traders and market analysts are working with is price and volume data of various
instruments. Visually, this data can be introduced as bars, which displays price movement for a particular
period of time.
Access to the data from the study is executed through:
IInstrument Bars { get; }
IInstrument BarsOfData(int dataStream);
All the information about price data series bars from the current calculation point back to history can be
extracted by means of this property and method. The BarsOfData() method allows to get data upon the
secondary data series, applied to the chart or portfolio.
At creation any study is connected to a particular data stream, the one which it is applied to. This data
stream is main source for this data series. The Bars property returns a reference to the object implemented
via the Instrument interface and is related to the basic data series of the study.
There can be only one data stream in the scanner; it will be the main source for the study. Only indicators
can be applied to scanner instruments.
In portfolio there can be several data streams, but only the first one can be basic for the studies, only
strategies can be applied to portfolio.
There can be several data streams on the chart but for signals, like for the portfolio, only the first one will be
the main source. For indicators, it can be any of applied to the chart.
19The main data stream can be chosen in the indicator settings (click Format Study …, select Properties tab).
The BarsOfData(int dataNum) method should be used in order to access other data streams data, to be
applied to the chart or (portfolio). The reference to the object, providing data of the specified instrument,
will be returned according to the number of the data stream.
Data available through the IInstrument interface is described below.
4.2.1 Instrument Data.
a) Prices: open, high, low, close of the current and previous count bars, for example:
double curClose = Bars.CloseValue; - get current close price
double prevBarOpen = BarsOfData(2).Open[1]; - get open price of previous bar from
second data stream
b) Volumes, ticks through the properties: Volume, Ticks, UpTicks, DownTicks, VolumeValue,
TicksValue, UpTicksValue, DownTicksValue, for example:
double curVolume = Bars.VolumeValue; - get current bar volume
c) Time: Bars.Time, Bars.TimeValue, for example:
DateTime prevBarTime = Bars.Time[1]; - get time of previous bar
d) Depth of Market data: the DOM property, for example:
if ( Bars.DOM.Ask[0].Size > 100 ) buy_order.Send(); - send buy order if first DOM
level ask size more than 100
e) Status Line data: status line data when working either on the chart or scanner, for example:
double dailyLow = StatusLine.Low; - get daily low from status line.
4.2.2 Data for Calculation
a) Current calculation bar: the CurrentBar property, for example:
double medPrice = 0;
if ( Bars.CurrentBar > 5 ) medPrice = ( Bars.Close[5] + Bars.CloseValue
) / 2;
If current bar number more than 5 calculate median price between close 5 bars ago and current
bar close.
b) Current calculation bar status: the Status property,for example:
if ( Bars.Status == EBarState.Close ) { /*check if we calculating on
bar close */ }
20c) Indicators of the last calculation bar and the last session bar, properties LastBarOnCharts,
LastBarInSession, for example:
if (Bars.LastBarOnChart) plot1.Set(Bars.CloseValue); {/*start plotting
close value of bars since last bar */}
4.2.3 Properties of the Data Series, which a study is applied to
Attributes of Symbol, which the data series was built on, are available through the following property:
IInstrumentSettings Info { get; }
Instrument properties:
MTPA_MCSymbolInfo2 ASymbolInfo2 { get; }
string Name { get; } - Instrument name, for example, ESU3, EUR/USD;
string DataFeed { get; } - Data source, for example, CQG, eSignal;
string Description { get; } - Instrument description in words, for example, for ESU3 "S&P
500 E-mini Futures Sep13";
ESymbolCategory Category { get; } - Value from the list of categories, for example, futures,
Forex or stock;
string Exchange { get; } - Exchange, where the instrument is trading;
double PriceScale { get; } - Instrument price scale, for example, for ES=1/100 ;
double PointValue { get; } - Nominal value for one point for the instrument, for example,
for ES=0.01;
double BigPointValue { get; } - Profit/loss money equivalent in the instrument currency,
when the price moves by one minimum increment, for example, for ES = 50 ;
double MinMove { get; } - Minimum quantity of points, when the price moves by one
minimum increment, for example, for ES = 25;
Resolution Resolution { get; } - For example, for created ES 5 of minute chart,
Resolution.ChartType = ChartType.Regular; Resolution.Type = EResolution.Minute; Resolution.Size =
5;
double DailyLimit { get; } - Maximum price movement allowed during a session (currently
is not used in MultiCharts .NET);
DateTime Expiration { get; } - Expiration date of the instrument (for futures), for example,
ESU3 09/19/2013;
RequestTimeZone TimeZone { get; } - Local, Exchange or GMT;
RequestQuoteField QuoteField { get; } - Ask, Bid, or Trade ;
21string SessionName { get; } - Session name (Check or add, or change session settings in
QuoteManager) ;
double StrikePrice { get; } - For options;
OptionType OptionType { get; } - For options, Put or Call;
DataRequest Request { get; } - Request information, by which the symbol was built;
4.2.4 StatusLine
When a study is applied to the chart or scanner, if the data source supports subscription to the status line
data its data will be available from the study through the StatusLine property of the IInstrument interface.
StatusLine itself provides the following information:
a) the Ask and Bid read-only properties– return current Ask, Bid
b) the Time read-only property – returns snapshot time of the status line
c) Open, High, Low, Close read-only properties – return open, high, low, close of the current day
(current trade session, depending on the data source)
d) the Last read-only property – returns the last price for the instrument;
e) the PrevClose read-only property – returns the close price of the previous day (session);
f) the TotalVolume and DailyVolume read-only properties – return corresponding volumes of the
status line;
g) the OpenInt read-only property – returns open interest.
4.2.5 Random Data Access.
Starting from the initialization stage, the user gets access to all the data series that are used for calculation.
It can be done by executing the FullSymbolData property of the IInstrument interface.
Example. Let’s make the average price calculation of the whole data series on the initialization stage of the
indicator and display the result during the calculation:
using System;
namespace PowerLanguage.Indicator
{
public class ___test : IndicatorObject
{
private IPlotObject Plot1;
public ___test(object ctx)
: base(ctx)
22{
m_chartAvgPrice = 0;
}
private double m_chartAvgPrice;
protected override void Create()
{
Plot1 = AddPlot(new PlotAttributes("Test"));
}
protected override void StartCalc()
{
int totalBars = Bars.FullSymbolData.Count;
double totalPrice = 0;
for (int idx = 0; idx < totalBars; idx++)
totalPrice += Bars.FullSymbolData.Close[-idx];
m_chartAvgPrice = totalPrice / totalBars;
}
protected override void CalcBar()
{
Plot1.Set(0, m_chartAvgPrice);
}
}
}
Please note that bar indexation is executed, starting from the current bar, leftwards with positive indices,
and rightwards with negative ones.
4.3 Plotting on the Chart
4.3.1 Plot and PlotPaintBar
There are two types of plots in MultiCharts .Net: graphic and text. And both are inherited from
IPlotObjectBase:
public interface IPlotObjectBase
{
Color BGColor { get; set; } //Backgroung color
string Name { get; }//Plot name (set when the object is created)
void Reset();//Not to draw the plot on this bar
void Set(T val);//Set value on the current bar
void Set(T val, Color color); //Set value and color
void Set(T val, KnownColor color); //Set value and color
}
1. Graphic Plots are executed by the following interface:
public interface IPlotObject : IPlotObjectBase
{
IPlotAttributesArray Colors { get; }//Plot color
23IPlotAttributesArray Values { get; }//Plot value
IPlotAttributesArray Widths { get; }//Thickness
void Set(int barsAgo, double val);//Set value with displacement
void Set(double val, Color color, int width);//Set value, color, thickness
void Set(double val, KnownColor color, int width);//Set value, color, thickness
void Set(int barsAgo, double val, Color color); //Set value, color with
displacement
void Set(int barsAgo, double val, KnownColor color); //Set value, color
with displacement
void Set(int barsAgo, double val, Color color, int width); //Set value,
color, thickness with displacement
void Set(int barsAgo, double val, KnownColor color, int width); //Set
value, color, thickness with displacement
}
Displacement barsAgo = 0 for the current bar. barsAgo > 0 displacement to the history(barsAgo = 1 – the
previous bar.) barsAgo < 0 – displacement to the future(barsAgo = -1 –the next bar).
Graphic indicators are created in the Create() study class method through the following methods:
AddPlot() or AddPlot(PlotAttributes info).
In PlotAttributes plot style can be set:
PlotAttributes(int plotNum);// Plot number (0-99)
PlotAttributes(string name);// Plot string name
PlotAttributes(string name, int plotNum);//Plot name and number
PlotAttributes(string name, EPlotShapes type, Color fgColor);//Name, type and
color
PlotAttributes(string name, EPlotShapes type, Color fgColor, Color bgColor, int
width, int style, bool showLastPriceMarker); //Name, type, color, background
color, thickness, style, show/hide plot marker on the chart.
Plot types:
public enum EPlotShapes
{
Line = 0,
Histogram = 1,
Point = 2,
Cross = 3,
BarHigh = 4,//High of the bar (for PaintBar), BarLow is obligatory to use
it
24BarLow = 5, //Low of the bar (for PaintBar), BarHigh is obligatory to use
it
LeftTick = 6,//tick to the left from the bar (for PaintBar)
RightTick = 7,//tick to the right from the bar (for PaintBar)
}
BarHigh, BarLow, LeftTick, RightTick allow to draw a complete bar. To build a bar OHLC type, four plots are
necessary.
The Style property (line styles):
0 (full line)
1 (dashes)
2 (dots)
3 (dash-dot)
4 (dash-two dots)
5 (no line)
Tip: If it is necessary to paint bars in the indicator, then click the checkbox Same As Symbol in dialog window
of indicator settings, or for the indicator class, set the [SameAsSymbol(true)] attribute.
25This is an example of the indicator that paints uptrend bars in blue and downtrend bars in red:
[SameAsSymbol(true)]
public class SB_Up_Dn : IndicatorObject {
public SB_Up_Dn(object _ctx):base(_ctx){}
private IPlotObject plotH;
private IPlotObject plotL;
private IPlotObject plotO;
private IPlotObject plotC;
protected override void Create() {
plotH = AddPlot(new PlotAttributes("", EPlotShapes.BarHigh,
Color.Red));
plotL = AddPlot(new PlotAttributes("", EPlotShapes.BarLow,
Color.Red));
plotO = AddPlot(new PlotAttributes("", EPlotShapes.LeftTick,
Color.Red));
plotC = AddPlot(new PlotAttributes("", EPlotShapes.RightTick,
Color.Red));
}
protected override void CalcBar(){
if (Bars.Close[0] > Bars.Open[0]){
plotH.Set(Bars.High[0], Color.Blue);
plotL.Set(Bars.Low[0], Color.Blue);
plotO.Set(Bars.Open[0], Color.Blue);
plotC.Set(Bars.Close[0], Color.Blue);
}
if (Bars.Close[0] < Bars.Open[0]){
plotH.Set(Bars.High[0], Color.Red);
plotL.Set(Bars.Low[0], Color.Red);
plotO.Set(Bars.Open[0], Color.Red);
plotC.Set(Bars.Close[0], Color.Red);
}
}
}
Now the indicator will be drawn, not on a separate subchart, but right above the symbol that it is applied to.
262. Text plots are used to display text information in the indicator status line and are represented by the
following interface:
public interface IPlotObjectStr : IPlotObjectBase
{
}
Let’s illustrate it with an example. The indicator will output values to the status line: “UP” when Close >
Open and “DN” when < Open :
public class UpDn : IndicatorObject {
public UpDn(object _ctx):base(_ctx){}
private IPlotObjectStr plot_str;
protected override void Create() {
plot_str = AddPlot(new StringPlotAttributes(1));
}
protected override void CalcBar(){
plot_str.Set("FLAT", Color.Cyan);
if (Bars.OpenValue < Bars.CloseValue)
plot_str.Set("UP", Color.Yellow);
if (Bars.OpenValue > Bars.CloseValue)
plot_str.Set("DN", Color.Red);
}
}
The result:
4.3.2 Drawings
There are three types of drawings in MultiCharts .NET, which can be created from a study: TrendLine, Text,
and Arrow. Every drawing type is created by the corresponding factory, which can be accessed through the
following properties:
ITextContainer DrwText { get; }
ITrendLineContainer DrwTrendLine { get; }
IArrowContainer DrwArrow { get; }
27Each property allows accessing the collection of drawings of a particular type for the given script.
All of the drawings are created by calling the Drawing’s Create () method (IArrowContainer.Create(),
ITextContainer.Create(), ITrendLineContainer.Create()).
Example:
protected override void CalcBar()
{
if (Bars.CurrentBar == 1)
{
ChartPoint top = new ChartPoint(Bars.TimeValue, Bars.HighValue);
ChartPoint bottom = new ChartPoint(Bars.TimeValue,
Bars.LowValue);
DrwTrendLine.Create(bottom, top);
DrwArrow.Create(bottom, false);
ITextObject textObj = DrwText.Create(top, "1");
textObj.VStyle = ETextStyleV.Above;
}
}
This script will mark the first bar of the data series with one trendline from Low to High, then it will draw an
arrow below the bar and a text with the bar number above it.
The Create() method will form a corresponding type of drawing and bring back the reference to the
interface which can be used to manipulate the object: it can be moved and its properties and styles can be
changed.
We specify a point on the chart to which the drawing is attached when creating a drawing (two points for
the trendline: start and end points). When creating a drawing there is also an opportunity to specify the
data stream number and the drawing will be created according to its scale. Finally, if the study has a
separate subchart, it is possible to specify that the drawing should be plotted on the subchart, where the
study is applied. When arrow objects are created, it is possible to specify the arrow direction (up/down),
and when text objects are created it is possible to specify the displayed text.
In every drawing collection there is a possibility to get access to the active object on the chart.
Active property returns the reference to the corresponding object type. For example:
IArrowObject activeObj = DrwArrow.Active;
if (activeObj != null) { /* do something */ }
Drawing is considered to be an active object on the chart, if it was created or moved last, or was selected by
mouse click.
Object movement is done by changing its coordinates. For a trendline object, they are Begin and End
properties, and for text objects and arrows, it is Location property.
All types of objects have the Color property. Script can manage the following individual object properties:
281. Trendline has ExtRight and ExtLeft properties. If both properties are set as false they will provide a
segment, if both are set as true they will provide a straight line and when one property is set as
false and the other is set as true a beam be provided. Property size is used to get/set the line
thickness. Alert property is used to enable/disable the signals of the trendline cross by the price
data series. Property Style represents line style (solid, dashed, dotted, dashed2, dashed3). There is
also an arbitrary trendline point price receiving method:
double PriceValue(DateTime dateTime);
2. BSColor property of the text object allows you to get/set a background color.
HStyle and VStyle properties are used for text position management, the horizontal and vertical text
position, regarding the text drawing point (Location). Border property is used to enclose the text
into a frame. FontName property sets the font. Font styles are applied through the SetFont()
method. Style availability can be checked through the HaveFont() method. Text property
returns/sets the text.
3. The direction of arrow objects can be received/set through Direction property. Size property
determines the size of the arrow. Text property allows you to get/set the text to an arrow object.
FontName, TextSize, TextColor, TextBGColor properties and HaveFont(), SetFont() methods are
used to manage text attributes.
Drawing removal can be done through the Delete() method for the corresponding object.
Note. If a drawing was created as the result of the script calculation made not at the bar Close, it will be
DELETED after the calculation. To change this behavior (which may be considered strange by many
programmers) and to not delete such drawings the following study type attribute should be set:
[RecoverDrawings(false)].
4.4 Output, Alerts and Expert Commentary.
4.4.1 Output
To open Output Window in PLEditor .Net select View and click Output Window.
Output Window can be accessed from any study during any calculation stage. It can be used for initial script
debugging through logging the actions and printing the logs to Output window.
Example:
using System;
namespace PowerLanguage.Indicator
{
public class ___test : IndicatorObject
{
public ___test(object ctx) : base(ctx) { }
private IPlotObject Plot1;
29IVar m_myPlotVal;
protected override void Create()
{
Output.Clear();
Output.WriteLine("___test Construct.");
Plot1 = AddPlot(new PlotAttributes("Close"));
m_myPlotVal = CreateSimpleVar();
Output.WriteLine("___test Construct finished.");
}
protected override void StartCalc()
{
Output.WriteLine("___test Init.");
m_myPlotVal.Value = 0;
Output.WriteLine("___test Init finished.");
}
protected override void CalcBar()
{
try
{
int pointsHL = (int)((Bars.HighValue - Bars.LowValue) /
Bars.Point);
int pointsCO = (int)((Bars.CloseValue - Bars.OpenValue) /
Bars.Point);
m_myPlotVal.Value = pointsHL / pointsCO;
Plot1.Set(0, m_myPlotVal.Value);
}
catch (Exception exc)
{
Output.WriteLine("___test !!! Attention. Exception on bar
{0}, message: {1}", Bars.CurrentBar, exc.Message);
Plot1.Set(0, -1);
}
}
}
}
The following text can appear in the Output window as a result of such script calculation:
___test Construct.
___test Construct finished.
___test Init.
___test Init finished.
___test !!! Attention. Exception on bar 358, message: Attempted to divide by
zero.
___test !!! Attention. Exception on bar 484, message: Attempted to divide by
zero.
___test !!! Attention. Exception on bar 569, message: Attempted to divide by
zero.
30Write() and WriteLine() methods accept the formatted line, the difference between them is that the
WriteLine() method adds a line ending symbol.
4.4.2 Alerts
Alert is the means by which a user is notified about some important event occurring on a data series by a
text message, sound and e-mail. Studies can access alerts through the Alerts property:
public interface IAlert
{
bool CheckAlertLastBar { get; } // true – if it is the last bar now
bool Enabled { get; } //true – if alerts are on
void Alert(); //to generate Alert with an empty text
void Alert(string format, params object[] _args);//generate Alert
with a message.
void Cancel();//finish Alert generation on this bar.
}
To enable/disable strategy alerts, right-click on the chart to see the shortcut menu, click Properties, select
the Alerts tab and check/uncheck the Enable Alerts check box.
To enable/disable Indicator alerts, right-click on the chart to see the shortcut menu, click Format Indicators,
select the Indicator and click Format.., then select the Alerts tab and check/uncheck the Enable Alerts check
box.
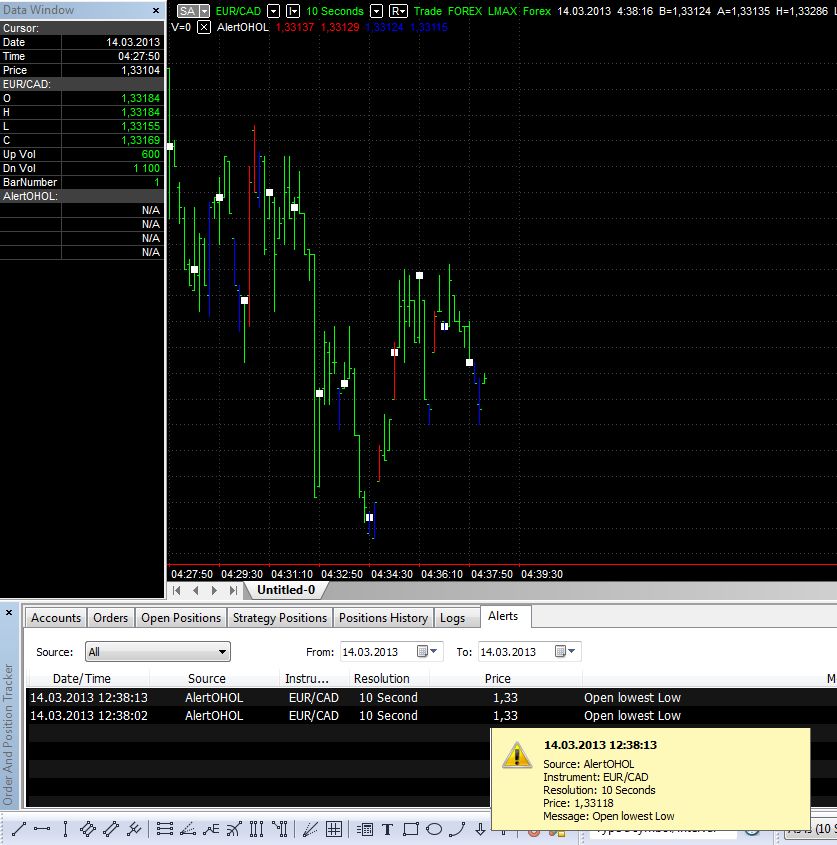
The list of all generated alerts can be seen on the Alerts tab of the Orders and Position Tracker:
Example:
Let’s configure the indicator to send an alert every time when the Open of the new bar is higher than the
High or lower than the Low of the previous bar.
Here is the script:
public class AlertOHOL : IndicatorObject {
31public AlertOHOL(object _ctx):base(_ctx){}
private IPlotObject plotUpH;
private IPlotObject plotUpL;
private IPlotObject plotDnH;
private IPlotObject plotDnL;
protected override void Create() {
plotUpH = AddPlot(new PlotAttributes("", EPlotShapes.BarHigh,
Color.Red));
plotUpL = AddPlot(new PlotAttributes("", EPlotShapes.BarLow,
Color.Red));
plotDnH = AddPlot(new PlotAttributes("", EPlotShapes.BarHigh,
Color.Blue));
plotDnL = AddPlot(new PlotAttributes("", EPlotShapes.BarLow,
Color.Blue));
}
protected override void CalcBar(){
if (Bars.Open[0] > Bars.High[1])
{
plotUpH.Set(Bars.High[0]);
plotUpL.Set(Bars.Low[0]);
Alerts.Alert("Open highest High"); }
if (Bars.Open[0] < Bars.Low[1])
{
plotDnH.Set(Bars.High[0]);
plotDnL.Set(Bars.Low[0]);
Alerts.Alert("Open lowest Low");
}
}
}
Then, compile the indicator and apply it to the chart to see the result:
324.4.3 Expert Commentary
Alerts work in real-time but, if events that happened on historical bars should be commented on, Expert
Commentary should be used. To add a commentary to the bar, it is necessary to use one of
ExpertCommentary functions in the script:
public interface IExpertCommentary
{
bool AtCommentaryBar { get; } // returns true, if in Expert
Comentary mode a user has chosen this bar.
bool Enabled { get; }//Returns true, if Expert Comentary Mode is
enabled
void Write(string format, params object[] _args);//Adds text to the
comment
void WriteLine(string format, params object[] _args); //Adds a line
in the comment
}
Example
Let’s add comments to the previous sample indicator:
protected override void CalcBar(){
if (Bars.Open[0] > Bars.High[1])
{
plotUpH.Set(Bars.High[0]);
plotUpL.Set(Bars.Low[0]);
Alerts.Alert("Open highest High");
ExpertCommentary.WriteLine("Open highest High");
}
if (Bars.Open[0] < Bars.Low[1])
{
plotDnH.Set(Bars.High[0]);
plotDnL.Set(Bars.Low[0]);
Alerts.Alert("Open lowest Low");
ExpertCommentary.WriteLine("Open lowest Low");
}
if (ExpertCommentary.AtCommentaryBar)
{
ExpertCommentary.WriteLine("You are here!");
}
}
33Then, let’s compile this indicator and apply it to the chart. Enable Expert Commentary (in the main menu of
MultiCharts .NET select View and click Expert Commentary) and click on the necessary bar:
4.5 Functions and Special Variables
4.5.1 Functions
Simple functions execute some operation over the sent arguments and return the results. If the arguments
are identical, the result will always be the same. These are so-called “pure” functions. Examples of these
functions are: Math.Max(), Highest() etc. But there are functions, which store certain information, for
example, results of previous calculations. We can take XAverage (Exponential Moving Average) as an
example, where the current value is calculated using the previous value of the function and the arguments.
These are so-called functions with state or functional objects. Class-functions, inherited from
FunctionSeries or FunctionSimple are such functional objects.
In PL.NET there is a variety of such built-in functional objects. The standard model of their usage is the
creation of an instance of the function object, initializing it with actual arguments and addressing the
function value during the calculation process.
4.5.2 Variables
Those, who are familiar with C# or other OOP programming languages know such things as class fields.
Together they form the state of the object of the given class. In PL.NET there are special classes of variables
which make the writing logic of functions, indicators and signals easier regardless of whether the calculation
is executed based on historical or real-time data. When calculating a study on historical data, CalcBar()
method will be called once for each bar. This is an example of such a version of CurrentBar:
public class CurrentBar : FunctionSimple
{
public CurrentBar(CStudyControl master) : base(master){}
private int m_current_bar;
protected override int CalcBar(){
34return ++m_current_bar;
}
protected override void StartCalc(){
m_current_bar = 0;
}
}
When calculating on historical data this function will return correct values only if it is called once per bar. In
real-time calculation, CalcBar will be called on each tick of bar, the function will not work correctly. To make
it work correctly, its logic should be changed. For example:
protected override int CalcBar(){
var _result = m_current_bar + 1;
if (Bars.Status==EBarState.Close)
++m_current_bar;
return _result;
}
As we can see, the value of the variable has to be incremented only at the bar close. For these cases specific
variables exist: VariableSeries and VariableObject. VariableSeries should be
used when it is necessary to call for the values of the previous bars variable. Considering this, the example
would look like this:
public class CurrentBar : FunctionSimple
{
public CurrentBar(CStudyControl master) : base(master){}
private VariableObject m_current_bar;
protected override int CalcBar(){
return ++m_current_bar.Value;
}
protected override void Create(){
m_current_bar = new VariableObject(this);
}
}
And it will equally work either at historical calculation, or real-time calculation. In addition to this, it will also
work correctly, even if we call this function several times during the bar.
In summarizing the information about functions and variables, our example with CurrentBar can be
simplified:
public class CurrentBar : FunctionSeries
{
public CurrentBar(CStudyControl master) : base(master){}
protected override int CalcBar(){
return this[1] + 1;
}
}
35You can also read