AN INGESTION AND ANALYTICS ARCHITECTURE FOR IOT APPLIED TO SMART CITY USE CASES - CORE
←
→
Page content transcription
If your browser does not render page correctly, please read the page content below
IEEE INTERNET OF THINGS JOURNAL, VOL. X, NO. X, XX 2017                                                                                      1

     An Ingestion and Analytics Architecture for IoT
            applied to Smart City Use Cases
      Paula Ta-Shma, Adnan Akbar, Guy Gerson-Golan, Guy Hadash, Francois Carrez, and Klaus Moessner

   Abstract—As sensors are adopted in almost all fields of life,             for real time decisions would seem to be the most recent
the Internet of Things (IoT) is triggering a massive influx of data.         data. We argue that historical data analysis is essential in
We need efficient and scalable methods to process this data to               order to reach intelligent decisions, since without it one cannot
gain valuable insight and take timely action. Existing approaches
which support both batch processing (suitable for analysis of                understand the context of real time data. For example, does
large historical data sets) and event processing (suitable for real-         the current traffic (15 kph, 300 vehicles per hour) represent
time analysis) are complex. We propose the hut architecture,                 normal conditions for a city centre intersection in rush hour, or
a simple but scalable architecture for ingesting and analyzing               extreme congestion on a highway after a major accident? Does
IoT data, which uses historical data analysis to provide context             a sudden increase in home energy consumption result from
for real-time analysis. We implement our architecture using
open source components optimized for big data applications and               heating in cold weather, or a faulty appliance? The answer is
extend them where needed. We demonstrate our solution on two                 clear on analysis of the temporal patterns in historical sensor
real-world smart city use cases in transportation and energy                 data.
management.                                                                     We found that a large and important class of IoT applica-
   Index Terms—big data, complex event processing, context-                  tions has a focused set of requirements which can be handled
aware, energy management, ingestion, internet of things, machine             using a highly streamlined and simplified architecture. We
learning, smart cities, spark, transportation                                focus on applications which learn from IoT device history
                                                                             in order to intelligently process events in real time. Example
                         I. I NTRODUCTION                                    applications include event classification (e.g. classifying a
   Sensors are by no means a new phenomenon: the first                       traffic event as ‘good’ or ‘bad’), anomaly detection (e.g.
thermostat was invented in the 19th century and space travel                 alerting when unusual traffic conditions occur), and prediction
would have been impossible without them. What is revolu-                     (e.g. predicting future traffic conditions). We apply our work
tionary today about the Internet of Things (IoT) lies in its                 to smart city transportation and energy management, but it is
recent adoption on an unprecedented scale, fueled by economic                generally applicable to almost all IoT domains. For example,
factors such as dramatic drops in costs of sensors, network                  anomaly detection can also be applied to car insurance (altert-
bandwidth and processing. Moreover, unlike the Internet (of                  ing on unusual driving patterns), utility management (alerting
humans), the IoT allows data to be captured and ingested                     on water/oil/gas pipe leakage) and goods shipping (alerting
autonomously, avoiding the human data entry bottleneck. IoT                  on non compliant humidity and temperature). We present our
data will arguably become the Biggest Big Data, possibly over-               simple streamlined architecture in this paper, and apply it to
taking media and entertainment, social media and enterprise                  both event classification and anomaly detection in two IoT use
data. The question then becomes how to make effective use                    cases.
of this vast ocean of data?                                                     To achieve high scalability and low deployment cost, we
   The nature of IoT applications beckon real time responses.                adopt a cloud based micro-services approach, where each
For example, in the transportation domain one might want                     capability (ingestion, storage, analytics etc.) is embodied in a
to plan a travel route according to current road conditions,                 separate scalable service. This approach is gaining widespread
and in smart homes one might want to receive timely alerts                   popularity for cloud platform-as-a-service (PaaS) [1], since
about unusual patterns of electricity consumption. Some IoT                  each service specializes in what it does best, and can be
sensors are capable of actuation, meaning that they can take                 managed and scaled independently of other services, avoiding
some action, such as turning off the mains power supply in                   monolithic software stacks. To achieve low development cost
a smart home. Therefore real time insights can be translated                 we adopt open source frameworks, and we also implemented
into timely actions.                                                         our solution on the IBM Bluemix PaaS. We choose “best
   The importance of collecting and analyzing historical IoT                 of breed” open source frameworks for each capability, and
data is less immediately apparent. Because of its sheer size,                show how they can be assembled to form solutions for IoT
this is a costly endeavour, although the most relevant data                  applications.
                                                                                The following contributions are made in this paper.
   P. Ta-Shma, G. Gerson-Golan and G. Hadash are with the IBM
Research, Haifa, Israel (email: paula@il.ibm.com; guyger@il.ibm.com;           •      We propose a streamlined and simplified architecture
guyh@il.ibm.com)                                                                      for a large and important class of IoT applications.
   A. Akbar, F. Carrez and K. Moessner are with the Institute for Communi-
cation Systems, University of Surrey, UK (email: adnan.akbar@surrey.ac.uk;            We name it the hut architecture because its flow
f.carrez@surrey.ac.uk; k.moessner@surrey.ac.uk)                                       diagram takes the form of a hut as shown in Figure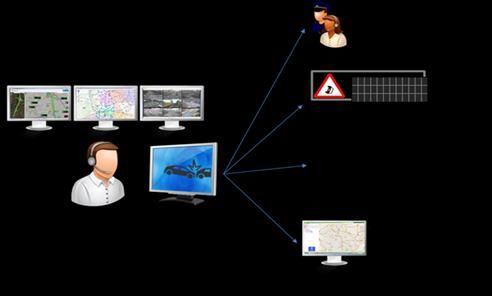
IEEE INTERNET OF THINGS JOURNAL, VOL. X, NO. X, XX 2017                                                                            2

          1. We use historical (batch) analytics to improve the    released Elastic Map Reduce (EMR) [4], a hosted version
          quality of real-time analytics on IoT data.              of MapReduce integrated into its own cloud infrastructure
   •      We implement our proposed architecture using a           platform running Amazon Elastic Compute Cloud (EC2)[5]
          micro-services approach with best of breed open          and Simple Storage Service (S3)[6]. OpenStack has a similar
          source frameworks while making extensions as             framework called Sahara which can be used to provision and
          needed. Our proposed solution is flexible with re-       deploy Hadoop clusters [7].
          spect to the choice of specific analysis algorithms          Hadoop provides generic and scalable solutions for big data,
          and suitable for a range of different machine learning   but was not designed for iterative algorithms like machine
          and statistical algorithms.                              learning, which repeatedly run batch jobs and save intermedi-
   •      We demonstrate the feasibility of our proposed solu-     ate results to disk. In such scenarios, disk access can become
          tion by implementing it for two real-world smart city    a major bottleneck hence degrading performance.
          use cases in transportation and energy management.           In order to overcome the limitations of Hadoop, a new
          We implement the transportation scenario on the          cluster computing framework called Spark [8] was developed.
          IBM Bluemix PaaS and make the code available as          Spark provides the ability to run computations in memory
          open source.                                             using Resilient Distributed Datasets (RDDs) [9] which enables
   The remainder of the paper is organized as follows.             it to provide faster computation times for iterative applications
   Section II presents related work and explains how we extend     compared to Hadoop. Spark not only supports large-scale
prior research. Section III explains our proposed architecture     batch processing, it also offers a streaming module known as
along with descriptions of the various components involved in      Spark streaming [10] for real-time analytics. Spark streaming
its implementation. Section IV-A describes the application of      processes data streams in micro-batches, where each batch
our proposed architecture to a smart transportation use case       contains a collection of events that arrived over the batch
scenario. Section IV-B demonstrates the application of our         period (regardless of when the data was created). It works well
solution to smart energy management. Finally we conclude           for simple applications but the lack of true record-by-record
the paper and highlight future work in section V.                  processing makes time series and event processing difficult for
                                                                   complex IoT applications.
                                                                       The need for real time processing of events in data streams
                     II. R ELATED W ORK
                                                                   on a record-by-record basis led to a research area known
   The massive proportions of historical IoT data highlight the    as complex event processing (CEP) [11]. CEP is specifically
necessity of scalable and low cost solutions. At first glance,     designed for latency sensitive applications which involve large
IoT data is similar to Big Data from application domains           volumes of streaming data with timestamps such as trading
such as clickstream and online advertising data, retail and e-     systems, fraud detection and monitoring applications. In con-
commerce data, and CRM data. All these data sources have           trast to batch processing techniques which store the data and
timestamps, are (semi) structured, and measure some metrics        later run queries on it, CEP instead stores queries and runs
such as number of clicks or money spent. Similarly, the need       data through these queries. The inbuilt capability of CEP
to scalably ingest, store and analyze data from these domains      to handle multiple seemingly unrelated events and correlate
is somewhat similar.                                               them to infer complex events make it suitable for many
   Analytics frameworks for Big Data can often be categorized      IoT applications. The core of CEP is typically a rule-based
as either batch or real-time processing frameworks. Batch          engine which requires rules for extracting complex patterns.
processing frameworks are suitable for efficiently processing      A drawback of CEP is that the authoring of these rules requires
large amounts of data with high throughput but also high           system administrators or application developers to have prior
latency - it can take hours or days to complete a batch            knowledge about the system which is not always available.
job. Real-time processing typically involves time sensitive            Big Data analytics systems have the challenge of processing
computations on a continuous stream of data.                       massive amounts of historical data while at the same time
   One of the most common and widely used techniques               ingesting and analyzing real-time data at a high rate. The
for batch processing on Big Data is called MapReduce [2].          dichotomy of event processing frameworks for real time data,
MapReduce is a programming model for carrying out compu-           and batch processing frameworks for historical data, led to
tations on large amounts of data in an efficient and distributed   the prevalence of multiple independent systems analyzing
manner. It is also an execution framework for processing data      the same data. The Lambda architecture was proposed by
distributed among large numbers of machines. It was originally     Nathan Marz [12] to address this, and provides a scalable and
developed by Google as a generic but proprietary framework         fault tolerant architecture for processing both real-time and
for analytics on Google’s own Big Data, and later was widely       historical data in an integrated fashion. The purpose of this
adopted and embodied in open source tools. MapReduce was           architecture was to analyze vast amounts of data as it arrives
intended to provide a unified solution for large scale batch       in an efficient, timely and fault tolerant fashion. Its focus was
analytics and address challenges like parallel computation,        on speeding up Online Analytical Processing (OLAP) style
distribution of data and handling of failures.                     computations, for example web page view and click stream
   Hadoop [3], an open source embodiment of MapReduce,             analysis. It was not designed to make per-event decisions or
was first released in 2007, and later adopted by hundreds          respond to events as they arrive [13]. It comprises batch, speed
of companies for a variety of use cases. Notably, Amazon           and serving layers, which must be coordinated to work closely
IEEE INTERNET OF THINGS JOURNAL, VOL. X, NO. X, XX 2017                                                                                                           3

                        Data                IoT              Actuation
                                                                                                                                      IoT
                      Acquisition

                                                                                                                                                       CEP
                                    Green Flows: Real time        Event                                                       Green Flows: Real time
                   Message                                     Processing
                    Broker                                     Framework
                                       Event Consumption

              Ingestion                                              Machine Learning/Analytics
                                      Purple Flows: Batch                                                          Secor        Purple Flows: Batch

                     Data                                        Batch
                                                                                                                    Swift
                   Storage                                      Analytics
                  Framework                                    Framework
                                            Data Retrieval

Fig. 1. The Hut Architecture                                                                      Fig. 2. Proposed solution Architecture

together, and is complex and difficult to deploy and maintain                                     to solve a problem. Figure 1 presents its data flow diagram,
[14].                                                                                             which forms the shape of a hut. The purple arrows denote the
   In contrast to existing solutions, our architecture focuses                                    batch data flows which form the base of the hut, while the
on analyzing new events as they arrive with the benefit of                                        green arrows denote the real time flows and form the roof of
wisdom gained from historical data. This encompasses a large                                      the hut. We first describe the real time flows.
class of algorithms including event classification, anomaly                                          Data acquisition denotes the process of collecting data from
detection and event prediction. Our architecture is simpler and                                   IoT devices and publishing it to a message broker. An event
more focused than the lambda architecture, and it maps well                                       processing framework consumes events and possibly takes
to a microservices approach where minimal coordination is                                         some action (actuation) affecting the same or other IoT devices
needed between the various services. Using our approach batch                                     or other entities such as a software application. Real time flows
analytics is used independently on the historical data to learn                                   can be stand alone, in cases where real time data can be acted
the behaviour of IoT devices, while incoming events are pro-                                      upon without benefitting from historical data, although usually
cessed on a record-by-record basis and compared to previous                                       historical data can provide further insight in order to make
behaviour. Newly ingested data will eventually become part of                                     intelligent decisions on real-time data. For example, in order
the historical dataset, but unlike the lambda architecture, new                                   to recognize anomalies, a system first needs to learn normal
events do not need to immediately be analyzed on a par with                                       behavior from historical data [15].
historical data. Our approach is practical, scalable and has low                                     The batch flows fulfil this purpose. Data is ingested from
cost to develop, deploy and maintain.                                                             the message broker into a data storage framework for persis-
        III. A S IMPLIFIED A RCHITECTURE FOR I OT                                                 tent storage. Data can then be retrieved and analyzed using
                        A PPLICATIONS                                                             long running batch computations, for example, by applying
                                                                                                  machine learning algorithms. The result of such analysis
   We propose the Hut Architecture, which meets the require-
                                                                                                  can influence the behavior of the real time event processing
ments of scalable historical data analytics as well as efficient
                                                                                                  framework. The batch flows can work independently of the real
real-time processing for IoT applications. IoT applications
                                                                                                  time flows to provide long term insight or to train predictive
typically require responding to events in real time based on
                                                                                                  models using historical datasets [16].
knowledge of past events. For example, using knowledge of
past traffic behaviour for certain locations in certain times
to trigger alerts on unexpected patterns such as congestion.                                      B. A Hut Architecture Instance
Historical knowledge is essential in order to understand what                                        For each node in Figure 1, one can choose among various
behaviour is expected and what is an anomaly. Historical                                          alternatives for its concrete implementation. We refer to a
data must be analyzed ahead of time in order to allow real                                        certain choice of such components as a hut architecture
time responses to new situations. Despite its simplicity, our                                     instance. We now present a specific hut architecture instance,
architecture can scale to deal with large amounts of historical                                   and later apply it to multiple real life use cases in following
data and can detect complex events in near real-time using                                        sections. We utlize existing proven open source components,
automated methods.                                                                                as well as extending them where needed. A diagram of this
                                                                                                  instance is shown in Figure 2.
A. The Hut Architecture                                                                              The role of each component and how it fits into overall
  Our architecture gives a high level view of the various                                         architecture is described below. Where relevant we explain
components in a solution and orchestrates how they fit together                                   why we chose the relevant component.
IEEE INTERNET OF THINGS JOURNAL, VOL. X, NO. X, XX 2017 4 1) Data Acquisition - Node Red: We use Node Red [17] to technique, data for each column of a table is physically stored acquire data from heterogeneous devices or other information together, instead of the classical technique where data is sources such as RESTful web services or MQTT data feeds. physically organized by rows. Columnar storage has two main XML and JSON are two most commonly used formats which advantages for IoT workloads. Firstly, organizing the data by are used extensively for transmitting IoT data, although there column allows for better compression. For IoT workloads, is no limitation regarding the choice of format. Data feeds may many columns will typically contain IoT device readings contain redundant data which can be pre-processed or filtered. which fluctuate slowly over time, for example temperature Node-Red provides these functionalities together with a fast readings. For this kind of data some kind of delta encoding prototyping capacity to develop wrappers for heterogeneous scheme could significantly save space. Note that each column data sources. Node Red can then publish the data to the can be compressed independently using a different encoding message broker. We chose this component because of its ease scheme tailored to that column type. Secondly, organizing of use and flexibility. the data according to columns means that if certain columns 2) Message Broker - Kafka: Message brokers typically are not requested by a query then they do not need to be provide a mechanism for publishing messages to certain topics retrieved from storage or sent across the network. This is and allowing subscription to those topics. In our context, the unlike the classical case where data is organized by rows and messages typically denote the state of an IoT device at a all columns are accessed together. This can significantly reduce certain time. Apache Kafka [18] is an open source message the amount of I/O as well as the amount of network bandwidth broker originally developed by LinkedIn, designed to allow required. We chose Parquet for these reasons - it is considered a single cluster to serve as the central messaging backbone as one of the highest performing storage formats in the Hadoop for a large organization. Kafka emphasizes high throughput ecosystem [24]. messaging, scalability, and durability. Although Kafka is less 6) Metadata Indexing and Search using Elastic Search: mature than other systems such as Rabbit MQ, it supports OpenStack Swift allows annotating objects with metadata an order of magnitude higher throughput messaging [18]. although there is no native mechanism to search for objects Moreover, Kafka supports both batch consumers that may according to their metadata. This is essential in a scenario be offline, and online consumers that require low latency. where we store massive amounts of IoT data and need to Importantly Kafka can handle large backlogs of messages analyze specific cross sections of the data. We built a metadata to handle periodic ingestion from systems such as Secor, search prototype similar to that of IBM SoftLayer [25] but and allows consumers to re-read messages if necessary. This extended with range searches and data type support to meet scenario is important for our architecture. We chose Kafka for the needs of IoT use cases. Our prototype uses Elastic Search both these reasons. [26], based on Lucene[27]. We found it to be effective for our 3) Ingestion - Secor: Secor is an open source tool [19] needs, although other Lucene based search engines, such as developed by Pinterest which allows uploading Apache Kafka Solr [28], are available. messages to Amazon S3. Multiple messages are stored in a 7) Batch Analytics Framework - Spark: Apache Spark is single object according to a time or size based policy. We a general purpose analytics engine that can process large enhanced Secor by enabling OpenStack Swift targets, so that amounts of data from various data sources and has gained data can be uploaded by Secor to Swift, and contributed this significant traction. It performs especially well for multi-pass to the Secor community. In addition we enhanced Secor by applications which include many machine learning algorithms enabling data to be stored in the Apache Parquet format, [9]. Spark maintains an abstraction called Resilient Distributed which is supported by Spark SQL, thereby preparing the Datasets (RDDs) which can be stored in memory without data for analytics. Moreover, we enhanced Secor to generate requiring replication and are still fault tolerant. Spark can an- Swift objects with metadata. We chose Secor because it is alyze data from any storage system implementing the Hadoop an open source connector between Kafka and object storage FileSystem API, such as HDFS, Amazon S3 and OpenStack (OpenStack Swift). Swift, which, together with performance benefits and SQL 4) Data Storage Framework - OpenStack Swift: OpenStack support (see next section), is the reason for our choice. [20] is an open source cloud computing software framework 8) Data Retrieval - Spark SQL: RDDs which contain semi- originally based on Rackspace Cloud Files [21]. OpenStack structured data and have a schema are called DataFrames and is comprised of several components, and its object storage can be queried according to an SQL interface. This applies to component is called Swift [22]. OpenStack Swift supports data in Hadoop compatible file systems as well as external data CReate, Update and Delete (CRUD) operations on objects sources which implement a certain API, such as Cassandra and using a REST API, and supports scalable and low cost MongoDB. We implemented this API for OpenStack Swift deployment using clusters of commodity machines. For this with Parquet and Elastic Search, to allow taking advantage of reason Swift is suitable for long term storage of massive metadata search for SQL queries. amounts of IoT data. We chose OpenStack Swift because it is 9) Machine Learning - Spark ML: Spark MLlib [29] is an open source object storage framework. Sparks library for machine learning. Its goal is to make 5) The Parquet Data Format: Apache Parquet [23] is an practical machine learning scalable and easy to use. Spark open source file format designed for the Hadoop ecosystem MLlib consists of common machine learning algorithms and that provides columnar storage, a well known data organization utilities, including classification, regression, clustering, collab- technique which optimizes analytical workloads. Using this orative filtering, dimensionality reduction, as well as lower-
IEEE INTERNET OF THINGS JOURNAL, VOL. X, NO. X, XX 2017 5
level optimization primitives and higher-level pipeline APIs. therefore provide a more responsive system at lower cost. Our
10) Event Processing Framework - CEP: A Complex Event approach is to collect traffic data for different locations and
Processing (CEP) Engine is a software component capable time periods and use this to model expected traffic behaviour
of asynchronously detecting independent incoming events of using thresholds. We then monitor traffic in real time and
different types and generating a Complex Event by correlating assess the current behaviour compared to thresholds which
these events together. In this sense, Complex Events can capture what is expected for that location and time of day.
be defined as the output generated after processing many Our system can alert traffic managers when an action may
small, independent incoming input data streams, which can need to be taken, such as modifying traffic light behaviour,
be understood as a given collection of parameters at a certain alerting drivers by displaying traffic information on highway
temporal point. A CEP Engine is commonly provided with panels, calling emergency vehicles and rerouting buses to
a series of plugins or additional sub-components in order to avoid road blocks. In future our system could trigger these
improve data acquisition from external sources, and also some actions automatically.
kind of rule system to implement the business logic which We now describe our hut instance as applied to the Madrid
creates the output of the system. Transportation use case.
Our architecture is modular, so a particular component in 1) Data Acquisition: We used the Node-RED tool to peri-
this instance could be replaced by another. For example, Spark odically retrieve data from the Madrid Council web service
Streaming or Apache Storm could be used for the event and publish it to a dedicated Kafka topic, containing data
processing framework instead of CEP software, and Hadoop from all of Madrid’s traffic sensors. The published data has
map reduce could be used instead of Spark. Our focus here the following schema, where intensity denotes traffic intensity,
is on the architecture itself, and in order to demonstrate the velocity denotes traffic speed, ts denotes the timestamp in
architecture we made an intelligent choice of open source epoch format and tf denotes the time of day.
components as an architecture instance.
{"namespace": "cosmos",
"type": "record",
IV. U SE CASES "name": "TrafficFlowMadridPM",
"fields": [
The hut architecture, as well as our instance, is generic and
{"name": "code", "type":"string"},
can be applied to a range of IoT use cases. In this section we {"name": "occupation", "type":"int"},
demonstrate its application to real-world problems and show {"name": "load", "type":"int"},
how it can provide optimized, automated and context-aware {"name": "service_level", "type":"int"},
solutions for large scale IoT applications. We demonstrate {"name": "velocity", "type":["null","int"]},
{"name": "intensity", "type":["null","int"]},
it in practice by applying it to the following two scenarios,
{"name": "error", "type":"string"},
Madrid Transportation and Taiwan Energy Management. We {"name": "subarea", "type":["null","int"]},
describe the first use case in detail and later describe how the {"name": "ts", "type":"long"},
same architecture and data flow can be applied to the second {"name": "tf", "type":"string"}
case. Despite the fact that these use cases are from different ]
}
domains, they share the same architecture and data flow. Each
use case has specific requirements which dictate different 2) Data Ingestion: We configured Secor to consume data
configurations and extensions which are also described in this from this Kafka topic and upload it as objects to a dedicated
section. container in OpenStack Swift once every hour. We partitioned
the data according to date which enables systems like Spark
A. Use case 1: Madrid Transportation SQL to be queried using date as a column name. Using
our enhancements to Secor we converted the data to Parquet
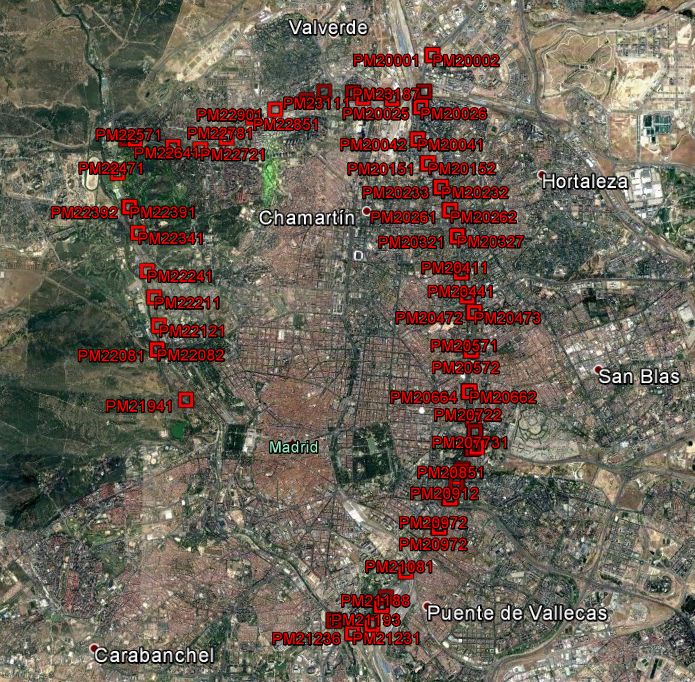
Madrid Council has deployed roughly 3000 traffic sensors
format, and also generated metadata for each resulting object
in fixed locations around the city of Madrid on the M30
with minimum and maximum values for specified schema
ring road, as shown in Figure 3(a), measuring various traffic
columns, as shown above. This metadata is stored in Swift
parameters such as traffic intensity and speed. Traffic intensity
as well as being sent to Elastic Search for indexing.
represents the average number of vehicles passing through a
certain point per unit time whereas traffic speed represents the 3) Data Retrieval: We defined our collection of data and
average speed of vehicles per unit time. Aggregated data is metadata as a Spark SQL external data source, and imple-
published as an IoT service using a RESTful API and data is mented an associated driver. Given an SQL query over this
refreshed every 5 minutes 1 . dataset, our driver identifies selections on indexed columns,
Madrid Council has control rooms where traffic admin- and searches Elastic Search for the names of Swift objects
istrators analyze sensor output and look for congestion or whose min/max values overlap the requested query ranges.
other traffic patterns requiring intervention as shown in Figure For the Madrid Traffic use case, we needed to analyze traffic
3(b). Much of the work is manual and requires training and for different periods of the day separately, resulting in the
expertise regarding expected traffic behaviour in various parts following query for morning traffic.
of the city. Our objective is to automate this process and SELECT code, intensity, velocity
FROM madridtraffic
1 http://informo.munimadrid.es/informo/tmadrid/pm.xml WHERE tf >= ’08:00:00’ AND tfIEEE INTERNET OF THINGS JOURNAL, VOL. X, NO. X, XX 2017 6
(a) Sensors location on M30 ring road (b) M30 Control Room
Fig. 3. Madrid Transportation Scenario
To evaluate this query, our driver searches for objects whose learning to generate optimized thresholds for CEP rules was
min/max timestamps overlap this time period, and evaluates proposed in our initial work [30] where we demonstrated a
the query on these objects only. Objects which do not qualify context-aware solution for monitoring traffic automatically.
do not need to be read from disk or sent across the network In this paper, we improve our initial approach, extend our
from Swift to Spark. For one example query we tested on experimental evaluation and integrate it with the more general
the Madrid Traffic data we collected, we found our method to hut architecture and hut instance, optimized for large scale IoT
reduce the number of Swift requests by a factor of over 20. applications.
4) Event Processing: We used CEP as an event processing 5) Machine Learning: In order to classify traffic events
component to consume events in real-time from the Message as ‘good’ or ‘bad’ we built a model for each sensor lo-
Broker and detect complex events like bad traffic. The core of cation and time period (morning, afternoon, evening and
CEP is a rule-based engine which requires rules for extracting night) using k-means clustering, an unsupervised algorithm
complex patterns. These rules are typically based on various (not requiring labeled training data) implemented in Spark
threshold values. An example rule analysing traffic speed and MLlib and optimized for large data sets. The data points are
intensity to detect bad traffic events is shown in algorithm 1, separated into k different groups, in our case k = 2 and the
which checks whether current speed and intensity cross thresh- groups represent good versus bad traffic. The resulting cluster
olds for 3 consecutive time points. The manual calibration of boundary generates thresholds for real time event processing,
threshold values in such rules require traffic administrators to since crossing these thresholds signifies moving from good to
have deep prior knowledge about the city traffic. In addition, bad traffic (or vice versa).
rules set using a CEP system are typically static and there is Experimentation results of our approach on Madrid traffic
no means to update them automatically. data are shown in Figure 4 for a particular location on a
weekday. Different sub-figures indicate different time contexts
Algorithm 1 Example Rule for CEP
(morning, afternoon, evening and night). Blue clusters repre-
1: for (speed, intensity) ∈ T upleW indow(3) do
sent high average speed and intensity indicating good traffic
2: if (speed(t) < speedthr and intensity(t) < state, whereas red clusters represent low average speed and
intensitythr AND intensity indicating bad traffic state (note the varying scales of
3: speed(t + 1) < speedthr and intensity(t + 1) < the X-axes in the various graphs). Midpoints between cluster
intensitythr AND centers represents the boundary separating both states and
4: speed(t + 2) < speedthr and intensity(t + 2) < we use this boundary to define threshold values for detecting
intensitythr ) then complex events.
5: Generate complex event Bad Traffic
6) When to Recompute the Thresholds?: Statistical proper-
6: end if
ties of the underlying data may change over time resulting in
7: end for
inaccurate threshold values. Therefore, we assess the cluster
quality for different contexts as new data arrives, and once it
significantly deteriorates, we retrain the k-means models and
In contrast, we adopted a context-aware approach using
generate new threshold values. The Silhouette index s(i) [31]
machine learning to generate optimized thresholds automat-
is used to assess cluster quality by quantitatively measuring
ically based on historical sensor data and taking different
the data fitness on existing clusters and is defined as
contexts including time-of-day and day-of-week into account.
New rules are generated dynamically whenever our algorithm b(i) − a(i)
detects a change in the context. The idea of using machine s(i) = (1)
max(a(i), b(i))IEEE INTERNET OF THINGS JOURNAL, VOL. X, NO. X, XX 2017 7
(a) Morning Traffic Hours (b) Afternoon Traffic Hours
(c) Evening Traffic Hours (d) Night Traffic Hours
Fig. 4. Clustering results on Madrid traffic data for location 1
where a(i) is the mean intra cluster distance, and b(i) is the we have different threshold values for different contexts, we
mean nearest-cluster distance i.e. distance with the nearest need ideal threshold values for each context to provide fair
cluster center which the data is not part of. s(i) ranges from analysis of results. Rules learned by the automatic generation
−1 to 1 where 1 indicates the highest score and −1 the lowest of threshold values using our proposed clustering algorithm
for cluster quality. Table I shows the instance of threshold are represented as R∗ .
values for both speed and intensity for location 1 (Figure We measure the performance of our system quantitatively
4) where values of silhouette index (s(i) >= 0.5) indicate by generating an evaluation history of traffic events and use
good cluster quality. As new data arrives, the silhouette index both R and R∗ to detect bad traffic events. This enables us
is calculated incrementally using the cluster centroids and if to measure the precision of our algorithm which is the ratio
s(i) < 0.5, it acquires the latest data and repeats all steps. of the number of correct events to the total number of events
detected; and the recall, which is the ratio of the number of
TABLE I events detected by R∗ to the total number of events that should
T HRESHOLD VALUES U PDATE ( WEEKDAYS )
have been detected based on ideal Rule R. Mathematically,
Traffic Period Time Range Threshold Values Silhouette index
they are represented as:
Morning 8 am to 12 pm 130 veh/h, 43 km/h 0.51
Afternoon 12 pm to 4 pm 175 veh/h, 51km/h 0.57 TP TP
Evening 4 pm to 8 pm 145 veh/h, 49km/h 0.55 P recision = , Recall = (2)
T P +F P T P +F N
Night 8pm to 12 am 96veh/h, 48 km/h 0.50
where T P is true positive, F P is false positive and F N is
7) Evaluation: In order to evaluate our proposed solution, false negative. Results are shown below in table II. In general,
we followed the approach outlined in [32]. We defined an ideal we got high values of recall for all four locations which
set of threshold values for the rule mentioned in algorithm 1 indicates high rule sensitivity (detecting 90% of events from
for four different locations with the help of traffic administra- the traffic data stream). The average value of precision lies at
tors from Madrid city council, and refer to this as Rule R. As around 80% indicating a small proportion of false alarms.IEEE INTERNET OF THINGS JOURNAL, VOL. X, NO. X, XX 2017 8
TABLE II
CEP RULES E VALUATION FOR M ADRID S CENARIO Threshold Values for Current
3
Locations TP FP FN Precision Recall
1 97 17 8 0.85 0.92 2.5
2 68 14 7 0.82 0.91
Current (Amperes)
3 71 12 11 0.85 0.86 2
4 112 29 9 0.79 0.93
1.5
1
8) Discussion: The main focus of our work is on a generic
architecture for IoT data analytics which allows plugging in 0.5
various algorithms. We presented one particular choice where
unsupervised machine learning (k-means clustering) was used 0
for event classification. Our modular approach enables explo- Appliance 1 Appliance 2
ration of other unsupervised or supervised methods for the Morning Afternoon Evening Night
same problem. In addition, our architecture can be used for
additional applications; for example, one can train regression Fig. 5. Appliances threshold values for monitoring current
models with Spark MLlib using Madrid Council’s historical
dataset and provide traffic predictions [33].
An example of threshold values for two appliances during
B. Use case 2: Taiwan Electricity Metering summer weekdays is shown in the Figure 5, calculated using
the historical data of the specific device. As can be seen,
Smart energy kits are gaining popularity for monitoring both appliances have lower usage at night indicating smaller
real time energy usage to raise awareness about users’ energy threshold values for current whereas appliance 1 has higher
consumption [34]. The Institute for Information Industry (III) usage during mornings compared to appliance 2, which has
Taiwan have deployed smart energy kits consisting of smart a peak during evening time. A rule can be defined which
plugs and management gateways in over 200 residences. compares the average current taken by an appliance over the
These smart plugs have built-in energy meters which keep specific time period to compare it with the expected readings
track of real-time energy usage of connected appliances by for that time context.
logging electrical data measurements. They are connected to In summary, the same data flow applies to this use case
a management gateway via the ZigBee protocol, which is as for the Madrid Transportation use case described earlier.
connected to the internet via WiFi. The main difference lies in how the historical data is analyzed
Our aim is to monitor energy consumption data in real time (event classification versus anomaly detection).
and automatically detect anomalies which are then communi-
cated to the respective users. An anomaly can be defined as
unusual or abnormal behaviour. For example, a malfunctioning V. C ONCLUSIONS AND F UTURE W ORK
electronic device or a fridge with its door left open can result In this paper, we proposed and implemented an architec-
in excessive power dissipation which should be detected and ture for extracting valuable historical insights and actionable
reported as soon as possible. Another type of anomaly is knowledge from IoT data streams. Our proposed architecture
appliance usage at unusual times such as a radiator during the supports both real-time and historical data analytics using its
summer or an oven operated at 3am. Automatic monitoring of hybrid data processing model. We implemented our proposed
devices to detect anomalies can contribute to energy savings architecture using open source components optimized for large
as well as enhanced safety. scale applications. The feasibility of the proposed architecture
III requests users to provide information on devices con- was demonstrated with the help of real-world smart city use
nected to smart plugs such as appliance type as well as cases for transportation and energy management, where our
expected behaviour such as expected wattage and current proposed solution enables efficient analysis of streaming data
ranges. However expected behaviour is not usually known by and provides intelligent and automatic responses by exploiting
users and is difficult for them to determine. Our approach of large historical data.
collecting historical appliance data for various time periods We implemented a version of the Madrid Traffic use case on
(summer versus winter, day versus night, weekday versus the IBM Bluemix platform, together with collaborators from
weekend) provides a way to automatically generate reliable the IBM Bluemix Architecture Center. Bluemix is IBM’s PaaS
information about expected behaviour. For each device and offering, providing microservices for the main components
time context (such as weekday mornings during summer), we used in our hut architecture instance (Node-red, Apache Kafka,
calculate the normal working range for current and power for Apache Spark and OpenStack Swift). Source code for this
an appliance using statistical methods. A CEP rule is defined implementation is available for experimentation and adaptation
based on this working range, and as soon as the readings are to other IoT use cases [35]. This demonstrates the amenability
outside this range a CEP rule will be triggered generating a of our architecture to the microservices model, and provides
complex event representing an anomaly which can then be tools to the community for further research. In addition, our
used to notify the user as well. work led to the development of a bridge connecting MessageIEEE INTERNET OF THINGS JOURNAL, VOL. X, NO. X, XX 2017 9
Hub (the Bluemix Kafka service) with the Bluemix Object [14] Questioning the Lambda Architecture. [Online]. Available: https:
Storage service [36]. //www.oreilly.com/ideas/questioning-the-lambda-architecture
[15] V. Chandola, A. Banerjee, and V. Kumar, “Anomaly detection: A
Our experiments using the hut architecture extend existing survey,” ACM Comput. Surv., vol. 41, no. 3, pp. 15:1–15:58, Jul. 2009.
solutions by providing simple but integrated batch and event [Online]. Available: http://doi.acm.org/10.1145/1541880.1541882
processing capabilities. Our implementation applies to both [16] A. Akbar, F. Carrez, K. Moessner, and A. Zoha, “Predicting complex
events for pro-active iot applications,” in 2015 IEEE 2nd World Forum
transportation and energy management scenarios with only mi- on Internet of Things (WF-IoT), Dec 2015, pp. 327–332.
nor changes. Given the generality of the proposed architecture, [17] Node-RED, “Node-RED: A visual tool for wiring the Internet of Things
it can also be applied to many other IoT scenarios such as ,” http://nodered.org//, 2016, [Online; accessed 6-May-2016].
[18] J. Kreps, N. Narkhede, J. Rao et al., “Kafka: A distributed messaging
monitoring goods in a supply chain or smart health care. A system for log processing,” in Proceedings of the NetDB, 2011, pp. 1–7.
major benefit of adopting such an architecture is the potential [19] Pinterest Secor. [Online]. Available: https://github.com/pinterest/secor
cost reduction at both development and deployment time by [20] OpenStack: Open source software for creating private and public
clouds. [Online]. Available: https://www.openstack.org/
using a common framework for multiple IoT applications [21] CloudFiles: Scalable cloud object storage. [Online]. Available:
and plugging in various alternative components to generate https://www.rackspace.com/cloud/files
variations as needed. [22] OpenStack Swift Documentation. [Online]. Available: http://docs.
openstack.org/developer/swift/
In future, we aim to evaluate our architecture on addi- [23] Apache Parquet Documentation. [Online]. Available: https://parquet.
tional IoT applications where knowledge about complex events apache.org/documentation/latest/
can contribute to more innovative and automated solutions. [24] J. Kestelyn. (2016) Benchmarking Apache Parquet: The Allstate
Experience. [Online]. Available: https://blog.cloudera.com/blog/2016/
Furthermore, we intend to improve the process of automatic 04/benchmarking-apache-parquet-the-allstate-experience/
generation of threshold values by considering other machine [25] Softlayer - API Operations for Search Services. [Online]. Available:
learning algorithms. We also plan to make our system more http://sldn.softlayer.com/article/API-Operations-Search-Services
[26] Elastic Search github repository. [Online]. Available: https://github.
context-aware by ingesting and analyzing social media data. com/elastic/elasticsearch
[27] Welcome to Apache Lucene. [Online]. Available: http://lucene.apache.
ACKNOWLEDGEMENTS org/
[28] Learn More About Solr. [Online]. Available: http://lucene.apache.org/
The research leading to these results was supported by solr/
the European Union’s FP7 project COSMOS under grant No [29] X. Meng, J. Bradley, B. Yuvaz, E. Sparks, S. Venkataraman, D. Liu,
J. Freeman, D. Tsai, M. Amde, S. Owen et al., “Mllib: Machine learning
609043 and European Union’s Horizon 2020 project CPaaS.io in apache spark,” JMLR, vol. 17, no. 34, pp. 1–7, 2016.
under grant No 723076. [30] A. Akbar, F. Carrez, K. Moessner, J. Sancho, and J. Rico, “Context-
aware stream processing for distributed iot applications,” in 2015 IEEE
R EFERENCES 2nd World Forum on Internet of Things (WF-IoT), Dec 2015, pp. 663–
668.
[1] R. Sakhuja. (2016) 5 Reasons why Microser- [31] S. Petrovic, “A comparison between the silhouette index and the davies-
vices have become so popular in the last 2 bouldin index in labelling ids clusters,” in Proceedings of the 11th Nordic
years. [Online]. Available: https://www.linkedin.com/pulse/ Workshop of Secure IT Systems, 2006, pp. 53–64.
5-reasons-why-microservices-have-become-so-popular-last-sakhuja [32] A. Margara, G. Cugola, and G. Tamburrelli, “Learning from the
[2] J. Dean and S. Ghemawat, “Mapreduce: Simplified data processing on past: Automated rule generation for complex event processing,”
large clusters,” Commun. ACM, vol. 51, no. 1, pp. 107–113, Jan. 2008. in Proceedings of the 8th ACM International Conference on
[Online]. Available: http://doi.acm.org/10.1145/1327452.1327492 Distributed Event-Based Systems, ser. DEBS ’14. New York,
[3] A. Hadoop, “Hadoop,” 2009. NY, USA: ACM, 2014, pp. 47–58. [Online]. Available: http:
[4] D. Guide, “Amazon elastic mapreduce,” 2010. //doi.acm.org/10.1145/2611286.2611289
[5] Amazon EC2 - Virtual Server Hosting. [Online]. Available: https: [33] A. Akbar, A. khan, F. Carrez, and K. Moessner, “Predictive analytics
//aws.amazon.com/ec2/ for complex iot data streams,” IEEE Internet of Things Journal, vol. PP,
[6] Amazon S3 AWS Cloud - Simple, durable, massively scalable object no. 99, pp. 1–1, 2017.
storage. [Online]. Available: https://aws.amazon.com/s3/ [34] T. Hargreaves, M. Nye, and J. Burgess, “Making energy visible: A
[7] OpenStack Sahara. [Online]. Available: https://wiki.openstack.org/wiki/ qualitative field study of how householders interact with feedback from
Sahara smart energy monitors,” Energy policy, vol. 38, no. 10, pp. 6111–6119,
[8] M. Zaharia, M. Chowdhury, M. J. Franklin, S. Shenker, and I. Stoica, 2010.
“Spark: cluster computing with working sets.” HotCloud, vol. 10, pp. [35] Real Time Traffic Analysis Sample Application. [Online]. Available:
10–10, 2010. https://github.com/cfsworkload/data-analytics-transportation
[9] M. Zaharia, M. Chowdhury, T. Das, A. Dave, J. Ma, M. McCauley, [36] P. Ta-Shma. (2017) End-to-End IoT Data Pipelines in IBM
M. J. Franklin, S. Shenker, and I. Stoica, “Resilient distributed Bluemix: Introducing the Message Hub Object Storage Bridge.
datasets: A fault-tolerant abstraction for in-memory cluster computing,” [Online]. Available: https://www.ibm.com/blogs/bluemix/2017/03/
in Proceedings of the 9th USENIX Conference on Networked end-to-end-iot-data-pipelines-introducing-the-message-hub-object-storage/
Systems Design and Implementation, ser. NSDI’12. Berkeley, CA,
USA: USENIX Association, 2012, pp. 2–2. [Online]. Available:
http://dl.acm.org/citation.cfm?id=2228298.2228301
[10] M. Zaharia, T. Das, H. Li, T. Hunter, S. Shenker, and I. Stoica,
“Discretized streams: Fault-tolerant streaming computation at scale,”
in Proceedings of the Twenty-Fourth ACM Symposium on Operating
Systems Principles. ACM, 2013, pp. 423–438.
[11] G. Cugola and A. Margara, “Processing flows of information: From
data stream to complex event processing,” ACM Comput. Surv.,
vol. 44, no. 3, pp. 15:1–15:62, Jun. 2012. [Online]. Available:
http://doi.acm.org/10.1145/2187671.2187677
[12] N. Marz and J. Warren, Big Data: Principles and Best Practices of
Scalable Realtime Data Systems, 1st ed. Greenwich, CT, USA: Manning
Publications Co., 2015.
[13] Simplifying the (complex) Lambda architecture. [Online]. Available:
https://voltdb.com/blog/simplifying-complex-lambda-architectureYou can also read