Crime outcomes in England and Wales: year ending March 2018 - Statistical Bulletin HOSB 10/18 July 2018
←
→
Page content transcription
If your browser does not render page correctly, please read the page content below
Crime outcomes in England and
    Wales: year ending March 2018

Statistical Bulletin HOSB 10/18

July 2018

                                  1
Important information
Before April 2013, official statistics about how the police deal with crimes focused narrowly on
‘detections’ (the number of cases resolved with a charge, caution, etc.). In April 2013, the Home Office
introduced the new outcomes framework and changed the presentation of crime outcomes statistics.
From April 2014 onwards, police forces have supplied data to the Home Office on the broader set of
outcomes. The year to March 2014 bulletin1, published in July 2014, showed the first provisional
statistics from the new outcomes framework. We have since developed the statistics with input from
police forces and users.
We continue to ensure that these crime outcomes statistics:
• meet identified user needs, including providing new analysis and greater transparency;
• are well explained and readily accessible;
• are produced according to sound methods; and
• are managed impartially and objectively in the public interest.
The statistics in this bulletin are designated as Official Statistics, rather than National Statistics.
In January 2014, the UK Statistics Authority found that police recorded crime statistics did not meet
the required standard for designation as National Statistics. The full assessment report against the
Code of Practice for Official Statistics can be found on the UK Statistics Authority website:
www.statisticsauthority.gov.uk/assessment/assessment/assessment-reports/assessment-report-268---
statistics-on-crime-in-england-and-wales.pdf
In July 2014, the Home Office Chief Statistician and the UK Statistics Authority Head of Assessment
agreed to badge the year to March 2014 Crime Outcomes bulletin as Official Statistics, rather than
National Statistics. This reflects the move to the new outcomes framework, and also the possibility that
outcomes data are affected by similar issues to those that led to the de-designation of police recorded
crime statistics.
Full details are available here:
www.statisticsauthority.gov.uk/reports---correspondence/correspondence/letter-from-david-blunt-to-
ed-humpherson---090714.pdf
www.statisticsauthority.gov.uk/reports---correspondence/correspondence/letter-from-ed-humpherson-
to-david-blunt---150714.pdf
It is our intention that the statistics will be assessed, with a view to them gaining National Statistics
status in due course.
1 www.gov.uk/government/statistics/crime-outcomes-in-england-and-wales-2013-to-2014
2Further information
Previous years’ “Crime Outcomes in England and Wales” bulletins, are available from:
www.gov.uk/government/collections/crime-outcomes-in-england-and-wales-statistics
Copies of other Home Office publications (including crime statistics releases prior to April 2012) are
available from:
www.gov.uk/government/organisations/home-office/series/crime-statistics#publications
Copies of crime statistics publications from April 2012 are available from the Office for National
Statistics website: www.ons.gov.uk/peoplepopulationandcommunity/crimeandjustice
This includes the User Guide to Crime Statistics, a useful reference guide with explanatory notes
regarding the issues and classifications that are key to the production and presentation of the crime
statistics.
The dates of forthcoming publications are pre-announced and can be found via the Gov.uk Statistics
Release Calendar: www.gov.uk/government/statistics/announcements
For further information about crime outcomes statistics, please email:
CrimeandPoliceStats@homeoffice.gsi.gov.uk or write to:
Crime and Policing Statistics, 6th Floor, Fry Building, 2 Marsham Street, London, SW1P 4DF.
Home Office Responsible Statistician
John Flatley, Programme Director of Crime and Policing Statistics
Contact via CrimeandPoliceStats@homeoffice.gsi.gov.uk
This statistical bulletin is produced to the highest professional standards and is free from political
interference. It has been produced by statisticians working in the Home Office Crime and Policing
Statistics Section in accordance with the Home Office’s Statement of Compliance with the Code of
Practice for Official Statistics, which covers our policy on revisions and other matters. The Chief
Statistician, as Head of Profession, reports to the National Statistician with respect to all
professional statistical matters and oversees all Home Office National and Official Statistics
products with respect to the Code, being responsible for their timing, content and methodology.
3Contents
Page
Contents ....................................................................................................................................... 4
Lists of figures and tables .................................................................................................................... 5
Executive summary ............................................................................................................................... 8
1 Introduction ................................................................................................................ 10
1.1 Overview ............................................................................................................ 10
1.2 The full outcomes framework ............................................................................ 10
1.3 Outcome groupings in this bulletin .................................................................... 10
1.4 Supplementary data tables ................................................................................ 11
2 Outcomes assigned to offences recorded in the year ending March 2018 ......... 12
2.1 Introduction ........................................................................................................ 12
2.2 How outcomes vary by outcome type ............................................................... 12
2.3 How outcomes vary by offence group ............................................................... 13
2.4 Longer-term trends in how crimes are resolved ................................................ 17
3 The time gap between offences recorded and outcomes being assigned .......... 18
3.1 Timeliness by outcome type ............................................................................. 18
3.2 Change in time to assign outcomes compared to previous years.....................19
4 How offences flagged as domestic abuse were dealt with by the police.............22
4.1 Introduction ........................................................................................................ 22
4.2 How domestic abuse offences were dealt with by the police by outcome
type..... ......................................................................................................................... 22
4.3 Trends in how domestic abuse offences were dealt with by the police.............23
5 Outcomes assigned to fraud offences in the year to March 2018 ........................ 25
5.1 Introduction ........................................................................................................ 27
5.2 Fraud disseminations and outcomes in the year ending March 2018 – Headline
findings........................................................................................................................27
5.3 Outcomes recorded against fraud offences by outcome type ........................... 27
5.4 Disseminations and outcomes by police force area..........................................29
45.5 Future work on fraud outcomes.........................................................................31
Technical Annex .................................................................................................................................. 32
A1 Overview ............................................................................................................ 32
A2 The crime outcomes framework ........................................................................ 32
A2.1 Fraud outcomes ........................................................................................ 34
A2.3 Domestic Abuse outcomes ....................................................................... 34
A3 Outcomes definition and methodology .............................................................. 34
A4 Timeliness.......................................................................................................... 36
A5 Transferred and cancelled records .................................................................... 37
A5.1 Overview ................................................................................................... 37
A5.2 Definitions and methodology ..................................................................... 37
A5.3 Comparing transferred and cancelled records .......................................... 37
A6 Crime outcomes data quality ............................................................................. 38
A6.1 Introduction ............................................................................................... 38
A6.2 Data quality considerations ....................................................................... 38
A6.3 Crime outcomes data sources .................................................................. 38
A6.4 Data Validation processes.........................................................................40
A6.5 Further information on crime outcomes .................................................... 40
References ..................................................................................................................................... 42
List of figures
1 Introduction ................................................................................................................ 10
2 Outcomes assigned to offences recorded in the year ending March 2017 ......... 12
Figure 2.1 Outcome proportions by outcome group and offence group. ...................................... 14
3 The time gap between offences recorded and outcomes being assigned .......... 18
Figure 3.1 The time taken for outcomes to be assigned for offences broken down by
offence groups ............................................................................................................. 18
Figure 3.2 The time taken for sexual offences to receive an outcome, broken down by the
type of outcome given to the crime .............................................................................. 19
4 How offences flagged as domestic abuse were dealt with by the police ............ 22
5Figure 4.1 Proportions of outcomes assigned to domestic abuse-related offences and
offences not domestic abuse-related recorded in the year ending March 2018 ......... 23
Figure 4.2 Outcomes assigned to domestic abuse-related offences recorded in the year
ending March 2017 (as first published) and the year ending March 2018, by
outcome group ............................................................................................................. 24
5 Outcomes assigned to fraud offences in the year ending March 2018 ................ 25
Figure 5.1 How fraud outcomes are recorded .............................................................................. 26
Technical Annex .................................................................................................................................. 32
List of tables
1 Introduction ................................................................................................................ 10
Table 1.1 Grouping the outcomes framework from April 2014 onwards (outcomes 1-21) .......... 11
2 Outcomes assigned to offences recorded in the year ending March 2017 ......... 12
Table 2.1 Outcomes assigned to offences recorded in the year ending March 2017 and
March 2018, by outcome type and group .................................................................... 13
Table 2.2 Outcomes assigned to offences recorded in the year ending March 2018, by
outcome group and offence group ............................................................................... 16
3 The time gap between offences recorded and outcomes being assigned .......... 18
Table 3.1 The difference in the average (median) length of time taken to assign an outcome
between the year ending March 2017 and the year ending March 2018, by offence
type .............................................................................................................................. 20
Table 3.2 The difference in the average (median) length of time taken to assign an outcome
between the year ending March 2017 and the year ending March 2018, by
outcome group ............................................................................................................. 20
4 How offences flagged as domestic abuse were dealt with by the police ............ 22
5 Outcomes assigned to fraud offences in the year ending March 2018 ................ 25
Table 5.1 Number of fraud offences and disseminations, year ending March 2017 and
year ending March 2018 .............................................................................................. 27
Table 5.2 Fraud outcomes recorded in the year ending March 2017 and the year ending
March 2018, by outcome type ..................................................................................... 28
Table 5.3 Fraud outcomes recorded and disseminated offences in the year ending March
2018 ............................................................................................................................. 30
6Technical Annex .................................................................................................................................. 32
Table A1.1 Detection types prior to April 2013 and the outcomes frameworks in place
thereafter ...................................................................................................................... 33
7Executive Summary
OVERVIEW
This bulletin is based on the full outcomes framework introduced in April 2014. Under this framework,
every crime recorded by the police will eventually get a police outcome. This shows how the police
deal with all crimes, and those still under investigation.
KEY FINDINGS
How the police dealt with crimes recorded in the year ending March 2018:
• Police forces closed almost half (48%) of offences with no suspect identified, a similar
proportion to last year. This proportion varied by crime type. Three quarters (75%) of theft
offences were closed with no suspect identified, compared with around 7 per cent of rape
offences and 2 per cent of drugs offences.
• The proportion of crimes which resulted in a charge/summons fell by two percentage points,
from 11% to 9% (equivalent to an annual reduction of 41,215). This continues a downward
trend seen since the introduction of the Outcomes framework in year ending March 2015
when 15% of crimes were resolved with a charge/summons.
• Conversely, the proportion of offences that resulted in evidential difficulties increased from 26
per cent to 29 per cent. This is likely to be partly due to improved crime recording processes
by the police which according to the Office for National Statistics is a factor that has
contributed to the increase in police recorded crime.
• A further factor is likely to be the changing crime mix with rising numbers of complex crimes
such as sexual abuse, and an increasing volume of digital evidence which may require more
intensive work to investigate.
How long it took for offences recorded in the year ending March 2018 to get a police outcome:
The length of time it took police forces to assign an outcome to a crime varied. It depended on the
offence type and the type of outcome.
• It took police forces an average of 6 days to assign the outcomes they recorded in the year
ending March 2018, a decrease of 2 days compared to the year to March 2017.
• As in previous years, there was considerable variation by type of offence. Sexual offences
took the longest time to assign an outcome (median of 73 days) and theft and criminal
damage/arson the least (median of 2 days).
• The median length of time for investigations to be closed with no suspect identified fell from 2
days to 1 day.
How the police dealt with domestic-abuse-related offences recorded in the year ending March
2018:
• Higher proportions of domestic abuse-related offences received a charge/summons than
those that were not domestic abuse-related (15% and 9% respectively).
• Almost 7 out of 10 (69%) of domestic-abuse related offences had an evidential difficulties
outcome. This is almost three times higher than the proportion of offences that were not
domestic abuse-related (24%).
• The proportion of domestic abuse-related offences assigned a charge/summons decreased
(from 18% to 15%) compared with the previous year. Conversely, the proportion of offences
that resulted in the category “evidential difficulties - victim does not support action” increased
(up from 41% to 48%)
8Outcomes recorded in the year ending March 2018 for fraud offences:
The bulletin contains a) data on the number of fraud offences disseminated nationally and by police
force area level and b) data on the number of outcomes based on the full outcomes by police force
area level.
• There were 638,882 fraud offences recorded in the year end March 2018 which were
reviewed by the National Fraud Intelligence Bureau (NFIB) for possible investigation and
enforcement action.
• There is no direct correlation between offences disseminated and outcomes. Outcomes
assigned during 2017/18 could be for offences disseminated prior to year. Investigations can
take months or longer to complete.
• Of fraud offences disseminated to the police there was an increase of 3 per cent in the
number give an outcome of charge summons in the year to March 2018 compared with the
year to March 2017.
91 Introduction
1.1 – OVERVIEW
This bulletin reports on outcomes that police forces have assigned to offences recorded by the police.
It covers the 43 territorial police forces in England and Wales, plus the British Transport Police.
In April 2013, the Home Office introduced the new outcomes framework, replacing ‘detections’. This
new framework provides greater transparency on how all crimes recorded by the police are dealt with.
The previous ‘detections’ gave a partial picture of the work police do to investigate and resolve crime.
This resulted in performance targets, which risked driving perverse crime recording decisions. It may
also have undermined the victim-focused approach set out in the crime recording standard 2.
As well as this annual publication, the Home Office also publishes quarterly outcomes tables. These
are published here www.gov.uk/government/collections/crime-outcomes-in-england-and-wales-
statistics.
For more detailed background on the outcomes framework and how it was developed, see Annex A6:
Crime Outcomes Data Quality.
1.2 – THE FULL OUTCOMES FRAMEWORK
The Home Office introduced the outcomes framework in April 2013. Since then it has developed to
cover a broader range of outcome types for police forces to use. Annex table A1.1 shows how the
current outcomes framework builds on former outcome and detection types. Detailed descriptions of
each outcome type, can be found in the technical annex.
While police forces will eventually give an outcome to every crime, this may take some time. At any
given point, police forces will be undertaking crime investigations to which they will not yet have
assigned an outcome. Police forces will therefore submit revised data to the Home Office as
investigations are completed.
1.3 – OUTCOME GROUPINGS IN THIS BULLETIN
Some of the tables and charts in this bulletin show grouped outcomes to simplify presentation. For
transparency, Open Data tables are also published that show the full range of police outcomes. These
are accessible from: www.gov.uk/government/statistics/police-recorded-crime-open-data-tables.
Table 1.1 shows the groupings. These take account of user feedback following a consultation in 2014.
2 www.gov.uk/government/publications/counting-rules-for-recorded-crime
10Table 1.1: Grouping the outcomes framework from April 2014 onwards (outcomes 1-21) Outcome Group Outcome type(s) Charged/Summonsed 1 Taken into consideration 4 Out-of-court (formal) 2, 3, 6 Out-of-court (informal) 7, 8 Prosecution prevented or not in the public interest 5, 9, 10, 11, 12, 13, 17 Evidential difficulties (suspect identified; victim supports action) 15 Evidential difficulties (victim does not support action) 14, 16 Investigation complete – no suspect identified 18 Action undertaken by another body/agency (from April 2015) 20 Further investigation to support formal action not in the public interest (police decision) (from January 2016) 21 Note: outcome 19 not shown as this applies to fraud offences recorded by the National Fraud Intelligence Bureau only See technical annex A6.5 for detailed descriptions of each outcome type. 1.4 – SUPPLEMENTARY DATA TABLES The bulletin chapters below discuss key topics of interest in the outcomes data. Data presented in these chapters as both charts and tables is available online via bulletin tables published on the Home Office website. In addition to the tables found in a main bulletin, a number of supplementary tables area available here which provide additional data on the topics discussed, plus data on areas not covered. Data on transferred and cancelled records, and “old-style” outcomes (see Technical Annex for explanation of the two outcome styles) are also published here. Supplementary data tables for this publication can be found here: https://www.gov.uk/government/statistics/crime-outcomes-in-england- and-wales-2017-to-2018
2           Outcomes assigned to offences recorded
            in the year ending March 2018
2.1 - INTRODUCTION
This chapter covers how the police have dealt with crimes recorded in the year ending March 2018. It
should be noted that not all offences recorded have yet to be assigned final outcomes. A complete
picture of how crimes have been resolved by the police will become available in updated tables which
are published on a quarterly basis. The recording of fraud offences has been centralised via Action
Fraud (the UK’s national fraud and cyber-crime reporting centre) and for this reason outcome for these
offences are not included in the data presented in Chapters 2, 3 or 4. Outcomes for fraud offences are
covered in Chapter 5.

When comparing crime outcomes data over time it is important to consider the broader context and
changing crime caseloads. In 2014, Her Majesty’s Inspectorate of Constabulary published a critical
national thematic report on crime recording which revealed significant under-recording of crimes that
had been reported by victims to the police. This has been followed by a programme of rolling
inspections of forces to examine compliance with the Home Office Crime Recording standards. This
has led to improved compliance and increased caseloads as more crimes are (correctly) recorded
than in previous years. In addition, the Office for National Statistics have commented that some of the
increases in the lower volume but more serious categories of crime (such as homicide and knife
crime) may be genuie. In addition, it is thought that more victims of sexual offences and domestic
abuse have been willing to come forward to report crimes to the police than has happened in the past.

As a result, the volume of the crime caseload being dealt with by the police has grown. In addition,
there is evidence to suggest that the crime mix has changed in recent years with rising numbers of
complex crimes like sexual abuse, child abuse and domestic abuse. The increasing volume of digital
evidence (which may require more intensive work to investigate) across a wide spectrum of offences
from harassment to sexual offences may also be an issue. At the same time, many forces have
adopted local policies to prioritise the use of investigative resources.

These factors are likely to have an impact on the distribution of outcomes over time and across forces.

2.2 – HOW OUTCOMES VARY BY OUTCOME TYPE
Table 2.1 summarises outcomes given to all crimes recorded in the year to March 2018 at the time
that data was finalised for analysis (June 2018). It also shows how this compares with outcomes given
to crimes recorded in the previous year. For comparability, we present outcomes for the year to March
2017 as they appeared when first published in July 2017 3.

As was the case last year, almost half of offences (48%) were closed with no suspect identified.
However, this varied considerably by offence type (see figure 2.1 and table 2.2).

A slightly higher proportion of offences than last year resulted in evidential difficulties (29%). This is
nearly three percentage points higher than last year (26%) and most of the increase was due to cases
where suspects had been identified, but the victim did not want further action to be taken.

This affected the charge/summons rate, which fell by two percentage points from 11% to 9%
(equivalent to a drop of 41,215 charge/summons). There was also a drop in the number and
proportion of offences resolved through out of court resolutions. This was seen across the range of out
of court outcomes but the largest volume reductions were in the use of adult cautions (down by 0.6%
or 17,043) and Community Resolutions (down by 0.4% or 7,940).

Other outcomes were in similar proportions to last year, and around 6% of cases in both years were
still outstanding at a similar time of analysis. However, given the increased volume of crime being
dealt with by the police, a similar proportion yielded a higher number of cases not yet assigned an

3 Published open data tables show the current picture for March 2017 data which have had a further 12 months for an outcome to be applied, see:
https://www.gov.uk/government/statistics/police-recorded-crime-open-data-tables

                                                                          12
outcome at year end March 2018 (around 46,000 higher than the previous year). Longer-term trends
are examined in section 2.3 below.
Table 2.1: Outcomes assigned to offences recorded in the year ending March 2017 and March
2018, by outcome type and group
England and Wales, Recorded crim e and outcom es
Outcom e Proportion of offences Volum e of offences
num ber Outcom e type/group recorded in period:2 recorded in period:2
Year to Year to
March 2017 (as Year to March 2017 (as Year to
first published March first published March
in July 2017) 3,4 20184,5 in July 2017) 3,4 20184,5
1 Charged/Sum m onsed 11.2 9.1 483,932 442,717
4 Taken into consideration 6 0.2 0.1 8,941 6,758
Out-of-court (form al) 2.6 1.8 112,172 87,597
2 Caution - youths 4 0.3 0.2 13,868 11,139
3 Caution - adults 4 1.9 1.3 80,651 63,608
6 Penalty Notices for Disorder 0.4 0.3 17,653 12,850
Out-of-court (inform al) 3.2 2.6 137,214 127,587
7 Cannabis/Khat w arning 0.8 0.6 32,738 31,051
8 Community resolution 2.4 2.0 104,476 96,536
Prosecution prevented or not in the public interest 1.3 1.3 56,418 62,461
5 Offender died 0.0 0.0 1,076 1,819
9 Not in public interest (CPS) 0.1 0.0 2,629 2,112
10 Not in public interest (Police) 0.7 0.6 28,290 29,917
11 Prosecution prevented – suspect under age 0.1 0.2 6,064 7,623
12 Prosecution prevented – suspect too ill 0.3 0.2 10,987 11,909
13 Prosecution prevented – victim/key w itness dead/too ill 0.0 0.0 1,605 1,716
17 Prosecution time limit expired 0.1 0.2 5,767 7,365
15 Evidential difficulties (suspect identified; victim supports action) 9.3 8.9 401,555 434,500
Evidential difficulties (victim does not support action) 16.7 20.0 721,406 975,333
14 Evidential difficulties: suspect not identified; victim does not support further action 3.9 4.6 167,515 226,125
16 Evidential difficulties: suspect identified; victim does not support further action 12.8 15.4 553,891 749,208
18 Investigation com plete - no suspect identified 47.7 47.5 2,059,076 2,316,610
20 Action undertaken by another body/agency 0.8 0.9 32,613 46,195
21 Further investigation to support form al action not in the public interest 7 0.9 1.4 37,960 67,025
Total offences assigned an outcom e (type 1-18, 20, 21) 93.9 93.6 4,051,287 4,566,783
Offences not yet assigned an outcom e 6.1 6.4 264,213 310,217
Total offences 1 100.0 100.0 4,315,500 4,877,000
1. Year to March 2017 and year to March 2018 exclude fraud offences. Fraud offences are now recorded by the National Fraud Intelligence Bureau (NFIB) rather than
police forces. Outcome 19 not show n as this applies only to fraud offences recorded by the NFIB.
2. Proportions show the percentage of crimes recorded in the year receiving each outcome.
3. Based on data from all 44 forces covering the full year to March 2017. Of these, 3 forces did not submit updated year to March 2017 data to the Home Office for this
publication. These forces may therefore appear to have few er than expected outcomes assigned during that period as their numbers have not been updated since first
published. See Table A for details.
4. Proportions as at the time data w ere provided to the Home Office.
5. Based on data from all 44 forces.
6. Offences asked to be taken in to consideration by a court (TICs).
7. Outcome 21 w as introduced from January 2016 on a voluntary basis and became mandatory from April 2016.
2.3 – HOW OUTCOMES VARY BY OFFENCE GROUP
How crimes are resolved vary considerably by the type of offence committed and reflect factors such
as nature of the offence, differing police force priorities and the varying challenges in gathering
evidence. For example, it will be far more difficult to identify a suspect for a criminal damage offence
that was not witnessed or caught on CCTV than for a drug possession offence where the police
apprehended the offender when the crime came to their attention. Similarly, an offence where
substantial forensic evidence exists will be easier to proceed with than one where such evidence does
not exist. The willingness of victims or witnesses to engage with the police can also vary by type of
offence.
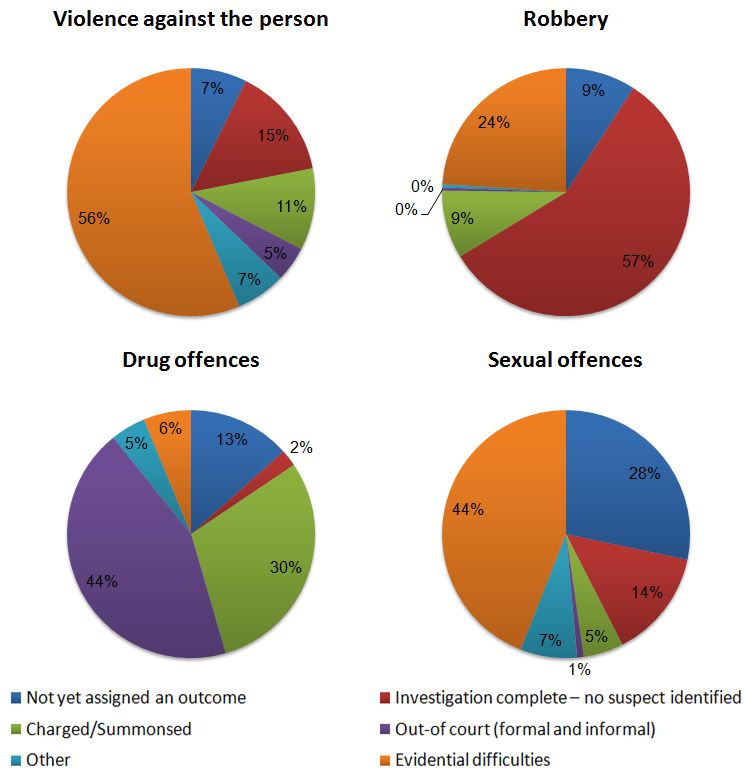
The variation in outcomes across offence groups is highlighted by the differences in the four offences
illustrated in Figure 2.1 (a fuller breakdown of can be found in Table 2.2).Figure 2.1: Outcome proportions by outcome group1,2,3 and offence group. See Table 2.2 for a
more detailed breakdown including all offence and outcome types.
Source: Home Office Data Hub (HODH) and voluntary spreadsheet return
1. Other outcomes include “Taken into consideration”, ”, “Prosecution prevented or not in the public interest”,
“Action undertaken by another body/agency” and “Further investigation to support formal action not in the public
interest”
2. Out-of-court (formal and informal) outcomes include cannabis/khat warnings, community resolutions, cautions for
youths and adults and penalty notice for disorder.
3. Evidential difficulties outcomes include
In the four offence groups illustrated, around three quarters of drug offences received either a
charge/summons or an out-of-court outcome (44%) or charge/summons (30%). Out-of-court
outcomes, such as cautions and Community Resolutions, are typically used for dealing with less
serious offences; however, the suspect has to admit guilt for the out-of-court outcome to be applied.
However, within the overall category of drug offences there was a difference between how possession
of cannabis and other drugs were resolved4. Cannabis possession had a charge rate of 23% with 60%
4 See https://www.gov.uk/government/statistics/police-recorded-crime-open-data-tables
14of these offences receiving out of court outcomes (of which 38% were cannabis/khat warnings). In contrast, for other drugs the charge rate was higher (43%) and there was much less use of out-of- court outcomes (8%). For drugs possession offences, the overall charge rate and out-of-court outcome rate are both driven by outcomes for possession of cannabis (81,765 offences in 2017/18) which is much more prevalent than other drugs (26,918 offences in 2017/18). It should also be noted that different police forces have differing approaches to using out-of court outcomes. For example, Lancashire, Leicestershire and Staffordshire do not use cannabis/ khat warnings for possession of cannabis offences, deciding to use Community Resolutions instead. While three-quarters of drug offences resulted in either a charge/summons or an out of court disposal, the other three offences illustrated in Figure 2.1 had much lower rates. For example, robbery had a much higher rate of offences which resulted in no suspect being identified (57%). Given the nature of the offence, victims of robbery may not be able to provide much information about offenders and there may not be good evidence available to identify a suspect if they weren’t caught on CCTV and there is no other evidence. Sexual offences were most likely to have not yet been assigned an outcome (28%) reflecting the greater complexity of investigations for such offences and the extended time required to assign an outcome compared with many other crime types (see chapter 3). This contributed to the low proportion of sexual offences with a charge/summons (5%). Other contributory factors included a higher than average proportion of cases assigned to one of the evidential difficulties categories. For example, in around a third of rape offences (34%) cases were closed because the victim did not support further police action against a suspect. Conversely, given the nature of the crime, sexual offences had much lower level of suspects not identified (14% compared with an average of 47% for all offences). Violence against the person offences were most likely to result in victims not supporting police action (41%). The unwillingness of victims to support police action contributes to the overall low charge rate for violence offences (11%). Unwillingness of victims to support action was more likely to be a factor in cases involving domestic abuse (see Chapter 4). Violence against the person is a broad offence group covering a wide spectrum of offending from homicide and serious violent crime through to lower volume assault, and stalking. Outcomes varied within this offence group. For example, the charge/summons rate for assault with injury offences was nearly twice as high as that for assault without injury (12% and 7% respectively). Most of this difference was accounted for by victims of assault without injury not supporting police action. Malicious communications offences accounted for 11% of all recorded violence against the person offences in the year end March 2018 but had one of the lowest charge/summons rates (at 3%). In part this reflected a higher proportion of cases that resulted in no suspect being identified (22%) and in victims not supporting police action (46%).
Table 2.2: Outcomes assigned to offences recorded in the year ending March 2018, by outcome group and offence group

                                                                                                                                                                  England and Wales, Recorded crim e and outcom es

                                                                                                                                                                                                   Further
                                                                                                                                                                                            investigation
                                                                                                      Prosecution          Evidential    Evidential                                  Action    to support
                                                                                                        prevented         difficulties difficulties Investigation              undertaken form al action Offences not
                                                     Taken into               Out-of-       Out-of- or not in the           (suspect (victim does com plete - no                by another      not in the          yet
                                         Charged/ consideration                 court         court         public identified; victim not support        suspect                      body/         public    assigned
Offence group                         sum m onsed       (TICs) 2            (form al) 3 (inform al) 4    interest 5 supports action)       action) 6   identified                   agency       interest 7 an outcom e
Violence against the person                      10.7                0.0           2.1           2.4             2.3                 15.4             40.9              14.6             2.4               1.8                 7.3
Sexual offences                                    5.2               0.0           0.5           0.4             2.5                 15.7             28.3              14.2             2.8               2.1                28.3
 of w hich: Rape                                   2.9               0.0           0.0           0.0             1.4                 15.0             34.3               7.1             1.1               0.3                37.9
Robbery                                            8.9               0.0           0.2           0.2             0.2                   6.5            17.4              57.2             0.1               0.1                 9.1
Theft offences                                     6.6               0.3           0.8           1.4             0.4                   4.2             6.6              75.0             0.1               0.7                 3.9
Criminal damage and arson                          5.5               0.0           1.5           2.3             0.8                   5.2            12.6              67.4             0.2               0.6                 3.8
Drug offences                                    29.9                0.0          15.1          28.6             2.3                   5.8             0.4               2.2             0.3               2.0                13.4
Possession of w eapons offences                  39.6                0.0           6.1           4.8             3.6                 14.3              6.8              11.0             0.8               3.0                10.0
Public order offences                            10.9                0.0           2.0           2.1             1.8                 12.8             30.9              30.5             0.4               2.9                 5.7
Misc. crimes against society                     17.1                0.1           1.7           2.4             2.3                 14.4             19.6              17.9             3.1               7.1                14.4

Total year to March 2018                           9.1               0.1           1.8           2.6             1.3                   8.9            20.0              47.5             0.9               1.4                 6.4

1. Year to March 2018 data exclude fraud offences. Fraud offences are now recorded by the National Fraud Intelligence Bureau (NFIB) rather than police forces.
2. Offences asked to be taken into consideration by a court (TICs).
3. Includes caution - adults; caution - youths; Penalty Notices for Disorder.
4. Includes cannabis/khat w arnings and community resolutions.
5. Includes not in the public interest (CPS); Not in public interest (Police); Offender Died; Prosecution prevented (suspect under age; suspect too ill; victim/key w itness dead/too ill); Prosecution time limit expired.
6. Includes evidential difficulties w here the suspect w as/w as not identified and the victim does not support further action.
7. Outcome 21 (Further investigation to support formal action not in the public interest) w as introduced from January 2016 on a voluntary basis and became mandatory from April 2016.
8. Proportions show the percentage of crimes recorded in the year receiving each outcome.

                                                                                                         16
2.4 – LONGER TERM TRENDS IN HOW CRIMES RESOLVED
Since the introduction of the crime outcomes framework there has been a downward trend in the
proportion of charge/summons applied within the same year that the crime is recorded (falling from
15% to 9%). There has also be a growing proportion of cases recorded where victims do not support
police action (from 9% to 20%). These two trends are likely to have been influenced by the changing
caseload and crime mix being dealt with by the police. On-going work has improved the recording of
crime by police forces which has both increased the volume forces are dealing with and changed the
crime mix to include more complex cases, such as sexual offences and domestic abuse, which can be
more challenging to resolve. At the same time, while more crimes are now being reported to the police
by victims in a growing proportion of cases the victim either doesn’t support further action or police are
unable to contact them. A more detailed time series of outcomes since the new framework was
introduced for the year end March 2015 can be found in Table 2.3 in the online bulletin tables 5.
Key questions – why are charge rates falling? And why are the numbers of charges
falling despite increases in police recorded crime?
The charge/summons rate for offences recorded in the year to March 2018 currently stands at
9%, compared with 11% when corresponding data for year end March 2017 was first published.
Additionally, the volume of charges is falling, from 483,932 to 442,717 for offences (a 9% fall).
This reduction has occurred at the same time as the volume of crimes (excluding fraud)
recorded by the police has risen (from 4.3 million to 4.9 million). Along with a growing caseload,
there is evidence to suggest that a higher proportion of crimes being recorded are in offence
types which are the most challenging to investigate. For example, the number of recorded
sexual offences has increased by 24% in the latest year, from 121,450 to 150,732. This means
that the caseload has both grown and become more complex.
5 https://www.gov.uk/government/statistics/crime-outcomes-in-england-and-wales-2017-to-2018
17.
3 – The time gap between offences recorded
and outcomes being assigned
This section aims to demonstrate the previously raised point that some crimes are more complex to
investigate than others, particularly rape and sexual offences. This can mean it takes more time to
assign an outcome to an offence after initial recording.
In order to include outcomes that may have taken a long time to assign, the data presented in this
chapter cover outcomes recorded in the year ending March 2018, regardless of when the offence was
initially recorded. Time, in days, is presented by median average as this measure is less susceptible to
being skewed by a small number of unusually high or low values.
3.1 – TIMELINESS BY OFFENCE AND OUTCOME TYPE
In the year ending March 2018, it took an average of 6 days to assign an outcome to an offence.
Furthermore, nearly half (47.3%) of all outcomes were assigned within five days of recording the
offence, and close to three quarters (71.3%) within 30 days. A detailed breakdown of time taken to
assign outcomes to offences by offence type is in supplementary table S3.1 in the online bulletin
tables6.
More insightful analysis can be made by breaking down overall figures by offence and outcome types,
as shown in Figure 3.1 below:
Figure 3.1: The time taken for outcomes to be assigned for offences broken down by offence
groups.
For context, the volume of crimes in each category recorded in 2017/18 is included on the right hand side of the chart.
Source: Home Office Data Hub
Sexual offences generally took much longer to have outcomes assigned than other offence types. The
median was 73 days, with 41 per cent taking over 100 days. For rape offences, a subset of sexual
offences, the median average for an outcome to be assigned was 129 days, with 56 per cent taking
over 100 days. The length of time reflects the sensitive nature and complexity of investigating sexual
offences.
6 https://www.gov.uk/government/statistics/crime-outcomes-in-england-and-wales-2017-to-2018
18In contrast to sexual offences, theft offences and criminal damage and arson offences took an
average of 2 days for outcomes to be assigned. This reflects the nature of these types of offences,
whereby police identify offenders immediately, or evidence to locate a suspect is unavailable (e.g. no
CCTV).
A detailed breakdown of the amount of time for sexual offences to receive an outcome by the type of
outcome applied is presented in Figure 3.2. This shows that charges and summons for sexual
offences take the longest amount of time to be assigned, at an average of 150 days.
Figure 3.2 The time taken for sexual offences to receive an outcome, broken down by the type
of outcome given to the crime. The average length of time taken for a sexual offence to be
given a charge outcome is 150 days, over twice as long as the overall average.
Charge/summons 150
Evidential difficulties (suspect identified; victim
supports action) 136
Out-of-court (formal) 76
Evidential difficulties (victim does not support action) 63
Out-of-court (informal) 54
Prosecution prevented or not in the public interest 46
Investigation complete - no suspect identified 37
Police decide to take no further action despite a suspect
being identified 33
Another body/agency 28
Taken into consideration 13
0 50 100 150 200
Number of days
3.2 – CHANGE IN TIME TO ASSIGN OUTCOMES COMPARED TO PREVIOUS
YEARS
Table 3.1 shows how the median length of time to assign an outcome to particular offence types has
generally decreased in the year ending March 2018 compared to the year ending March 2017. Theft
offences were resolved 50% more quickly in the latest year compared to the previous year. This may
reflect the fact that some police forces have recently said they will only investigate thefts if the goods
are over a certain value (Sources: https://www.bbc.co.uk/news/uk-england-london-41633205 and
https://www.bbc.co.uk/news/uk-42492488). Only drug offences have shown an increase in median
days for an outcome to be assigned to an offence, from 13 days in the years ending March 2017 to 14
days in the year ending March 2018.
Overall, there has been a 25% reduction in the time for outcomes to be assigned, from 8 days in the
year ending March 2017 to 6 days in the year ending March 2018. This continues a downward trend in
time taken for outcomes to be assigned, from a peak of 11 days in the year ending March 2016. In
part, this may reflect growing familiarity with the new framework as the new approach to resolving
outcomes has bed-in.Table 3.1: The difference in the average (median) length of time taken to assign an outcome
between the year ending March 2017 and the year ending March 2018, by offence type
England and Wales, Recorded crime and outcomes
Median number of days for an outcome to be assigned
Difference between
y.e March 2017 and
Y.e. March 2016 Y.e. March 2017 Y.e. March 2018 y.e March 2018
Violence against the person 17 17 15 -2
Sexual offences 80 79 73 -6
of which: Rape 138 144 129 -15
Robbery 34 31 23 -8
Theft offences 7 4 2 -2
Criminal Damage and Arson 4 3 2 -1
Drug offences 10 13 14 1
Possession of weapons offences 9 13 13 0
Public order offences 16 13 8 -5
Miscellaneous crimes 20 20 19 -1
All crimes (excluding fraud) 11 8 6 -2
Table 3.2 shows how the average length of time to assign particular outcomes has changed since the
previous year. The time taken to charge someone increased from 17 days in the year ending March
2017 to 18 days in the year ending March 2018. The time taken for investigations to be closed with no
suspect identified decreased from 2 days in the year ending March 2017 to just 1 day in the year
ending March 2018.
Table 3.2: The difference in the average (median) length of time taken to assign an outcome
between the year ending March 2017 and the year ending March 2018, by outcome group
England and Wales, Recorded crime and outcomes
Median number of days for an outcome to be assigned
Difference betw een
y.e March 2017 and
Y.e March 2016 Y.e. March 2017 Y.e. March 2018 y.e March 2018
Charge/summons 14 17 18 1
Taken into consideration 65 61 67 6
Out-of-court (formal) 10 12 16 4
Out-of-court (informal) 14 16 17 1
Prosecution prevented or not in the public interest 27 26 26 0
Evidential difficulties (suspect identified; victim supports action) 36 39 40 1
Evidential difficulties (victim does not support action) 16 14 12 -2
Investigation complete - no suspect identified 4 2 1 -1
Action undertaken by another body/agency 19 17 21 4
Further investigation to support formal action not in the public interest 17 17 13 -4
All crimes (excluding fraud) 11 8 6 -2
Source: Home Office Data Hub, outcomes recorded in the year ending March 2016,March 2017 and outcomes recorded in the year ending March 2018
20Key question – why is the overall time taken for outcomes to be assigned to crimes decreasing? With the volume of police recorded crime up in the latest year, and policing numbers remaining largely unchanged, it might be expected that the time for outcomes to be assigned to crimes to would increase rather than decrease. There are likely to be a range of factors behind this decrease including the changing crime mix and use of local policies to prioritise investigative resource. The largest volume increases in recorded crime have been in a number of categories least likely to have good evidence to follow-up or deemed a lower priority for investigation, such as theft and low level violence.
4 How domestic abuse-related offences were
dealt with by the police
4.1 INTRODUCTION
There is not currently a specific offence of domestic abuse and such crimes will be recorded under a
specific criminal offence, such as actual bodily harm. In April 2015, the Home Office began collecting
information from the police via the Home Office Data Hub (see technical annex for description) on
whether recorded offences were related to domestic abuse from police forces in England and Wales
and the British Transport police. Crimes are “flagged” by the police as being domestic abuse-related if
the offence meets the government definition of domestic violence and abuse 7.

This chapter covers how the police have dealt with domestic abuse-related offences recorded in the
year ending March 2018. The analyses presented are based on data from 29 police forces in England
and Wales (including the British Transport Police 8)that supplied adequate data9. These police forces
recorded 69 per cent of all domestic abuse-related offences in England and Wales in 2017/18. Further
detailed data can be found in supplementary online tables10.

The Office for National Statistics (ONS) publish an annual cross-governmental bulletin on domestic
abuse which includes further analysis on domestic abuse-related outcomes. The latest publication can
be found at here and will be updated in November 2018.

4.2 HOW DOMESTIC ABUSE OFFENCES WERE DEALT WITH BY THE POLICE
BY OUTCOMES TYPE
The rates shown in Figure 4.1 cover domestic abuse-related offences recorded in the year ending
March 2018. In total, 93 per cent of these offences had been assigned an outcome at the time the
data were extracted from the Home Office Data Hub11. Police forces had not yet assigned an outcome
to the remaining seven per cent of offences. Domestic abuse-related offence outcomes are compared
below with offences that were not domestic abuse-related; some of the differences found will reflect
the differing crime types within each category.

     •    A higher proportion (15%) of domestic abuse-related offences were dealt with by a charge or
          summons than offences that were not domestic abuse-related (9%).
     •    Almost 7 out of 10 (69%) domestic abuse-related offences had an evidential difficulties
          outcome. This is almost three times the proportion of offences that were not domestic abuse-
          related that had an evidential difficulties outcome (25%).
     •    Evidential difficulties for domestic abuse-related offences consisted of 47 per cent of offences
          where the victim did not support further action and 22 per cent where the victim supported
          further action.
     •    Just two per cent of domestic abuse-related offences were assigned the outcome
          ‘investigation complete - no suspect identified’ compared with over half (52%) of offences that
          were not domestic abuse-related. This is to be expected given that, by definition, in a domestic
          abuse-related offence the offender must be a partner, ex-partner or a family member of the
          victim.

7
  Any incident or pattern of incidents of controlling, coercive or threatening behaviour, violence or abuse between those aged 16
or over who are or have been intimate partners or family members regardless of gender or sexuality.
8
  Avon and Somerset, Bedfordshire, British Transport Police, Cambridgeshire, Cheshire, Cleveland, Devon and Cornwall,
Dorset, Durham, Gloucestershire, Hampshire, Hertfordshire, Kent, Lancashire, Lincolnshire, Merseyside, Metropolitan Police,
Norfolk, North Wales, North Yorkshire, Northamptonshire, Northumbria, South Wales, Staffordshire, Suffolk, Surrey, Thames
Valley, West Yorkshire and Wiltshire.
9
  The analysis in this chapter is based on a different subset of forces than previous chapters.
10
   https://www.gov.uk/government/statistics/crime-outcomes-in-england-and-wales-2017-to-2018
11
   Mid-June 2018 This proportion is higher than the proportion for all offences, although much of this may be due to different
snapshot dates and the inclusion of fewer forces.

                                                              22
Figure 4.1; Proportions of outcomes assigned to domestic abuse-related offences and
offences not domestic abuse-related recorded in the year ending March 2018
Offences not flagged as domestic abuse Domestic abuse flagged offences
16
Evidential difficulties (victim does not support action)
48
Evidential difficulties (suspect identified; victim supports 8
action) 22
8
Charged/Summonsed
15
6
Offences not yet assigned an outcome
6
5
Out-of-court (formal and informal)
4
54
Investigation complete - no suspect identified
2
4
Other
4
0 10 20 30 40 50 60
Percentages
Source: Police Recorded Crime, Home Office Data Hub
1. Based on 29 police forces that supplied adequate data
2. The numbers behind this chart are in the supplementary online data tables, which can be found here:
https://www.gov.uk/government/statistics/crime-outcomes-in-england-and-wales-2017-to-2018
4.3 – TRENDS IN HOW DOMESTIC ABUSE-RELATED OFFENCES WERE DEALT
WITH BY THE POLICE
In order to get an indication of genuine changes over time it is more meaningful to compare figures for
the year ending March 2018 with figures for the previous year as at the time they were first published
in July 2017. As there were only data for 26 comparable forces for both years these comparisons are
carried out on these forces12 only.
As shown in Figure 4.2, a similar proportion of crimes had been assigned an outcome in both years.
However, the proportion of domestic abuse-related offences assigned a charge/summons decreased
(from 18% to 15%). Conversely, the proportion of offences that resulted in evidential difficulties (victim
does not support action) increased, from 42 per cent to 47 per cent in the following year. This is a
similar trend to all offences (see Chapter 2).
Differences in outcome proportions will be influenced by a number of factors, including but not limited
to:
• Improvements in crime recording by the police which have led to increases in crime volumes
for some crime types, in particular for violence and sexual offences. It is likely that many of the
additional offences now being recorded are those that are less likely to be resolved by a
charge, summons or other out of court resolution than offences that would have previously
been recorded.
• An increased willingness of victims to report crimes to the police, particularly for domestic
abuse related offences. It is likely that some of the increase in evidential difficulties outcomes
is due to crimes that victims may not have reported to the police in previous years.
Figure 4.2: Outcomes assigned to domestic abuse-related offences recorded in the year ending
12
Avon and Somerset, Bedfordshire, British Transport Police, Cambridgeshire, Cheshire, Cleveland, Devon and Cornwall,
Durham, Gloucestershire, Hampshire, Hertfordshire, Kent, Lancashire, Lincolnshire, Merseyside, Metropolitan Police, North
Wales, North Yorkshire, Northamptonshire, Northumbria, South Wales, Staffordshire, Surrey, Thames Valley, West Yorkshire
and Wiltshire.March 2017 (as first published) and the year ending March 2018, by outcome group
Y.e March 2017 (as first published July 2017) Y.e March 2018
41
Evidential difficulties (victim does not support action)
48
24
Evidential difficulties (suspect identified; victim supports action)
22
18
Charged/Summonsed
15
6
Offences not yet assigned an outcome
6
6
Out-of_court (formal and informal)
4
2
Investigation complete - no suspect identified
2
3
Other
4
0 10 20 30 40 50 60
Percentages
Source: Police Recorded Crime, Home Office Data Hub
1. Based on 26 police forces that supplied adequate data
2. The numbers behind this chart are in the supplementary online data tables, which can be found here:
https://www.gov.uk/government/statistics/crime-outcomes-in-england-and-wales-2017-to-2018
Key questions - why haven’t we got the whole picture? And why are there a large
percentage of cases with evidential difficulties?
The number of forces that supplied adequate data to the Home Office Data Hub was 29
of the 43 police forces in England and Wales and the British Transport Police. This is less
than the number of forces (34) for the equivalent time period last year. Similarly there are
26 forces who supplied adequate data in both 2016/17 and 2017/18 consecutively.
Changes to individual police force recording systems and demand on police resources
are thought to be the reasons for this.
Domestic abuse outcomes data typically have a high rate of cases with evidential
difficulties and figures show the proportion of this is increasing. Of the forces supplying
adequate data, 42% of domestic abuse flagged offences had an outcome of evidential
difficulties where the victim did not support action in 2016/17 compared with 47% in
2017/18. Improvements in police recorded crime and increased willingness of victims to
report crime that they wouldn’t have in previous years are likely to be the drivers of this.
245 Outcomes assigned to fraud offences in
the year ending March 2018
5.1 INTRODUCTION
In April 2011, Action Fraud (the UK’s national fraud and cybercrime reporting centre) began gradually
taking over the recording of fraud offences from individual police forces in England and Wales. This
transition completed in March 2013. The implementation of Action Fraud as a single national fraud
reporting centre has led to an increase in the number of fraud offences recorded, as it provides an
easier way for individuals and businesses to report such offences (via an online reporting tool and a
dedicated call centre), and centralises expertise in these cases. The transfer to Action Fraud was
rolled out at different times in different forces. The year ending March 2014 was therefore the first full
year where all fraud offences previously reported to the police were recorded centrally.
Action Fraud reports are reviewed by the National Fraud Intelligence Bureau (NFIB), based at the City
of London Police, who are responsible for allocating offences to forces for them to investigate. The
police recorded crime series published by the Office for National Statistics (ONS), also incorporates
offences reported to the NFIB by two fraud prevention industry bodies: Cifas and Financial Fraud
Action UK (FFA UK). Data on fraud offences broken down by industry body are shown in Table 3.1.
The NFIB outcomes recording process is shown in the flow chart in Figure 3.1. Reports from Cifas,
FFA UK and Action Fraud are automatically assessed by the NFIB’s systems, using a scoring matrix
to determine whether there are sufficient grounds to allocate the case to the police for investigation.
The NFIB’s system constantly reviews all crime reports against all other data held in the database and
looks for links between offences which share a piece of information, such as a telephone number,
email address or website URL. The reports are scored based on a viability criteria, and the NFIB’s
system automatically produces crime networks with a viability ranking. The team reviews these
networks and determines if there is a realistic chance of identifying the offender through personal
information, such as a telephone number, postal address or bank account. The team conducts
research to help identify suspect(s), such as requesting information from a bank or making a
telecommunications subscriber check.
Where it is judged that there are sufficient grounds for investigation and enforcement is viable, the
NFIB allocates these cases to the most appropriate police force or other law enforcement agency.
Cases closed at one point may be re-opened if new information comes to light. For example, an
offence could have occurred in 2016/17 but not scored highly enough on NFIB’s matrix to make it
viable for enforcement at the time. Then another offence could have occurred in 2017/18 which links
to the 2016/17 offence with a shared offender name, and provides more information such as a bank
account. Then both offences could have received a viability score above the threshold, resulting in
both offences being disseminated to the relevant force for investigation.
NFIB allocations to forces are referred to as “dissemination packages”, and each package can contain
multiple offences. The police force investigates the offences and allocates an appropriate outcome to
each individual offence. Rather than return these outcomes to the Home Office with other recorded
crimes, each police force submits the outcomes to the NFIB on a monthly basis, who in-turn pass
aggregate reports to the Home Office.
For crime reports where sufficient grounds for investigation do not exist, the reports remain on the
NFIB’s database. As new crime reports are submitted, more data may be linked to existing crime
reports which may increase their viability for investigation.
In addition to investigating offences disseminated from NFIB, a police force can also receive fraud-
related ‘calls for service’ direct from members of the public. This is when victims of fraud require an
active police response, and dial either 999 or 101 to contact the police directly. Police forces will deal
with fraud directly if certain criteria are met, such as if at the time of the call for service, the offender is
in the act of committing, or has recently committed, the offence. As with disseminated offences, the
outcomes of calls for service for fraud offences are submitted by the relevant force to the NFIB.
It should be noted that, unlike other outcomes data presented in this bulletin, it is not possible to link
individual outcomes to offences as the data streams at present are based on aggregate totals. It is
important to note that the number of outcomes will not necessarily correspond to the number of
disseminations in a given year since investigations can take months, or longer, to complete. A large
number of offences disseminated to the police in the year to March 2018 are still under investigation.You can also read