Commentary Fair Pay Agreements and the Retail sector
←
→
Page content transcription
If your browser does not render page correctly, please read the page content below

CTU Monthly Economic Bulletin                                                                  Information
No. 211 (June 2019)                                                                            Section p.8

Commentary
Fair Pay Agreements and the Retail sector
    Last Tuesday the CTU launched a report by economist Dr Ganesh Nana on the evidence as to the
    impacts of industry (or sector) collective bargaining. We commissioned the study to promote
    Fair Pay Agreements which the Government is currently considering. Fair Pay Agreements aim to
    form a floor of wages and conditions for an industry, and to advance industry training.
    BERL found (as has the OECD and most countries in Europe), that this form of bargaining is good
    for employment, helps to close the gap between productivity growth and wage increases,
    reduces inequality, and has other non-wage benefits such as “job security, working time
    regulation, quality of working environment, and provision and access to training”.
    The sectors where CTU unions want to achieve the first Fair Pay Agreements are supermarkets,
    security, and cleaning. This commentary looks at the Retail sector.
    The minimum hourly pay for a 21 year old shop assistant with six months’ experience in 1981,
    set under a form of industry collective bargaining (Awards), would have been $4.71 an hour,
    worth $18.62 today. Pay for an entry level supermarket salesperson aged at least 21 would have
    been $4.13 an hour in 1980, $18.89 in today’s terms. Both are well above what many retail
    workers in similar roles would be receiving today: the minimum wage or a few cents above it. It
    is above the current national average rate for entry level sales across all parts of the retail
    sector, which is $18.22 according to Retail NZ.
    One reason for poor increases in earnings was the Employment Contracts Act 1991 which
    abolished Awards and industry collective bargaining, allowing employers to take advantage of
    their increased power to make big cuts in retail wages, allowances, pay progression, overtime
    pay, and conditions. Research by former CTU Economist Peter Conway showed income losses for
    supermarket workers as big as 44 percent over 8 years.
    In real terms, the average Retail hourly wage peaked in 1982 and did not get back to that level
    until 2015: 33 years later. It fell sharply in a 1982-1984 wage freeze and kept falling until 1995.
    Even with a relatively steep rise from 2014, it is still only 9.8 percent above its 1982 level.
    The share of income generated in the Retail sector that its employees receive has fallen steeply
    since 2009, amid rising profits. There has been strong labour productivity growth which Retail
    wage earners have not fully shared in. Productivity grew by 104 percent (more than doubled)
    between 1978 and 2018, but the buying power of wages rose only 20 percent. Even from an
    employers’ viewpoint of wages adjusted in terms of their firms’ revenue, between 1978 and
    2017 average wages rose only 41 percent, compared to a 97 percent rise in labour productivity.
    There is a large gap between wages, workers’ living standards, and what employers can afford.
    As BERL, the OECD and many European countries have found, industry collective bargaining such
    as through Fair Pay Agreements must be a major part of a fairer and more productive future.

1                                                                 CTU Monthly Economic Bulletin – June 2019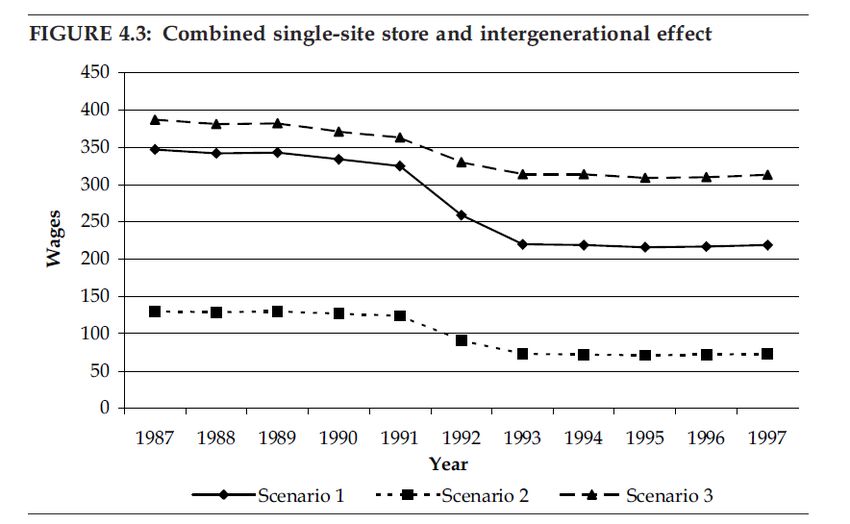
Last Tuesday the CTU launched a report by economist Dr Ganesh Nana (Nana, 2019) on the evidence as to
the impacts of industry (or sector) collective bargaining. We commissioned the study to promote Fair Pay
Agreements which are a form of industry bargaining. They were recommended by a Government working
group chaired by former National Party Prime Minister Jim Bolger with CTU, business and academic
representation. The Government is currently considering its recommendations.

Fair Pay Agreements aim to form a floor of wages and conditions for an industry, and a way to advance
industry training. They are a form of industry collective bargaining which is common in Europe, and BERL’s
report looked at the evidence as to how it worked. Dr Nana was impressed that the OECD has done an
about-turn on sector collective bargaining and now favours forms that are similar to what is proposed
(see for example OECD, 2018b, 2018a).

BERL and the OECD found that this form of bargaining is good for employment, helps to close the gap
between productivity growth and wage increases, reduces inequality, and has other non-wage benefits
such as “job security, working time regulation, quality of working environment, and provision and access
to training”. While it does not threaten productivity growth, BERL says that “by limiting competition on
wages and working conditions, a focus (and investment) on quality and innovation-based economic
activities may be fostered”. To me, that suggests that it encourages productivity growth. You can read
more about the proposed Fair Pay Agreements and the BERL report on our website 1.

At the launch, the CTU announced, together with E tū and First Union, that the sectors where we want to
achieve the first Fair Pay Agreements are supermarkets, security, and cleaning.
I gave some examples of New Zealand’s poor wage growth in these sectors 2:
       The minimum hourly pay for a 21 year old shop assistant with six months’ experience in
       1981 would have been $4.71 an hour, worth $18.62 today. Greg Harford, Retail NZ’s
       interim Chief Executive, gave evidence in an Employment Relations Authority case 3,
       whose decision was released just yesterday, that “the current national average rate for
       entry level sales across all parts of the retail sector is $18.22”, 40 cents less than that
       1981 rate. In addition, the 1981 shop assistant would have received transport
       allowances, overtime rates, time and a half for working late nights, double time on
       Saturdays, and triple time on Sundays.
       A security guard with three years’ experience, doing mobile patrols on night shifts, would
       have been paid a minimum of $5.03 an hour in 1981, worth $19.88 in today’s terms. In
       addition, they would have received overtime rates, time and a half on Saturdays, and
       double time on Saturday nights and Sundays.
       In 1981, a cleaner with five years experience working night shifts would have been paid
       $4.37 an hour, equivalent to $17.27 in today’s terms. When you take into account that
       the cleaner in 1981 would also have received time and a half for overtime and work on
       Saturday mornings, double time for Saturday afternoons and Sundays, plus allowances
       for transport and clothing, cleaners today are no better off than they were nearly 40
       years ago.
       In 2019, all these workers could legally be paid the minimum wage of $17.70 an hour.
       There are cleaners, retail workers and security guards working today with no opportunity

1
  See http://www.union.org.nz/fpas-will-make-working-life-better/
2
  I’d like to acknowledge the research carried out by my CTU colleague Nick Henry for this.
3
  First Union vs Jacks Hardware and Timber Ltd, NZERA 374, 2019.

2                                                                              CTU Monthly Economic Bulletin – June 2019
for progression above the minimum wage. With no opportunity to develop their skills
through training, or to have their skills and experience recognised in their pay.
These working people are worse off today in real terms than they would have been forty
years ago. And yet, in that time, New Zealand has become a much richer country. Many
working people who make that growth possible just have not shared in that growth.
In this commentary I look further at how wages have developed (or stagnated) in the retail sector.
The Retail Sector
The Retail sector is one of the lowest paid sectors in New Zealand. For example, the average hourly
ordinary time wage in retail was $22.69 in March 2019 according to the Quarterly Employment Survey,
higher only than Accommodation and Food Services ($20.59). The annual income survey that is carried
out with the Household Labour Force Survey shows wages only for those two sectors combined, but their
median (midpoint) hourly wage was $18.15 in June 2018, just $1.65 above the then minimum wage of
$16.50. It is no surprise that Retail has the second highest concentration of minimum wage workers after
Accommodation and Food Services. The MBIE officials’ paper for the 2018 Minimum Wage review
(Ministry of Business, Innovation and Employment, 2018) showed 9.1 percent of Retail workers (17,900)
were on the minimum wage Rises in the minimum wage therefore benefit workers in Retail more than
most sectors.
It has always been one of the lowest paying industries, but the historical comparison shows that for many
retail workers, the purchasing power of their wage (their real wage) is as low or lower than it was in the
1980s. That is despite official statistics showing show that the retail industry’s labour productivity has
more than doubled over that period.
I gave the example of the shop assistant Labour productivity more than doubled in
Retail Trade from the 1980s to 2018
above. Another example is in supermarkets. Labour productivity index, 1978=1000.
An entry level (“Grade 1”) salesperson aged Source: Statistics NZ, Infoshare series PRD014AA
21 or over in a supermarket would have 2500
received $4.13 an hour as from December 2000
1980 when a 1981 Retail Grocery and
1500
Supermarkets Award, a form of industry
1000
collective agreement negotiated between
unions and employers, took effect. That is 500
worth $18.89 per hour in today’s terms 0
(March 2019), and above the $18.22 stated
by Retail NZ’s Greg Harford, as the current
national average rate for entry level sales across all parts of the retail sector. In June 2018 its value (then
$18.69) would have been above the median of $18.15 for Retail, Accommodation and Food Services. It is
certainly above the minimum wage that many entry level grocery and supermarket workers are receiving.
In 1981, a supermarket worker would have received additional pay if they had School Certificate (the then
standard Year 11 qualification), and more if they had passed the University Entrance qualification. There
were automatic increments after each year with the same employer, up to five years. The worker would
be promoted to Grade 2 or Grade 3 after 12 months if engaged in duties such as cooking food in a
delicatessen, preparing produce in a fruit and vege department, or buying or demonstrating goods for
3 CTU Monthly Economic Bulletin – June 2019sale. Overtime pay was time and a half for the first three hours worked and then double time. Saturday,
Sunday or statutory holiday work was in general double time with a minimum of three hours paid.
The effect of the Employment Contracts Act 1991
These penal rates and other allowances were a big part of workers’ incomes so the hourly rate was only
one factor. For example weekends are worked much more often now than in the 1980s and the loss of
penal rates has made a major difference to what retail workers receive for working at those times.
When the Employment Contracts Act took effect in 1991, abolishing the award system, employers took
advantage of the unprecedented deregulation of employment relationships to resist any kind of collective
agreement, and refusing to negotiate industry agreements to replace the awards. Union and collective
agreement membership plummeted under employer pressure. Members of the collective agreements
that survived in the Retail sector were forced to make concession after concession on their working
conditions including overtime rates, hours of work, allowances and recognition of experience or
qualifications.
My predecessor as CTU Economist, Peter Conway, was then working for the main retail union, the
National Distribution Union (now part of FIRST Union). He experienced first-hand how income and
conditions were stripped away from already low paid workers by employers making full use of their now
unbalanced power which was amplified by high unemployment (over 10 percent). This began a downward
spiral where even employers willing to maintain their employees’ pay and conditions found it difficult to
survive against those which forced them down. Peter researched the effect of the Employment Contracts
Act on supermarket workers for a Masters degree (Conway, 1998, 1999).
Peter compared three typical working patterns of people in the supermarket workforce between 1987
(before the Employment Contracts Act) and 1997:
Scenario 1 (part-time adult) is an adult checkout operator aged over 21 years working
28 hours per week including one evening until 7.00 pm and one weekend day.
Scenario 2 (student) is a 16-year-old student checkout operator working 14 hours a
week including two evenings and one weekend day.
Scenario 3 (full-time adult) is an adult checkout operator aged over 21 years working 40
hours a week Monday to Friday with no evenings.
He found three effects that were reducing wages. Firstly, wages were falling in real terms, continuing the
steep fall from 1982 due to high
inflation and a wage freeze imposed
by National Party Prime Minister
Robert Muldoon between 1982 and
1984. A Grade 1 supermarket worker
who would have received $4.13 in
December 1980, worth $18.89 per
hour in today’s terms, would have
received $6.50 in 1987, worth just
$13.16 – already a large fall. By 1991
that wage was $7.71 or $13.14 in
today’s terms.
4 CTU Monthly Economic Bulletin – June 2019Secondly, when workers could not defend their pay and conditions, their fall-back was to “grandparent”
their existing conditions, but new employees would be employed under inferior terms (which he called
the “intergenerational” effect). So real incomes fell as new staff were employed. With a high turnover of
staff, this had a big effect.
Thirdly, the single-site stores cut pay and conditions more rapidly than the chain-stores.
The combined effect of this is shown in the figure on the previous page (from Conway, 1999, p. 41).
Scenario 1 (part time adult workers) lost 30.1 percent in real wages between 1989 and 1997. Scenario 2
(part-time student workers) lost 44.1 percent over the period. Scenario 3 (full time adult workers) lost
11.2 percent. These are substantial losses in income.
During the 1990s, lower paid workers in general made up for reduced pay rates by working longer hours
(Stillman, Le, Gibson, Hyslop, & Maré, 2012). From the short-sighted viewpoint of many employers at the
time, this was an ideal outcome: lower pay rates and more plentiful supply of desperate workers.
Average wages since 1978
Clearly, average or even median hourly wages don’t tell the whole story about how earnings have
changed in Retail over the last four decades. Particular roles and wage levels, and the changes in worker’s
whole pay packages matter, not just hourly rates. However there is still a story to be told from average
hourly wage rates. The next
figure to the right shows the Real average hourly wage in Retail, including overtime
average hourly wage rate for March 2019 dollars
Source: 1978-1988, Dept of Labour half-yearly surveys; from 1989: Quarterly
Retail, including overtime, Employment Survey, Stats NZ, Infoshare series QEX001AA, deflated by CPI.
adjusted by the cost of living March 2019$
(the Consumer Price Index, CPI). $23.00
The real wage peaked in 1982 $22.00
and did not return to that level
$21.00
until 2015: 33 years later. It fell
sharply with the 1982-1984 $20.00
wage freeze and kept on falling $19.00
until 1995. Even with a relatively
$18.00
steep rise in its real value from
about 2014, it is still only 9.8 $17.00
1978
1980
1982
1984
1986
1988
1990
1992
1994
1996
1998
2000
2002
2004
2006
2008
2010
2012
2014
2016
2018
percent above its 1982 level in
real terms. March years
While the recent rise in real Note: pre-1989 coverage of Retail may differ somewhat from post-1989. Data points
pre-1989 are marked. 1978 and 1979 values are for the previous Octover, others for
wage rates is positive, and
comes at a time of successful union organising in important parts of the sector, it is at time when Retail
employers have had strongly rising profits. Retail wages and salaries as a proportion of total income in the
sector has fallen since 2009. The first figure on the next page charts the income share going to wages and
salaries (the labour income share) in the Retail industry from 1972. It shows how the labour income share
fell in the 1980s, rose between 1984 and 1992, before falling again. After a rise during the late 1990s
recession it fell sharply until 2003 when it began a steep rise until 2009. Since then, the share has again
fallen to a level similar to the 1990s.
5 CTU Monthly Economic Bulletin – June 2019This reflects a failure to fully share
Labour's share of income in Retail Trade, 1972-2017
the strong productivity growth in Source: National Accounts, Stats NZ, Infoshare series SNE089AA
the sector with wage-earners. 70%
Labour productivity grew by 104
percent (more than doubled)
between 1978 and 2018, and of 65%
that, 90 percent has occurred since
1999. Clearly, the buying power of 60%
Retail workers’ wages did not
increase by 104 percent over that
time – it grew only 20 percent from 55%
1978 to 2018.
We can look at it from the Retail 50% 1972
1975
1978
1981
1984
1987
1990
1993
1996
1999
2002
2005
2008
2011
2014
2017
employers’ viewpoint and rather
than adjust wages by the cost of
living, adjust them by the revenue employers received, reflecting their margins on sales. 1 This adjusted
wage is called the ‘real product wage’. Real product wages rose only 41 percent from 1978 to 2017,
compared to a 97 percent rise in labour productivity over that period. Despite steady rises in the real
product wage between 1999 and 2017, totalling 41 percent, productivity rose almost twice that – 79
percent. There is a large gap between wages and what employers can afford.
The bigger picture
Labour’s share of income in the New Zealand's labour income share compared
wider economy tells another Sources: AMECO database, author's calculations, SNZ.
story that is worth bearing in 65.0%
mind when thinking about the
low wages New Zealand working 62.5%
people receive, not only in the
Retail sector. 60.0%
The final figure compares labour’s 57.5%
income share in the whole
economy to the OECD median, 55.0%
and those of Denmark and
52.5%
Australia. None of these fell as
sharply as New Zealand’s in the
50.0%
1980s, though all had faced Denmark
similar impacts of a series of ‘oil OECD Median
47.5%
New Zealand
shocks’ resulting from war in the Australia
Middle East. Oil shortages and 45.0%
1960
1963
1966
1969
1972
1975
1978
1981
1984
1987
1990
1993
1996
1999
2002
2005
2008
2011
2014
2017
rocketing oil prices contributed to
1
This uses the GDP deflator for the Retail Trade sector, calculated by dividing the income in the sector by its contribution to GDP.
6 CTU Monthly Economic Bulletin – June 2019high inflation. Australia’s labour share followed the OECD median and though it fell (and has had a sharp
fall under recent Australian Government policies) the change was much more gradual. They put in place
better wage systems than New Zealand, including maintaining a system of industry collective agreements
which remain even today (though in weakened form) in the Modern Award system which underpins most
Australian wages and salaries. Even more remarkable was Denmark, whose labour income share did not
fall and in fact is on a rising trend. They had the same choice: to cut real wages or to move to a higher
skill, higher value, higher wage economy. They made a deliberate decision to do the latter: employers
wanted to retain the skills of their workers. They moved away from commodity agricultural production to
the advanced economy Denmark has now. It was based on strong institutions of ‘social partnership’
between unions, employer organisations and government. In 2013, two thirds (67 percent) of its wage
and salary earners were union members, and 84 percent were covered by industry collective agreements
which set the basis for any enterprise bargaining that occurs.
New Zealand needs to make similar choices if it wishes to get out of its low wage rut and make the best of
the changes that will occur with advancing technology, climate change and globalisation. As BERL, the
OECD and many countries in northern Europe have found, industry level bargaining, such as through Fair
Pay Agreements, must be a major part of that future.
Bill Rosenberg
References
Conway, P. (1998). Wage bargaining theory, decentralisation, the Employment Contracts Act, and the
supermarket sector (Master of Arts in Economics, Massey University). Retrieved from
http://hdl.handle.net/10179/6452
Conway, P. (1999). An ‘unlucky generation’? The wages of supermarket workers post-ECA. Labour Market
Bulletin, 23–50. Retrieved from http://www.dol.govt.nz/PDFs/lb1999b.pdf
Ministry of Business, Innovation and Employment. (2018). Minimum Wage Review 2018. Retrieved from
Ministry of Business, Innovation and Employment website:
https://www.mbie.govt.nz/assets/630c3ec66c/minimum-wage-review-2018.pdf
Nana, G. (2019). Sector wage bargaining – a literature review. Retrieved from Business and Economic
Research Limited website: http://www.union.org.nz/wp-content/uploads/2019/06/Sector-wage-
bargaining-Pipiri-2019.pdf
OECD (Ed.). (2018a). Good jobs for all in a changing world of work: The OECD jobs strategy. Retrieved from
https://doi.org/10.1787/9789264308817-en
OECD. (2018b). OECD Employment Outlook 2018. https://doi.org/10.1787/empl_outlook-2018-en
Stillman, S., Le, T., Gibson, J., Hyslop, D., & Maré, D. C. (2012). The Relationship between Individual Labour
Market Outcomes, Household Income and Expenditure, and Inequality and Poverty in New
Zealand from 1983 to 2003 (Working Paper No. 12–02; p. 78). Retrieved from Motu Economic and
Public Policy Research website: https://motu.nz/our-work/population-and-labour/firm-
performance-and-labour-dynamics/the-relationship-between-individual-labour-market-
outcomes-household-income-and-expenditure-and-inequality-and-poverty-in-new-zealand-from-
1983-to-2003/
7 CTU Monthly Economic Bulletin – June 2019Information
Forecast ....................................................................................................................................................... 8
Economy...................................................................................................................................................... 8
Employment .............................................................................................................................................. 13
Wages and prices ...................................................................................................................................... 19
Public Sector ............................................................................................................................................. 22
Notes ......................................................................................................................................................... 23
A indicates information that has been updated since the last bulletin.
Thanks to Nick Henry who assisted in updating this section.
Forecast
This NZIER consensus forecast was released on 17 June 2019.
Annual Percentage Change (March Year) 2019/20 2020/21 2021/22
GDP 2.5 2.9 2.6
CPI 2.0 1.9 2.0
Private Sector average hourly wage 3.4 3.2 3.2
Employment 1.7 1.6 1.5
Unemployment rate (% of labour force) 4.2 4.1 4.0
Economy
1.5 4.5
1.0 3.0
0.5 1.5
Percentage Change
Percentage of GDP
0.0 0.0
-0.5 -1.5
-1.0 -3.0
-1.5 -4.5
Mar-15
Dec-14 Mar-16
Dec-15 Mar-17
Dec-16 Mar-18
Dec-17 Mar-19
Dec-18
Quarterly Percentage Change in GDP Current Account Deficit as a % of GDP
Growth in New Zealand’s measured economy in the three months to March 2019 was moderate,
with Gross Domestic Product rising by 0.6 percent, the same as the 0.6 percent in the previous
8 CTU Monthly Economic Bulletin – June 2019quarter, and up from 0.4 percent in the June quarter. Average growth for the year ended March 2019
was 2.5 percent (and 2.7 percent compared to the same quarter last year). Growth in GDP per person
continues to be weak with a rapidly growing population: GDP growth per person was just 0.1 percent
in the March quarter seasonally adjusted, down from a 0.2 percent increase in the December
quarter, but up 0.9 percent over the previous year. GDP per person has been increasing at far below
the rate in the 2000s when GDP per person was increasing at an average 2.4 percent a year. Since
2011 it has averaged 1.5 percent per year. Real gross national disposable income per capita, which
takes into account the income that goes to overseas investors, transfers (such as insurance claims)
and the change in prices for our exports and imports, rose 0.1 percent over the quarter and rose 0.6
percent over the year.
I estimate that labour productivity, measured by production per hour worked in the economy,
stayed almost still, growing 0.1 percent in the year to March compared to the same period a year
ago, continuing weak labour productivity growth which is bad for future wage growth. It fell 4.2
percent in the quarter, seasonally adjusted.
Business investment rose by 1.9 percent compared to the previous quarter, with a 8.0 percent fall in
investment in Transport equipment and a 6.4 percent fall in Other Construction investment offset by
strong rises in Non-residential buildings (up 9.9 percent). Investment in Land improvements fell 1.0
percent, in Intangible fixed assets fell 0.5 percent and Plant, and in Machinery and equipment fell 0.6
percent. Investment in Residential buildings was up 2.7 percent. All investment spending tends to be
very variable from quarter to quarter, and can be significantly affected by a single large purchase
such as an aircraft, so single quarter changes do not necessarily indicate trends. Comparing the year
to March with the previous full year, growth in total investment including housing (Gross Fixed
Capital Formation) was 2.5 percent but Business investment grew only 2.1 percent, down from 6.4
percent the previous year, driven by Non-residential buildings (up 7.2 percent), Plant, machinery, and
equipment (up 2.6 percent) and Intangible fixed assets (up 2.3 percent) offset by falls in Other
construction (down 3.9 percent) and Land improvements (down 1.1 percent) while investment in
Transport equipment was unchanged. Residential buildings investment was up 3.5 percent.
Household consumption expenditure grew 0.5 percent in the March quarter in real terms, after a 1.0
percent increase in December and increases of around 1.0 percent in quarters before that apart from
a 0.3 percent increase in the March 2018 quarter. Purchases of durable goods (like electrical
equipment and furniture) rose 1.4 percent, of non-durable goods (like food and groceries) rose 0.4
percent, and of services rose 0.3 percent. It rose a strong 3.5 percent over the same quarter in the
previous year and 3.3 percent comparing the full year to March with the previous year when growth
in spending was led by a 3.7 percent increase in purchases of services, followed by a 3.6 percent
increase in durable goods purchases and 2.1 percent increase in no-durable goods.
Inflation in the economy as a whole, shown by the GDP deflator (a price index for expenditure on the
economy’s production, largely reflecting the revenue employers are getting for their products) rose
1.4 percent compared to the same quarter the previous year, and rose 0.4 percent in the most recent
quarter.
By industry, the largest contributors to growth in the latest quarter were Construction (up 3.7
percent), Mining (up 9.6 percent), Manufacturing (up 1.4 percent), Health care and social assistance
(up 1.7 percent) and Transport, postal and warehousing (up 1.2 percent). The largest fall in activity
9 CTU Monthly Economic Bulletin – June 2019was in Agriculture, forestry, and fishing (down 2.3 percent). There were also contractions in
Information media and telecommunications (down 0.6 percent), Retail trade and accommodation
(down 0.5 percent) and Rental, hiring, and real estate services (down 0.2 percent). Year-on-year, the
biggest rises were in Transport, postal and warehousing (up 5.1 percent), Public administration and
safety (up 4.5 percent), Wholesale trade (up 3.7 percent), Retail trade and accommodation (up 3.5
percent), Health and Social assistance (up 3.4 percent), Financial and insurance services (up 3.3
percent) and Agriculture, forestry and fishing (up 3.2 percent); only Mining contracted (down 5.9
percent).
New Zealand recorded a Current Account deficit of $2.6 billion in seasonally adjusted terms for the
March 2019 quarter, following a $2.7 billion deficit for the previous quarter. There was a deficit in
goods trade ($1.1 billion, seasonally adjusted) following a $1.15 billion deficit in the previous quarter,
with deficits in all quarters back to September 2014. There was a seasonally adjusted deficit of $87
million in goods and services (up from the $60 million deficit in the previous quarter) including a $1.0
billion surplus in services, while the deficit on primary income (mainly payments to overseas
investors) was down a little to $2.4 billion from $2.6 billion (seasonal adjustment not available). For
the year to March 2019, the current account deficit was $10.6 billion or 3.6 percent of GDP, down
from the $11.2 billion deficit in the year to December (3.8 percent of GDP). The deficit on investment
income was $10.2 billion for the year.
The country’s Net International Liabilities were $164.4 billion at the end of March 2019, down from
$168.4 billion at the end of the previous quarter but significantly up from $156.2 billion a year
before. The March liabilities were equivalent to 55.5 percent of GDP, down from the previous
quarter (57.4 percent) and up from 54.8 percent a year before. Gross international liabilities were
equivalent to 146.4 percent of GDP, compared to 145.9 percent in the previous quarter and 143.1
percent a year before. Net international liabilities would take 1.96 years of goods and services
exports to pay off, down from 1.99 years a year before. However, gross liabilities at $433.6 billion
would take 5.17 years of goods and services exports to pay off. The fall in net liabilities over the
quarter was mainly due to rises in the net valuation of net financial derivatives which rose $3.2
billion. Without the valuation changes, the net liabilities would have been $169.1 billion. New
Zealand’s international debt was $295.7 billion (other than shares; equivalent to 99.8 percent of
GDP), of which 30.2 percent is due within 12 months, compared to $145.4 billion in financial assets
(49.1 percent of GDP), leaving a net debt of $150.2 billion (50.7 percent of GDP). Of the net debt,
$3.6 billion was owed by the government including the Reserve Bank, and $119.1 billion by the banks
(40.2 percent of GDP), which owed $163.5 billion gross.
In international trade in services, exports amounted to $25.2 billion in the year to March 2019, of
which over half ($16.0 billion) was Travel and another $3.3 billion was Transportation. Services
imports were valued at $20.7 billion, leaving a surplus on services of $4.5 billion for the year. The
largest areas of imported services were $4.9 billion in Transportation, $6.7 billion in Travel, $1.6
billion in Insurance and pension services, $0.5 billion in Financial Services, $1.3 billion in Charges for
the use of intellectual property (such as franchises, trademark licensing and royalties), $1.3 billion in
Telecommunication, computer, and information services (mainly computer services), and $3.5 billion
in a variety of Other business services.
10 CTU Monthly Economic Bulletin – June 2019 Overseas Merchandise Trade for the month of May 2019 saw exports of goods rise in value by 8.5
percent from the same month last year while imports rose 7.6 percent. This contributed to a trade
surplus for the month of $264 million or 4.5 percent of exports. There was a trade deficit for the year
of $5.5 billion or 9.2 percent of exports. In seasonally adjusted terms, exports rose 4.2 percent or
$209 million over the month (after an 8.3 percent fall the previous month) with the increase led by
Logs and Wood (up 8.1 percent or $36 million), Dairy Products (up 2.3 percent or $31 million), Wine
(up 6.2 percent or $10 million) and Seafood (up 3.1 percent or $5 million), offset by decreases in Fruit
(down 7.7 percent or $23 million), Meat (down 2.0 percent or $13 million), Crude Oil (down 38.1
percent or $35 million, not seasonally adjusted) and Aluminium (down 4.1 percent or $5 million, not
seasonally adjusted). Seasonally adjusted imports rose 1.4 percent or $74 million on the previous
month, leaving a trade deficit of $249 million following a $384 million deficit in the previous month.
The increase in imports was led by Petroleum (up 18.4 percent or $112 million, not seasonally
adjusted), Mechanical machinery and equipment (up 12.3 percent or $84 million, not seasonally
adjusted) and Optical, Medical and Measuring Equipment (up 6.9 percent or $11 million) offset by
Electrical machinery and equipment (down 10.7 percent or $50 million) and Plastics (down 7.7
percent or $17 million). In the year to May, 25.9 percent of New Zealand’s exports went to China,
15.1 percent to Australia, 9.6 percent to the US, and 62.3 percent went to the top six countries
buying New Zealand exports. This compares with 22.8 percent going to China in the previous year,
and 60.2 percent going to the top six destinations. Over the same period, 20.0 percent of New
Zealand’s imports came from China (compared to 19.1 percent in the previous year), 11.4 percent
from Australia, 9.9 percent from the US, and 58.4 percent from the top six countries selling to New
Zealand, compared to 57.2 percent a year before. There were trade surpluses with China ($2.43
billion) and Australia ($1.55 billion) but deficits with most other major trading partners.
The Retail Trade Survey for the three months to March 2019 showed retail sales rose 3.3 percent by
volume and 3.7 percent by value compared with the same quarter a year ago. They rose 0.7 percent
by volume and 0.2 percent by value in the quarter, seasonally adjusted. The fastest rises by
seasonally adjusted value over the quarter were in Non-store and commission-based retailing (which
includes online sales - up 7.0 percent), Furniture, floor coverings, houseware, textiles (up 3.1
percent), Department Stores (up 2.9 percent), Liquor (up 2.8 percent), Hardware, building, and
garden supplies (up 2.8 percent), Specialised Food (up 2.4 percent), and Recreational Goods (up 2.3
percent), offset by decreases in Pharmaceutical and other store-based retailing (down 8.5 percent),
Fuel (down 2.8 percent), Electrical and electronic goods (down 2.2 percent), and Accommodation
(down 1.1 percent). By far the largest category, Supermarket and grocery stores, rose 1.1 percent.
The Performance of Manufacturing Index for May 2019 was 50.2, down from 52.7 For these indexes, a
figure under 50
in the previous month. The employment sub-index was at 48.6, down from 51.4 indicates falling
in the previous month. activity, above 50
indicates growing
activity. Previous
The Performance of Services Index for April 2019 was 53.6, up from 52.0 the figures are often
previous month. The employment sub-index was 50.6, up from 48.4 the previous revised and may
differ from those in
month. a previous Bulletin.
On 26 June 2019, the Reserve Bank kept the Official Cash Rate (OCR) unchanged
at 1.5 percent, maintaining the record low level set in May 2019. The 26 June release indicated that
further lowering of the OCR may be needed in future to respond to “a weaker global economic
11 CTU Monthly Economic Bulletin – June 2019outlook and risk of ongoing subdued domestic growth”. The Reserve Bank noted slowing domestic
growth, with strong growth in construction offset by slowing growth in service industries. “Softer
house prices and subdued business sentiment continue to dampen domestic spending” but “We
expect low interest rates and increased government spending to support a lift in economic growth
and employment.” The meeting of the Monetary Policy Committee repeated its previous opinion
that “employment is broadly at its maximum sustainable level”, but also noted that “subdued wage
growth” is not responding to “capacity pressure in the labour market”: “The members discussed the
subdued nominal wage growth in the private sector and the apparent disconnect from indicators of
capacity pressure in the labour market. The Committee discussed the possibility of this relationship
re-establishing. Conversely, the continuing absence of wage pressure could indicate that there is still
spare capacity in the labour market. Some members also noted that reduced migrant inflows could
see wage pressure increase in some sectors.” The next OCR announcement is on 7 August and will
include a Monetary Policy Statement.
According to REINZ, over the year to May the national median house price rose $18,000 or 3.2
percent to $578,000 and REINZ’s house price index rose 1.8 percent. (The house price index adjusts
for the type of house, such as its size and land area, and seasonal price patterns.) Over the month,
the median price fell 0.5 percent seasonally adjusted while the house price index rose 0.2 percent. In
Auckland over the year the median price was up 1.2 percent to $860,000 while the house price index
fell 3.3 percent. Over the month, Auckland’s median price was up 0.9 percent seasonally adjusted,
and the house price index rose 0.5% percent. Excluding Auckland, over the year the national median
price rose $33,000 to $488,000 or 7.2 percent while the house price index rose 6.5 percent. Over the
month the median price excluding Auckland was up 1.0 percent seasonally adjusted, and the house
price index was unchanged. There was a record median price in Gisborne (up 54.4 percent over the
year to $440,000). Median prices rose over the year in 11 of REINZ’s 14 regions, with the fastest rise
after Gisborne being in Southland (up 16.7 percent to $280,000). The biggest fall in median prices
over the year was in the West Coast (down 14.0 percent to $185,000) with Northland the only other
fall, down 1.9 percent to $465,000. Seasonally adjusted median prices also fell over the month in 8 of
14 regions, with the steepest falls in West Coast (down 11.4 percent), Southland (down 6.2 percent)
and Northland (down 5.9 percent), while prices rose over the month by the highest rate in Gisborne
(up 17.8 percent) followed by Otago (up 4.2 percent). Sales rose in 11 of the 14 regions over the
month, seasonally adjusted, while over the year, sales fell in 6 of the regions, with a national fall of
7.8 percent and falls of 21.8 percent in Auckland and 32.3 percent on the West Coast.
12 CTU Monthly Economic Bulletin – June 2019Employment
5.8 17,000
Net number of People arriving
5.3 15,500
Percentage Unemployed
4.8 14,000
4.3 12,500
3.8 11,000
Mar-16 Mar-17 Mar-18 Mar-19
Unemployment Estimated net quarterly migration
The December 2018 Household Labour Force Survey, from which the employment
statistics below are derived, was affected by adjustments that make many of the
changes in this quarter “unrealistic” according to Statistics New Zealand. The
adjustments were due to additional questions asked with for the 2018 Survey of
Working Life (last run in 2012). Statistics New Zealand advises as follows:
Some seasonally adjusted employed and “Not In the Labour Force” (NILF)
series … (eg the number of people employed, broken down by age;
underemployment; and youth not in employment, education, and training
series)… may show unrealistic movements this quarter. We recommend
users exercise caution when considering the latest data and focus on
longer-term trends. In addition, all actual employed and NILF series,
including all age, ethnicity, industry, occupation, and regional breakdowns,
should be used with caution.
For further details see https://www.stats.govt.nz/information-releases/labour-
market-statistics-december-2018-quarter which also provides a link to a full list
of affected series in HLFS data collection in DataInfo+.
The change to migration collection methods which has led to significant
differences in estimates of permanent and long term migration (see below) are
not yet reflected in these employment statistics. It is expected to be a year
before they will be, and at that time may lead to further revisions.
According to the Household Labour Force Survey (HLFS) the seasonally adjusted unemployment rate
in the March 2019 quarter fell to 4.2 percent or 116,000 people, compared to 4.3 percent three
months before (120,000 people). If it were the 3.3 percent it was in December 2007, 24,000 more
13 CTU Monthly Economic Bulletin – June 2019people would have jobs. The seasonally adjusted female unemployment rate rose to 4.5 percent
from 4.2 percent three months before, higher than for men (3.9 percent) whose unemployment rate
fell from 4.4 percent. Māori unemployment fell from 9.6 percent a year before to 8.6 percent in
March 2019, while Pacific people’s unemployment rose from 8.3 percent to 9.0 percent over the
year. Compared to OECD unemployment rates, New Zealand remained at 14th equal lowest (out of 35
countries). New Zealand’s employment rate for 15-64 year olds fell from 3rd to 6th highest for the
OECD at 77.4 percent.
Youth unemployment for 15-19 year olds was 20.5 percent in March 2019, down from 22.4 percent
three months before, and from 19.0 percent a year before. (These and the other statistics for the
whole youth population are seasonally adjusted, but those for Māori and for Pacific Peoples are not;
small differences may not be statistically significant. Take particular note of the warning in the box
above.) For Māori 15-19 year olds in March 2019, the unemployment rate was 25.3 percent, down
from 25.7 percent a year before. For 15-19 year old Pacific Peoples it was 30.3 percent, up from 16.9
percent a year before. For 20-24 year olds, youth unemployment was 7.9 percent, down from 8.2
percent three months before, and down from 8.2 percent a year before. For Māori 20-24 year olds
the unemployment rate was 11.5 percent, down from 12.9 percent a year before. For 20-24 year old
Pacific Peoples it was 10.8 percent, down from 14.2 percent a year before. The proportion of 15-19
year olds “not in employment, education, or training” (the NEET rate) was 10.1 percent, down from
11.3 percent three months before and up from 9.8 percent a year before. For Māori 15-19 year olds
the rate was 15.9 percent, down from 16.4 percent a year before and for Pacific Peoples it was 13.4
percent, down from 14.1 percent a year before. For 20-24 year olds the NEET rate was 16.0 percent,
down from 16.4 percent three months before and up from 14.8 percent a year before. For Māori 20-
24 year olds the NEET rate was 26.7 percent, down from 26.8 percent a year before, and for Pacific
Peoples it was 23.6 percent, down from 24.7 percent a year before. For the whole 15-24 year old
group, unemployment was higher for those in education (14.6 percent) than those not in education
(11.1 percent). There were 88,000 people aged 15-24 years who were not in employment, education,
or training (NEET), seasonally adjusted, down from 94,000 three months before, and up from 84,000
a year before.
By region, in March 2019, in the North Island, Northland had the worst regional unemployment rate
at 7.1 percent, up from 5.8 percent a year before, and Manawatu/Wanganui was next at 6.5 percent
unemployment compared to 6.4 percent a year before. All other North Island regions had
unemployment rates at or under 5.5 percent, with Wellington the lowest at 3.7 percent (down from
4.8 percent a year before) and all but Northland, Manawatu/Wanganui, Gisborne (5.4 percent up
from 5.1 percent) and Taranaki (5.5 up from 5.1) with lower rates than a year before. All South Island
regions had unemployment at or below 4 percent with average unemployment among the South
Island regions being 3.5 percent compared to 5.2 percent in the North Island. In
Tasman/Nelson/Marlborough/ West Coast unemployment was 3.3 percent, down from 3.6 percent a
year before, in Canterbury it was 4.0 percent, up from 3.5 percent a year before, in Otago it was 3.3
percent, down from 4.7 percent a year before, and in Southland 3.4 percent, up from 2.9 percent a
year before.
There were 33,700 unemployed people in December 2018 who had been out of work for more than
6 months compared to 35,800 a year before. This is 27.4 percent of the unemployed compared to
28.1 percent a year before, but is still at a much higher level than the mid-2000s. Those out of work
for more than a year are 11.1 percent of the unemployed compared to 12.7 percent a year before.
14 CTU Monthly Economic Bulletin – June 2019After rising until 2016, the proportion of long-term unemployed appears to have peaked and is
moving downward.
The unemployed were not the only people looking for work: “underutilisation” includes the officially
unemployed as above, people looking for work who are not immediately available or have not looked
for work sufficiently actively to be classed as officially unemployed, plus people in part time work
who want more hours (“underemployed”). In the March 2019 quarter there were a total of 324,000
people looking for work classed as “underutilised”, or 11.3 percent of the labour force extended to
include these people, in seasonally adjusted terms. Of them, 102,000 were underemployed, 116,000
were officially unemployed, and 106,000 were additional jobless people looking for work. The 11.6
percent underutilisation rate is down on the previous quarter (seasonally adjusted 12.1 percent) and
down from 11.9 percent a year before. It is higher for women at 13.7 percent than for men (9.0
percent).
The number recorded as employed fell by 4,000 over the three months to March 2019 (seasonally
adjusted). It rose by 38,000 over the year. The employment rate fell to 67.5 percent over the three
months from 67.8 percent. It was 62.8 percent for women and 72.3 percent for men. The
participation rate (the proportion of the working age population – those aged 15 years and over –
either in jobs or officially unemployed) was slightly down at 70.4 percent compared to 70.9 percent
three months before.
By industry, the actual increase in employment of 20,600 in the three months to the March 2019
quarter (not seasonally adjusted) was made up of both gains and losses. The largest gains were of
20,600 in Professional, scientific, technical, administrative, and support services, 5,900 in Financial
and insurance services, and 4,200 in Rental, hiring, and real estate services. The largest losses were
5,200 in Education and Training, 3,500 in Transport, postal and warehousing, and 3,000 in Retail
trade, accommodation and food services. Over the year, the biggest contributors to the 38,200
additional jobs were 21,500 in Professional, scientific, technical, administrative, and support services,
6,200 in Health care and social assistance and 6,000 in Financial and insurance services. The largest
losses were 16,500 in Education, 13,900 in Manufacturing, and 5,000 in Construction.
In the March 2019 quarter, total union membership was estimated at 404,500, a 0.7 percent fall
from 407,300 in the previous quarter and down 0.9 percent from 408,200 a year before. The
membership is 18.7 percent of employees compared to 18.8 percent three months before and 19.1
percent a year before. Women make up 58.6 percent of the membership compared to being 49.6
percent of all employees. As a result, the proportion of female employees who are in unions is higher
than for males: 22.0 percent compared to 15.3 percent. The rate of membership for women workers
was up 0.9 percent over the year, compared to a decrease for men of 3.3 percent, with one factor
being the impact of pay equity settlements. The membership changes were not evenly spread across
age groups: the membership of 15-24 year olds fell 6.5 percent in the year but rose 10.5 percent in
the quarter, 25-34 year olds rose 11.1 percent in the year but fell 3.4 percent in the quarter, 35-44
year olds rose 6.3 percent in the year but fell 0.5 percent in the quarter, 45-54 year olds fell 12.1
percent in the year and 1.3 percent in the quarter, 55-64 year olds fell 2.3 percent in the year and 1.6
percent in the quarter, and 65+ year olds rose 0.8 percent in the year and 2.4 percent in the quarter.
Union membership growth mainly came from Public Administration and Safety, which increased
5,300 or 10 percent over the year, and Retail Trade up 2,400 or 14 percent. , Agriculture Forestry and
Fishing shows as more than doubling from 1,900 to 4,700 over the year, but with such small numbers
15 CTU Monthly Economic Bulletin – June 2019it is not yet clear whether this is a real trend or just statistical variation. Education and training fell
5,300 or 6 percent, and Health Care and Social Assistance fell 1,800 or 2 percent while Manufacturing
shows as falling sharply by 10,600 or 22 percent over the year to 39,300, which again is likely to be in
part statistical variation. There was a mixture of rises and falls in other industries, but they are
unlikely to be statistically meaningful. There may be seasonal variations in union membership which
are not yet apparent, so quarterly comparisons may not represent annual trends.
In the March 2019 quarter, total collective employment agreement coverage was estimated at
406,500 employees, which makes 18.7 percent of employees who said their employment agreement
was a collective compared to 19.1 percent three months before and 19.0 percent (406,200) a year
before. An estimated 69.5 percent (1,507,700) said they were on an individual agreement compared
to 69.3 percent three months before and 68.1 percent a year before, and 5.2 percent or 112,300 said
they had no agreement (which is illegal), compared to 5.5 percent three months before and 6.3
percent a year before. A further 6.5 percent of employees didn’t know what kind of employment
agreement they had. Coverage by collective agreement was 15.9 percent for men and 21.6 percent
for women. All age groups except 45-54 year olds and 55-64 year olds rose in membership of
collective agreements over the year, and those age groups plus the over 65s fell during the quarter.
Those aged 15-24 rose 1.3 percent in the year and 0.9 percent in the quarter, 25-34 years rose 12.5
percent in the year and 0.7 percent in the quarter, 35-44 year olds rose 7.7 percent in the year and
1.1 percent in the quarter, 45-54 year olds fell 9.6 percent in the year and 2.6 percent in the quarter,
55-64 year olds fell 6.8 percent in the year and 6.3 percent in the quarter, and members aged 65+
rose 1.3 percent in the year but fell 4.4 percent in the quarter. Over the year, density rose for all age
groups under 45 years, but fell for all age groups over 45. By industry, collective membership grew
over the year by 4,100 or 8 percent in Public Administration and Safety, and by 2,700 or 11 percent in
Retail Services. Education fell 2,800 or 3 percent, Health Care and Social Assistance fell 3,400 or 4
percent, and Manufacturing shows as falling by 8,000 or 17 percent. Other industries had a mix of
increases and decreases (though they are unlikely to be statistically significant).
By employment relationship, in the March 2019 quarter, 91.0 percent of employees (1,973,400)
reported they were permanent, 4.6 percent casual (100,500), 2.4 percent fixed term (51,300), 1.0
percent seasonal (20,800), and 0.4 percent employed through a “temporary agency” (9,100). The
proportion reporting they were permanent was up from 89.7 percent (1,942,200) three months
before and from 90.2 percent (1,930,500) a year before. Women were slightly less likely to be
permanent employees: 90.1 percent of women were permanent compared to 91.9 percent of men.
Instead, women were more likely to be casual (5.3 percent of them compared to 4.0 percent of men)
or fixed term (2.7 percent of women compared to 2.0 percent of men). However more men were in
seasonal work than women – 1.2 percent of men compared to 0.7 percent of women. Of the temp
agency employees, 3,200 were men and 5,900 women. Employment relationships may have seasonal
variations, so we should be cautious about seeing trends in quarterly comparisons. In addition, small
differences may not be statistically significant. However, over the almost three years this data has
been available the number and proportion of fixed term employees measured by this survey has
fallen, starting in June 2016 with 63,600 and in March 2019 down to 51,300 though there was a
sharp upturn in the last quarter of 2018. The number of Temporary Agency employees has increased
in the same period from 6,600 to 9,100, but this has been a bumpy road so it is too early to say there
is a trend.
16 CTU Monthly Economic Bulletin – June 2019 By duration of employment (job tenure), in the March 2019 quarter, 23.4 percent of those in the
labour force (including the self-employed) had been in their jobs for less than a year. Another 33.7
percent had been in their job for at least a year but less than five years, so a majority had been in
their jobs less than five years. A further 16.2 percent had been in their job for at least five but less
than ten years, and 25.1 percent had been in their jobs for 10 years or more. Women appeared to be
somewhat more likely to have been in their jobs for a shorter time than men. For example, 26.8
percent of men had been in their jobs for more than 10 years, but only 23.3 percent of women. Age
is a significant factor as would be expected: 55.6 percent of people aged 15 to 24 had been in their
jobs for less than a year, and 28.8 percent of 25-34 year olds, but only 14.7 percent of 45-54 year
olds and 9.3 percent of 55-64 year olds. Small differences may not be statistically significant.
The Ministry of Social Development reports that at the end of March 2019 there were 131,720
working age people on the Jobseeker benefit, 12,965 more than a year before but 2,328 fewer than
three months before. At that time, 72,185 were classified as ‘Work Ready’, and 59,535 were
classified as ‘Health Condition or Disability’. A total of 286,450 were on ‘main’ benefits, 13,063 more
than a year before, with numbers of all other than those on Jobseeker Support relatively stable: Sole
Parent Support benefits were down just 6, Supported Living Payments were up 30 and Other Main
Benefits were up 74. There were 12,895 fewer on main benefits than three months earlier, mainly
because of the seasonal fall in “Jobseeker Support Student Hardship” benefits, which rose to 8,934 at
the end of December and then fell back to 94 at by the end of March, but also helped by the
reduction in numbers on Jobseeker benefits and 1,046 fewer on Sole Parent Support. Of the 48,354
benefits cancelled during the three months to March, 20,511 or 42.4 percent of the people obtained
work, 11.6 percent transferred to another benefit and 13.6 percent became full time students. A
further 2,517 (5.2 percent) left on their 52 week reapplication or annual review. A total of 10,190
suffered sanctions (down 30.7 percent on a year before), the majority (8,993) on a Jobseeker benefit.
Of the people sanctioned, 47.0 percent were Māori, though only 36.3 percent of working-age benefit
recipients were Māori.
International Migration In November 2018,
there was a
significant change in
There were a provisionally estimated 11,980 permanent and long-term arrivals to how migration has
been estimated by
New Zealand in April 2019 and 7,110 departures in seasonally adjusted terms, a
Statistics New
net gain of 4,870 which was a small increase on the (revised) 4,630 estimated for Zealand. It changed
from being based on
the previous month. There was a seasonally adjusted net loss of 400 New Zealand intentions shown on
citizens, compared to a loss of 620 the previous month, and a net gain of 5,270 arrival and departure
cards to being based
other citizens, compared to 5,250 the month before. There was an estimated on whether they stay
actual net gain of 55,834 migrants in the year to April, up from 50,163 in the year in New Zealand (or
abroad, respectively)
to April 2018. In April, 9.7 percent of the arrivals had residence visas, 17.8 for at least 12 of the
next 16 months.
percent student visas, 22.1 percent work visas, and 19.1 percent visitors. A Recent data is
further 30.5 percent were New Zealand or Australian citizens. therefore provisional
for 17 months.
Job Vacancies Online for the three months to March 2019 showed the seasonally
adjusted number of job vacancies rose by 1.1 percent in the quarter and rose 5.6 percent over the
same quarter a year previously. All the following are seasonally adjusted, though it should be borne
in mind that many jobs are still filled by word of mouth, social networks and through recruitment
agencies rather than the job advertisements surveyed for these statistics. Over the quarter, highly
skilled vacancies rose 0.8 percent while semi-skilled vacancies rose 3.1 percent and unskilled
17 CTU Monthly Economic Bulletin – June 2019vacancies fell 1.8 percent, while over the year, highly skilled vacancies rose 6.7 percent while semi-
skilled vacancies rose 4.9 percent and unskilled vacancies rose 4.8 percent. Over the quarter,
vacancies in Auckland were up 0.7 percent, Bay of Plenty 3.6 percent, Gisborne/Hawke’s Bay 1.7
percent, Marlborough/Nelson-Tasman/West Coast 1.3 percent, Otago/Southland 1.5 percent,
Waikato 0.6 percent, and Wellington 4.7 percent, while vacancies in Canterbury were down 0.6
percent, Manawatu-Whanganui/Taranaki down 0.1 percent, and Northland down 3.5 percent. By
industry for the quarter, vacancies rose fastest in IT (up 5.5 percent) and Hospitality (up 3.3 percent),
while they fell 6.1 percent in Primary industries and 1.7 percent in Sales. Over the year IT also leads
(up 16.1 percent) followed by Health (11.9 percent), Hospitality (5.6 percent) and Education (5.2
percent). By occupation, vacancies for Managers and for Technicians and Trades both rose by 3.0
percent over the quarter, followed by Community and Personal services up by 2.7 percent, while
Sales vacancies fell 2.0 percent and Machinery drivers were down 2.3 percent. Over the year, the
fastest growing vacancies were for and Community and Personal services (up 9.6 percent), followed
by Professionals (up 8.2 percent), Clerical and Administration (up 7.4 percent) and Managers (up 4.9
percent).
18 CTU Monthly Economic Bulletin – June 2019You can also read