Investor presentation - October 2020 - Hamburger Hafen und Logistik AG
←
→
Page content transcription
If your browser does not render page correctly, please read the page content below
Investor presentation

October 2020

                        © Hamburger Hafen und Logistik AG
Content and disclaimer

01   Investment highlights and strategy       Disclaimer
     page 3                                   The facts and information contained herein are as up to date as is reasonably possible and are subject to
                                              revision in the future. Neither the Company nor any of its parent or subsidiary undertakings nor any of such
                                              person’s directors, officers, employees or advisors nor any other person makes any representation or warranty,

02   Business update and financials H1 2020
                                              express or implied as to, and no reliance should be placed on, the accuracy or completeness of the information
                                              contained in this presentation. Neither the Company, nor any of its parents or subsidiary undertakings nor any
                                              of their directors, employees and advisors nor any other person shall have any liability whatsoever for loss
     page 15                                  howsoever arising, directly or indirectly, from any use of this presentation. The same applies to information
                                              contained in other material made available at the presentation.

03   Business forecast 2020
                                              While all reasonable care has been taken to ensure that the facts stated herein are accurate and that the
                                              opinions contained herein are fair and reasonable, this document is selective in nature. Where any information
                                              and statistics are quoted from any external source, such information or statistics should not be interpreted as
     page 25                                  having been adopted or endorsed by the Company as being accurate.
                                              This presentation contains forward-looking statements relating to the business, financial performance and

04   Fact book                                results of the Company and/or the industry in which the Company operates. These statements generally are
                                              identified by words such as “believes”, “expects”, “predicts”, “intends”, “projects”, “plans”, “estimates”, “aims”,
                                              “foresees”, “anticipates”, “targets” and similar expressions. The forward-looking statements, including but not
     page 27                                  limited to assumptions, opinions and views of the Company for information from third party sources, contained
                                              in this presentation are based on current plans, estimates, assumptions and projections and involve
                                              uncertainties and risks. Various factors could cause actual future results, performance or events to differ
                                              materially from those described in these statements. The Company does not represent or guarantee that the
                                              assumptions underlying such forward-looking statements are free from errors and the Company does not
                                              accept any responsibility for the future accuracy of the opinions expressed in this presentation. No obligation is
                                              assumed to update any forward-looking statements.
                                              By accepting this presentation you acknowledge that you will be solely responsible for your own assessment of
                                              the market and the market position of the Company and that you will conduct your own analysis and be solely
                                              responsible for forming your own view of the potential future performance of the Company’s business.
                                              This presentation is not a prospectus and does not constitute an offer or an invitation or solicitation to subscribe
                                              for, or purchase, any shares of the Company and neither this presentation nor anything contained herein shall
                                              form the basis of, or be relied on in connection with, any offer or commitment whatsoever.

       October 2020   Investor presentation                                                                                © Hamburger Hafen und Logistik AG        2
Investment highlights
Positioned for future challenges

                                                                        Group

                                                Port Logistics                                       Real Estate
                                                listed class A shares                             non-listed class S shares

              Container                         Intermodal                      Logistics
              segment                           segment                         segment

                                                                                                 The particular attractiveness
      1. THE logistical and digitally innovative hub                                          of the portfolio in the Hamburger
                                                                                             Speicherstadt and on the northern
      2. Favourable geographical location in a market with solid growth outlook                Elbufer / Fischereihafen areal is
      3. Well-invested asset base with state-of-the-art technology                             justified by the unique structure
                                                                                                and the location. The in-house
      4. Solid financial foundation with strong cash flows                                    development and implementation
                                                                                               know-how is aimed at balancing
      5. Growth and efficiency as guiding principles
                                                                                             market-oriented tenant needs and
      6. Environmental protection and sustainability                                             heritage-friendly handling of
                                                                                            buildings protected as world heritage.

       October 2020     Investor presentation                                                          © Hamburger Hafen und Logistik AG   3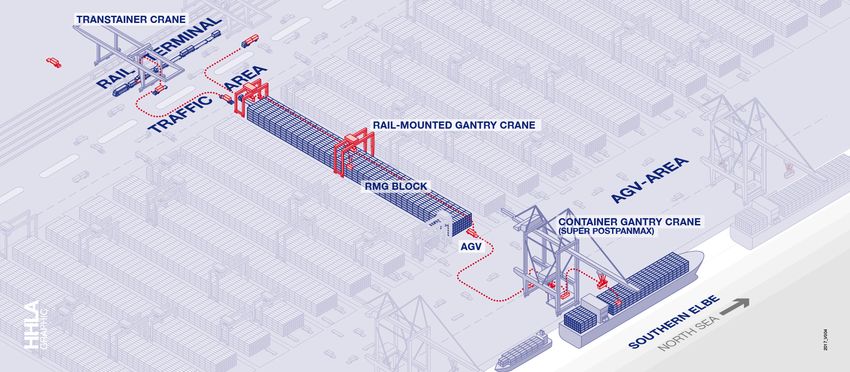
1. THE logistical and digitally innovative hub
HHLA Port Logistics’ strategic position
Internationalisation will continue NORTHERN EUROPE ‒ FAR EAST
maritime
with HHLA exploiting new transport
routes
Digitalisation will open up further
opportunities and HHLA will benefit ●Tallinn
from new production processes ● Hamburg
TRANSPACIFIC TRANSPACIFIC
●Odessa
HHLA TRANSATLANTIC
CONTINENTAL SILK ROAD
‒ is strengthening the existing core rail INNER ASIAN
of its business
‒ will exploit growth opportunities along
the transport streams of the future
‒ will improve efficiency and grow
sustainably
‒ will become climate neutral by 2040
HHLA Port Logistics is the logistical and digitally innovative hub along the transport streams of the future.
October 2020 Investor presentation © Hamburger Hafen und Logistik AG 4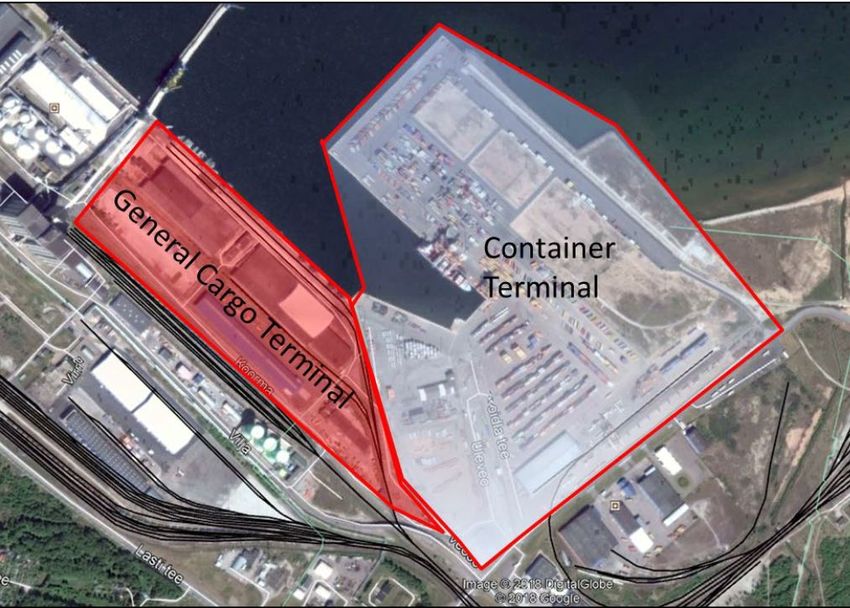
2. Local player connected to Europe and Asia
Favourable geographical location in markets with robust economies
Throughput by shipping region FY19 Dense hub & railway network in the West of the new silk road
HHLA in the Port of Hamburg
54% ASIA / FAR EAST
Own fleet of railway waggons and locomotives
Traction with cross-border transport solutions
11% BALTIC SEA
Climate friendly modes of transport
FEEDER SERVICES
WITH SCANDINAVIA
AND THE BALTICS
10% SCANDINAVIA
10% NORTH AMERICA
6% LATIN AMERICA
● Hamburg
CONT. EUROPE
5%
UK / IRELAND
2% AFRICA OVERSEAS SERVICES
ESP. WITH FAR EAST
HINTERLAND
CONNECTIONS
1% ROW WITH CEE
Source: HHLA
Growth perspectives 2020 Rail network Asia-Europe
Estimates for macroeconomic development Existing routes
Planned or
OECD IMF under construction
Germany’s largest logistics hub Main links
GDP World - 6.0 % - 4.9 % Source: Merics
Market leader in the Port of Hamburg
GDP China - 2.6 % + 1.0 %
Excellent hinterland GDP Russia - 8.0 % - 6.6 %
Europe’s largest railway port with a dense rail network World trade - 9.5 % - 11.9 %
OECD Interim Economic Outlook, Single-hit scenario June 2020
IMF World Economic Outlook Update, June 2020
October 2020 Investor presentation © Hamburger Hafen und Logistik AG 5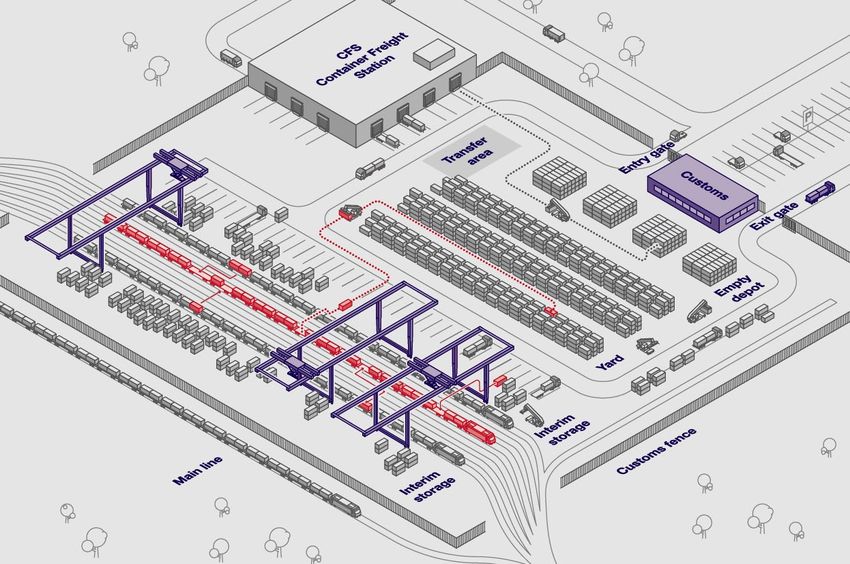
3. Well-invested asset base
Operations with state-of-the-art technology
Self-funded investments Operating cash flow
State-of-the-art handling technology, innovative IT systems and a high level of Investing cash flow
in € million
automation (without proceeds for
short-term deposits)
IFRS 16
In line with client needs: Three fully equipped berths for mega carriers in
303,0
operation at the container terminals Burchardkai (CTB) and Tollerort (CTT) 258,9 36.7
218,7 214,8
Further rollout of additional automated block storage capacities at CTB 186,8
192,6
On-dock railway stations at all facilities able to comply with future 740m block trains 146,3 163,8
124,0
101,8
Optimised traffic coordination for an improved cargo flow and terminal access
HHLA Pure: climate-neutral handling and transport from the port to the hinterland 2015 2016 2017 2018 2019
October 2020 Investor presentation © Hamburger Hafen und Logistik AG 6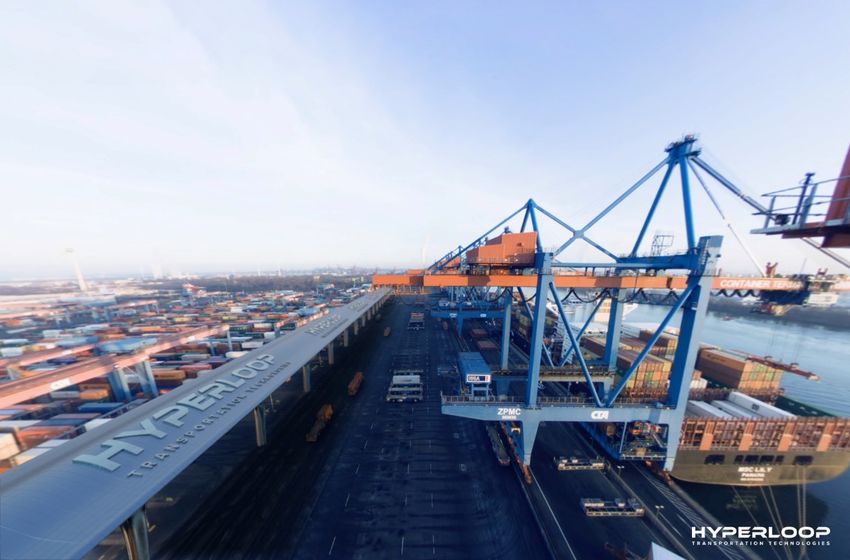
4. Solid financial foundation with strong cash flows
Focus on profitability and shareholder participation
Equity development / Equity ratio Ø Capital employed / ROCE Profit after tax and minorities / EPS
in € million in € million Capital employed in € million / in €
Right of use
542,5 555,8 564,5
528,7 525,6 102,9
1.850,0 93,6
71,2
34,4%
33,5%
524,3
32,3%
31,7% 1.134,0 1.149,4 1.154,3 1.216,1 58,9 63,7 1,47 Earnings
1,34
21,9%
Equity 1.325,7 1,02
per share
0,84 0,91
ratio
13,6 15,5 ROCE
12,4 12,8
11,1
2015 2016 2017 2018 2019 2015 2016 2017 2018 2019 2015 2016 2017 2018 2019
Net debt 1,395.0 Self-funded investments Operating cash flow Dividend development
in € million in € million Investing cash flow
(without proceeds for
Net financial debt short-term deposits)
0,80 € 2019:
496.3 0,70 € Dividend
Pension provisions IFRS 16 0,67 € proposal
Lease obligations 0,59 € 0,59 €
303,0
706.5 258,9 36.7 Payout
631.6 636.1 218,7
576.3 214,8 70% 65% 66% ratio
617.4 186,8 54% 52%
442.1
409.2 453.5 3,9 192,6 Dividend
442.1 Net debt/ 163,8
2,4 2,4 2,4 EBITDA 146,3
4,2% 4,6%
yield per
2,1 124,0 3,3% 2,8% 2,9%
222.4 264.4 281.3 101,8 31.12.
182.6 134.2
2015 2016 2017 2018 2019 2015 2016 2017 2018 2019 2015 2016 2017 2018 2019
October 2020 Investor presentation © Hamburger Hafen und Logistik AG 7
5. Growth and efficiency as guiding principles
Strategy will allow for sustained growth in the Port Logistics subgroup

    Mid-term targets to ensure growth and efficiency improvements

    Investing approx.                       Funding investments      Growing inorganically          Keeping net debt /                           Pursuing a dividend
 € 800 million until 2022                   from own funds and       and achieve a positive        EBITDA in investment                          policy and distribute
   to grow organically                         free cash flow          value contribution             grade territory                            50-70 % of net profit

    Long-term targets to reconcile economic success with environmental and social responsibility

   Strong               Smart investment              New             Reduction of CO2
  market                 and efficiency             business      emissions by 50% by 2030                EBIT in 2025 of € 300* million
  position                programmes                 fields        Climate neutral by 2040
                                                                                              * Based on current assumptions and estimates; assuming further progress in Elbe dredging
         October 2020       Investor presentation                                                                                                 © Hamburger Hafen und Logistik AG   8
5. Growth and efficiency as guiding principles
Strategic two-tier approach along three action fields to enhance growth and efficiency

   Action fields                                                          Programme

   Investments                                                                  Strengthen the existing
                                                                          1
                                                                                core business
   Innovations
                                                                                Open up new growth
                                                                          2     potential along the transport
   Merges & acquisitions                                                        streams of the future

       October 2020   Investor presentation                                                   © Hamburger Hafen und Logistik AG   9
5. Growth and efficiency as guiding principles 1
Strengthen the
existing core business
Investment programme to facilitate profitable growth
Investments Container Intermodal
2018 – 2022 ~ € 450 million ~ € 350 million
excl. M&A
Increasing volume peaks due to growing ship sizes Bottlenecks in infrastructural capacities
Consolidation amongst customers Sustain know-how- and efficiency-based
Challenges price-performance-ratio
Demand for sustainable solutions
Logistic solutions across borders and rail networks
Necessity for efficiency improvements
Demand for sustainable solutions
5 new gantry cranes for mega carriers Substantial investments at METRANS for locomotives
at CTB until 2020 and waggons to renew and expand own transportation
Growth and handling capacities
Preparation of another berth for mega carriers
Support climate targets by increasing rail share in
at CTT
European modal split through offering of climate
Climate neutral container handling neutral onward transportation
Implementation of a uniform terminal planning system Acquisition of remaining stake in METRANS
and database Make use of synergies from full integration of
Efficiency Make use of artificial intelligence and machine POLZUG
learning for improving on-dock processes Add new hubs to the network
Increase agility, reduce overhead costs Increase agility, reduce overhead costs
October 2020 Investor presentation © Hamburger Hafen und Logistik AG 105. Growth and efficiency as guiding principles 2
Open up new growth potential along
the transport streams of the future
Investment programme to facilitate profitable growth
Container Intermodal
Innovations and M&A 2018 – 2022
Organically Inorganically
IHATEC – Innovative Hafentechnologien Structured terminal evaluation to identify and evaluate
(funding programme for innovative port technologies) attractive investment options
Growth from
innovations
HHLA Pure – climate-neutral handling and transport Focus on existing terminals in growth markets with a high
from M&A
Growth
from the port to the hinterland proportion of gateways and efficiency potential
Automation and digitalisation of processes, make use of Open up new potential by orienting on the existing
artificial intelligence and machine learning intermodal network
Bundling and processing of data Expansion of regional focus
Digitalisation and automation of processes
Establish strategic partnerships Serve rising customer demands without proportionally rising costs
Efficiency Manage the inorganic growth, make use of synergies, Reduce overhead costs
increases reduce overhead costs
Increase value creation from denser network
October 2020 Investor presentation © Hamburger Hafen und Logistik AG 116. Environmental protection and sustainability
Sustainable management anchored in business model – ambitious climate protection target
High standards for high transparency Ecological responsibility – four fields of activity defined
HHLA’s commitment to sustainability is
binding, transparent, measurable and Environmentally friendly logistics chains Area optimisation
comparable Create sustainable, environ- Increase the efficient use of
HHLA supports the Sustainable Develop- mentally friendly transport chains port and logistics areas
ment Goals (SDGs) adopted by the UN
HHLA applies the Global Reporting Initiative
(GRI 4 standard) guidelines on sustainability
Climate protection and energy efficiency Protection of environment and resources
reporting
Reduction of CO2 emissions by Reduction of environmental impacts
First maritime company to issue a
energy efficiency and innovations and conservation of resources
declaration of compliance with the
German Sustainability Code (DNK)
HHLA has reported on its carbon footprint
regularly since 2008 as part of the inter-
national Carbon Disclosure Project (CDP)
HHLA will reduce its CO2 emissions by at least 50% by 2030 (base 2018)
All major operating companies certified
according to DIN 5001 (energy management)
Until 2040 HHLA will be a climate neutral company
October 2020 Investor presentation © Hamburger Hafen und Logistik AG 126. Environmental protection and sustainability
Ambitious targets supported by concrete actions
Green infrastructure in the Port of Hamburg HHLA Pure: climate-neutral handling and transport from
More than 135 rail operators use the infrastructure the port to the hinterland
at the Port of Hamburg Extensive electrification and use of green electricity on the
Up to 220 freight trains with up to 5,900 waggons daily terminals
arrive at or depart at the Port of Hamburg Transport by Metrans with CO2 optimized train and wagon
Approximately 2,000 container rail connections are on material (e.g. use of hybrid locomotives used for heavy-
offer every week duty shunting or use of container flat wagons which are
30% lighter than normal equipment)
Unavoidable CO2 emissions are currently offset by
certified development projects according to the highest
international Gold standard
Complete conversion of the AGV fleet to B-AGV by
2021/22
Certification of the climate-neutral service by TÜV Nord
October 2020 Investor presentation © Hamburger Hafen und Logistik AG 13HHLA Port Logistics
THE logistical and digitally innovative hub
The HHLA service network
HHLA connects its customers with maritime and continental transport streams Connection of transport streams
and data streams
Cross-borders, cross-infrastructure,
cross-countries, cross-languages
Port of Hamburg is Germany’s
largest logistics hub
Dense hub and railway network for
the transport streams of the future
Ecological consciousness as
integral part of the business model
October 2020 Investor presentation © Hamburger Hafen und Logistik AG 14Economic and social life largely shut down in Q2 2020
Effects on the economy of historic dimension
Pandemic Economy – GDP Germany and USA
Source: Johns Hopkins University
Sources: Destatis and Statista
October 2020 Investor presentation © Hamburger Hafen und Logistik AG 15The first half-year 2020 at a glance
Challenging market environment highly affects the first half-year results 2020
Revenue declined sharply while EBIT fell by half
Market environment was hit hard by the impact of the coronavirus pandemic in Q2
High pressure on transport systems due to blank sailings and reduced utilisation
Liquidity sufficient to meet due payment obligations at all times, despite the pandemic-induced burdens
Guidance 2020 remains: Strong decline in volumes, revenue and EBIT expected
October 2020 Investor presentation © Hamburger Hafen und Logistik AG 16Business environment in the first half-year 2020
Global economy facing recession as a result of the coronavirus pandemic
Trend in the first half-year 2020 Macroeconomic environment
Global economic activity fell dramatically in H1 20 as a result of the coronavirus pandemic
GDP World
IMF expects that the impact in Q2 was even more negative than previously expected.1
GDP China
Chinese economy has already bottomed out and reported a surprisingly sound GDP
in H1 20 (Q2: 3.2 % // Q1: - 6.8 %) 2
GDP Russia By contrast, COVID-19 has not yet been contained e.g. in Russia where the economic
downturn has not yet been reached (Q1: 1.6 %; ) 3
World trade Significant drop in world trade as a result of strong trade restrictions expected1
Sources: 1 International Monetary Fund – World Economic Outlook June 2020; 2 Press Release (16.07.2020);
3 World Bank Russia Monthly Economic Update May 2020
Estimates for Q2 2020 Sector development
Whereas the minus in worldwide container throughput in Q1 20 was not as intense as
World throughput – 16.2 %
expected, global volumes plummeted drastically in Q2 20 (Q2: - 16.2 % // Q1: - 2.7 %)
Europe throughput – 21.3 % Europe was particularly hard hit by the crisis (Q2: - 21.3 % // Q1: - 2.8 %)
Northwest Europe as well as Scandinavia and the Baltic region also performed
NW Europe throughput – 16.7 % significantly worse in Q2 than previously forecast
North West Europe with the lowest impact within Europe (Q2: - 16.7 % // Q1: - 2.9 %)
Scandinavia & Baltics – 33.3 %
Scandinavia & Baltics with the strongest decline in Europe (Q2: - 33.3 % // Q1: - 2.4 %)
Source: Drewry Maritime Research, Container Forecaster, July 2020
October 2020 Investor presentation © Hamburger Hafen und Logistik AG 17Financial results of Port Logistics subgroup in the first half-year 2020
Revenue EBIT EBIT margin
€ 614.2 million € 49.1 million 8.0 %
‒ 9.3 % ‒ 53.5 % ‒ 7.6 pp
Profit after tax
ROCE Operating cash flow
and minorities
5.2 % € 150.0 million
€ 10.7 million
‒ 6.3 pp ‒ 8.3 %
‒ 78.6 %
October 2020 Investor presentation © Hamburger Hafen und Logistik AG 18Throughput and transport development in the first half of 2020
Performance data burdened by impact of coronavirus pandemic
Container throughput Container transport
in thousand TEU in thousand TEU
-11.3%
-8.2%
3,770 3,807
3,345 782 783
718
1H19 2H19 1H20 1H19 2H19 1H20
Hamburg terminals with sharp decrease of 12.0 % Significant decrease in transport volume driven by
mainly due to blank sailings resulting from the coronavirus − strong decrease in rail transportation (‒ 6.9 % y-o-y)
pandemic causing strong loss in Asian traffic − traffic from both the North German and the Adriatic
Feeder volumes down by 2.3 pp with a feeder ratio seaports recorded significant or strong declines that
of 20.6 % (previous year: 22.9 %) couldn’t be compensated by strong growth in continental
International terminals slightly down against previous year traffic
− downward trend in road transportation continued
(‒ 13.0 % y-o-y)
October 2020 Investor presentation © Hamburger Hafen und Logistik AG 19Container segment
Drop in volumes led to falling revenue, EBIT impacted by a disproportionate fall in opex
Revenue ■ 1H19 ■ 1H20 OpEx ■ 1H19 ■ 1H20 Revenue significantly down as a result of
-1.0%
lower volumes
-9.6%
401.7 329.9 326.5 Average revenue per TEU up 1.9 % due to
363.4
− advantageous modal split with a high
+11.5%
proportion of hinterland volume
+1.9%
108.6 97.6 − temporary increase in storage fees due to
106.6 87.5
longer dwell times brought about by
weather-related delays in 1Q20 and the
€m €/TEU €/TEU €m €m €/TEU €/TEU €m coronavirus pandemic throughout 1H20
Opex decrease of 1.0 % impacted by
EBIT ■ 1H19 ■ 1H20 EBIT margin
− lower material and personnel expenses
-48.7% (resulted primarily from the reduced use
-7.8pp of external personnel as a result of the
71.8
17.9% drop in volumes)
36.8
− higher maintenance and service costs
-42.2%
10.1%
19.0
EBIT significantly down to € 36.8 million
11.0
EBIT margin down to 10.1 %
€m €/TEU €/TEU €m 1H19 1H20
October 2020 Investor presentation © Hamburger Hafen und Logistik AG 20Intermodal segment
EBIT affected by lower volumes and utilisation of the train systems, EBIT margin still at a sound level
Revenue OpEx Decrease in revenue 0.3 pp stronger than
in € million in € million
decline in transport volume
-8.5% -2.4% Despite a slight increase in rail share in
244.1
223.2 193.3 188.7 HHLA’s total transportation volume from
78.0 % to 79.2 %, average revenue per
TEU decreased as a result of the
disproportionately strong decrease in
freight flows with longer transport
distances
1H19 1H20 1H19 1H20
Sharp drop in EBIT as a result of
EBIT EBIT margin ‒ decline in volumes and revenue
in € million
‒ increased fluctuations in the volume of
-32.0% -5.3pp import and export loads leading to a
50.8 20.8% decrease in the utilisation of the train
15.5% systems
34.5
EBIT margin deteriorated, but still at a
sound level of 15.5 %
1H19 1H20 1H19 1H20
October 2020 Investor presentation © Hamburger Hafen und Logistik AG 21Logistics segment
Vehicle logistics, consulting activities, digital projects and participations
Revenue EBIT Revenue strongly down against previous
in € million in € million
year impacted by
-12.9% Neg.
‒ strong drop in vehicle logistics
29.7 1.7
25.9 ‒ consulting activities slightly below
previous year
‒ additive manufacturing technologies
(which was not included 1H19)
EBIT impacted by start-up losses in the
1H19 1H20 -2.1
new growth areas; in addition, vehicle
1H19 1H20
logistics and consulting activities
At-equity earnings remained below the previous year
in € million
-60.8%
At-equity earnings continued to be
2.1 positive in 1H20, but declined sharply
0.8
1H19 1H20
October 2020 Investor presentation © Hamburger Hafen und Logistik AG 22Earnings bridge of the Port Logistics subgroup
Net profit showed a stable development
in € million / absolute change vs. 1H19
- 1.7 - 0.8
49.1
0.7 EPS
€ 0.15
17.0
12.1
10.1
- 6.2
12.0
10.7
‒53.5 % Effective tax rate ‒ 78.6 %
at 30.7%
EBIT At-equity Net financial Tax Minorities Net profit
earnings expenses after
minorities
October 2020 Investor presentation © Hamburger Hafen und Logistik AG 23Cash flow development of the Port Logistics subgroup
In line with business development
Cash flow from operating activities Cash flow from investing activities Cash flow from financing activities
in € million in € million in € million
-8.3% -17.7% -73.0%
163.6
150.0
-32.0
-72.3
-87.8 -118.5
1H19 1H20 1H19 1H20 1H19 1H20
Lower EBIT due to lower container Ongoing capex programme Strong change against previous year
throughput and transport vs. a Higher payments for investments in mainly due to the fact that the dividend
decrease (previous year: increase) in property, plant and equipment has not yet been paid to shareholders
trade receivables and other assets as compared to the previous year as well as the compensation obligation
well as lower tax payments compared to a minority shareholder
Lower payments for short-term deposits
to the previous year
Available liquidity as of 30 June 2020: € 276.8 million (31 December 2019: € 232.2 million)
October 2020 Investor presentation © Hamburger Hafen und Logistik AG 24Financial stability with focus on cash flows
Net debt Port Logistics Dividend policy to strengthen financial
in € million stability:
1,395.0 Available
1,350.2 ‒ reduction of dividend proposal to
liquidity
€ 276.8 m 0.70 € per listed class A share
496.3 (previous year: 0.80 €)
512.1
‒ pay-out ratio of 52 %
‒ accumulation of approx.
Pension provisions
706.5 Lease obligations*
€ 49 million of 2019 net profit
631.6 636.1 Net financial debt
576.3 ‒ proposal of a scrip dividend to
773.0 provide additional financial scope to
442.1 751.4
409.2 453.5 develop HHLA successfully – main
442.1
shareholder will choose shares
Postponement and revision of
222.4 264.4
182.6 134.2 125.7 86.7
investments
2015 2016 2017 2018 2019 1H20 Focus on cash flow control in the
2019: months to come
Change in lease
accounting * Lease obligations according to IFRS 16
October 2020 Investor presentation © Hamburger Hafen und Logistik AG 25Expected business environment 2020
Updated forecasts factor in a larger hit to activity in H1 and a slower path of recovery in H2 than expected in spring
GDP World ‒ 4.9 % Expected macroeconomic environment 2020
Baseline scenario: against the backdrop of the unexpectedly strong economic impact,
GDP China + 1.0 % the recovery is likely to be more gradual than previously forecast
Global economic downturn in H1 worse than expected, outlook further subdued ( 1.9 pp)
GDP Russia ‒ 5.5 % For China, experts still expect positive but strongly weakened growth ( 0.2 pp)
After upward trend at the end of 2019, Russia is projected to contract strongly ( 1.1 pp)
GDP CEE ‒ 5.2 %
Growth dynamics in CEE also massively interrupted ( 0.6 pp)
World trade ‒ 11.9 % For world trade development a dramatic double-digit decline is estimated ( 0.9 pp)
Source: IMF – World Economic Outlook, July 2020
World throughput ‒ 7.3 % Expected sector development 2020
Baseline scenario: market to bottom out in 2Q20 followed by a steady reintroduction
Europe throughput ‒ 9.7 % of capacity from H2 20 with freight rates stabilising in H2 20
World throughput expected to decline significantly ( 6.8 pp) with several blank sailings
NW Europe throughput ‒ 7.7 % Europe considered to go into “sleep mode” except for essential services ( 8.9 pp)
Estimated volume in North West Europe also significantly under previous year ( 7.2 pp)
Scandinavia & Baltics ‒ 17.2 %
Scandinavia & Baltics expected to see the highest impact in Europe ( 17.0 pp)
Source: Drewry Maritime Research, Container Forecaster, July 2020
October 2020 Investor presentation © Hamburger Hafen und Logistik AG 26Forecast for Port Logistics subgroup 2020 unchanged
Still very high degree of uncertainty
2019 Guidance 2020
Container throughput 7,577 thousand TEU Strong decrease on previous year
Container transport 1,565 thousand TEU Strong decrease on previous year
Revenue € 1,350.0 million Strong decline on previous year
EBIT € 204.4 million Strong decline on previous year
Capital expenditure € 214.9 million Adapted to current market environment
Liquidity sufficient to meet due payment obligations at all times,
Liquidity
despite the pandemic-induced burdens
October 2020 Investor presentation © Hamburger Hafen und Logistik AG 27Fact book HHLA Port Logistics subgroup page 28 Container segment page 33 Intermodal segment page 48 Logistics segment page 57 October 2020 Investor presentation © Hamburger Hafen und Logistik AG 28
Key figures
Port Logistics subgroup

in € million                                                           2015      2016      2017      2018                            2019

Revenue                                                              1,111.0   1,146.0   1,220.3   1,285.5                      1,350.0

EBIT                                                                  141.1     147.6     156.6     188.4                           204.4

Profit after tax and minorities                                        58.9      63.7      71.2     102.9                             93.6

Earnings per share in €                                                0.84      0.91      1.02      1.47                             1.34

ROCE in %                                                              12.4      12.8      13.6      15.5                             11.1

Free cash flow           (excl. proceeds from short term deposits)     40.5     116.9     134.9      19.8                           116.6

Capex (without Group internal transaction)                            144.6     136.9     136.4     132.9                           214.9

          October 2020       Investor presentation                                                     © Hamburger Hafen und Logistik AG   29
Segment performance in 2019
Container and Intermodal segments as main pillars, Logistics segment strategically relevant
in € million Container Intermodal Logistics
Share of revenue 59 % 36 % 4%
on subgroup level incl. Holding/Others
Revenue 799.7 486.9 59.0
EBIT 141.3 99.2 2.5
EBIT margin in % 17.7 20.4 4.3
October 2020 Investor presentation © Hamburger Hafen und Logistik AG 30Key figures
Balance sheet, assets and liabilities of the Port Logistics subgroup
in € million 2015 2016 2017 2018 2019
Balance sheet total 1,576.4 1,638.1 1,658.9 1,783.3 2,401.4
Non-current assets 1,138.6 1,165.1 1,184.6 1,280.5 1,936.6
Current assets 437.8 473.1 474.4 502.8 464.8
Equity 542.5 528.7 555.8 564.5 525.6
Pension provisions 409.2 453.5 442.1 442.1 496.3
Other non-current liabilities 445.2 452.2 430.8 545.1 1,111.8
Current liabilities 179.6 203.7 230.3 231.6 267.7
October 2020 Investor presentation © Hamburger Hafen und Logistik AG 31Shareholder structure
Listed class A shares
Shareholder structure Class A shares Class S shares
Free and Hanseatic City of Hamburg (FHH) Non-listed class S shares comprise
holds 68.4 % of the listed class A shares Real Estate subgroup
68,4% Free and Class A shares comprise Port Logistics Class S shares are not tradable
Hanseatic City
of Hamburg subgroup (Container segment, Intermodal and are held in total by the Free and
31,6% Free float
segment, Logistics segment) Hanseatic City of Hamburg (FHH)
Index affiliation: SDAX
Stock exchanges: Frankfurt am Main,
Hamburg
Group
Subgroups Port Logistics Real Estate
Segments Container Intermodal Logistics Real Estate
Listed class A shares Non-listed class S shares
Shareholder
structure
31.6 % Free float 68.4 % Free and Hanseatic City of Hamburg (FHH) 100 % FHH
October 2020 Investor presentation © Hamburger Hafen und Logistik AG 32Milestones in HHLA Port Logistics' history
From port logistics operator to integrated service provider
1968 1982 1995 2002 2012 2018 2020 et seqq.
The “American Opening of a HHLA acquires first Opening of Realignment of Acquisition of Investment
Lancer”, the first HHLA container 25 % of shares in Container Terminal Intermodal shareholding: largest
programme
full containership terminal at METRANS Altenwerder (CTA) 89% stake in METRANS container
calls at the Port O'Swaldkai and full control of Polzug terminal in Growth from
of Hamburg Estland, port innovations
of Muuga, Growth from M&A
Tallin
1976 1992 1996 2007 2018 2019
HHLA is setting up HHLA’s rail affiliate HHLA acquires Opening of a hub Merger of METRANS CTA
HPC Hamburg Polzug sets the first the container terminal in Dunajska and METRANS Polonia certified as
Port Consulting commercial container terminal at Streda and further (former Polzug), first climate
block train to Eastern Tollerort inland terminals acquisition of neutral
Europe rolling outstanding shares terminal in
Europe
October 2020 Investor presentation © Hamburger Hafen und Logistik AG 33Key figures
Container segment
in € million 2015 2016 2017 2018 2019
Container throughput in thousand TEU 6,561 6,658 7,196 7,336 7,577
Revenues 675.2 694.6 746.6 758.9 799.7
EBITDA 195.8 201.5 194.7 209.8 240.2
EBITDA margin in % 29.0 29.0 26.1 27.6 30.0
EBIT 110.6 117.8 109.4 131.6 141.3
EBIT margin in % 16.4 17.0 14.7 17.3 17.7
Segment assets 806.6 824.5 810.8 888.9 1,295.6
October 2020 Investor presentation © Hamburger Hafen und Logistik AG 34Growth of global container throughput and GDP
Slowdown of growth multiplier on GDP since 2012
Upswing Dip Recovery Decade of convergence Expectations
Ø multiplier 2.6x 7.3x 2.4x 1.2x ~ 0.6x
20%
15%
10%
5%
0%
2000 2001 2002 2003 2004 2005 2006 2007 2008 2009 2010 2011 2012 2013 2014 2015 2016 2017 2018 2019 2020 2021 2022 2023
[F'cast] [F'cast] [F'cast] [F'cast]
-5%
-10%
Container throughput GDP world
Source: Drewry Maritime Research, Container Forecaster, June 2020 / IMF World Economic Outlook, June 2020
October 2020 Investor presentation © Hamburger Hafen und Logistik AG 35Ports are an investment opportunity in GDP growth
After a decade of convergence continued growth in line with GDP development expected
in TEU million Global thereof Asia thereof Northwest Europe
Upswing Dip Recovery Decade of convergence Expectation
800
700
600
500
400
300
200
100
0
2001 2003 2005 2007 2008 2009 2010 2011 2012 2013 2014 2015 2016 2017 2018 2019 2020 2021 2022 2023
[F'cast] [F'cast] [F'cast] [F'cast]
Global 12.3% -9.3% 11.8% 3.8% ~ 2-3 %
CAGR
Asia 14.1% -7.9% 13.4% 4.1% ~ 3-4 %
NW Europe 9.7% -17.1% 6.4% 2.3% ~3%
Source: Drewry Maritime Research, Container Forecaster, June 2020 / HHLA
October 2020 Investor presentation © Hamburger Hafen und Logistik AG 36Development of alliances in the Asia − Far East services
Concentration in the shipping industry substantially increased
Share Main developments since 2016
FE – Europe
Acquisition of CSCL by COSCO
Acquisition of APL by CMA CGM
37% Insolvency of Hanjin
Acquisition of Hamburg Süd by Maersk
Integration of UASC in Hapag-Lloyd
Acquisition of OOCL by COSCO
Merger of Japanese carriers
39%
Implications
Re-shaping of alliances and cooperation to
improve load factor and slot costs
Consolidation process in the shipping
23% industry is supposed to be continued
Perspectives
Source: HHLA /
Deployment of largest vessel sizes and
AXS Alphaliner Monthly
Monitor, July 2020
focus on calls at gateway ports (hubs)
October 2020 Investor presentation © Hamburger Hafen und Logistik AG 37Competing ports of the North Range
Container throughput and market share development
Throughput and market share of HHLA in 2019
Container throughput in the North Range** 2019 in TEU million
43.1 million TEU (+ 2.4 % y-o-y)
43,1
WILHELMSHAVEN
KIEL
0.6 million TEU CANAL
(- 2.5 y-o-y) 14,1
9,3 7,0
16 % 49 % 75 %
North Range** German Bay Hamburg HHLA
BREMERHAVEN HAMBURG
4.9 million TEU 9.3 million TEU
(- 11.4 % y-o-y) (+ 6.1 % y-o-y) CAGR* CAGR* CAGR* CAGR*
ROTTERDAM 2.0% - 0.7% - 0.4% +0.1%
14.8 million TEU HHLA in Hamburg
(+ 2.1 % y-o-y) 6.9 million TEU
(+ 1.2 % y-o-y) Throughput and market share of HHLA in 2008
in TEU million
34,6
Current terminal capacity
of North Range ports
ZEEBRUGGE ANTWERP of ~ 54 million TEU p.a.1 15,2
1.7 million TEU 11.9 million TEU utilisation stands at ~ 78 %2 9,7
(+ 4.8 % y-o-y) (+ 6.9 % y-o-y) 6,9
Sources: Port Authorities / HHLA 20 % 45 % 70 %
1 Drewry Global Container Terminal Operators 2018
2 HHLA estimates (Drewry capacity estimates / reported volumes)
North Range** German Bay Hamburg HHLA
* CAGR: 2008-2019, ** North Range ports (Antwerp, Rotterdam, Zeebrugge, Hamburg, Bremerhaven, Wilhelmshaven)
October 2020 Investor presentation © Hamburger Hafen und Logistik AG 38Favourable geographical location of Hamburg
Still a hub for the major economies of Asia and CEE
Sea-bound container throughput in Hamburg FY19 Port of Hamburg: Hub with network
by region
54% Asia Germany’s largest logistics hub
11% Baltic Sea Europe’s largest railway port with dense
BALTIC SEA / 10% Scandinavia rail network to CEE and dense feeder
SCANDINAVIA
10% North America network to the Baltics
6% Latin Amerika
Cost advantages for shipping lines
5% Rest of Europe
due to central location deep inland
2% Africa
1% Other regions Attractive cargo mix
Source: HHLA Well balanced import/export flows
Challenges Potential
Timely implementation of the highly Adjustment of the waterway enabling
needed Elbe waterway adjustment a higher load factor, extended time
Underutilized capacities in most slots and more flexibility for handling
ASIA /
North Range ports of mega carriers
FAR EAST CENTRAL AND
EASTERN EUROPE Recovery of the Russian economy
October 2020 Investor presentation © Hamburger Hafen und Logistik AG 39Far East transport chain
Hamburg’s location offers cost benefits compared to other North Range* ports
Shanghai Hamburg
(one-way: ~ 20,375 km)
60 % of costs for about 97 %
700 km = 5 Cent per iPad of total distance
No differentiation in freight rates
between North Range** ports
Hamburg Prague
20,375 km = 7 Cent per iPad
(one-way: ~ 700 km)
40 % of costs for about 3 %
20’ Container = 11,500 iPads
of total distance
Shanghai – Hamburg* = € 800
Hamburg – Prag* = € 520
Clear differentiation between North
Range* ports
12 Cent per iPad per 21,000 km
* as of Dec 2017
** North Range ports (Antwerp, Rotterdam, Hamburg, Bremen Ports incl. Wilhelmshaven)
October 2020 Investor presentation © Hamburger Hafen und Logistik AG 40Growth in ship sizes
Handling of ultra large container vessels (ULCVs) require extra effort
Ship size development at HHLA container terminals Implications
2015
Since first call of a 2016
ULCV in 2010, share increased
2017
Nautical restrictions tightened by
to more than 25% 2018 increasing number of mega carriers
39% 39% 41% 2019
36% 35% 34%
because of more width and draught
30% 32% 31%
25% 27% Peak load conditions due to narrower time
21% 22% 22%
16% 17%
14% 14% windows require more staff and equipment
10%
4% Capex requirements (suitable quay walls,
gantry cranes etc.)
< 6,000 TEU 6,000 to 10,000 TEU 10,000 to 14,000 TEU > 14,000 TEU
ULCV (>10,000 TEU) fleet worldwide and order book until 2022 Counteraction
23
Enhancing service quality by continuous
47
50
45 investment in technology and efficiency
70
61 Proper equipment for ULCV’s
52
75 in service
(quay walls, gantry cranes etc.)
688
665
618
65
573
in order
Optimising vessel calls within the port
523
453
392
340
265
Raising attractiveness of HHLA terminals
200
by expanding hinterland network
2013 2014 2015 2016 2017 2018 2019 2020 2021 2022
October 2020 Investor presentation Source: Alphaliner Monthly Monitor, March 2020 © Hamburger Hafen und Logistik AG 41Deviations in ship calls per week
Peak loads due to bigger ship sizes in a “new normal” environment
Development of carrying container ship capacity Ship-size development at HHLA terminals
2007/08 2020 27%
Carrying capacity of 42% > 14 TTEU
container ships 7% 10 – 14 TTEU
59%
increased by factor 6 – 10 TTEU
< 6,000 TEU
~2.5x since 2007/08 34%
14% Inside: 2010
max. max. Outside: 2019
~ 9,000 TEU 18,000 - 24,000 TEU
17%
Weekly path of HHLA throughput volumes 2019
Datenreihen1 Development of load conditions
Index (100 = Ø weekly) 2008
Datenreihen2
In 2008 load conditions with homogeneous
Standard distribution of weekly throughput volumes
110%
deviation
2007/08: 8.1 % Nowadays uneven utilization due to rising
weekly
2019: 5.5 % 100%
average
volumes per call
- 31.9 % Average standard deviation continued to
vs. 2008 90%
decrease by roughly 32 % since 2008
80% Peak loads especially during the weekend
Mo Tu Wed Thu Fr Sa Su
October 2020 Investor presentation © Hamburger Hafen und Logistik AG 42Focus on client needs: mega carrier ready
Investments in terminal expansion and process optimisation continued
Process optimisation
Introduction of a trucking appointment system
as part of the “Fuhre 4.0” measure
HHLA Container Terminal
Burchardkai (CTB) HVCC coordinates feeder vessels (FLZ),
Roll-out of 12 automated ocean-going vessels (NTK) and barges
storage blocks, another RaMoNa – Coordination and cooperation in
3 blocks are ordered
shunting operations within the port of Hamburg
HHLA Container Terminal KÖHLBRANDBRÜCKE
Tollerort (CTT)
5 container gantry cranes
for mega carriers
HHLA Container Terminal
Altenwerder (CTA)
Extension of the on-dock
railway station from 7 to
9 tracks BERTH FOR MEGA CARRIER
October 2020 Investor presentation © Hamburger Hafen und Logistik AG 43Advanced terminal technology
High automation level with mega-carrier berths in operation
HHLA in the Port of Hamburg
Market share of 75 % in Hamburg and
16 % in the North Range in 2019
State-of-the-art handling technology,
innovative IT systems and a high level of
automation
Three fully equipped berths for the latest
generation of ULCV’s already in operation
at the container terminals Burchardkai
(CTB) and Tollerort (CTT)
Further rollout of additional automated block
storage capacities at CTB
On-dock railway stations at all facilities able
to comply with future 740 metre block trains
Optimised traffic coordination for an
improved cargo flow and terminal access
October 2020 Investor presentation © Hamburger Hafen und Logistik AG 44State-of-the-art container handling at CTA
Maximum efficiency by high degree of automation and compact layout
October 2020 Investor presentation © Hamburger Hafen und Logistik AG 45HHLA TK Estonia: Biggest terminal operator in Estonia
Port Logistics subgroup is stepping up its international presence
TK terminal in Muuga (close to Tallinn) HHLA acquired 100 % of the shares of the Estonian port operator
Transiidikeskuse AS (TK) in Muuga (Tallinn) in 2018
TK is clear market leader in container handling in the Baltic country and operates
a multipurpose terminal for break bulk, bulk and RoRo handling
TK’s Geographic position links the Northern European market
with the “New Silk Road”
Location is developing into a multimodal hub as a result of regional infrastructural
projects (such as the Rail Baltica project)
Container terminal currently with high utilisation of its capacity
of around 300 TTEU; can be increased to approximately 800 TTEU
Terminal specifications HHLA expects to leverage synergies by further professionalising
Area 35 ha sales and operations and integrating the port operator into the HHLA network
Length of quay wall 970 m HHLA is expanding its regional diversification and confirming
Berths 3 its goal of also achieving international growth
Maximum draught 9-12 m / 14 m
First-time consolidation of HHLA TK Estonia in Q2 2018
Container gantry cranes 6
Number of rails 2
October 2020 Investor presentation © Hamburger Hafen und Logistik AG 46Piattaforma Logistica Trieste (PLT): Multi-function terminal in the Adriatic sea
With the majority stake HHLA strategically expands its port and intermodal network
PLT terminal in Trieste HHLA acquired a majority stake of 50.01 % in the multi-function terminal
“Piattaforma Logistica Trieste” (PLT) in the Italian seaport of Trieste
PLT terminal perfectly complements the HHLA network due to its
− favorable geographic location as the most northern port in the Mediterranean
to serve CEE as southern gateway
− potential to link networks between north and south (with east) to provide integrated services
Terminal facilities
− Terminal area of 28 hectare is located in the Free Port of Trieste
PLT
Northern part − Northern part is already handling general cargo transports and offers logistic services
Southern part
− Southern part is newly developed and designed to handle container and RoRo cargo
− Operations and ramp-up of this part will start in the first quarter of 2021
− After ramp-up capacity will comprise a total of approx. 300k TEU, 90k RoRo units
and 700k tonnes of general cargo
− Option to significantly expand capacity through additional adjacent areas
Hinterland transport
Terminal specifications − PLT terminal has its own rail connection
Area ~ 28 ha − METRANS already connects the Port of Trieste with its European intermodal network
Length of quay wall 356 m / 414 m PLT partners are well established Italian companies with both local and international
Maximum draught 9-12 m / 14 m experience
Transaction is expected to be closed in January 2021
September 2020 Investor presentation © Hamburger Hafen und Logistik AG 47Elbe waterway adjustment
After approval by the highest German Court, dredging measures started in July 2019
Adjustment of navigation channel: passing boxes
Two major measures for HHLA
Passing boxes
for extended time slots and more flexiblity to
handle entrance and departure of mega-carriers
Cutting the peaks in the river bed
enables a higher load factor for mega-carriers
The dredging is
scheduled to be
completed in 2021.
Federal Waterways and Shipping Administration
October 2020 Investor presentation © Hamburger Hafen und Logistik AG 48Key figures
Intermodal segment
in € million 2015 2016 2017 2018 2019
Container transport in thousand TEU 1,318 1,408 1,480 1,480 1,565
Revenues 364.0 390.1 414.0 433.8 486.9
EBITDA 78.8 79.6 95.0 112.7 139.0
EBITDA margin in % 21.7 20.4 22.9 26.0 28.6
EBIT 55.2 55.9 69.9 89.1 99.2
EBIT margin in % 15.2 14.3 16.9 20.5 20.4
Segment assets 375.2 405.0 408.1 436.1 585.1
October 2020 Investor presentation © Hamburger Hafen und Logistik AG 49EBIT multiplied several times since realignment
Strategic decision to invest in own assets is a prerequisite to boost utilisation and efficiency
EBIT & EBIT margin Since realignment the
CAGR in million € 99 operating result (EBIT)
2007* – 2019 multiplied compared to
89
8.4%
prior years and
Realignment
significantly
70 outperformed volume
and revenue growth
55 56
Strategic decision to
CAGR 38 39
21%
invest in own assets is
2012 – 2019 20% a prerequisite to boost
18% 17% 27 28 29 27 17%
23.7%
16% 22 23 15% utilization and efficiency
13% 14%
12%
8% 8%
7%
Outlook 2020
2007* 2008* 2009* 2010* 2011* 2012 2013 2014 2015 2016 2017 2018 2019
CAGR Strong decline on
12% 15% 49% previous year
2017 – 2019 Subgroup Subgroup Subgroup
19.1%
EBIT EBIT EBIT
(2019: € 99.2 million)
* 2007-2011 pro forma: applying the ownership structure end of 2018
October 2020 Investor presentation © Hamburger Hafen und Logistik AG 50Intermodal network terminal technology
Coverage and high capacity utilisation matter as important prerequisite for growth going forward
Five hub terminals in the Czech
Republic, Slovakia, Hungary & Poland
Nine inland terminals in the Czech
Republic, Poland, Hungary, Slovakia
and Austria
Around 450 regular train connections
per week
Independent services in the
D-A-CH region since 2012
Projects 2019:
‒ Opening-up of new inland terminal in
Zilina
‒ Putting new locomotives and waggons
into operation
Further targets: Increasing the
frequency of existing connections /
providing new profitable connections
on demand
October 2020 Investor presentation © Hamburger Hafen und Logistik AG 51Focussed capex for higher value added
Approx. € 464 million investment in own assets since 2012
14 Hub and inland terminals
in the hinterland >100 Multi-system locomotives
and shunting engines >2,800 Own designed
light-weighted wagons
Investments
in € million
130,9*
77,1 Focus of investments in 2020
52,3 55,1 on the purchase of locomotives
46,9 44,1 45,7
and wagons in line with transport
12,0 volume development
2012 2013 2014 2015 2016 2017 2018 2019
October 2020 Investor presentation 2019: limited comparability due to first-time application of IFRS 16 © Hamburger Hafen und Logistik AG 52The HHLA on-dock rail terminals
9 sidings suitable for trains >700 m 10 sidings over 700 m long 5 sidings over 700 m long
4 RMGs (half-automated) 4 RMGs 3 RMGs
Upgrading completed Upgrading underway Upgrading according to needs
Biggest container
rail terminal
in Europe
October 2020 Investor presentation © Hamburger Hafen und Logistik AG 53The hub and shuttle system
Every port is linked with a network of hubs and inland terminals
System success derives from a transport design that involves hinterland hubs and shuttle trains plus
comprehensive monitoring of the transport and logistics chain between the seaport and the hinterland customer
October 2020 Investor presentation © Hamburger Hafen und Logistik AG 54Value drivers: Differentiating know-how and service excellence
Know-how and intelligent terminal layout to the customer’s profit
Innovative design of transport system
and terminal layout that is customized
on the special needs of container
transportation
Highly efficient terminal layout
(e.g. 12 trains can be handled at the
same time at the Prague terminal)
CEE terminals operate 24/7/365
High level of value added service
like repair services for containers
and on-site customs services
Offices in the ports of Hamburg,
Bremerhaven, Koper and Istanbul
Experienced management with
entrepreneurial passion and incentive
structures
Engaged and locally well connected
sales force
October 2020 Investor presentation © Hamburger Hafen und Logistik AG 55Value drivers: Equipment
Own locomotives enhance
Own wagon design for Own shunting locomotives
the production quality and
customized container transportation with state-of-the-art technology
improve cost efficiency
More than 2,800 own wagons Metrans owns 40 TRAXX F140 MS Next innovation driver: shunting
Own design and development of locomotives from Bombardier locomotives with hybrid technology
light-weighted waggons with modern Model boasts 7,616 hp and pulls trains Reduction of fuel consumption
braking system weighing up to 2,200 tonnes by up to 50 %
Optimal distribution Multi-system locomotives can be
‒ 92 containers fit on the standard deployed in up to seven different
maximum length of 610 m in CEE electricity grids used all over Europe
‒ 108 containers fit on the standard since it can be operated using both
maximum length of 720 m in WE alternating and direct current
Overall weight of the container No locomotive changes at each border
flat wagon is approximately 30 % saves time and costs and ensures a
lighter than the normal equipment in
high degree of reliability
Europe
October 2020 Investor presentation © Hamburger Hafen und Logistik AG 56Key figures
Logistics segment
in € million 2015 2016 2017 2018 2019
Revenues 65.1 55.0 50.8 59.8 59.0
EBITDA 4.6 2.4 6.9 10.0 8.5
EBITDA margin in % 7.0 4.3 13.7 16.7 14.3
EBIT - 0.8 - 1.7 2.6 5.6 2.5
EBIT margin in % - 1.3 - 3.1 5.0 9.4 4.3
At-equity earnings 3.0 3.7 3.9 4.4 3.0
Segment assets 48.4 62.0 40.9 42.0 55.8
October 2020 Investor presentation © Hamburger Hafen und Logistik AG 57HHLA and HTT form new joint venture
HHLA continues a tradition leading the way in port innovations
HHLA and Hyperloop Transportation Technologies (HyperloopTT / HTT) establish
a joint venture.
The company will focus on integrating the latest container movement innovations
with Hyperloop technology into the largest rail port in Europe.
The goal of the joint venture is to develop and later market a Hyperloop transport
system for shipping containers.
The project will begin with an initial study on connecting a cargo-based Hyperloop
system from the HHLA container terminal CTA to container yards located further
inland.
In general the system aims at expanding the port’s capacity, while reducing
congestion within the port and city area, and lowering the carbon footprint of the
port.
Initially, the construction of a transfer station for testing purposes at the HHLA
terminal CTA in Hamburg is planned, including an initial 100 meter cargo route
along with a special freight capsule and loading dock.
October 2020 Investor presentation © Hamburger Hafen und Logistik AG 58Financial calendar / IR contact
Financial calendar 2020 IR contact
Phone: +49 40 3088 3397
25 March 2020
Annual Report 2019 Fax: +49 40 3088 55 3397
Analyst conference call E-mail: investor-relations@hhla.de
12 May 2020 Web: www.hhla.de
Interim Statement January – March 2020
Analyst conference call
12 August 2020
Half-year Financial Report January – June 2020
Analyst conference call Annual report 2019
20 August 2020
Annual General Meeting (virtual)
12 November 2020
Interim Statement January – September 2020 Visit our latest reports
Analyst conference call http://report.hhla.de
October 2020 Investor presentation © Hamburger Hafen und Logistik AG 59You can also read