31 DECEMBER 2019 FULL YEAR RESULTS - TUESDAY, 25 FEBRUARY 2020 - Spark Infrastructure
←
→
Page content transcription
If your browser does not render page correctly, please read the page content below
31 DECEMBER 2019
FULL YEAR RESULTS
TUESDAY, 25 FEBRUARY 2020
INFRASTRUCTURE FOR THE FUTURE

SPARK INFRASTRUCTURE – AT A GLANCE
ASX-listed owner of leading essential services infrastructure

                                         MARKET                                          Distribution                                         Transmission                                         Renewables
   $3.7bn                                CAPITALISATION(1)
                                         S&P/ASX 100                                     Victoria Power Networks                              TransGrid                                            Bomen Solar Farm
                                                                                         and SA Power Networks

   $6.5bn
                                     REGULATED AND
                                     CONTRACTED ASSET
                                     BASE (PROPORTIONAL)
                                                                         49%
                                                                          SPARK INFRASTRUCTURE
                                                                                                                              15%
                                                                                                                               SPARK INFRASTRUCTURE
                                                                                                                                                                                   100%
                                                                                                                                                                                    SPARK INFRASTRUCTURE
                                                                          OWNERSHIP                                            OWNERSHIP                                            OWNERSHIP

                    $18bn
                    TOTAL ELECTRICITY
                                                                         $10.68bn                                             $7.13bn                                              $0.19bn
                    NETWORK ASSETS(2)                                     REGULATED ASSET                                      REGULATED AND                                        CONTRACTED ASSET BASE
                                                                          BASE                                                 CONTRACTED ASSET BASE                                AT COMPLETION

                     SUPPLYING
                     5.0m+                                                                                                                                                                                          WAGGA
                     HOMES AND BUSINESSES                                    80%                                                  17%                                                   3%                          WAGGA

                    OVER
                    5,300                                                 SKI PROPORTIONAL
                                                                          ASSET BASE(3)
                                                                                                                               SKI PROPORTIONAL
                                                                                                                               ASSET BASE(3)
                                                                                                                                                                                    SKI PROPORTIONAL
                                                                                                                                                                                    ASSET BASE(3)
                    EMPLOYEES

(1) As at 21 February 2020. Balance sheet and other information as at 31 December 2019 (2) Spark Infrastructure has proportional interests in $18bn of total electricity network and contracted generation assets (3) Pro forma

Spark Infrastructure I Investor Presentation I February 2020                                                                                                                                                                      2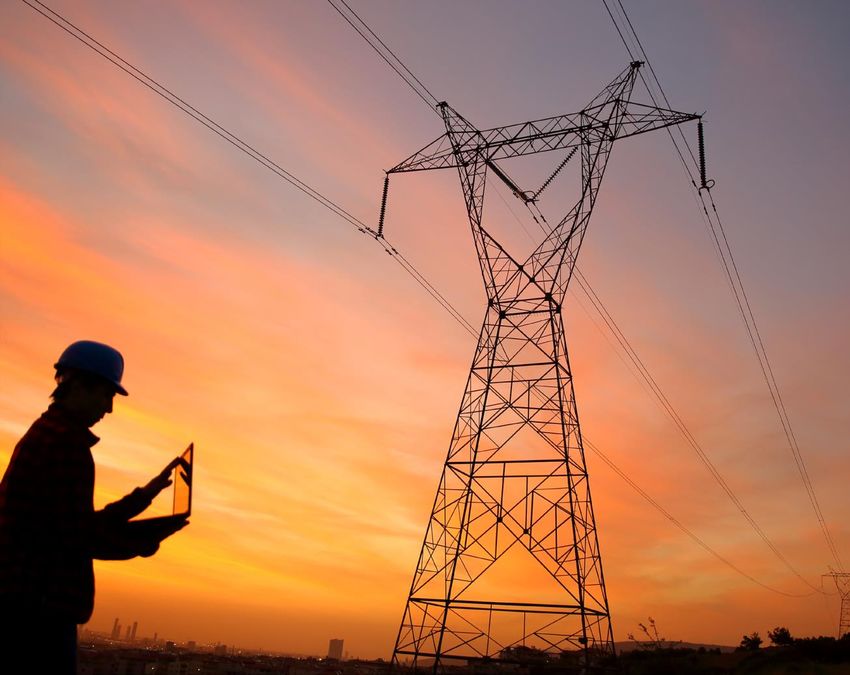
INFRASTRUCTURE FOR THE FUTURE

FINANCIAL HIGHLIGHTS
Strong cash flow from high quality network businesses

                       Look-through net
                                                                                      FY2019                                                Regulated             Contracted
                       operating cash flow(1)
                                                                                      Distribution                                          asset base(2)         asset base(3)

      $379m                                                             15cps                                                $6.2bn
                                                                                                                              Up 2.9%
                                                                                                                                                            $260m
                                                                                                                                                            Up 301.2%
         Up 15.7%
                                                                                      FY2020                                               Growth                 FFO/
                                                                                      Distribution                                         capital                Net debt(5)
                                                                                      guidance                                             expenditure(4)

                                                                        13.5cps                                                $368m                        13.5%
                                                                               at least                                        Up 85.8%                     Up 0.5%

(1)   Includes repayment of shareholder loans and adjusted to exclude tax paid relating to periods other than FY18 and Bomen Solar Farm one-off costs
(2)   On an aggregated proportional basis to Spark Infrastructure
(3)   Includes Bomen Solar Farm and TransGrid CAB on a proportional basis to Spark Infrastructure
(4)   Represents increase in RCAB and Bomen Solar Farm acquisition and construction costs
(5)   Funds From Operations (FFO)/ Net debt on a look-through basis

Spark Infrastructure I Investor Presentation I February 2020                                                                                                                      3
INFRASTRUCTURE FOR THE FUTURE

GROWTH IN EBITDA AND RCAB
As measured across the last four years

                                                  Growth Capex                                                             Adjusted EBITDA
                                                  (Proportional $m)                                                            (Proportional $m)
                                                                                      368                                                          828                    859
                                                                                                                         792
                                                                                                757                                                                       102
                                                                                                                         89                        100
                                                                                                98
                                                                                                                                    CAGR                                  334
                                                                                                                         320                       322
                                                                     199                        274                                 4.3%
                                           153
              121
                                                                                                384                      382                       406                    423

              2016                        2017                       2018             2019     2016                   2017                         2018                  2019
                                           VPN      SAPN       TGD    Bomen                                               VPN         SAPN         TGD

                                                       RCAB                                                           Distribution Payout Ratio
                                               (Proportional $m)                                                               (Proportional $m)
                                                                                      6,466   372                                                         379
                                                                     6,099                                      360                                                         360
              5,747                       5,900                                                                                       328

                                                        CAGR
                                                        4.0%                                                                          82%
                                                                                                               71%                                        67%               71%
                                                                                              66%

              2016                        2017                       2018             2019    2016             2017                  2018                 2019              Avg.
                             VPN       SAPN        TGD (RAB)     TGD (CAB)    Bomen                   Look Through OCF              Distributions P/O Ratio on Look Through OCF

 71% average look-through net operating cash flow payout ratio over the last four years

Spark Infrastructure I Investor Presentation I February 2020                                                                                                                       4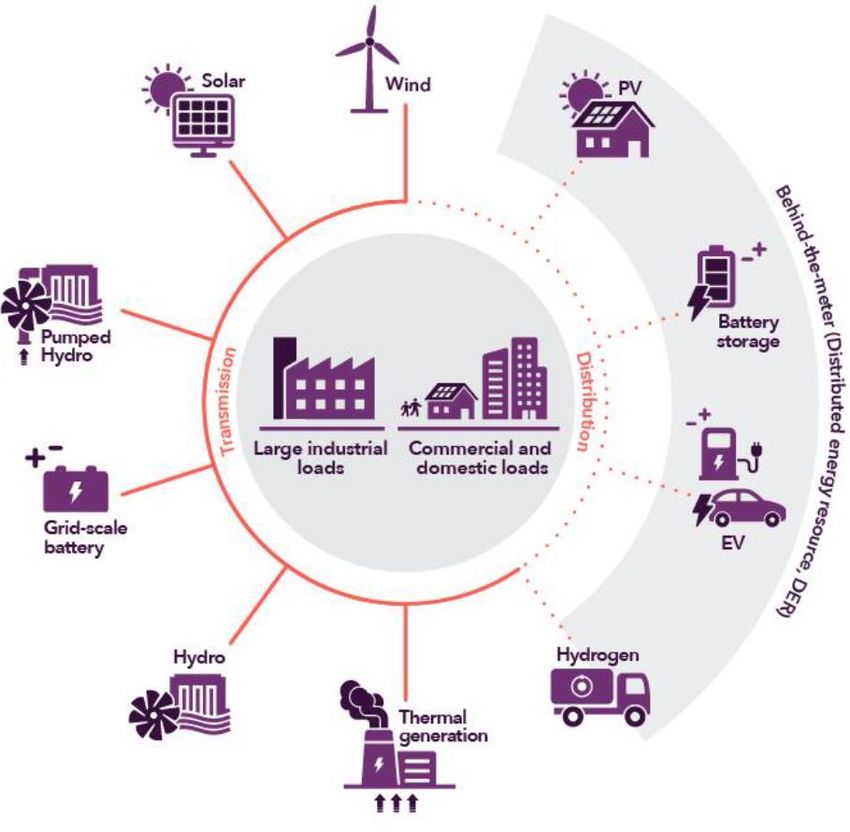
INFRASTRUCTURE FOR THE FUTURE

PERFORMANCE SUMMARY
 Adjusted Proportional Results ($m)(1)                                                    2019                     2018               Change            Proportional
                                                                                                                                                        FY2018 EBITDA                                          $828.2m
 Distribution and transmission revenue                                                   998.1                    963.5                    3.6%
                                                                                                                                                        Change in VPN EBITDA(1)                                  $16.9m
 Other revenue                                                                           150.1                    143.0                    5.0%
                                                                                                                                                        Change in SAPN EBITDA(1)                                 $12.2m
 Total Revenue                                                                        1,148.2                  1,106.5                     3.8%
                                                                                                                                                        Change in TransGrid EBITDA                                 $1.8m
 Operating costs                                                                       (317.3)                 (301.6)                     5.2%
 Beon margin                                                                                 5.5                      4.9                12.2%          Proportional
                                                                                                                                                        FY2019 EBITDA                                          $859.1m
 Enerven margin                                                                            11.2                       7.5                49.3%
 TransGrid unregulated EBITDA                                                              11.5                     10.9                   5.5%         VPN revaluation adjustment(1)                            ($7.4m)

 Adjusted EBITDA                                                                         859.1                    828.2                    3.7%         SAPN revaluation adjustment(1)                             $4.9m

 Net external finance costs                                                            (182.8)                 (181.1)                     0.9%         Statutory Proportional
 Adjusted EBTDA                                                                          676.3                    647.1                    4.5%         FY2019 EBITDA                                          $856.6m
(1) Normalising non-cash adjustments:
VPN: FY 2019: excludes $6.7m negative revaluation adjustment to employee entitlements provisions and $0.2m gain in a credit valuation hedge accounting adjustment
- FY 2018: excludes $0.8m positive revaluation adjustment to employee entitlements provisions and $0.7m loss in a credit valuation hedge accounting adjustment
SAPN: FY 2019: excludes $3.4m public lighting provision release and $0.8m positive revaluation adjustment to employee entitlements provisions and $0.7m loss in a credit valuation hedge accounting adjustment
- FY 2018: excludes $4.9m public lighting provisions and $1.3m positive revaluation adjustment to employee entitlements provisions and $3.4m gain in a credit valuation hedge accounting adjustment. FY 2018 also excludes
release of excess December 2016 storm provisions ultimately not required $3.0m

  Spark Infrastructure adjusted proportional EBITDA has increased by 3.7%

Spark Infrastructure I Investor Presentation I February 2020                                                                                                                                                                 5
INFRASTRUCTURE FOR THE FUTURE

LOOK-THROUGH CASH FLOW SUMMARY
                                                               Victoria Power                    SA Power                                                Spark
Spark Infrastructure share ($m)                                                                                            TransGrid                                          2019      2018    Change
                                                                    Networks                     Networks                                       Infrastructure
EBITDA from operations                                                   415.9                       338.5                         102.2                      -               856.6     828.4     3.4%
less corporate costs                                                          -                           -                             -                (14.8)              (14.8)    (15.8)    -6.3%
less net finance charges                                                 (82.0)                      (62.0)                        (32.3)                   1.2             (175.0)   (174.6)     0.2%
less net reg depreciation/maint. capex (1)                             (128.9)                     (120.7)                         (26.7)                     -             (276.3)   (257.6)     7.3%
less tax paid(2)                                                              -                       (1.3)                             -                (16.9)              (18.1)         -       n/m
Working capital/non cash movements                                         15.3                         2.0                        (10.4)                     -                 6.9    (52.6)       n/m
Net operating cash flows                                                 220.3                       156.5                           32.9                (30.4)               379.3     327.8    15.7%

Growth capex(3)                                                            (112.9)                      (45.2)                     (45.5)                  (164.2)          (367.8)   (198.0)    85.8%
Other                                                                        (6.8)                      (29.2)                        1.6                        -           (34.4)    (25.2)    36.5%
Investing cash flows                                                       (119.7)                      (74.4)                     (43.9)                  (164.2)          (402.2)   (223.3)    80.1%

  Look-through net operating cash flows increased by $51.5m (15.7%) and growth capex increased by $169.8m (85.8%)

(1) Net regulatory depreciation is a proxy for maintenance capex. It is calculated as regulatory depreciation net of actual CPI uplift on RAB
(2) Corporate tax paid related to FY18 of $16.9m. Corporate tax paid related to other periods of $21.8m has been excluded for annualised net operating cash flow purposes
(3) Represents increase in RCAB and Bomen Solar Farm acquisition and construction costs

Spark Infrastructure I Investor Presentation I February 2020                                                                                                                                          6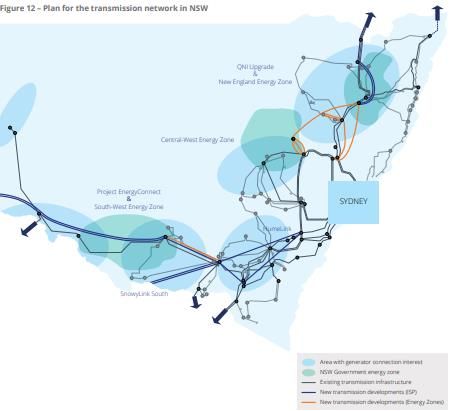
INFRASTRUCTURE FOR THE FUTURE

STANDALONE NET OPERATING CASH FLOW
Net Operating Cash Flow ($m)                                                                            2019                    2018                Change

Investment Portfolio Distributions
Victoria Power Networks(1)                                                                             159.5                   156.9                     1.7%
SA Power Networks                                                                                      116.2                   115.2                     0.9%
TransGrid                                                                                                36.8                    33.0                  11.5%
Total Investment Portfolio Distributions                                                               312.5                   305.1                    2.4%
Net interest received                                                                                     1.2                      0.9                 33.3%
Corporate expenses                                                                                     (14.8)                  (15.8)                   -6.3%
             (2)
Tax paid                                                                                               (16.9)                         -                    n/m
Underlying Net Standalone OCF                                                                          282.0                   290.2                   -2.8%
Underlying Standalone OCF per Security                                                             16.7 cps                 17.3 cps                    -3.5%
Operating costs - Bomen related (3)                                                                      (1.2)                        -                    n/m
                                                        (3)
Transaction bid costs - Bomen related                                                                    (2.6)                        -                    n/m
                     (2)
Other tax paid                                                                                         (21.8)                         -                    n/m
Standalone Net OCF                                                                                     256.4                   290.2                  -11.6%
Spark Infrastructure Distribution per Security                                                     15.0 cps                 16.0 cps                    -6.3%
Underlying Pay-out ratio                                                                                 90%                     92%
Underlying Effective Tax Rate                                                                           5.7%                       n/a

  Cumulative underlying pay-out ratio for the last four years (2016 – 2019) is 89%
(1) Victoria Power Networks distributions include both interest on and repayment of shareholder loans. Repayments of loan principal are classified as investing activities for statutory reporting purposes
(2) Tax paid of $16.9m in 2019 represents the full 2018 tax liability for the SIH2 (SA Power Networks holding company) tax group. Other tax paid of $21.8m has been excluded for net operating cash flow purposes
(3) Bomen costs have been excluded for underlying net standalone operating cashflow purposes
Spark Infrastructure I Investor Presentation I February 2020                                                                                                                                                        7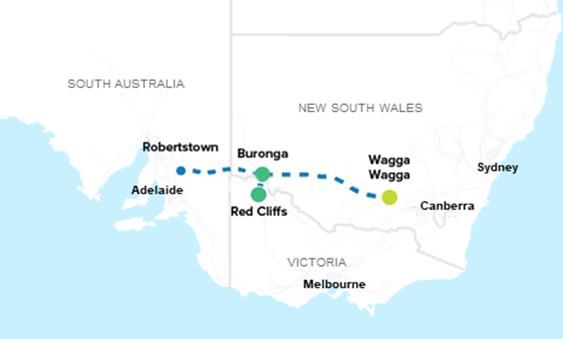
INFRASTRUCTURE FOR THE FUTURE

OUR INVESTMENTS’
FINANCIAL RESULTS
FY2019

Spark Infrastructure I Investor Presentation I February 2020   8

INFRASTRUCTURE FOR THE FUTURE

VICTORIA POWER NETWORKS
Financial ($m)(1)                                                                          2019               2018           Change            CPI-X                    $38.2m
Regulated revenue - DUOS                                                                  956.9               920.6               3.9%
Prescribed metering ("AMI")                                                                 85.7                93.0             -7.8%
                                                                                                                                               STPIS(2)                 $15.0m
Semi-regulated revenue                                                                      60.8                56.8              7.0%
Unregulated revenue                                                                         47.0                48.9             -3.9%
                                                                                                                                               Customer
                                                                                                                                               Growth(3)                2.2%
Total Revenue                                                                           1,150.4            1,119.3                2.8%
Operating costs              (4)
                                                                                        (312.8)            (299.7)                4.4%
                                                                                                                                               Consumption
                                                                                                                                               Growth (3)               0.7%
Beon margin                                                                                 11.3                10.1            11.9%
EBITDA                                                                                    848.9               829.7               2.3%
                                                                                                                                               FTE
                                                                                                                                               Change(3)                2.8%
Other
Net finance costs              (5)
                                                                                        (167.2)            (163.6)                2.2%
                                                                                                                                               Net Debt /
                                                                                                                                               RAB                      70.9%
Net capital expenditure                                                                 (507.6)            (495.7)                2.4%
Distributions received by Spark Infrastructure                                            159.5               156.9               1.7%
                                                                                                                                               FFO /
                                                                                                                                               Net Debt                 15.2%
  On an adjusted EBITDA(4) basis the FY2019 result increased by $34.5m or 4.2%
(1) 100% basis (2) 2017 STPIS result payment in FY2019 (3) Compared with FY2018 (4) FY2019 includes $13.6m negative (non-cash) revaluation adjustments to employee entitlements provisions (FY2018: includes $1.7m
gain) (5) FY2019 includes a $0.4m (gain) in non-cash credit valuation hedge adjustments (FY2018: includes $1.5m loss)

Spark Infrastructure I Investor Presentation I February 2020                                                                                                                                                         9
INFRASTRUCTURE FOR THE FUTURE

VICTORIA POWER NETWORKS
Key Financial Drivers

  Regulated Revenue                               • CPI of 2.08% from 1 January 2019
  Up by 3.9%                                      • X-factors for Powercor: -3.02% and CitiPower: -0.12% representing a real increase in revenue before CPI
                                                  • $15.0m STPIS payment
  Regulated Asset Base                            • RAB increased to $6,339m
  Up by 3.8%                                      • Increase driven by net capex of $481m(1), less regulatory depreciation of $390m, and CPI uplift of $125m

  Other Revenue                                   • Unregulated revenue: down 3.9% – decrease in service level agreement revenue
  (excl. Beon)                                    • AMI revenue: down 7.8% - depreciating RAB
  Down by 2.6%
                                                  • Semi-regulated revenue: up 7.0% – increased connection design services and increased new connections revenue
  Operating Costs(2)                              • Productivity and efficiency improvements
  (excl. Beon)
  Down by 0.7%
  Beon Margin                                     • Continued growth in new solar projects such as Bomen and Haughton Solar Farms
  Up by 11.9%

  Net Capital Expenditure                         • Growth capex of $342.6m down 4.1% (network connections and augmentation) – continuation of REFCL(3) program
  Up by 2.4%                                      • Maintenance capex of $165.1m up 19.1% – zone substation replacement projects
                                                  • Highest ever capex program

 Victoria Power Networks RAB has increased 3.8% over the last 12 months

(1) Excludes corporate overheads (2) Excluding $13.6m negative (non-cash) revaluation adjustments to employee entitlements provisions (FY2018: includes $1.7m gain) (3) Rapid Earth Fault Current Limiter

Spark Infrastructure I Investor Presentation I February 2020                                                                                                                                                10
INFRASTRUCTURE FOR THE FUTURE
SA POWER NETWORKS
Financial ($m)(1) 2019 2018 Change CPI-X $21.2m
Regulated revenue – DUOS 848.8 821.0 3.4%
Semi-regulated revenue 97.3 79.4 22.5%
STPIS(4) $29.3m
Unregulated revenue 14.0 9.7 44.3%
Total Revenue 960.1 910.1 5.5%
Customer
Growth(5) 1.2%
Operating costs (292.2) (269.3) 8.5%
Enerven margin 22.8 15.3 49.0%
Consumption
(5) -0.2%
EBITDA
Other
690.7 656.1 5.3% FTE
Change(5) -3.1%
Net finance costs (3) (138.7) (123.4) 12.4% Net Debt /
RAB 74.5%
Net capital expenditure (405.6) (424.9) -4.5%
Distributions received by Spark Infrastructure 116.2 115.2 0.9%
FFO /
Net Debt 16.7%
On an adjusted EBITDA(2) basis the FY2019 result increased by $25.0m or 3.8%
(1) 100% basis (2) FY2019: includes $6.9m public lighting provision release and $1.6m positive revaluation adjustments to employee entitlements provisions (FY2018: includes $10.0m public lighting provision and $2.7m
positive revaluation adjustment and release of excess December 2016 storm provisions of $6.2m ultimately not required.) (3) FY2019 includes a $1.4m (loss) credit valuation hedge adjustment (FY2018: includes $7.0m gain)
(4) 2016/17 STPIS result payment from 1 July 2018, 2017/18 STPIS result payment from 1 July 2019 (5) Compared with FY2018
Spark Infrastructure I Investor Presentation I February 2020 11INFRASTRUCTURE FOR THE FUTURE
SA POWER NETWORKS
Key Financial Drivers
Regulated Revenue • CPI of 1.78% from 1 July 2019 (1 July 2018: CPI 1.91%)
Up by 3.4% • X-factor applicable from 1 July 2018 was -0.74% and from 1 July 2019 was -0.85% representing a real increase in revenue before CPI
• $29.3m STPIS payment
Regulated Asset Base • RAB increased to $4,340m
Up by 2.2%(2) • Increase driven by net capex of $347m(1), less regulatory depreciation of $321m, and includes CPI uplift of $75m
Underlying Other Revenue • Semi-regulated revenue: up 1.1% - higher public lighting works and increased asset relocation activity, partially offset by a decrease in
Up by 5.3%(4) council funded LED upgrades
Underlying Operating • November and December bushfire event provisions
Costs (Excl. Enerven) • Restructuring and separation costs
Up by 5.6%(3)
• Higher vegetation management costs, emergency response and negotiated services; partially offset by higher capitalisation of
overhead costs due to increased number of capital projects
Enerven Margin • Change in project mix, projects continuing to be undertaken for existing client base (including ElectraNet) but also including new
Up by 49.0% business activity such as commercial solar and battery solutions
• Enerven is engaged in deploying solar and battery capability to a significant number of SA Water sites under a framework contract of
up to $300 million over 2019 and 2020
Net Capital Expenditure • Growth capex of $138.4m, down 8.9% - network connections and augmentation
Down by 4.5% • Maintenance capex of $267.2m, down 2.1%
SA Power Networks has seen RAB growth of 2.2% over the 12 months
(1) Excludes corporate overheads (2) Includes public lighting RAB (3) Excludes 2019 revaluation adjustments to employee entitlements of $1.6m positive (2018: $2.7m positive) and $6.2m release of GSL provisions in FY2018
relating to storms in December 2016, ultimately not required. (4) Excludes public lighting provision write back. In 2019 a long running public lighting dispute was resolved and required amounts were settled with customers in
January 2020. As a result of finalisation of the quantum of this matter, provisions of $6.9m were unwound in 2019. In the prior year a $10.0m provision was made, leading to a $16.9m year on year variance.
Spark Infrastructure I Investor Presentation I February 2020 12INFRASTRUCTURE FOR THE FUTURE
TRANSGRID
Financial ($m) (1) 2019 2018 Change CPI-X(3) $20.5m
Regulated revenue - TUOS 754.5 733.7 2.8%
Other Revenue 5.4 13.2 -59.1%
STPIS(4) $16.2m
Total Revenue 759.9 747.0 1.7%
Regulated operating costs (155.6) (150.2) 3.6%
RAB(5)
Growth 1.5%
Unregulated margin 76.7 72.2 6.2%
EBITDA 681.0 668.9 1.8%
CAB(5)(6)
Growth 47.7%
Other
Net finance costs (2)
(222.2) (251.6) -11.7%
FTE
Change(5) 4.4%
Regulated capital expenditure (254.7) (192.9) 32.0%
Contracted capital expenditure (238.6) (78.4) 204.3%
Net Debt /
RCAB(6)(7) 80.2%
Distributions received by Spark Infrastructure 36.8 33.0 11.5%
FFO /
Net Debt(8) 8.1%
EBITDA for FY2019 result increased by $12.1m or 1.8%
(1) 100% basis (2) FY2018 includes accelerated amortisation of $27m capitalised debt transaction costs resulting from the debt refinancing transaction in June 2018 (3) Relates to period 1 July 2019 to 30 June 2020
(4) 2017 STPIS result payment from 1 July 2018 and 2018 STPIS result payment from 1 July 2019 (5) Compared with December 2018 (6) CAB comprises of unregulated infrastructure and telecommunication assets and
investment property (7) Net Debt is calculated using gross debt less cash and adjusted for prescribed revenue over/(under) collection and includes TransGrid Services (TGS) (8) Relates to Obligor Group
Spark Infrastructure I Investor Presentation I February 2020 13INFRASTRUCTURE FOR THE FUTURE
TRANSGRID
Key Financial Drivers – Regulated Business
Regulated Revenue • CPI of 1.80% from 1 July 2019
Up by 2.8% • X-factor applicable from 1 July 2019 was -0.97% representing a $20.5 million increase in revenues through to 30 June 2020.
• $16.2m STPIS payment
Regulated Asset Base • RAB increased to $6,489m
Up by 1.5% • Increase driven by capital expenditure of $235m, less regulatory depreciation of $265m, and includes CPI uplift of $127m
Operating Costs • Operating Costs increase due mainly to provision for rectification of existing network and property defects including an estimate for
Up 3.6% damage sustained during the November and December 2019 bushfires.
• This increase was partially offset by maintenance efficiencies continuing to be achieved and procurement savings delivered in the
areas of IT, telecommunications operations and insurance placement.
Net Capital Expenditure • Growth capex(1) of $58.4m (up 521.3%)
Up by 32.0% • Maintenance capex of $160.6m (up 8.5%)
• Non-network(2) capex of $35.8m (up 0.8%)
• Increase was mainly due to augmentation capex including Powering Sydney’s Future and Stockdill Switching Station projects, and
maintenance capex
TransGrid has seen RAB growth of 1.5% over the 12 months
(1) Includes Integrated System Plan projects
(2) Includes Network Capability Incentive Project Action Plan (NCIPAP) capex
Spark Infrastructure I Investor Presentation I February 2020 14INFRASTRUCTURE FOR THE FUTURE TRANSGRID Key Financial Drivers – Unregulated Business Contracted Capital • Infrastructure capex up significantly due to an increase in the number of renewable connections projects delivered in FY2019 Expenditure (Limondale, Sunraysia, Finley, Beryl and Metz) Up by $160.2m Unregulated Margin • Infrastructure connection revenues continued to increase in 2019 as construction of connection assets were completed Up by $4.5m • Decrease in line modification revenue was due to the completion of a number of projects, offset by decreased project costs Contracted Asset Base • CAB increased to $637m Up by $205.6m • Increase driven by net capex of $239m and gain on investment property of $6m, less depreciation of $39m TransGrid Services – • TransGrid Services completed its inaugural debt financing of $355m in November 2019 Debt Raising TransGrid has seen CAB growth of 47.8% over the 12 months Spark Infrastructure I Investor Presentation I February 2020 15
INFRASTRUCTURE FOR THE FUTURE
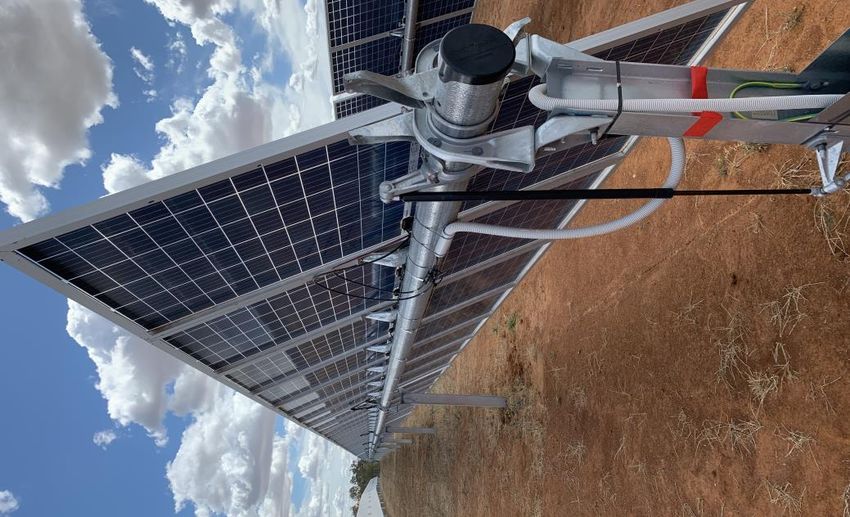
BOMEN SOLAR FARM
EPC Partner, Beon Energy Solutions (Beon) is progressing the project on time and on budget
Key Metrics Project Milestone Target Status
Capacity ~120 MW DC (~100 MW AC) Financial close Apr 2019
Location Bomen, NSW (near Wagga Wagga) Mobilisation to site June 2019
Capacity Factor ~28% Civil works (fencing, trenching and piling) Nov 2019
Annual output at node (P50) ~219 GWh HV works (substation and HV cable) Jan 2020
PPA counterparties (tenor yrs.) Westpac (10) and Flow Power (10,7,5) Mechanical installation Feb 2020
Total cost at completion ~$188m(1) Testing and commissioning Apr 2020
Expected Revenue (P50) ~$13.5m p.a. for first 5 years(2) AEMO registration Pending
Target gearing on completion 65-70% Commercial Operation Q2 2020
Construction and Funding Update Project Location
• All panels were installed on target by end of January 2020
• Solar farm 100% mechanically complete as at early February 2020
• TransGrid completed its negotiated works at the Wagga North Substation
in January 2020
• Testing and commissioning underway
• RES appointed Asset Manager in January 2020
• Beon appointed O&M Contractor in February 2020
• Funding requirements at financial close met from existing cash
• First draw down of debt took place in Q3 2019
(1) Includes purchase of land, construction costs, construction of dedicated transmission line and capitalised interest during construction
(2) Average annual revenue considering PPA agreements, loss factors and plant output on P50 forecast
Spark Infrastructure I Investor Presentation I February 2020 16INFRASTRUCTURE FOR THE FUTURE EFFICIENCY AND REGULATION I N D U S T R Y A N D B U S I N E S S C O N S I D E R AT I O N S Spark Infrastructure I Investor Presentation I February 2020 17
INFRASTRUCTURE FOR THE FUTURE

MAINTAINING LEADERSHIP IN SECTOR EFFICIENCY
Our Investment Businesses have achieved sustainable efficiency over time

                                                                 CitiPower                               Powercor                            SA Power Networks           TransGrid
  Asset                                                        (Distribution)                          (Distribution)                           (Distribution)        (Transmission)
  Company

  AER Total
  Productivity(1)                                                                                           No. 4

  AER OPEX
  Productivity(1)                                                                                                                                      No. 4

  AER State-Based
  Productivity(1)                                                  N/A                                       N/A                                                          N/A

  AER 2018 Productivity
  Change(1)                                                     +4.4%                                  -3.7%(2)                                      +2.7%              +2.0%

 Our productivity performance improves returns and benefit to customers over time

(1) Source: AER Annual Benchmarking Reports 2019 (Electricity distribution network service providers and Electricity transmission network service providers)
(2) AER Benchmarking Report 2019 notes the Powercor productivity decline was attributed to a thirty per cent increase in the number of customer minutes off supply.

Spark Infrastructure I Investor Presentation I February 2020                                                                                                                           18
INFRASTRUCTURE FOR THE FUTURE CONSISTENT SERVICE OUTPERFORMANCE Victoria Power Networks (1) STPIS $m 2016 regulatory year 18 Recovered in 2018 regulatory year 2017 regulatory year 36 Being recovered in 2019 and 2020 regulatory years 2018 regulatory year 20 To be recovered in 2021 regulatory year 2019 regulatory year(2) 26 To be recovered in 2022 regulatory year SA Power Networks(1) STPIS $m 2015/16 regulatory year 28 Recovered in 2017/18 regulatory year 2016/17 regulatory year 23 Recovered in 2018/19 regulatory year 2017/18 regulatory year 36 To be recovered in 2019/20 regulatory year 2018/19 regulatory year(2) 30 To be recovered in 2020/21 regulatory year TransGrid(1) STPIS $m 2016 calendar year 15 Recovered in 2017/18 regulatory year 2017 calendar year 16 Recovered in 2018/19 regulatory year 2018 calendar year 17 Being recovered in 2019/20 regulatory year 2019 calendar year(2) 14 To be recovered in 2020/21 regulatory year Our investment businesses are delivering high reliability to customers (1) Service Target Performance Incentive Scheme (STPIS) 100% basis (2) Preliminary estimate Spark Infrastructure I Investor Presentation I February 2020 19
INFRASTRUCTURE FOR THE FUTURE

SAPN 2020-25 REVISED REGULATORY PROPOSAL
The AER Final Decision in April 2020 will establish revenue certainty until 2025
                                                                      2020-25              2020-25
Regulatory                                   2015-20                                                        The revenue proposed in the Revised Proposal is aligned with
                                                                         Draft            Revised
proposal metric                          Allowance(1)
                                                               Determination(2)         Proposal(2)                        the AER’s Draft Determination

Capex                                                                                                     Standard Control Services Revenue ($m)(1)(2) and RAB ($bn)(3)
                                               $2,009m                $1,263m              $1,712m
($2020)
                                                                                                          $1,000
Opex
                                               $1,363m                $1,466m              $1,442m
($2020)
                                                                                                            $800

WACC                                               6.17%                4.95%                 4.79%         $600
                                                                                                                                                                                              4.87     4.97
                                                                                                                                                                             4.66    4.76
                                                                                                                                                          4.43     4.53
                                                                                                                                                  4.30
                                                                                                            $400               4.00
                                                                                                                                         4.15
Risk-free Rate                                     2.96%                1.32%                 0.96%                    3.97

                                                                                                            $200

Gamma                                                   0.4              0.585                 0.585
                                                                                                              $-
                                                                                                                     FY16     FY17       FY18   FY19     FY20     FY21       FY22   FY23     FY24     FY25
Revenue
                                               $3,882m                $3,905m              $3,916m                  Revenue Allowance        Draft Determination (Revenue)      Revised Proposal (Revenue)
($2020)
                                                                                                                                                         Regulated Asset Base

 The risk-free rate will be updated for the AER’s Final Determination expected in April 2020
(1) AER: SA Power Networks – Final Decision 2015-2020 updated to $2020 (2) SA Power Networks – Revised Proposal 2020-2025, 10 Dec 2019   (3) RAB values from RAB roll-forward mode (RFM) and post-tax revenue
model (PTRM) submitted with SA Power Networks revised regulatory proposal on 10 December 2019

Spark Infrastructure I Investor Presentation I February 2020                                                                                                                                                    20
INFRASTRUCTURE FOR THE FUTURE
VPN 2021-26 REGULATORY PROPOSAL
Final Risk-free Rate to be updated prior to the final decision in April 2021
2016-20 2021-26 2016-20 2021-26
Regulatory VPN’s Regulatory Proposal maintains revenue and continued
CitiPower (CP) CP Regulatory Powercor (PC) PC Regulatory
proposal metric RAB growth
Allowance(1) Proposal(1) Allowance(2) Proposal(2)
Capex Standard Control and Metering Revenue ($m)(1)(2)(5) and RAB ($bn)(4)
$852m $852m $1, 624m $2,140m
($2021)
$1,000
Opex
$472m $569m $1,181m $1,537m
($2021)
$800
WACC 6.11% 4.52% 6.11% 4.52% $600
8.01 8.37
7.61
6.59 7.11
5.72 6.00 6.29
$400 5.27 5.47
Risk-free Rate 2.48% 1.32% 2.48% 1.32%
$200
Gamma 0.4 0.585 0.4 0.585
$-
FY17 FY18 FY19 FY20 FY21 FY22 FY23 FY24 FY25 FY26
CitiPower Revenue Allowance Powercor Revenue Allowance
Revenue(3)
$1,681m $1,599m $3,694m $3,695m CitiPower Proposal (Revenue) Powercor Proposal (Revenue)
($2021)
VPN Regulated Asset Base
A transition period will apply between 1 January 2021 and 30 June 2021 to give effect to the Victorian Government’s intent to delay the
5 year regulatory period
(1) CitiPower, Regulatory Proposal 2021-2026, 31 January 2020 (2) Powercor, Regulatory Proposal 2021-2026, 31 January 2020 (3) Includes metering revenue (4) RAB values from RAB roll-forward mode (RFM) and post-
tax revenue model (PTRM) submitted with CitiPower and Powercor regulatory proposals on 31 January 2020 (5) AER: CitiPower – Final Decision 2016-2020 updated to $2021 and AER: Powercor – Final Decision 2016-2020
updated to $2021
Spark Infrastructure I Investor Presentation I February 2020 21INFRASTRUCTURE FOR THE FUTURE
REGULATORY TIMELINES
Determinations for SA Power Networks and Victoria Power Networks will incorporate lower returns from the AER’s 2018 decisions on the
Rate of Return Instrument (RORI) and tax but revenue will be certain for the five year regulatory periods
QNI QNI CPA PEC CPA Draft Final
CPA Final Decision Final Decision Decision Decision
17 Jan March Q4 Sept April Period
VNI PEC Proposal Revised
Humelink PACR (1) CPA due proposal due commences
PADR(1) 14 Feb Q2 Jan Dec 1 July
10 Jan
2019 2020 2021 2022 2023
SA POWER NETWORKS 2020 to 2025
Proposal Revised Final Draft 6 month Period
submitted Proposal Decision Decision transition commences VICTORIA POWER NETWORKS 2021 to 2026(2)
31 Jan 10 Dec April Sept period 1 July
1 Jan2 TRANSGRID 2018 to 2023 (MAJOR PROJECTS3)
Draft Proposal Period Revised Final
Decision submitted commences proposal Decision TRANSGRID 2023 to 2028
8 Oct 31 Jan 1 July Dec April
Regulatory processes to support delivery of Major Projects are underway in 2020
(1) The Regulatory Investment Test Transmission (RIT-T) and contingent project application (CPA) processes are expected to occur throughout 2020 (2) 6 month transition period will occur between 1 January 2021 and 30
June 2021 as a result of the Victorian Government decision to change the regulatory period cycle to a 1 July commencement date. A 5 year regulatory period will commence from 1 July 2021 (3) Revenue will be adjusted in the
current regulatory period to incorporate the AER’s decisions on CPA’s – Dates subject to change.
Spark Infrastructure I Investor Presentation I February 2020 22INFRASTRUCTURE FOR THE FUTURE
REGULATORY REVIEWS
We will engage and advocate for outcomes that support returns required while delivering lower costs to customers
Review Objective Implementation
AEMO 2020 Integrated System Plan (ISP) Roadmap for Australia’s power system that maximises market benefits Jun 2020
Converting ISP into action Streamline regulatory processes whilst retaining a rigorous cost / benefit
ESB Mid 2020
(proposed rule changes) assessment
Transmission Ring Fencing Reflect changing services offered by transmission businesses; consider
AER Jul 2021
Guideline Review alignment with the 2017 Electricity Distribution Ring-Fencing Guideline
Regulatory Framework for stand Allow customers to benefit from new technology that lowers costs of providing
AEMC 2021
alone power systems regulated services
Sets out approach to estimate rate of return: return on debt, return on equity
AER Rate of Return Instrument (RORI) Dec 2022
and value of imputation credits
Coordination of Generation and Better co-ordinate generation and transmission investment to improve the
AEMC Transmission Investment efficiency of dispatch and location of generators; provide certainty to support 2025
(COGATI) Access and Charging new investment and improve planning information
Develop long-term, fit-for-purpose market framework to enable provision of full
Post 2025 Market Design for the
ESB range of services to customers necessary to deliver a secure, reliable and 2025
National Electricity Market (NEM)
lower emissions electricity system at least-cost
Spark Infrastructure I Investor Presentation I February 2020 23INFRASTRUCTURE FOR THE FUTURE GROWTH THE PLAN AHEAD Spark Infrastructure I Investor Presentation I February 2020 24
INFRASTRUCTURE FOR THE FUTURE
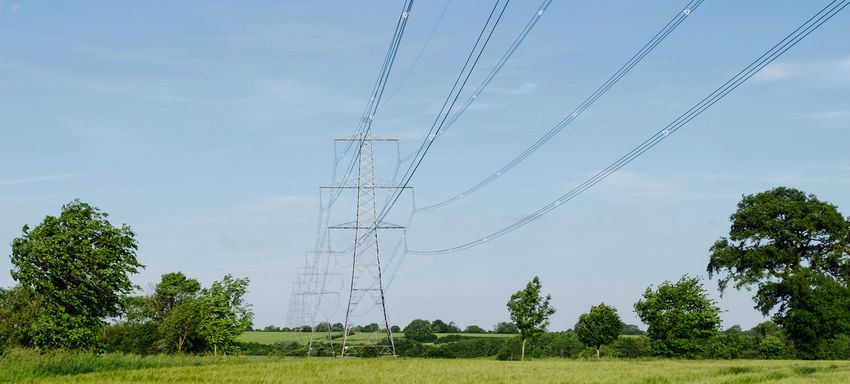
AUSTRALIA’S ENERGY MARKET IS IN TRANSITION
The Australian Energy Market Operator’s (AEMO) Draft 2020 Integrated System Plan (ISP) identifies nationally significant and essential
investments in the electricity system
Key market requirements in the Draft 2020 ISP(1) Networks are critical enablers of the market’s transition
• More than 15 transmission projects including seven near term
critical projects with a combined estimated capital cost of
approximately $11bn(2)
• Targeted grid investment needed to balance resources across
States and unlock Renewable Energy Zones (REZs)
• More than 30 GW of new large-scale renewable energy
• Up to 21 GW of new dispatchable resources to back up
renewables
• Rooftop solar expected to more than double (to ~25 GW),
supplying 22% of total energy by 2040
“If essential investments are delayed or aborted, domestic and
industrial consumers will face increased costs and risks” - AEMO,
Draft 2020 Integrated System Plan
Transmission Distribution
(1) Optimal development path Source: AEMO, Draft 2020 Integrated System Plan
(2) Mid-range of AEMO’s Draft 2020 ISP estimates
Spark Infrastructure I Investor Presentation I February 2020 25INFRASTRUCTURE FOR THE FUTURE
TRANSMISSION INVESTMENT IS A PREREQUISITE
Substantial and sequential investment in the transmission network is required to deliver energy security and reliability, support
proposed generation connections, unlock renewable energy resources and reduce total system costs to customers
Approx. $11bn(1) of AEMO ISP Group 2 AEMO ISP Group 3
network investment AEMO ISP Group 1
Near-term transmission Explore future transmission
More than 50 GW of Priority transmission projects
new generation projects projects
• Critical to address cost, security • AEMO recommends action be • Includes valuable options for
and reliability issues taken during 2020 and 2021 Australia’s future energy system
• Should be either underway or • Seeks to reduce costs, and • No final decision required until
commencing soon enhance system resilience and at least the 2022 ISP
optionality • Potential investments identified
to reinforce network and support
REZ development
Drives $8bn of private
investment
• NSW Government will seek to legislate the requirement for ISP priority projects to proceed
NSW Electricity
Creates > 1,200 jobs
• Projects can proceed ahead of RIT-T
Reduces electricity Strategy
bills by $40 per year • NSW Electricity Strategy includes a pilot 3 GW REZ
(1) Mid-range of AEMO’s Draft 2020 ISP estimates
Spark Infrastructure I Investor Presentation I February 2020 26INFRASTRUCTURE FOR THE FUTURE
GENERATION AND STORAGE WILL FOLLOW
ISP providing a roadmap for changing generation mix
Coal-fired generation is Renewables cost reduction Storage costs continue to
Channels to market evolving
retiring potential slowing decline
NSW Coal-fired generation LCOE projection(1) Lithium-ion battery price outlook
100% 60
1400
50 Solar Wind Observed prices
2017US$/MWh
1200
real 2018 $/kWh
75%
Liddell 40 1000 18% learning rate
(announced) Vales Point 30 800
50%
Eraring 20 600 2024 implied
25% 400 price $94/kWh 2030 implied
(announced) 10 price $62/kWh
Bayswater 13% 200
(announced) 0
0% 0
2020 2022 2024 2026 2028 2030 2032 2034 2036 2010 2013 2016 2019 2022 2025 2028
Source: AEMO Draft ISP dataset (reproduced) Source: NREL, 2019 Annual Technology Baseline Source: Bloomberg NEF (reproduced)
• Existing coal generation becoming • Site specific characteristics now • Batteries expected to play a • Greater corporate PPA appetite
less reliable and more costly to more relevant to overall project significant role in the transition of the • Offtaker may bear more risk
operate economics energy market • Appetite for longer tenor
• Over 8 GW of coal generation • High quality utility-scale wind and • Batteries and pumped hydro to • Premium pricing to support physical
expected to retire by 2032, largely in solar projects have good energy create a demand source for or financial firming
NSW resources, good grid access and renewables
• Re-contracting opportunities will
• Replacement renewable generation access to attractive regions of the • Battery storage can capture emerge during market cycles
required well ahead of retirements NEM arbitrage opportunities, provide enabling PPA tenor extension where
network ancillary services and firm desirable
renewable output
(1) Average prices of all scenarios published
Spark Infrastructure I Investor Presentation I February 2020 27INFRASTRUCTURE FOR THE FUTURE
NSW TRANSMISSION NETWORK OPPORTUNITIES
From mid-2020 under the National Electricity Rules there will be a regulatory requirement to progress the regulatory process and
preparatory work for actionable ISP projects
Bulli Creek Mudgeeraba
TransGrid network Total project Delivery
opportunities indicative cost(1) target TransGrid, Transmission Annual Planning Report
2018-2023 capex allowance $1.2bn N/A
ISP Group 1
(2)$0.2bn QNI upgrade and New
QNI upgrade 2021-22 England Energy Zone
VNI upgrade (2)$0.1bn 2022-23
Project EnergyConnect (2)$1.5bn 2023-24
HumeLink (2)$1.4bn 2024-25
Central West Energy Zone
VNI West (Option 7) $1.9bn 2026-27
Total Group 1 $5.1bn
ISP Group 2
Project EnergyConnect and
South West Energy Zone Sydney
QNI medium $1.5bn 2028-29
ISP Group 3 HumeLink
QNI large $0.7-1.3bn N/A Red Cliffs
NSW grid reinforcements N/A Options being assessed (RIT-T)
$2.4-4.1bn
REZ expansions N/A
SnowyLink South
Total Group 3 $3.1-5.4bn N/A
Area with generator connection interest
NSW Government energy zone Wodonga
Existing transmission infrastructure
Dederang
NSW transmission developments (ISP)
New transmission developments (Energy Zones)
(1) Estimated costs in June 2019 dollars from 2020 Draft ISP Transmission Outlook Summary. Point estimates are the average of the indicative range provided by AEMO
(2) Contingent Project Application (CPA) lodged or expected to be lodged in 2020
Spark Infrastructure I Investor Presentation I February 2020 28INFRASTRUCTURE FOR THE FUTURE
PROJECT ENERGYCONNECT
A key project in delivering grid strength, reliability, and renewable connectivity between NSW and South Australia
Project EnergyConnect (PEC) confirmed in AEMO’s Draft 2020 ISP as a ‘no regret’ project Key Metrics
Expected to be jointly proposed by ElectraNet and TransGrid with the aim to: • Cost: $1.53 billion(1)
• Reduce the cost of providing secure and reliable electricity in South Australia and NSW • Length: 916 km
• Capacity: 800 MW
• Facilitate the long term transition of the energy sector across the NEM to low emission energy
• Voltage: 330 kV
sources; and
• Construction due to start: mid-2021
• Enhance power system security in South Australia and NSW • Jobs: 800 during construction, 700 ongoing
In January 2020, the Australian Energy Regulator (AER) determined that the Regulatory • Next Steps: Contingent Project Application
Investment Test for Transmission (RIT-T) application satisfied the net benefit requirement
Estimated cost in RIT-T application was $1.53 billion (in nominal terms) with a completion date of
2023 to 2024
TransGrid will be responsible for building, owning and operating the line from Wagga Wagga to
the SA border and an augmentation to Red Cliffs (Victoria). The NSW component of RIT-T
application was $1.15 billion
The interconnector route passes though renewable energy zones in SA and NSW, enabling
future renewable projects in these areas to connect to the grid and supply new energy into the
network
(1) SA Energy Transformation RIT-T Project Assessment Conclusion Report, 13 February 2019
Source: https://www.projectenergyconnect.com.au/, TransGrid’s Transmission Annual Planning Report 2019, 2 July 2019, AEMO Draft 2020 Integrated System Plan, 12 December 2019
Spark Infrastructure I Investor Presentation I February 2020 29INFRASTRUCTURE FOR THE FUTURE
POSSIBLE RCAB GROWTH AND DIVERSIFICATION
FY19 Expected Growth(1) Potential Growth(2) Significant Growth Pipeline
EBITDA - Expected FY24 EBITDA - with growth
EBITDA - FY19
• TransGrid growth driven by ISP transmission projects
1% 14% 1%
11% 20%
• Incremental Capex spent on Major Projects will deliver immediate
revenue and will be subject to TransGrid’s current rate of return
• REZ represents further opportunity
84% 78%
89% • Unregulated opportunities for TransGrid Services (TGS) through new
TGD VPN & SAPN TGD VPN & SAPN BOMEN TGD VPN & SAPN BOMEN connections
EBITDA - FY19 EBITDA - Expected FY24 EBITDA - with growth
3% 4% 4% • Renewables opportunities enabled through new transmission and REZ
• Beon and Enerven can enhance portfolio returns
Group 1 ISP transmission projects
97% 96% 96%
Group 2 ISP transmission projects
Regulated Unregulated Regulated Unregulated Regulated Unregulated
NSW Energy Strategy - REZ
CAGR New contestable connections - committed, proposed and future
3.6%
$8,673m >30 GW new renewable generation capacity and complementary storage opportunities
$7,734m
$6,466m
Group 3 ISP transmission projects
Near term Medium Term Longer term
RCAB (Dec 19) RCAB (Dec 24) RCAB
(1) Includes organic growth consistent with latest regulatory proposals (slides 20 & 21), noting these are not final determinations, and TransGrid’s 2018-2023 capex allowance plus an estimate of TransGrid’s proportional
contributions to PEC, QNI minor and VNI minor. (2) Includes expected growth plus TransGrid’s proportional contributions to HumeLink, VNI West, QNI Medium and Group 3 ISP projects totaling ~$5.7 bn and ~$0.5bn on
TransGrid Services new connections investments
Spark Infrastructure I Investor Presentation I February 2020 30INFRASTRUCTURE FOR THE FUTURE STRATEGY CAPITAL MANAGEMENT AND OUTLOOK THE PLAN AHEAD Spark Infrastructure I Investor Presentation I February 2020 31
INFRASTRUCTURE FOR THE FUTURE

STRATEGIC VISION AND PRIORITIES

     OBJECTIVE                                                                                                   BUSINESS MODEL

     Delivering long-term value through capital                                                                  Value Enhance
                                                                                                                 Managing our portfolio for performance
     growth and distributions to Securityholders from                                                            and organic growth through efficient
     our portfolio of high-quality, long-life essential                                                          investment

     services infrastructure businesses
                                                                                                                 Value Build
     By building sustainable businesses and harnessing their evolving                                            Developing adjacent business
     growth potential we will continue to create long-term value for                                             platforms
     Securityholders

                                                                                                                 Value Acquire
                                                                                                                 Growing through disciplined
     ELECTRICITY                     RENEWABLE                 ELECTRICITY   GAS NETWORKS /   WATER NETWORKS /   acquisitions
     NETWORKS                        ENERGY                    STORAGE       GAS STORAGE      WATER STORAGE

Spark Infrastructure I Investor Presentation I February 2020                                                                                              32
INFRASTRUCTURE FOR THE FUTURE
VALUE THROUGH GROWTH AND YIELD
Investing in core growth opportunities while maintaining attractive distributions
Electricity market • AEMO’s ISP identifies nationally significant and essential investment
1 transition is happening • From mid-2020 the development and implementation of ISP will be a regulated requirement(1)
• More than 15 transmission projects identified, including seven near term critical projects, costing
Network augmentation is
2 the enabler
approximately $11bn(2)
• Supports new connections and unlocks renewable energy resources to enable security and reliability
Network investment will • ~$5bn of Priority transmission projects expected to be delivered by mid 2020s
3 grow TransGrid’s RAB • Project EnergyConnect has satisfied RIT-T (Jan 2020)
• Further unregulated opportunities for contracted new connection and renewables investment
Connection and renewable
4 opportunities
• Further network augmentation to unlock Renewable Energy Zones enabling the >50 GW of required new
renewables and flexible generation to connect to the grid
Spark Infrastructure • Portfolio of high-quality, long-life essential infrastructure with substantially regulated revenue
positioned to capture • Disciplined capital allocation to reflect risk adjusted returns on investment opportunities
5 regulated and unregulated • Prudent and flexible capital management
growth opportunities • Delivering long-term value through capital growth and attractive distributions
Essential services infrastructure businesses with increasing growth potential
(1) COAG Energy Council – Converting the Integrated System Plan Into Action
(2) Mid-range of AEMO’s Draft 2020 ISP estimates
Spark Infrastructure I Investor Presentation I February 2020 33INFRASTRUCTURE FOR THE FUTURE
DISCIPLINED CAPITAL ALLOCATION AND MANAGEMENT
PORTFOLIO GROWTH CAPITAL ALLOCATION CAPITAL MANAGEMENT SOLUTION
Value Enhance
(Operating assets) Value Enhance Strategic fit Sources
• RAB growth • Low Risk, Long Life • Retained Cash
cash flow
Retained
• Workforce Capability and Culture • Contracted network infrastructure • Regulated or highly • Dividend Reinvestment Plan
• Maximise Performance Incentives contracted revenues • AssetCo Debt; HoldCo Corporate Debt
• Core expertise
• Extract Cost Efficiencies including ✓ Actionable ISP projects • Strong business capabilities Key Metrics
through Technology at asset and ownership level
EVALUATION
✓ New connections ✓ Long-term Shareholder value
• Optimise Cost of Debt • Portfolio fit and weight ✓ Maintain investment grade credit ratings
✓ Renewable Energy Zones
• Prudent and Efficient Capex programs
• Extract Unregulated Revenues Value Build Asset considerations Sources
through Adjacencies • Late development stage • Specific risks e.g. • Dividend Reinvestment Plan
• Internal experience and capability construction • AssetCo Debt; HoldCo Debt
• Spark Infrastructure as an attractive • Financing risks e.g. • Corporate/Project level: Bank/Capital Markets
Maximise Maximise counterparty for third parties refinancing maturity
NOCF RAB multiple ✓ Renewable generation • Embedded optionality Key Metrics
✓ Battery storage ✓ Long-term Shareholder value
• Exit / deferral options
✓ Renewable Energy Zones ✓ Maintain investment grade credit ratings
YIELD AND VALUE
Financial modelling
Value Acquire • Value accretion; IRR; RAB Sources
Distributions
• Identify complementary asset and EBITDA multiple • Placement; Rights Issue; Share Placement
opportunities • Sensitivity analysis Plan (SPP)
• Prioritise assets with organic growth • Scenario testing: e.g.
DELIVERY
• Convertible/Hybrid/Other
Key Metrics options regulatory cycle • AssetCo Debt; HoldCo Debt
✓ Sustainable distribution payout ratio to • Utilise Spark Infrastructure capabilities
Spark Infrastructure shareholders and attractiveness as counterparty for Key Metrics
Securityholders
considering the look-through NOCF third parties ✓ Long-term Shareholder value
• Share price
over regulatory cycle ✓ Pre-emptive rights on existing assets ✓ Maintain investment grade credit ratings
• Impact on distribution
✓ Maintenance of capital expenditure ✓ Sustainable, long-term essential
including franking
regulatory depreciation infrastructure assets
✓ Maintain investment grade credit
ratings Balanced portfolio with risk-adjusted returns exceeding WACC
Spark Infrastructure I Investor Presentation I February 2020 34INFRASTRUCTURE FOR THE FUTURE
OUTLOOK AND DISTRIBUTIONS
Capital growth and distributions underpinned by strong operational cash flows
Outlook • Growth agenda for TransGrid is substantial, but still subject to regulatory hurdles:
• QNI and VNI contingent project applications (totalling ~$300 million) being assessed by AER
• PEC RIT-T approved in Jan 2020, contingent project application likely to be submitted mid-2020
• A further $3bn+ priority projects expected to advance in planning and approvals during 2020
• SAPN (April 2020) and VPN (April 2021) regulatory determinations will deliver certainty for next 5 years
• Bomen Solar Farm mechanically complete and commissioning underway. Expected to commence commercial
operations in Q2 2020
• Continuing to monitor developments and opportunities in contracted renewables generation
• VPN tax appeal to be heard by full Federal Court in May, with a decision expected late 2020
Distribution guidance • Board declared final distribution for FY2019 of 7.5cps, bringing total distribution for FY2019 to 15.0cps
• DRP will remain active for the FY2019 final distribution at a 2.0% discount (DRP not underwritten)
• Board provides distribution guidance for FY2020 of at-least 13.5cps:
• 7.0cps for 1H20; and at least 6.5cps for 2H20, subject to business conditions. Reflecting:
- Step-up in tax payments for FY2020 as previously foreshadowed
- Expected impact from regulatory determination for SAPN commencing 1 July 2020
• Distribution expected to be covered by look-through net operating cash flows
• Achieved an average payout ratio of 71% of look-through net operating cash flows over the last four years
Spark Infrastructure I Investor Presentation I February 2020 35INFRASTRUCTURE FOR THE FUTURE APPENDIX D E TA I L S O F F Y 2 0 1 9 F I N A N C I A L R E S U LT S Spark Infrastructure I Investor Presentation I February 2020 36
INFRASTRUCTURE FOR THE FUTURE

KEY METRICS
Distributions, RAB, credit metrics and gearing
                                             KEY METRICS                                                        VICTORIA POWER NETWORKS               $m
                                                                                                                RAB(1) (including AMI)              6,339
SECURITY METRICS                                                                                                Net debt                            4,494
Market price at 21 February 2020                                                          $2.18                 Net debt/RAB                        70.9%
Market capitalisation                                                                $3.7 billion
                                                                                                                SA POWER NETWORKS                     $m
DISTRIBUTIONS                                                                                                         (1)
                                                                                                                RAB                                 4,340
2019 actual                                                                            15.00cps
Comprising:                                                                                                     Net debt                            3,232
  - Loan Note interest                                                                   7.05cps                Net debt/RAB                        74.5%
  - Tax deferred amount                                                                  7.95cps
                                                                                                                TRANSGRID                             $m
2020 Guidance                                                                  at least 13.5cps
                                                                                                                RAB(1)                              6,489
CREDIT RATINGS                                                                                                        (1)(2)
                                                                                                                                                     637
                                                                                                                CAB
Investment portfolio credit ratings                                                                                     (1)(2)
                                                                      SA Power Networks: A-                     RCAB                                7,126
                                                                 Victoria Power Networks: A-                                (3)
                                                                            TransGrid: Baa2                     Net debt                            5,718

Spark Infrastructure level credit rating                                                    Baa1
                                                                                                                Net debt/RAB (4)                    88.9%
                                                                                                                Net debt/RCAB                       80.2%
SPARK INFRASTRUCTURE                                                                          $m
Total RAB and CAB (Spark Infrastructure share)                                             6,466
Gross debt at Spark Infrastructure level                                                       40
(1) December 2019 estimate (2) Includes WIP/partially completed assets and investment property
(3) Net Debt is calculated using gross debt less cash and adjusted for prescribed revenue over/(under) collection and includes TransGrid Services
(4) Relates to Obligor Group
Spark Infrastructure I Investor Presentation I February 2020                                                                                                37
INFRASTRUCTURE FOR THE FUTURE
NETWORK BUSHFIRE IMPACT
Not expected to have a material impact upon the businesses
Victorian Power Networks (VPN) SA Power Networks (SAPN) TransGrid (TGD)
• No significant fires across the • Damage was recorded to assets on • Damage was recorded to assets in the
network over the summer bushfire Kangaroo Island with up to 600km of northern and southern parts of NSW
Major Events
period overhead lines impacted
• Interruptions were recorded on the
• Extreme weather conditions during • The Adelaide Hills and Yorke Peninsula also Queensland to NSW interconnector (QNI)
this period did result in storms and recorded damage and the Victoria and NSW Interconnector
strong wind events leading to line (VNI)
faults and outages
• The priority for each of the businesses directly impacted has been to restore safe and reliable power supply to those affected areas
• Both TransGrid and SA Power Networks regulatory determinations include cost pass throughs for “natural disaster events” which covers
fire, flood and earthquake
• The National Electricity Rules (NER) require that the event must meet a materiality threshold being 1% of the maximum allowed revenue
Coverage
(MAR) for the relevant year (the threshold is therefore $7.6m for TransGrid and $8.3m for SA Power Networks)
• TransGrid is still assessing whether this threshold will be exceeded and if so, they intend to pursue this avenue with the AER
• SA Power Network’s early estimations do not indicate the damage will reach the pass through threshold
• TransGrid and SA Power Networks also have liability insurance policies that cover bushfire events
• In the event the conditions for the approved cost pass through’s not met and / or either business is not able to cover losses through
insurance, the cost will be managed within the current opex and / or capex programs
Spark Infrastructure I Investor Presentation I February 2020 38INFRASTRUCTURE FOR THE FUTURE
TAX LITIGATION AND EFFECTIVE TAX RATE
Federal court judgement was that “gifted assets” and cash contributions should be treated as assessable income
• In February 2019, the Federal Court handed down its judgement with effect that:
Assets transferred to VPN from customers (i.e. gifted assets) should be treated as assessable income to VPN; and
Context
For assets constructed by VPN whereby the customer contributes to the cost of construction of such assets, the cash contribution should be treated as
assessable income
• VPN has appealed both matters with the appeal to be heard by Full Federal Court in May 2020; judgment expected late 2020
• Impact to Spark Infrastructure due to investment in SAPN was recognition of $68.8m tax liability in Tax Payable $m
respect of 2015-18, 50% of which has been paid
• Should decision be upheld by Full Federal Court, Spark Infrastructure will continue to be a taxpayer on
Spark Infrastructure Impact
2015-18 Tax Payable 34.4
a go forward basis
2019 Tax Payable 34.4
• Effective cash tax rate approximately 13% of distributions from 2020(1)
• Distributions will contain franking credits to the extent possible Tax Provision at
68.8
31/12/2019
• Should VPN be successful on either or both matters:
• Effective cash tax rate on a go forward basis expected to reduce by up to approximately 6%
• Up to $34.4m (i.e. the tax paid in FY19) will be recovered
• Other impacts not expected to be material: if tax deferred at VPN level, Spark Infrastructure will pay tax on incremental unfranked dividends received
(1) 2020 effective tax rate of ~13.0% based on 2019 tax payable of $34.4m and 2020 distribution of 13.5cps.
Spark Infrastructure I Investor Presentation I February 2020 39INFRASTRUCTURE FOR THE FUTURE
INVESTMENT GRADE FUNDING
Victoria Power SA Power
Issuer TransGrid
Networks Networks
n/a / Baa2(2)
Credit Rating (S&P / Moody’s) A- / n/a A- / n/a
(on USPP notes)
Weighted Average Maturity(1) 5.4 yrs 6.9 yrs 5.1 yrs
(31 December 2018) (5.5 yrs) (5.6 yrs) (6.1 yrs)
Net Debt at 31 December 2019 $4.494bn $3.232bn $5.718bn(3)
(31 December 2018) ($4.369bn) ($3.155bn) ($5.509bn)
Net Debt / RAB at 31 December 2019 70.9% 74.5% 88.9%(2)
(31 December 2018) (71.5%) (74.3%) (87.7%)
Net Debt / RAB + CAB at 31 December 2019 80.2%(3)
N/A N/A
(31 December 2018) (80.7%)
FFO / Net Debt at 31 December 2019 15.2% 16.7% 8.1%(2)
(31 December 2018) (15.3%) (16.6%) (8.2%)
Gross Debt at 31 December 2019 $4.555bn $3.262bn $5.846bn
(31 December 2018) ($4.426bn) ($3.185bn) ($5.634bn)
Spark Infrastructure has increased corporate facilities to $400m; rated Baa1 by Moody’s
(1) Weighted average maturity calculation is based on drawn debt at 31 December 2019 (2) Relates to the Obligor Group (3) Net Debt is calculated using gross debt less cash and adjusted for prescribed revenue over/(under)
collection and includes TransGrid Services
Spark Infrastructure I Investor Presentation I February 2020 40INFRASTRUCTURE FOR THE FUTURE
REGULATED PRICE PATH
CPI minus X(1)
CPI (% ) CPI (% )
Expected Expected
CitiPower Actual X-Factor movement Powercor Actual X-Factor movement
(3) (3)
in revenue % in revenue %
(Forecast) (Forecast)
Year 1(2) 2.50 Year 1(2) 2.50
- - - -
(1 Jan 16) (2.50) (1 Jan 16) (2.50)
Year 2 1.02 Year 2 1.02
0.40 0.62 4.68 -3.71
(1 Jan 17) (2.35) (1 Jan 17) (2.35)
Year 3 1.93 Year 3 1.93
-0.05 1.99 -0.81 3.08
(1 Jan 18) (2.35) (1 Jan 18) (2.35)
Year 4 2.08 Year 4 2.08
-0.12 2.20 -3.02 5.16
(1 Jan 19) (2.35) (1 Jan 19) (2.35)
Year 5 1.59 Year 5 1.59
-1.88 3.50 -2.40 4.03
(1 Jan 20) (2.35) (1 Jan 20) (2.35)
• Regulated electricity network revenues are determined by a price path set according to the CPI-X(1) formula. A negative X-factor means
a real increase in distribution tariffs
• The regulatory pricing period currently commences from 1 January for Victoria Power Networks (CitiPower and Powercor) but will be
adjusted to a 1 July from 2021, SA Power Networks and TransGrid are from 1 July each year
• Whilst CPI-X is the key underlying driver for year on year revenue movements, the revenue movements in reported results include
adjustments for other factors
(1) Whilst referred to as “CPI-X”, the actual tariff increase formula used by the regulator is: (1+CPI)*(1-x)-1. Source: AER
(2) No CPI-X was applied in 2016. The AER calculated the revenue cap as a dollar amount
(3) Excludes over or under recovery and S factor revenue
Spark Infrastructure I Investor Presentation I February 2020 41INFRASTRUCTURE FOR THE FUTURE
REGULATED PRICE PATH
CPI minus X(1)
CPI (% ) CPI (% )
Expected Expected
SA Power Actual Actual
X-Factor movement in TransGrid X-Factor movement in
Networks (2) (2)
revenue % revenue %
(Forecast) (Forecast)
(4)
Year 1 1.72 Year 1 n/a n/a
28.00 -26.80 n/a
(1 Jul 15) (2.50) (1 Jul 18) n/a n/a
Year 2 1.69 Year 2 1.80 -0.97
-7.13 8.90 2.79
(1 Jul 16) (2.50) (1 Jul 19) (2.45) (-1.98)
Year 3 1.48 Year 3 1.80 -0.17
-0.94 2.40 1.97
(1 Jul 17) (2.50) (1 Jul 20) (2.45) (-1.98)
Year 4 1.91 Year 4
-0.74 2.66
(1 Jul 18) (2.50) (1 Jul 21) (2.45) (-1.98)
Year 5 1.78 Year 5
-0.85 2.65
(1 Jul 19) (2.50) (1 Jul 22) (2.45) (-1.98)
(1) Whilst referred to as CPI-X, the actual tariff increase formula used by the regulator is: (1+CPI)*(1-x)-1. Source: AER
(2) Excludes over or under recovery and S factor revenue
(3) Based on the AER’s advice on the X-factor applicable to the MAR calculation for 2017/18 transmission pricing.
(4) The AER’s determination set the MAR for 2018/19 so no CPI-X calculation is applied. The MAR for 2018/19 is $734.3m or 5% higher in nominal terms than the actual MAR for 2017/18
Spark Infrastructure I Investor Presentation I February 2020 42INFRASTRUCTURE FOR THE FUTURE
SEMI REGULATED REVENUES (100% BASIS)
Victoria Power Networks ($m) 2019 2018 Variance
Public Lighting 11.9 12.2 (0.3)
New Connections 15.1 14.2 0.9
Special Reader Activities 4.6 4.5 0.1
Service Truck Activities 5.9 5.6 0.3
Recoverable Works 2.2 3.1 (0.9)
Specification and Design 13.3 10.8 2.5
Other 7.8 6.4 1.4
TOTAL 60.8 56.8 4.0
SA Power Networks ($m) 2019 2018 Variance
Public Lighting 23.5 6.8 16.7
Metering Services 15.7 16.1 (0.4)
Pole/Duct Rental 3.9 6.0 (2.1)
Other Negotiated Services (1) 54.2 50.5 3.7
TOTAL(2) 97.3 79.4 17.9
(1) Includes Asset Relocation and Embedded Generation
(2) Does not include Alternative Control Services (ACS) revenue, which is reported as part of DUOS revenue
Spark Infrastructure I Investor Presentation I February 2020 43INFRASTRUCTURE FOR THE FUTURE UNREGULATED REVENUES (100% BASIS) Victoria Power Networks ($m) 2019 2018 Variance Beon Energy Solutions 239.5 166.5 73.0 Service Level Agreement Revenue 22.7 24.7 (2.0) Telecommunications 1.1 1.3 (0.2) Joint Use of Poles 4.1 3.7 0.4 Other 19.1 19.2 (0.1) TOTAL 286.4 215.4 71.2 SA Power Networks ($m) 2019 2018 Variance Energy Infrastructure and Solutions 268.2 187.7 80.5 Facilities Access / Dark Fibre 1.9 2.2 (0.3) Asset Rentals 3.8 4.0 (0.2) Sale of Salvage 1.7 1.6 0.1 Other 6.6 1.9 4.7 TOTAL 282.2 197.4 84.8 TransGrid ($m) 2019 2018 Variance Infrastructure Services 104.0 136.4 (32.4) Property Services 5.0 5.0 - Telecommunication Services 11.0 8.1 2.9 TOTAL 120.0 149.5 (29.5) Spark Infrastructure I Investor Presentation I February 2020 44
INFRASTRUCTURE FOR THE FUTURE

CAPITAL EXPENDITURE (100% BASIS)
                                                               CAPITAL EXPENDITURE
                                                                    Victoria Power
$m                                                                                 SA Power Networks                        TransGrid                   Totals
                                                                      Networks
                                                                   2019           2018       2019            2018         2019       2018        2019          2018
Growth capex                                                       342.6          357.2      138.4       151.9            58.4           9.4    539.4          518.5
Growth capex - non prescribed                                             -              -          -               -    238.6           78.4   238.6            78.4
                             (1)                                                                                                                 35.8            35.5
Non-network capex                                                         -              -          -               -     35.8           35.5
Maintenance capex                                                  165.0          138.5      267.2       273.0           160.6       148.0      592.8          559.5
Total                                                              507.6          495.7      405.6       424.9           493.4       271.3      1,406.5     1,191.9
Spark Infrastructure share                                         248.7          242.9      198.7       208.2            74.1           40.7   521.5          491.8
Change vs pcp (%)                                                          2.4%                      -4.5%                       81.9%                  6.0%

                                                                  Maintenance capex            Regulatory               Less inflation uplift    Net regulatory
$m
                                                                        spend                 depreciation                    on RAB              depreciation
                                                                   2019           2018       2019            2018         2019       2018        2019          2018
Victoria Power Networks                                            165.0          138.5      389.5       365.8           (126.4)     (113.1)    263.1          252.6
SA Power Networks                                                  267.2          273.0      321.0       308.3           (74.7)      (79.2)     246.3          229.1
TransGrid                                                          160.6          148.0      265.3       260.5           (126.5)     (116.8)    138.8          143.7
Total                                                              592.8          559.5      975.8       934.6           (327.6)     (309.2)    648.2          625.4
Spark Infrastructure share                                         235.9          223.8      388.0       369.4           (117.5)     (111.8)    270.5          257.6
(1) Non-network capex includes NCIPAP
Spark Infrastructure I Investor Presentation I February 2020                                                                                                            45
You can also read