Teleflex Investor Presentation - Teleflex Incorporated
←
→
Page content transcription
If your browser does not render page correctly, please read the page content below

Teleflex Investor Presentation

1

Forward Looking Statements

    This presentation and our discussion contain forward-looking information and statements, which inherently
    involve risks and uncertainties that could cause actual results to differ from those projected or implied in the
    forward–looking statements. These statements involve known and unknown risks, uncertainties and other factors
    that may cause actual results or events to differ materially from those anticipated in such forward-looking
    statements, including those risks and uncertainties discussed in our SEC filings, including our most recent
    Annual Report on Form 10-K. The forward-looking statements included in this presentation should not be unduly
    relied upon. These statements speak only as of the date made. Other than as required by applicable law, we do
    not intend, and do not assume any obligation, to update these forward-looking statements.

    This presentation reflects continuing operations.

2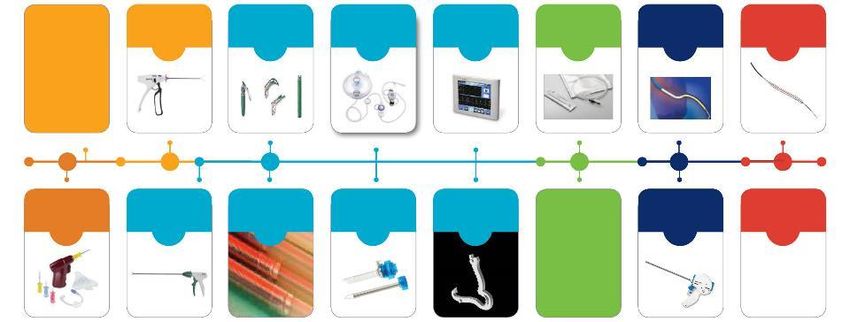
Making a Difference

                                              Teleflex products are used everyday:

    31,000                                                                                                                         1,600
    In 31,000 surgical procedures                                                                                                  To help more than 1,600 patients who
    in the United States                                                                                                           require vascular access intervention
                                                                                                                                   globally

    6,000                                                                                                                          3,200
    To care for more than 6,000                                                                                                    By emergency responders to treat
    patients globally in the Intensive                                                                                             3,200 patients in the field globally
    Care Unit

     Statistics included in the graphic above were calculated based on 2016 sales data, and management assumptions and estimates
3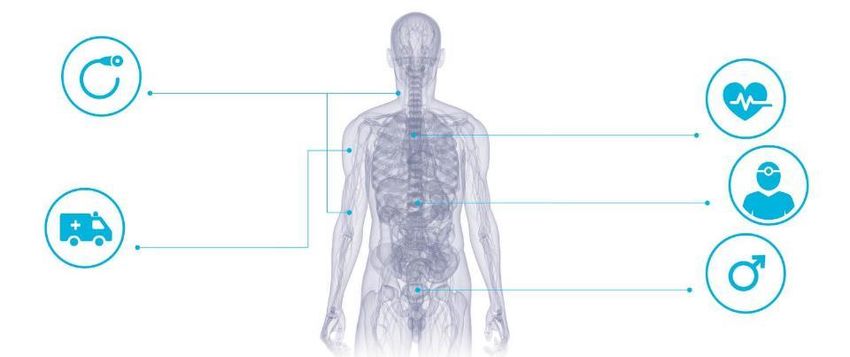
Demographics and Industry Trends in Our Favor

                                           10,000People turn 65 in the
                                                   U.S. everyday1

                                                                                                       Lower acuity patients
                                                                                                       moving to lower cost

                                                       1.1B People 50+
                                                                                                         sites of service

                                                         in Asia by 20252

    1. Pew Research Center: http://www.pewresearch.org/fact-tank/2010/12/29/baby-boomers-retire/
4
    2. APACMed: http://www.apacmed.org/content/uploads/2017/02/APACMed-Annual-Report-2016-online.pdf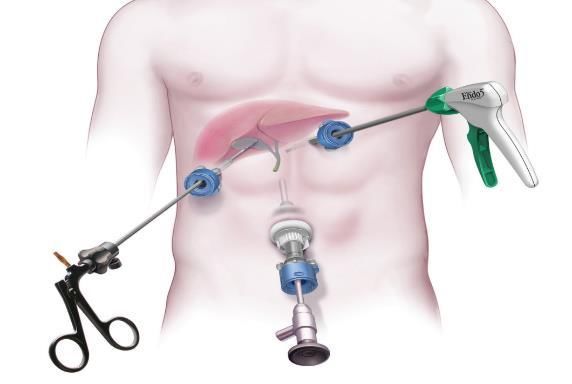
Teleflex Investment Thesis

             Global                                        • Leading positions in growing markets (vascular, interventional access, interventional urology)
           Leadership                                      • Established and respected global brands

                                                           • Global scale to succeed in today’s healthcare marketplace
          Unique Size
                                                           • More nimble than larger device companies

                                                           •    Constant currency revenue growth accelerates to 8.1% in FY19
        Track Record                                       •    660 basis point adjusted gross margin expansion 2015 – 2019
        of Execution                                       •    580 basis point adjusted operating margin expansion 2015 – 2019
                                                           •    Adjusted earnings per share CAGR 15.2% 2015 – 2019

    Note: See appendicies for reconciliations of non-GAAP financial measures to the most comparable GAAP financial measures.
5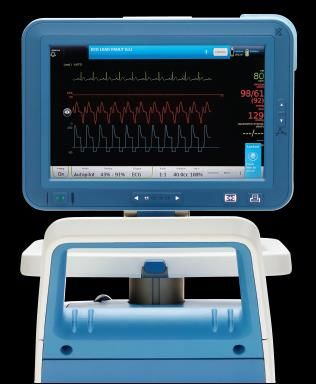
Segment Revenue Review
                                           As-
                                                               Constant
    Dollars         FY’19      FY’18     Reported   Currency
                                                               Currency
    in Millions    Revenue    Revenue    Revenue     Impact
                                                                Growth
                                          Growth

    Americas       $1,492.3   $1,351.7    10.4%      (0.2%)     10.6%

    EMEA           $588.1     $603.8      (2.6%)     (5.3%)     2.7%

    Asia           $294.3     $286.9      2.6%       (4.2%)     6.8%

    OEM            $220.7     $206.0      7.2%       (1.0%)     8.2%

    TOTAL          $2,595.4   $2,448.4    6.0%       (2.1%)     8.1%

6
Global Product Category Revenue Review
                                                                                                    As-
                                                                                                                                                Constant
    Dollars                                        FY’19                   FY’18                  Reported                  Currency
                                                                                                                                                Currency
    in Millions                                   Revenue                 Revenue                 Revenue                    Impact
                                                                                                                                                 Growth
                                                                                                   Growth
    Vascular Access                                 $600.9                  $575.3                     4.4%                    (1.9%)            6.3%
    Interventional                                  $427.6                  $395.4                     8.1%                    (1.7%)            9.8%
    Anesthesia                                      $338.4                  $349.4                   (3.1%)                    (2.6%)            (0.5%)
    Surgical                                        $370.1                  $358.7                     3.2%                    (2.5%)            5.7%
    Interventional
                                                    $290.5                  $196.7                   47.6%                     (0.2%)            47.8%
    Urology
    OEM                                             $220.7                  $206.0                     7.2%                    (1.0%)            8.2%
    Other1                                          $347.3                  $366.9                   (5.3%)                    (2.9%)            (2.4%)
    TOTAL                                         $2,595.4                $2,448.4                     6.0%                    (2.1%)            8.1%
7   1. Includes revenues generated from sales of the Company’s respiratory and urology products (other than interventional urology products).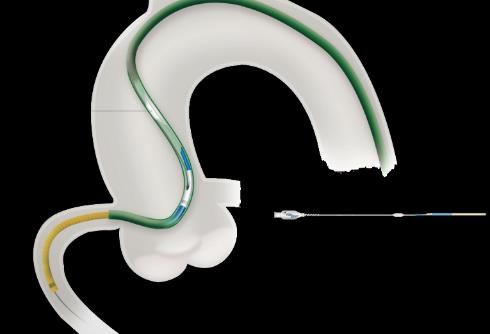
Constant Currency Revenue Growth
    (in millions)
                                                                                                                       $2,595
                                                                                                                                8.1%
           $2,550                                                                                             $2,448            Constant
           $2,350                                                                                                               currency
                                                                                                     $2,146                      revenue
           $2,150                                                                                                               growth in
           $1,950                                                                           $1,868                                 2019
                                                                            $1,840 $1,810
           $1,750                                                  $1,696
                                                    $1,551
           $1,550                  $1,493

           $1,350
           $1,150
               $950
               $750
                                    2011             2012          2013     2014   2015     2016     2017     2018     2019
8   Bar chart depicts as reported total annual Teleflex revenues
Track Record of Adjusted Operating Margin Expansion

                                                               Adjusted Operating Margin

                                                                                                                          +10 bps
                                                                                                         +100 bps +60 bps
                                                                                        +260 bps
                                                                                                            25.1% 25.7% 25.8%
                                                                        +150 bps 24.1%
                                                                           21.5%
                                                           20.0%

                                                             2014            2015            2016            2017            2018             2019

9   Note: Figures represent adjusted operating margin. See Appendices for reconciliation of non-GAAP financial measures to the most comparable GAAP financial measures.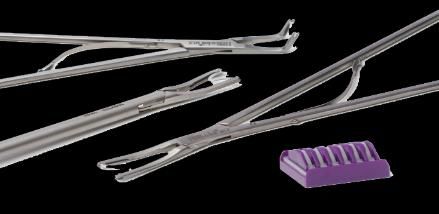
Core Strategic Building Blocks
                                  Teleflex is a Differentiated Med Tech Asset

  Drive Constant           Deliver Non-Revenue           Continue to be a           Align Portfolio         Continue to Attract
     Currency               Dependent Margin              Serial Acquirer           with Favorable             Key Talent
 Revenue Growth                 Expansion                                           Demographics

• Address major            • Execute restructuring     • Acquire high-growth,    • Focus product suite on   • Focus on culture
  healthcare challenges      and footprint               high-margin               procedures that cannot   • Live our core values
• Improve outcomes           realignment initiatives     businesses with           be postponed
                                                         differentiated assets                              • Keep people at the
  with less invasive,      • Take more of our                                    • Focus commercial           center of all we do
  evidence-based             business direct           • Focus on scale            efforts in geographies
  procedures               • Leverage M&A across         and late stage            with improving
• Accelerate long term       global infrastructure       technologies              demographics
  revenue growth through                               • Improve process with
  scale M&A                                              each transaction

 10
Teleflex 2021: 3 Year Growth Drivers
High growth
company
with gross and
operating margin
expansion
Execute
Leverage strategic
global M&A
Drive infrastructure
Medium Continued utilization
Invest in cadence in growth
growth key disease of new product
company states product categories
with gross and launches
operating margin
expansion
2018 2021
11Invest in Key Disease States and Markets
Catheter complications
Drive utilization
Interventional procedures
Drive utilization/
grow market share
Percutaneous laparoscopy
Grow market share
Anesthesia and
emergency medicine
Drive utilization
Men’s health
Drive utilization
12Drive Utilization in Growth Product Categories
Current Portfolio
Interventional Vascular Airway
Urology Intraosseous Access Access Management Interventional Cardiology
The UroLift® EZ-IO® OnControl® Rüsch® Polaris™ Fiber Chocolate® MANTA™
Intraosseous Vascular Powered PICCS Optic Single-Use
Turnpike® TrapLiner® PTCA Balloon Vascular Closure
System Access Device Bone Access System Laryngoscope Blade
Catheters Catheter Device
Catheter
Pipeline^
EZ-PLAZ® The UroLift®
Freeze-dried
Plasma 2 System
13 ^EZ-PLAZ and the UroLift 2 System are not approved for sale or distribution.Leverage Global Infrastructure
Strategies
• Realize margin expansion through ongoing
restructuring initiatives
• Leverage recent go-directs to strengthen
control of commercial channels in Europe
and Asia
• Drive adoption of high margin products in new
markets
ORANGE: Americas
BLUE: Europe, Middle East and Africa
GREEN: Asia Pacific
14Execute Disciplined M&A Strategy
Acquisition Criteria M&A Focus
• Fits existing business units and call points
1 Scale
• Provides superior clinical benefit
to existing alternatives
• Provides cost-benefit to the hospital
2 Dealer to direct
• Strong IP and patent protection
• Long product life cycles 3 Late stage technology
4 Reverse integration
15Track Record of Value Creating Acquisitions
Mini-Lap Truphatek
Ace Medical Nostix, LLC CarTika Vascular QT Vascular
Technologies, Holdings
US, LLC Medical, Inc. Solutions, Inc.
Inc. Limited
Mayo 2014 2015 2015 2015 2016 2017 2018
Healthcare
Pty. Ltd.
2014
‘13 ‘14 ‘15 ‘16 ‘17 ‘18
Vidacare Human Medics Trintris N. Stenning Atsina NeoTract, Inc. Essential
Corporation Co., Ltd. Medical, Inc. & Co. Pty. Ltd Surgical, LLC Medical
2013 2015 2015 2015 2015 Teleflex Medical 2017 2018
Private Limited
& New Zealand
distributors
2016
16Key Investment Highlights
Diversified, global medical technology company
Well-positioned to take advantage of favorable industry dynamics
Leading market positions with established global brands
Diversified customer and supplier base
Strong cash flow generation and proven history of deleveraging and margin expansion
Experienced management team
17THANK YOU 18
19

     Appendix A:
     Key Products

19
NeoTract: A Compelling Growth Asset
Significant Market • Initial target market 8.5M U.S. BPH drug or drug drop out patients;
Opportunity >$30B total addressable market
• 2 randomized controlled trials; 7 single arm studies
Exceptional
• >25 peer-reviewed publications
Clinical Data
• 5 year follow-up data published
• CPT1 code January 2015
Established
Reimbursement • 100% covered by Medicare administrative contractors; broad
commercial payor coverage
Strong Commercial • High quality commercial sales force & management team
Infrastructure • Strong IP position and scalable manufacturing
20Very Large Clinical Need and Market Opportunity
0.3
Surgery
Drug drop out 1.5
8.5 Million
Men on drugs or drug drop out
UroLift® System target market
Drugs 7.0
$30B TAM
Watchful waiting 3.2
12.0 Million U.S. men treated for BPH1
#Men (millions)
21 1. NeoTract internal market estimates for 2016Simple, Straightforward Procedure
Nitinol
Capsular Tab
Apply Lidocaine Gently push Relieve obstruction
PET Suture
jelly/oral sedative^ tissue aside
Typically same
Insert delivery system Deploy customized implants day discharge Stainless Steel
Urethral End Piece
(4-6 Avg)
22 ^ This does not account for the physician’s preferred anesthesia protocol.UroLift 2
One implant per cartridge
UroLift Implant design
remains the same
23 The UroLift 2 is not approved for sale or distributionReducing Tradeoffs Between Effectiveness
and Risk Compared to Drugs
Time to First Evidence of Symptom Improvement Incidence of Sexual Dysfunction^5,7
Statistically Significant at 10-16 Months5,6,7
Relief (Weeks)1,2,3,4,5
Mean AUASI Reduction Ejaculatory Dysfunction Erectile Dysfunction
12- 10.8 0%-
24 10%
8%
5.6-
7.5 3%-
4% 5%
1-3 3.4
2
0% 0%
5ARI AB 5ARI AB 5ARI AB 5ARI AB
DRUGS: 5ARI = 5 alpha reductase inhibitors AB = alpha blockers
Symptoms measured by AUASI (American Urological Association Symptom Index)
^ Sexual Dysfunction defined as new, onset sustained erectile or ejaculatory dysfunction.
1. Roehrborn, Rev Urol 2009; 11(suppl 1): S1-S8; 2. Rossi, Drug Des, Dev and Therap 2010; 4: 291-297 3. Pearson, Am Fam Phys 2014; 90 (11): 769-774; 4. Cindolo, Eur Urol 2015
Sep; 68(3): 418-25; 5. Roehrborn, J Urol 2013; 190: 2161-2167; 6. Sonksen, Eur Urol 2015; 68: 643-652; 7. AUA Guidelines 2003, 2010, 2014, which address a range of outcomes
24 across alfuzosin, doxazosin, tamsulosin, and terazosin for ABs and only finasteride for 5ARIsAnesthesia and Emergency Medicine: Arrow® EZ-IO®
Intraosseous Vascular Access Device
Top Market Trends
• >137 million visits to the emergency room in the U.S.
annually1
• There are >500,000 adult occurrences of cardiac arrest
yearly in the US with an estimated 10% survival rate2
• Sepsis kills a patient in the U.S. every 2.3 Minutes.3 As
many as 80% of sepsis deaths could be prevented with
rapid diagnosis and treatment4
Growth Strategy
• Continued leadership in professional, clinical and
product training
• Methodical training on protocol for optimal outcomes
• Expand IP position in mechanical intraosseous
access segment
1. CDC: National Hospital Ambulatory Medical Care Survey: 2015 Emergency Department Summary Tables
2. Mozaffarian D, Benjamin EJ, Go AS, et al: on behalf of the American Heart Association Statistics Committee and Stroke Statistics Subcommittee. Heart disease and stroke statistics—2015
update: a report from the American Heart Association. Circulation. 2015;131:e29–e322. DOI: 10.1161/CIR.0000000000000152.
3. Marik PE. Surviving sepsis: going beyond the guidelines. Ann Intensive Care. 2011. doi:10.1186/2110-5820-1-17.
25 4. Kumar et al. Duration of hypotension before initiation of effective antimicrobial therapy is the critical determinant of survival in human septic shock. CritCare Med. June 2006;34(6)1589-96.Anesthesia/Emergency Medicine: EZ-PLAZ® FreezeDried Plasma
EZ-PLAZ® FreezeDried Plasma
Top Market Trends
• >137 million visits to the emergency room in the U.S.
annually1
• Minimal plasma availability in challenging environments
(e.g. prehospital, remote/rural, battlefield settings), despite
demand and opportunity to save many lives
• Traumatic injuries with hemorrhage require plasma
transfusion to stop life-threatening bleeding
• FDA and DoD launched joint program to expedite medical
products intended to save lives of
US military; including freezedried plasma
EZ-PLAZ® Sterile Water Fluid Blood
Growth Strategy FDP unit for Injection transfer set for
(equivalent to (SWFI) 250ml set transfusion
• Partner with military through accelerated BLA one FFP unit)
regulatory pathway; conduct confirmatory
efficacy study post licensure
• Establish battlefield (medic) or
prehospital/remote settings (EMS paramedic)
1. CDC: National Hospital Ambulatory Medical Care Survey: 2015 Emergency Department Summary Tables
26 EZ-PLAZ is not approved for sale or distributionEZ-PLAZ® FreezeDried Plasma Market
Market Size Estimate
Government
~$20M -
Total market size
$25M
Civilian*
$ ~$100M
~$70M -
$75M
Source: Management estimates
*Does not include civilian trauma hospitals
EZ-PLAZ is not approved for sale or distribution
27Interventional Procedures
Top Market Trends
TrapLiner® Catheter
• Coronary artery disease is the most common type of
heart disease in the US – cause of more than 370,000
deaths annually1
• Over 1 million percutaneous coronary interventions
(PCI) are performed in the US every year2
• Approximately 8.5 million Americans suffer from
peripheral arterial disease (PAD)3
Growth Strategy
• Expand new product pipeline Arrow® AC3 Optimus ®
Intra-Aortic
• Build brand awareness Balloon Pump
• Expand professional
education programs
• Deliver growth through M&A
1. CDC: https://www.cdc.gov/heartdisease/facts.htm
2. Mozaffarian D, et al. (2016). Heart disease and stroke statistics-2016 update: a report from the American Heart Association. Circulation. 133(4):e38-e360.
28 3. CDC: https://www.cdc.gov/dhdsp/data_statistics/fact_sheets/fs_pad.htm - Roger VL, Go AS, Lloyd-Jones DM, et. al. Heart Disease and Stroke Statistics 2011 Update: A Report From the American Heart
Association. Circulation 2011;123:e18-e209..ARROW® OnControl® Powered Bone Access System
Powered bone marrow biopsy device vs.
~$160M manual biopsy devices:
• Consistently larger, high quality core specimens1-4
On-Control® Total Potential • Demonstrated less patient insertion pain2 and
Addressable U.S. Market1 significantly less post-procedure patient pain4
• Fewer second-attempt procedures required1-3
• Up to 55% faster procedure time to improve efficiency1-4
Manual Needle
• Easy to learn, operate, and control6
Core Specimen
ARROW ® OnControl®
• Demonstrated greater overall patient satisfaction1
Core Specimen
Representative specimens are shown for illustrative purposes only. Individual results may vary.
1. Reed LJ, Raghupathy R, Strakhan M, et al. The OnControl bone marrow biopsy technique is superior to the standard manual technique for hematologists-in-training: a prospective, randomized comparison. Hematol Rep. 2011;3(e21).
doi:10.4081/hr.2011.e21. Research sponsored by Teleflex Incorporated.
2. Swords RT, Anguita J, Higgins RA, et al. A prospective randomized study of a rotary powered device (OnControl) for bone marrow aspiration and biopsy. J Clin Pathol. 2011;64(9):809-13. doi:10.1136/jclinpath-2011-200047. Research sponsored by
Teleflex Incorporated.
3. Miller LJ, Philbeck TE, Montez DF, et al. Powered bone marrow biopsy procedures produce larger core specimens, with less pain, in less time than with standard manual devices. Hematol Rep. 2011;3(e8):22-5. doi:10.4081/hr.2011.e8. Research
sponsored by Teleflex Incorporated. Philbeck TE and Montez DF are employees of Teleflex Incorporated.
4. Berenson JR, Yellin O, Blumenstein B, et al. Using a powered bone marrow biopsy system results in shorter procedures, causes less residual pain to adult patients, and yields larger specimens. Diagn Pathol. 2011;6:23. Research sponsored by
Teleflex Incorporated.
5. Symington K, Martinez F, Miller LJ, Philbeck TE. Examination of 64 consecutive specimens obtained using a powered biopsy device. J Vasc and Interv Radiol. 2014;25(3s):S196. Research sponsored by Teleflex Incorporated. Philbeck TE is an
employee of Teleflex Incorporated.
6. Lee RK, Ng AW, Griffith JF. CT-guided bone biopsy with a battery-powered drill system: preliminary results. AJR Am J Roentgenol. 2013;201(5):1093-5. doi:10.2214/AJR.12.10521.
29 7. Garcia G, Miller LJ, Philbeck TE, Bolleter S, Montez DF. Tactile feedback allows accurate insertion of a powered bone access device for vertebroplasty and bone marrow sampling procedures. J Vasc and Interv Radiol. 2011;22(3):S86. Research
sponsored by Teleflex Incorporated. Philbeck TE and Montez DF are employees of Teleflex Incorporated. Dr. Garcia was formerly a paid consultant of Teleflex Incorporated. Simulated model study results may not be indicative of clinical performance.OnControl® System Significant Utilization Opportunity
OnControl® System North America Utilization per Account Strategies to Drive Utilization:
• Invest in professional education
20+ kits/month 11% Leaders and cadaver training
10-18 kits/month 14% Regulars • Leverage larger interventional
sales channel
6-8 kits/month 17% Aspirers • Partner with key decision makers:
– Interventional radiology,
pathology, oncologyArrow® AC3 Optimus® Intra-Aortic Balloon Pump
Advanced IABP
performance even in the
most critical conditions
• With the onset of an elevated heart rate
or arrhythmia, the patient’s survival can
suddenly depend on the ability of the
IABP to keep pace with the situation
• The AC3 Optimus® intra-aortic balloon
pump provides intra-beat inflation
timing accuracy across a broad range
of patient conditions — including those
with severe arrhythmias1,2
1. Donelli A, Jansen JRC, Hoeksel B, et al. Performance of a real-time dicrotic notch detection and prediction algorithm
in arrhythmic human aortic pressure signals. J Clin Monit. 2002;17(3-4):181-185. Study sponsored by Teleflex.
2. Schreuder J, Castiglioni A, Donelli A, et al. Automatic intra-aortic balloon pump timing using an intra beat dicrotic
31 notch prediction algorithm. Ann Thorac Surg. 2005;79(3):1017-1022. Study sponsored by Teleflex.Turnpike® Catheters
Turnpike® Spiral Catheter
Distal nylon coil provides rotational
assistance for enhanced trackability
Turnpike® Gold Catheter
Gold-plated, threaded metallic tip for
enhanced advancement
Turnpike® LP Catheter
Low-profile version with greater tip and
distal shaft flexibility for advancement
through extreme tortuosity
32TrapLiner® Catheter
Guide Extension Plus Wire Trapping
• Balloon inflates to maintain Balloon inflates via a
guidewire position hypotube push rod to trap,
the guidewire against the
• Rapid exchange guide interior wall of the guide
extension for backup catheter
support and deep-seating
• Gold radiopaque marker
identifies trapping Guideliner®
balloon location Catheter design
but with shortened
rapid exchange
guide extension
segment and
hydrophilic coating
33Percutaneous Laparoscopy
Percutaneous Access Devices
Top Market Trends
• 3.5 million laparoscopic procedures performed in the US
Annually1
• Patient and clinician demand for decreased trauma and
enhanced safety
• Patient satisfaction influence on reimbursement
• Shifts to outcome based medicine
Growth Strategy
• Broad awareness through market development
activities generate demand for targeted
elective procedures
• Deepen surgical congress society relationships
• Build clinical evidence with key teaching institutions
• Continued investment in refining and broadening
product portfolio
34 1. Idata research: United States Market Report Suite for Laparoscopic Devices, 2017Creating a Suite of Minimally Invasive Surgical Products
Weck® Hem-o-lok®
Polymer Ligation
Systems
Pilling® Laparoscopic
Instruments
Weck Vista® Bladeless
Laparoscopic Access Ports
35Weck® Hem-o-lok® Polymer Ligation Systems
Product Description
Weck Hem-o-lok® polymer ligation clips are designed
for cool ligation, lasting security and fast, efficient
delivery – secure from the cartridge to the applier and
on the vessel. The Weck Hem-o-lok polymer ligation
system unique design offers:
• A flexible hinge that keeps the clip firmly seated
in the applier jaws
• Tactile feedback that confirms jaw seating and
secure vessel placement
• Distal locking clip to signal closure
36Catheter Complications: Antimicrobial Technology
Top Market Trends
• Pressures on healthcare funding linked
to patient outcomes
• Increasing awareness of infection and thrombosis
Protected Catheters
driving penalties and therapy costs
• Increasing awareness of CLABSI issues with PICC lines
Growth Strategy
• Portfolio enhancement around - Right Line, Right Patient,
Right Time™
• Data driven, health economic selling and
consultative approaches Catheter Navigation
• Leverage tip placement navigation technology
• Drive standardization through our coating and kitting strategies
• Investment and launch of several clinical education and
professional education programs
37Arrowg+ard Blue Advance™ PICC
Product Description
Pressure-injectable Arrowg+ard Blue Advance™
PICCs with Chlorag+ard® Technology are the world’s
first PICCs in the intravascular catheter marketplace
with both broad-spectrum antimicrobial and
antithrombogenic protection. Extra- and intraluminal
protection helps reduce the colonization of some
pathogens responsible for causing central line–
associated bloodstream infections (CLABSIs).1,2
Chlorhexidine helps to reduce thrombus accumulation
on the catheter surfaces.1 The Arrowg+ard Blue
Advance PICC is available in a complete portfolio of
single-, double- and triple-lumen formats and related
kits.
1. As compared to uncoated PICCs, intravascular ovine model inoculated with Staph aureus. No correlation between these testing methods and clinical outcome has currently been ascertained.
2. In vitro data on file 2010. No correlation between these testing methods and clinical outcome has currently been ascertained.
3839
Appendix B:
GAAP to Non-GAAP Reconciliations
39Note on Non-GAAP Financial Measures
The presentation to which these appendices are attached and the following appendices include, among other things, tables reconciling the
following applicable non-GAAP financial measures to the most comparable GAAP financial measure:
• Constant currency revenue growth. This measure excludes the impact of translating the results of international subsidiaries at different
currency exchange rates from period to period.
• Organic constant currency revenue growth. This measure excludes (i) the impact of translating the results of international subsidiaries at
different currency exchange rates from period to period; and (ii) the results of acquired businesses (other than acquired distributors) for the first
12 months following the acquisition date.
• Adjusted gross profit and margin. These measures exclude, depending on the period presented, the impact of (i) restructuring, restructuring
related and impairment items, (ii) acquisition, integration and divestiture related items and (iii) other items identified in note (C) to the
reconciliation tables appearing in Appendix B.
• Adjusted operating profit and margin. These measures exclude, depending on the period presented, (i) the impact of restructuring,
restructuring related and impairment items; (ii) acquisitions, integration and divestiture related items; (iii) other items identified in note (C) to the
reconciliation tables appearing in Appendix C.
• Adjusted diluted earnings per share. This measure excludes, depending on the period presented, the impact of (i) restructuring, restructuring
related and impairment items; (ii) acquisition, integration and divestiture related items; (iii) other items identified in note (C) to each of the
reconciliation tables appearing in Appendices D and E; (iv) amortization of the debt discount on the Company’s previously outstanding
convertible notes; (v) intangible amortization expense; (vi) loss on extinguishment of debt; and (vii) tax adjustments identified in note (G) to the
reconciliation tables appearing in Appendices D and E. In addition, the calculation of diluted shares within adjusted earnings per share for the
2017 periods gives effect to the anti-dilutive impact of the Company’s previously outstanding convertible note hedge agreements, which
reduced the potential economic dilution that otherwise would have occurred upon conversion of the Company’s senior subordinated convertible
notes (under GAAP, the anti-dilutive impact of the convertible note hedge agreements is not reflected in diluted shares).
40Non-GAAP Adjustments The following is an explanation of certain of the adjustments that are applied with respect to one or more of the non-GAAP financial measures that appear in the presentation to which these appendices are attached: Restructuring, restructuring related and impairment items. Restructuring programs involve discrete initiatives designed to, among other things, consolidate or relocate manufacturing, administrative and other facilities, outsource distribution operations, improve operating efficiencies and integrate acquired businesses. Depending on the specific restructuring program involved, our restructuring charges may include employee termination, contract termination, facility closure, employee relocation, equipment relocation, outplacement and other exit costs associated with the restructuring program. Restructuring related charges are directly related to our restructuring programs and consist of facility consolidation costs, including accelerated depreciation expense related to facility closures, costs to transfer manufacturing operations between locations, and retention bonuses offered to certain employees as an incentive for them to remain with our company after completion of the restructuring program. Impairment charges occur if, as a result of periodic impairment testing or due to events or changes in circumstances, we determine that the carrying value of an asset exceeds its fair value. Impairment charges do not directly affect our liquidity, but could have a material adverse effect on our reported financial results. Acquisition, integration and divestiture related items. Acquisition and integration expenses are incremental charges, other than restructuring or restructuring related expenses, that are directly related to specific business or asset acquisition transactions. These charges may include, among other things, professional, consulting and other fees; systems integration costs; legal entity restructuring expense; inventory step-up amortization (amortization, through cost of goods sold, of the increase in fair value of inventory resulting from a fair value calculation as of the acquisition date); fair value adjustments to contingent consideration liabilities; and bridge loan facility and backstop financing fees in connection with loan facilities that ultimately were not utilized. Divestiture related activities involve specific business or asset sales. Depending primarily on the terms of the divestiture transaction, the carrying value of the divested business or assets on our financial statements and other costs we incur as a direct result of the divestiture transaction, we may recognize a gain or loss in connection with the divestiture related activities. Other items. These are discrete items that occur sporadically and can affect period-to-period comparisons. Amortization of debt discount on convertible notes. When we sold $400 million principal amount of our 3.875% convertible notes (the “convertible notes”) in 2010, we allocated the proceeds between the liability and equity components of the debt, in accordance with GAAP. As a result, the $83.7 million difference between the proceeds of the sale of the convertible notes and the liability component of the debt constituted a debt discount that was to be amortized to interest expense over the approximately seven-year term of the convertible notes, which significantly increased the amount we recorded as interest expense attributable to the convertible notes. The amount of the amortization of the debt discount was reduced as a result of our repurchases of convertible notes in 2016 and 2017 and redemptions of the convertible notes by holders of the notes, although we continued to amortize the remaining portion of the debt discount to interest expense until August 2017, when all remaining convertible notes were either converted or matured. Intangible amortization expense. Certain intangible assets, including customer relationships, intellectual property, distribution rights, trade names and non-competition agreements, initially are recorded at historical cost and then amortized over their respective estimated useful lives. The amount of such amortization can vary from period to period as a result of, among other things, business or asset acquisitions or dispositions. Loss on extinguishment of debt. In connection with debt refinancings, debt repayments, repurchases of convertible notes and redemptions of convertible notes, outstanding indebtedness is extinguished. These events, which have occurred from time to time on an irregular basis, have resulted in losses reflecting, among other things, unamortized debt issuance costs, as well as debt prepayment fees and premiums (including conversion premiums resulting from conversion of convertible securities). Tax adjustments. These adjustments represent the impact of the expiration of applicable statutes of limitations for prior year returns, the resolution of audits, the filing of amended returns with respect to prior tax years and/or tax law changes affecting our deferred tax liability. Adjusted diluted shares. Adjusted diluted shares are calculated by giving effect to the anti-dilutive impact of the Company’s convertible note hedge agreements, which reduced the potential economic dilution that otherwise would have occurred upon conversion of the Company's convertible notes. Under GAAP, the anti-dilutive impact of the convertible note hedge agreements is not reflected in the weighted average number of diluted shares. 41
Appendix A – Reconciliation of Adjusted Operating Profit and Margin
   Dollars in Thousands
                                                                                                                                                          Tw elve Months Ended
                                                                                      Decem ber 31, 2014           Decem ber 31, 2015           Decem ber 31, 2016      Decem ber 31, 2017                Decem ber 31, 2018           Decem ber 31, 2019

    Incom e from continuing operations before interest, loss on
    extinguishm ent of debt and taxes                                             $               284,862      $               315,891      $               319,453      $               372,279      $                321,704     $                427,254
    Incom e from continuing operations before interest, loss on
    extinguishm ent of debt and taxes m argin                                                        15.5%                        17.5%                        17.1%                        17.3%                        13.1%                        16.5%

    Restructuring, restructuring related and impairment items (A)                                  28,749                       17,314                        74,559                       29,371                       93,957                       38,490
    Acquisition, integration and divestiture related items (B)                                     (7,549)                      (3,498)                       (7,399)                      38,802                       60,321                       49,299
    Other items (C)                                                                                   600                       (3,040)                          572                         (551)                       2,907                        1,814
    Medical Device Regulation (MDR) Costs (D)                                                         -                            -                             -                            -                            -                          3,194
    Intangible amortization expense                                                                60,926                       62,380                        63,491                       98,766                      149,486                      149,974

    Adjusted incom e from continuing operations before interest, loss
    on extinguishm ent of debt and taxes                                          $               367,588      $               389,047      $               450,676      $               538,667      $                628,376     $                670,025
    Adjusted incom e from continuing operations before interest, loss
    on extinguishm ent of debt and taxes m argin                                                     20.0%                        21.5%                        24.1%                        25.1%                        25.7%                        25.8%

    Revenue as-reported                                                           $              1,839,832     $              1,809,690     $              1,868,027     $              2,146,303     $              2,448,383     $              2,595,362

(A)    Restructuring, restructuring related and impairment items - In 2014 and 2015 the majority of these charges were related to facility consolidations. In 2016, these charges include; (i) charges related to facility consolidations, (ii) a pre-tax, non-cash $41.0 million
impairment charge in connection with discontinuation of an in-process research and development project; (iii) $2.4 million in pre-tax, non-cash impairment charges related to two properties, one of which was classified as an asset held for sale. In 2017, the majority
of these charges were related to facility consolidations. For the twelve months ended December 31, 2017 and December 31, 2018, pre-tax impairment charges were $0 million and $19.1 million, respectively. For the twelve months ended December 31, 2019 pre-tax
restructuring charges were $15.2 million, pre-tax restructuring related charges were $16.3 million, and pre-tax impairment charges were $7.0 million.
(B)    Acquisition, integration and divestiture related items - In 2014 and 2015, the majority of these charges were related to contingent consideration liabilities, somewhat offset by acquisition costs. In 2016, the majority of these charges included reversals related
to contingent consideration liabilities, including $8.3 million related to the discontinuation of an in-process research and development project, and the gain on a sale of assets, somewhat offset by acquisition costs. . For the twelve months ended December 31, 2017,
these charges were primarily related to our acquisitions of Vascular Solutions and NeoTract, as well as contingent consideration liabilities. For the twelve months ended December 31, 2018, these charges were primaril y related to contingent consideration liabilities
and our acquisition of NeoTract. For the twelve months ended December 31, 2019, these charges primarily related to contingent consideration liabilities and our acquisition of Essential Medical, Inc., partially offset by the gain on sale of a business and two assets.
(C)     Other items - In 2016, the majority of these charges were related to relabeling costs and costs associated with a facility that was exited. For the twelve months ended December 31, 2017, other items included both gains and losses associated with litigation
settlements, the reversal of previously recognized income due to distributor acquisitions related to Vascular Solutions, the reversal of previously recognized income due to our distributor to direct sales conversion in China, and relabeling costs. For the twelve months
ended December 31, 2018, other items included the reversal of previously recognized income due to distributor acquisitions related to Vascular Solutions, losses associated with settlement of ligation relating to an intellectual property matter, expenses associated
with a franchise tax audit, and relabeling costs. Other items for the twelve months ended December 31, 2018 included a charge we incurred, as a result of the Tax Cuts and Jobs Act (“TCJA”), on our consolidated operations. During the second quarter of 2018, we
identified provisions of the TCJA that could have adverse consequences due to our organizational structure. We implemented certain changes in the organizational structure (with, pursuant to tax law, retroactive impact back to 2017), as a result of which, we
incurred a $1.9 million net worth tax in a foreign jurisdiction with respect to the 2017 tax year. Because the decision to make the change resulting in the net worth tax occurred in the second quarter of 2018, and as permitted under GAAP, we recorded the net worth
tax charge in 2018, and the adjustment eliminating the charge is included in the table for the year ended December 31, 2018. For the twelve months ended December 31, 2019, other items included debt modification and extinguishment expenses, expenses
associated with a franchise tax audit, and product relabeling costs, partially offset by a credit associated with an insurance settlement.
(D)    MDR - For the twelve months ended December 31, 2019, these costs were associated with our efforts to comply with the European Medical Device Regulation. The costs associated with the European Medical Device Regulation initiative include $0.3 million
that were a component of the "Other items" line item in the reconciliation table for the three months ended March 31, 2019 included in our first quarter 2019 earnings release.

    42
Appendix B – Reconciliation of Adjusted Earnings per Share
Twelve Months Ended
December 31, 2015 December 31, 2016 December 31, 2017 December 31, 2018 December 31, 2019 2015 - 2019 CAGR
GAAP diluted earnings per share available to common shareholders $4.91 $4.98 $3.33 $4.20 $9.81 18.9%
GAAP year-over-year growth 19.8% 1.4% -33.1% 26.1% 133.6%
Restructuring, restructuring related and impairment items (A) $0.23 $1.03 $0.44 $1.76 $0.71
Acquisition, integration and divestiture related items (B) ($0.09) ($0.11) $0.79 $1.27 $1.11
Other items (C) ($0.04) $0.01 $0.01 $0.06 $0.17
MDR Costs (D) — — — — $0.07
Amortization of debt discount on convertible notes $0.17 $0.10 $0.01 — —
Intangible amortization expense $0.95 $0.99 $1.52 $2.63 $2.59
Loss on extinguishment of debt $0.14 $0.26 $0.08 — —
Tax adjustments ($0.39) ($0.23) $2.17 ($0.01) ($3.31)
Shares due to Teleflex under note hedge $0.44 $0.31 $0.05 — —
Adjusted diluted earnings per share available to common shareholders $6.33 $7.34 $8.40 $9.90 $11.15 15.2%
Adjusted year-over-year growth 10.3% 16.0% 14.4% 17.9% 12.6%
43Appendix C Tickmarks (A) Restructuring, restructuring related and impairment items - In 2015 the majority of these charges were related to facility consolidations. In 2016, these charges include; (i) charges related to facility consolidations, (ii) a pre-tax, non-cash $41.0 million impairment charge and a $14.9 million reduction in related deferred tax liabilities in connection with discontinuation of an in-process research and development project; (iii) $2.4 million in pre-tax, non-cash impairment charges related to two properties, one of which was classified as an asset held for sale and (iv) a $0.7 million reduction in related deferred tax liabilities. For the twelve months ended December 31, 2017 and December 31, 2018, pre-tax restructuring related charges were $14.6 million and $14.7 million, respectively. For the twelve months ended December 31, 2017 and December 31, 2018, pre-tax impairment charges were $0.0 million and $19.1 million, respectively. For the twelve months ended December 31, 2019 pre-tax restructuring charges were $15.2 million, pre-tax restructuring related charges were $16.3 million, and pre- tax impairment charges were $7.0 million. (B) Acquisition, integration and divestiture related items - In 2014, the majority of these charges were related to contingent consideration liabilities, somewhat offset by acquisition costs. In 2016, the majority of these charges were related to reversals related to contingent consideration liabilities, including $8.3 million related to the discontinuation of an in-process research and development project, and the gain on a sale of assets, somewhat offset by acquisition costs. For the twelve months ended December 31, 2017, these charges were primarily related to our acquisitions of Vascular Solutions and NeoTract, as well as contingent consideration liabilities. For the twelve months ended December 31, 2018, these charges were primarily related to contingent consideration liabilities and our acquisition of NeoTract. For the twelve months ended December 31, 2019, these charges primarily related to contingent consideration liabilities and our acquisition of Essential Medical, Inc., partially offset by the gain on sale of a business and two assets. (C) Other items - In 2015, the majority of these charges were related to the medical device excise tax and a litigation verdict against the Company with respect to a non-operating joint venture. In 2016, the majority of these charges were related to relabeling costs and costs associated with a facility that was exited. For the twelve months ended December 31, 2017, other items included both gains and losses associated with litigation settlements, the reversal of previously recognized income due to distributor acquisitions related to Vascular Solutions, the reversal of previously recognized income due to our distributor to direct sales conversion in China, and relabeling costs. For the twelve months ended December 31, 2018, other items included the reversal of previously recognized income due to distributor acquisitions related to Vascular Solutions, losses associated with settlement of ligation relating to an intellectual property matter, expenses associated with a franchise tax audit, and relabeling costs. Other items for the twelve months ended December 31, 2018 included a charge we incurred, as a result of the Tax Cuts and Jobs Act (“TCJA”), on our consolidated operations. During the second quarter of 2018, we identified provisions of the TCJA that could have adverse consequences due to our organizational structure. We implemented certain changes in the organizational structure (with, pursuant to tax law, retroactive impact back to 2017), as a result of which, we incurred a $1.9 million net worth tax in a foreign jurisdiction with respect to the 2017 tax year. Because the decision to make the change resulting in the net worth tax occurred in the second quarter of 2018, and as permitted under GAAP, we recorded the net worth tax charge in 2018, and the adjustment eliminating the charge is included in the table for the year ended December 31, 2018. For the twelve months ended December 31, 2019, other items included debt modification and extinguishment expenses, expenses associated with a franchise tax audit, and product relabeling costs, partially offset by a credit associated with an insurance settlement. (D) MDR - For the twelve months ended December 31, 2019, these costs were associated with our efforts to comply with the European Medical Device Regulation. The costs associated with the European Medical Device Regulation initiative include $0.3 million that were a component of the "Other items" line item in the reconciliation table for the three months ended March 31, 2019 included in our first quarter 2019 earnings release. 44
You can also read