INVESTOR OVERVIEW Post First Quarter 2018 - Hydro One

Page created by Karen Alvarado
 
CONTINUE READING
INVESTOR OVERVIEW Post First Quarter 2018 - Hydro One
INVESTOR OVERVIEW
    Post First Quarter 2018
INVESTOR OVERVIEW Post First Quarter 2018 - Hydro One
AGENDA
                                     •        Business Update
                                     •        Company Overview
                                     •        Regulatory Framework
                                     •        Appendix

Investor Overview – Post First Quarter 2018                          2
INVESTOR OVERVIEW Post First Quarter 2018 - Hydro One
BUSINESS UPDATE
INVESTOR OVERVIEW Post First Quarter 2018 - Hydro One
WELCOME BACK
     Organization Priorities
     • Quarterly dividend increased 5% to $0.23 per share, payable June 29, 2018
     • New methodology and proactive approach to storm restoration efforts results in all-time Company record for
         speed of service restoration after nearly 500,000 customers lost power in mid-April ice storm
     • Hydro One is progressing well throughout the Avista transaction with key achievements:
          •      Approval received from the Federal Energy Regulatory Commission (FERC).
          •      A settlement agreement was filed with state utility commissions in Washington, Idaho, and Alaska
          •      An in-principle settlement agreement with all parties reached in Oregon, which will be filed with regulator
                 later this month.
          •      The US Antitrust Clearance and the US Federal Communication Commission (FCC)’s consent for the
                 proposed merger were received
          •      Anticipating a H2 2018 close of the Avista transaction
     • Capital expenditure program delivering consistent and steady +5% growth to Rate Base
     • Productivity initiatives are aligning customer and shareholder values
     • Expecting recovery of $2.6 billion Deferred Tax Asset and have filed a Motion to Review and Vary the
         Decision with the OEB
     • Key additions to executive leadership team Paul Dobson and Patrick Meneley will help Hydro One transform
         into a new era of growth
Investor Overview – Post First Quarter 2018                                                                                    4
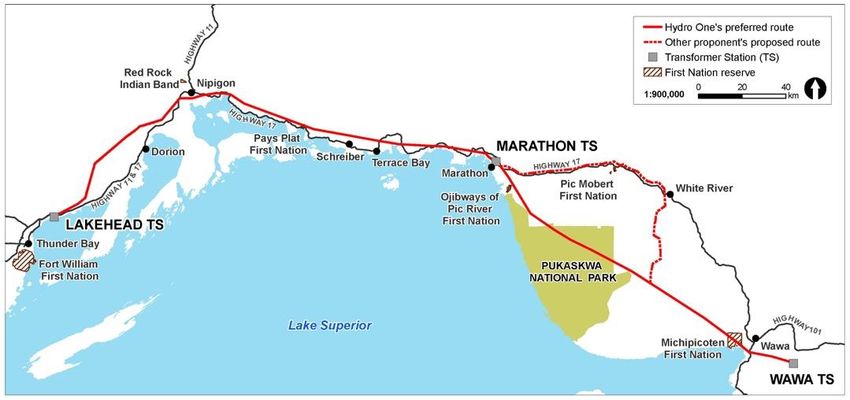
INVESTOR OVERVIEW Post First Quarter 2018 - Hydro One
COMPANY
OVERVIEW
INVESTOR OVERVIEW Post First Quarter 2018 - Hydro One
THE VALUE OF HYDRO ONE
 ABOUT THE COMPANY                                                                    HOW WE DID IN 2017                                                      WHY INVEST
                                                                                           Transmission            Distribution          Other
 Transmission & Distribution                                                                                                                                  Stable Operations
                                                                                                    1%
                  30,000 circuit KM’s of transmission
                                                                                                                    Revenue Net of
                                                                                                                    Purchased Power                            Stable and growing cash flows
                  lines across 98% of Ontario                                                                                                                  with 99% of overall business
                                                                                                                                                               fully rate-regulated
                                                                                       48% $3,115M 51%
                    Largest Local Distribution Company
                                                                                                                                                               No generation or material
                    in Ontario with 1.3 million end                                                                                    11%
                                                                                                                                                               exposure to commodity prices
                    customers

                                                                                                        Total Assets                      $25.7B    53%
                                                                                                                               36%
                  Expected combined 2018
                  Transmission & Distribution Rate                                                                                                        Financial Performance
                  Base of $19.7B1
                                                                                                                                                               Predictable self-funding
                  Market Capitalization of ~$12.52                                       39%                                                                   organic growth profile with +5%
                  billion                                                                       $1,291M                   Regulated EBIT                       expected five year rate base
                                                                                                              61%                                              CAGR
 Regulated and Privatized                                                                                                                   1%
 Operations                                                                                                                                                    Attractive 70% - 80% target
                  99% of revenue from regulated                                                                                                                dividend payout ratio
                  operations                                                                                  Capital 37%
                                                                                                         Investments      $1,567M                              Recently increased annualized
                  Privatization initiative by Province of                                                                                           62%        dividend of $0.92 per share
                  Ontario to divest majority stake in
                  Hydro One complete with post
                  November 2015 IPO (15%), April                                         40%                                                                   Strong balance sheet with
                  2016 secondary (15%), and May 2017                                               $18.6B                                                      investment grade “A” credit
                  secondary (20%) offerings                                                                    60%                                             ratings
                                                                                                                     Rate Base

Investor Overview – Post First Quarter 2018                                                                                                                                                      6
1)   Company estimates subject to change and include amounts from March 2017 filed distribution rate application which is subject to OEB approval
2)   Based on closing share price on March 29, 2018
INVESTOR OVERVIEW Post First Quarter 2018 - Hydro One
EXECUTIVE LEADERSHIP TEAM
     A leadership team with demonstrated experience transforming organizations
     and growing shareholder value.

                                                                            Paul Dobson
                                                          Acting President and CEO and Chief Financial Officer

     Greg Kiraly                           Judy McKellar                  Patrick Meneley                   Ferio Pugliese       Jamie Scarlett
Chief Operating Officer                   EVP, Chief Human               EVP, Chief Corporate            EVP, Customer Care &   Chief Legal Officer
                                          Resources Officer              Development Officer               Corporate Affairs

   Investor Overview – Post First Quarter 2018                                                                                                        7
INVESTOR OVERVIEW Post First Quarter 2018 - Hydro One
A LOOK AT THE ORGANIZATION
    Corporate Structure
                                                   Public Company                             TSX: H
                                                                         Hydro One Limited

                   Public Debt Issuer         Hydro One Inc.

                         Hydro One Networks                    Hydro One Remote              Hydro One Telecom
                                Inc.                            Communities Inc.                    Inc.
                                   Rate-Regulated Businesses (99% of revenue)                Non-Rate-Regulated Business

    Our Role in the Electricity Grid
    Our transmission and distribution system safely
    and reliably serves communities throughout
    Ontario. Our customers are suburban, rural
    and remote homes and businesses across our
    province.

    We proudly own and operate $26 billion in
    assets and have annual revenues of
    approximately $6 billion.

Investor Overview – Post First Quarter 2018                                                                                8
INVESTOR OVERVIEW Post First Quarter 2018 - Hydro One
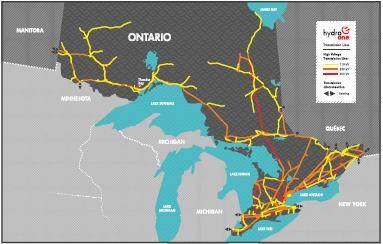
PURPOSE, VALUES & STRATEGY

Investor Overview – Post First Quarter 2018   9
INVESTOR OVERVIEW Post First Quarter 2018 - Hydro One
ACHIEVEMENTS AND EFFICIENCIES
  Paving New Paths in Productivity Savings ($M)                                            • Generated productivity savings totaling
                                                                                             $89.5 million in 2017 ($43.6 million in
   2017                                                            89.5                      OM&A and $45.9 million in capital)
                                                                             $114.4M       • Move to Mobile transformed work
   2016                         24.9                                                         processes and implemented technology
                                                                                             that automated the scheduling &
                                                                                             dispatching functions
                                       Capital     OM&A
                                                                              • Strategic sourcing initiatives led to price
   Improving Customer                                Reducing the Fleet by 10% reduction for materials and services as a
   Satisfaction (%)                           88
                                                              8,010             result of consolidating spend across
                   78
                                                                        7,189   Hydro One and increasing competition
                                       71                                       among vendors
           66
                                                                                           • Hydro One leveraged telematics data to
                                                                                             identified underutilized fleet equipment
                                                                                             causing a reduction of fleet size by 10%

                                                                                           • Optimal Cycle Protocol (OPC) is a state-
                                                                                             of-the-art vegetation management
                                                                                             program that was implemented in
                                                                                             October 2017. OCP will shorten tree
                                                                                             clearing and trimming cycle to 3 years
              2016                        2017                  2016        2017
                                                                                             from 8-10 years
            Distribution           Transmission              On-road   Off-road    Other

Investor Overview – Post First Quarter 2018                                                                                         10
THE REGULATED BUSINESS
  Transmission & Distribution
   Transmission
                                              •   Hydro One owns and operating 98% of Ontario’s transmission
                                                  capacity                                                                          LDC Customers        43
                                              •   Transmission produces reliable cash flow with low volatility under
                                                  Ontario Energy Board (OEB) cost of service regulation and will         Large Directly Connected
                                                                                                                             Industrial Customers        88
                                                  transition to incentive rate making under OEB
                                              •   Growing rate base with planned annual capital investments of                   Transmission Lines
                                                  ~$1,000 - $1,500 million through 2022 with focus on refurbishing                     (Circuit KM)     30,000
                                                  aging assets
                                                                                                                                        Transmission
                                              •   Continued shift to renewable and distributed generation sources                 Stations In Service    308
                                                  helping drive expansion of transmission network
   One of North America’s largest electric
                                              •   2018 allowed ROE of 9.00% with 40% / 60% deemed equity /                            Cross Boarder
   transmission providers                                                                                                           Interconnections
                                                  debt capital structure                                                                                 25
   Distribution
                                              •   Distribution is a stable, rate-regulated business operating under OEB cost     LDC’s Consolidated
                                                                                                                                         Since 2000      90
                                                  of service framework with transition to performance-based model in
                                                  2018
                                                                                                                                   Distribution Lines
                                              •   Growing rate base with planned annual capex of ~$650 - $800 million                    (Circuit KM)   123,000
                                                  through 2022
                                                                                                                                  Distribution Poles
                                              •   2018 expected ROE of 9.00.% with 40% / 60% deemed equity/debt                                          1.6M
                                                  capital structure
                                              •   Recent OEB decision in place transitioning residential distribution rates to      Distribution End
                                                                                                                                                        +1.3M
                                                                                                                                          Customers
                                                  fully fixed
                                              •   Drivers of growth include rate base expansion, productivity                       Distribution and     1,000
 The largest electric LDC in Ontario with
                                                  improvements and continued consolidation of other LDC’s                        Regulating Stations
 further expansion opportunities
                                              •   Recent Haldimand, Woodstock, Norfolk LDC acquisitions grew customer
Investor Overview – Post First Quarter 2018       base by ~5%                                                                                                     11
HYDRO ONE TELECOM
    Integral role in servicing grid assets

                                                                                 Fiber optic lines (route KMs)   6,400

                                                                                  Network Points of Presence     81

                                                                                   Customer Site Connections
                                                                                                                 1,900

                                                                                      Data Centres Connected      30

    • Leverages Hydro One’s network fiber assets used to monitor and manage power grid circuitry
    • Diverse, secure, low latency broadband connectivity across Ontario utilizing infrastructure constructed
      principally along electric transmission network
    • Provincial fiber routes extend to Montreal and also include connection points in Buffalo and Detroit
    • Provides fiber-optic broadband network services including leased circuits, dark fiber, Ethernet
      transport, Internet transit, data center connectivity and tower access
    • Customers include data centers, cloud service providers, enterprises, ISPs, other Telco's and public
      sector entities
    • Currently expanding number of data center connections and launching managed security, cloud
      backup and data recovery solutions

Investor Overview – Post First Quarter 2018                                                                              12
$10B OF CAPITAL INVESTMENT
  DRIVING RATE BASE GROWTH
   Consistent and predictable organic growth profile underpinned by required
   replacement of aging infrastructure
   Projected Capital Investments* ($M)                                   Projected Rate Base Growth*

                                                     $2,205     $2,209
                        $1,968          $1,993                                                                                        $24,102
                                                                                                                       $22,937
                                                                                                         $21,825
         $1,651                                       $719                  $19,740       $20,800
                                                                $805
                          $751           $715
          $641

                                                     $1,486     $1,404
                         $1,217         $1,278
         $1,010

          2018            2019           2020         2021      2022          2018           2019          2020          2021          2022
                           Transmission          Distribution             * Company estimates subject to change and include amounts from March 2017
                                                                            filed distribution rate application which is subject to OEB approval
   Comments
   •    Organic growth underpinned by continued rate base expansion to renew and modernize grid
   •    Material amounts of deteriorated, end-of-service life infrastructure must be upgraded or replaced
   •    Little concentration risk as most projects within capex envelope are small to medium relative to total
   •    Investments not undertaken without reasonable assurance of regulatory recovery
   •    Equity issuance not anticipated for planned capital investment program which is self-funded
Investor Overview – Post First Quarter 2018                                                                                                           13
INFRASTRUCTURE INVESTMENTS
      Clarington Transmission Station              Richview Transmission Station

    Estimated Total Project Cost: $252 million     Estimated Total Project Cost: $103 million
    Capital Cost To Date: $228 million             Capital Cost To Date: $88 million
    Anticipated In-Service Date: 2018              Anticipated In-Service Date: 2019

    Comprised of two 750MVA, 500/230 kV            Replacement of 50 year old end-of-life
    transformers and associated termination        equipment at Richview Transformer Station
    facilities to connect Hydro One’s bulk         to ensure the secure and reliable power
    transmission network to Eastern Ontario upon   supply to the City of Toronto and
    retirement of the Pickering Nuclear            surrounding communities
    Generation Station

Investor Overview – Post First Quarter 2018                                                     14
PENDING                  AVISTA             ACQUISITION
    Growing regulated business with a geographically diverse customer base, supported by one of the
    lowest electricity rates in the US
     Avista Business Overview                                                                                         Service Area
    (C$ in mm)3                                                                                2016A                  Service territories across WA, OR, ID, AK, and MT
                                                           Revenue                             $1,824
                                                                                                                            Vancouver                BC
                                                           EBITDA                              $570                                                                          AB
                                                                                                                                                                                              SK
                                                                                                                                         Seattle
                                                                                                                           Olympia
                                                           Net Income                          $174                                       WA
                                                                                                                           Portland                                                      MT
                                                                                                                                                                    Helena
           2016 Rate Base                                   2016 Rate Base by State                                             OR
                                                                     ID Gas, 5%         OR Gas, 7%
        22% Gas                                                                                                                                    Boise
                                                      WA Gas, 10%                                                                                                ID
                                                   AK Electric, 4%                                                                                                                       WY

                   $3,877 M                                                             $3,877 M                                                                      Anchorage
                                               ID Electric, 25%                                                                                             UT
                                                                                                                               CA         NV                                AK
 78% Electric                                                                                                                                                 Salt Lake
                                                                                                   WA Electric, 49%                                           City
                                                                                                                                                           Juneau
           2016 Customers                                   2016 Electric              Generation2
                                                                                                                                                       Sitka
                                                                                                                            Power Plants
                    2% AEL&P                                                                                                Gas Pipelines
 46% Avista                                                              49% Hydro                  35% Natural             Transmission Lines
 Gas Utilities                                                                                         Gas                  Electric Service Area
                                                                                                                            Electric / Natural Gas Service Area
                    726,0001
                                                                                                                            Natural Gas Service Area
                                                                                       2,072 MW                             Transmission Line Project
                                      52% Avista
                                       Electric                                                       4% Wind
                                                                                                                      1.      Includes combined electric and gas customers
                                                                                    10% Coal       2% Biomass         2.      Based on maximum capacity and excludes Alaska generation
  Investor Overview – Post First Quarter 2018                                                                         3.      Based on an exchange rate of C$/US$ 1.264                            15
Note: All financial metrics based on time of the initial announced of transaction
PENDING                 AVISTA            ACQUISITION
 Hydro One will become a Top 20 North American investor owned utility with an attractive growth profile
 Strategic Rationale & Transaction Details                                                                    Allowed ROE   Equity Capitalization
   Diversification
   • Increases geographic, economic, regulatory and asset class                 ON          9.00%                 40.00%

                                                                                     Allowed Equity Returns
          diversification
                                                                                WA          9.50%                 48.50%
   • Adds complementary and growing gas distribution
   • Provides exposure to regulated and predominantly clean                      ID         9.50%                 50.00%

          generation                                                            OR          9.40%                 50.00%
   Building quality regulated asset scale
                                                                                AK          12.88%                53.80%
   • Earnings and cash flow accretion in the first full year
          following close, excluding transaction costs               Access to new regulatory jurisdictions with higher ROEs and
   • On a pro forma basis increases Hydro One’s total assets         attractive allowed capital structures
          from approximately $25.4 billion to approximately $34.9
          billion                                                       Transaction Details
   • Hydro One expected to continue growing dividend and to             • Offer price of US$53.00 per Avista common
          maintain 70-80% dividend payout ratio                               share in cash, a 24% premium to Avista’s
   • Planned pro forma rate base growth of approximately 6%,                  closing price on 18 July, 2017 of US$42.74
          starting from a combined 2017 base of C$22.6 billion          • Equity purchase price of US$3.4 billion
   Innovation and knowledge transfer                                          (C$4.4 billion)
   • Avista is a leader in utility innovation with a track record of    • Total enterprise value for Avista of US$5.3
          investments in advanced technologies, including energy              billion (C$6.7 billion), including Avista debt
          management solutions                                                assumed
   • Opportunity to reduce operating costs and gain strategic           • Planned financing is a combination of 5-year,
          benefits by leveraging and sharing innovation and best              10-year and 30-year US$ denominated notes
          practices                                                           together with the fully executed convertible
Investor Overview – Post First Quarter 2018                                   debenture offering                               16
 Note: All financial metrics based on time of the initial announced of transaction
PENDING AVISTA ACQUISITION                                                                                                                                                                 (C$ in mm)
  Diversification across multiple geographies, economies, regulatory jurisdictions
  and utility businesses enhances stability and strategic positioning
                                              ’16 Rate Base                        ’16 Rate Base by Geography                                                  ’16 Net Income

                                                                                                                            Ontario,                                                     Ontario,
                                                                                                                             100%                                                         100%

                                                                                                          $17,831                                                       $721
       Hydro One                                $17,831

                                                                100% Electric

                                                                                                             AK, 4%
                                                                                                 OR, 7%
                                  22% Gas

           Avista                                $3,877                                  ID, 30%           $3,877                                                        $174
                                                                                                                                                                                           Avista
                                                                                                                             WA, 59%                                                       Service
                                                                                                                                                                                          Territory
                                                                   78% Electric

                                                                                                          OR, 1%      WA, 11%                               Avista,
                                  3% Gas                                                                                                                     19%
                                                                                                                              ID, 5%

       Pro-Forma                                                                                                              AK, 1%                                                       Hydro
                                                $21,708                                                    $21,708                                                       $895
       Hydro One                                                                                                                                                                           One,
                                                                                                                                                                                            81%

                                                                  97% Electric              Ontario,
                                                                                             82%

Investor Overview – Post First Quarter 2018      Note: Combination of Avista and Hydro One numbers as reported using an exchange rate of C$ / US$ 1.264                                                   17
                                                 Note: Pro forma net income does not include any potential adjustments required as a result of the merger including funding costs or other expenses
                                                 Note: All financial metrics based on time of the initial announced of transaction
                                                 .
ONTARIO BUSINESS DEVELOPMENT
Finding growth opportunities in Ontario
Lake Superior Link                                                                   Key points
                                                                                 •    Applied to the OEB to construct a new transmission line
                                                                                      between Lakehead and Wawa
                                                                                 •    Project cost to be roughly $636 million, which is over
                                                                                      $100 million lower than other proponents
                                                                                 •    Annual OM&A costs savings of $3 million versus
                                                                                      competing bids
                                                                                 •    400 km, double-circuit 230kV transmission line that
                                                                                      would be built primarily on or adjacent to Hydro One’s
                                                                                      existing assets

Hydro One Sault Ste. Marie                    (Great Lakes Power Transmission)    Key points
                                                                                 • OEB approval received October 13, 2016 and
                                                                                   transaction closed October 31, 2016
                                                                                 •    Increased Hydro One’s transmission coverage to
                                                                                      ~98% of province-wide capacity
                                                                                 •    560km of high voltage transmission lines, towers and
                                                                                      stations
                                                                                 •    $376 million purchase price, including approximately
                                                                                      $150 million of assumed debt

Investor Overview – Post First Quarter 2018                                                                                                    18
STRONG BALANCE SHEET AND LIQUIDITY
 Investment grade balance sheet with one of lowest debt costs in utility sector
 Significant Available Liquidity ($M)                                                                        Strong Investment Grade Credit Ratings (LT/ST/Outlook)                                                                                                                       Shelf Registrations

                   250                                                                                                                                             Hydro One Inc. (HOI)
                                               Hydro One Limited                                                                                                                                                                                                                                       HOL:
                                               Hydro One Inc.                                                                                                                                                                                                                                     Universal Shelf3
                                                                                                                                  S&P                                                                  A / A-1/ negative1                                                                             $8.0B
                 2,300

                                                                        989                                                      DBRS                                                      A (high) / R-1 (low) / stable                                                                                HOI:
                                                                                                                                                                                                                                                                                                    Medium Term
       Undrawn Credit                                 Commercial Paper                                                                                                                                                                                                                               Note Shelf4
          Facilities                                  Outstanding (Under                                                        Moody’s                                                        A3 / Prime-2 / negative2                                                                                $4.0B
                                                      $1.5B CP Program)

Debt Maturity Schedule ($M)
800                                                                                                                                                                                                                                 Weighted average cost of debt:                                                    4.2%
700                                                                                                                                                                                                                                 Weighted average term (years):                                                    15.5
600                                                                                                                                                                                                                                 Debt to Capitalization5:                                                          52.8%
500                                                                                                                                                                                                                                 FFO to Net Debt:                                                                  13.9%
400
300
200
100
  0
         2018
                2019
                       2020
                              2021
                                     2022
                                            2023
                                                   2024
                                                          2025
                                                                 2026
                                                                        2027
                                                                               2028
                                                                                      2029
                                                                                             2030
                                                                                                    2031
                                                                                                           2032
                                                                                                                  2033
                                                                                                                         2034
                                                                                                                                2035
                                                                                                                                       2036
                                                                                                                                              2037
                                                                                                                                                     2038
                                                                                                                                                            2039
                                                                                                                                                                   2040
                                                                                                                                                                          2041
                                                                                                                                                                                 2042
                                                                                                                                                                                        2043
                                                                                                                                                                                               2044
                                                                                                                                                                                                      2045
                                                                                                                                                                                                             2046
                                                                                                                                                                                                                    2047
                                                                                                                                                                                                                           2048
                                                                                                                                                                                                                                  2049
                                                                                                                                                                                                                                         2050
                                                                                                                                                                                                                                                2051
                                                                                                                                                                                                                                                       2052
                                                                                                                                                                                                                                                              2053
                                                                                                                                                                                                                                                                     2054
                                                                                                                                                                                                                                                                            2055
                                                                                                                                                                                                                                                                                   2056
                                                                                                                                                                                                                                                                                          2057
                                                                                                                                                                                                                                                                                                 2058
                                                                                                                                                                                                                                                                                                        2059
                                                                                                                                                                                                                                                                                                               2060
                                                                                                                                                                                                                                                                                                                      2061
                                                                                                                                                                                                                                                                                                                             2062
                                                                                                                                                                                                                                                                                                                                    2063
                                                                                                                                                                                                                                                                                                                                           2064
(1) On July 19, 2017, S&P revised its outlook on Hydro One Limited and Hydro One Inc. to negative from stable while affirming the existing ratings. S&P indicated that the negative outlook on Hydro One Limited reflects its view that the Merger signals a shift in Hydro One
Limited’s business strategy, which will align the company with its global peers removing the historical rationale for a one-notch rating uplift, and the execution and financing risk inherent in any large acquisition.
(2) On July 19, 2017, Moody’s affirmed the ratings of Hydro One Inc. and changed the outlook to negative from stable. Moody’s indicated that the negative outlook on Hydro One Inc. reflects its view that the Merger will reduce the probability of extraordinary support
from the Province.
(3) The Hydro One Limited Universal Shelf of $8.0 billion filed in March 2016 expired on April 30, 2018. The Company plans to file a new Universal Base Shelf Prospectus in the second quarter of 2018.
(4) The Hydro One Inc. Medium Term Note Base Shelf Prospectus was filed in March 2018. The entire $4.0 billion amount is available for issuance until April 2020.
(5) Debt to capitalization ratio has been calculated as total debt (includes total long-term debt, convertible debentures and short-term borrowings, net of cash and cash equivalents) divided by total debt plus total shareholders’ equity, including preferred shares but
excluding any amounts related to noncontrolling interest.
  Investor Overview – Post First Quarter 2018                                                                                                                                                                                                                                                                                               19
EQUITY MARKET CAP OVERVIEW
    Approximate Ownership of Public Float                        Equity Index Inclusions

                                                                   S&P/TSX Composite Index                 FTSE All-World (Canada)

            37%
                                                                   MSCI World (Canada)                     S&P/TSX Composite
                                              Institutional                                                Low Volatility Index

                                      63%
                                              Retail               Dow Jones Canada Select                 S&P/TSX Utilities Index
                                                                   Utilities

                                                                   S&P/TSX Composite                       S&P/TSX Composite High
                                                                   Dividend Index                          Dividend Index

    Approximate Geographic Dispersion of Public Float            Comments

                                                               • 595 million common shares outstanding, listed on
                        4%
                                                                 Toronto Stock Exchange (TSX: H)
              21%
                                                               • Equity market capitalization of ~$12.5 billion1 and
                                               Canada            public float of ~$7 billion
                                               US              • Equity market capitalization amongst the top 30 of all
                                                                 listed Canadian companies
                                    75%        Rest of World
                                                               • Secondary offerings by Province increased liquidity
                                                                 without diluting public shareholders
                                                               (1) Based on closing share price on March 29, 2018
Investor Overview – Post First Quarter 2018                                                                                          20
COMMON SHARE DIVIDENDS
   Consecutive annual 5% increase to dividend announced on May 15th, 2018
                                                                                                        Key Points

     Dividend Statistics                                                                                • Quarterly dividend increased to
                                                                                                          $0.23 per share ($0.92 annualized)
     Yield1                                                                4.4%
                                                                                                        • Targeted dividend payout ratio
     Annualized Dividend2,3                                         $0.92 / share                         remains at 70% - 80% of net income
    (1) Based on closing share price on March 29, 2018                                                  • Attractive and growing dividend
                                                                                                          supported by stable, regulated cash
    (2) Unless indicated otherwise, all common share dividends are designated as "eligible" dividends
    for the purpose of the Income Tax Act (Canada)

                                                                                                          flows and planned rate base growth
    Expected Upcoming Quarterly Dividend Dates3
                                                                                                        • No equity issuance anticipated to
     Declaration Date                         Record Date                           Payment Date          fund planned five year capital
                                                                                                          investment program
     ​May 14, 2018                            ​June 12, 2018                         ​June 29, 2018
                                                                                                        • Non-dilutive dividend reinvestment
                                              ​September 11,                         ​September 28,
     August 13, 2018​
                                                   2018                                      2018
                                                                                                          plan (DRIP) was implemented post
                                                                                                          IPO (shares purchased on open
     November 5, 2018​                   ​December 11, 2018                   ​December 31, 2018
                                                                                                          market, not issued from treasury)
   (3) All dividend declarations and related dates are subject to Board approval.

Investor Overview – Post First Quarter 2018                                                                                                     21
REGULATORY
FRAMEWORK
REGULATORY STAKEHOLDERS

                                              Who: Provincial Government, Ministry of Energy
                                              What: Policy, legislation, regulations

                                              Who: Ontario Energy Board (OEB)
                                              What: Independent electric utility price and service quality regulation

                                              Who: Independent Electricity System Operator
                                              What: Wholesale power market rules, intermediary, North American reliability standards

                                              Who: National Energy Board
                                              What: Federal regulator, international power lines and substations

                                              Who: North American Electric Reliability Corporation
                                              What: Continent-wide bulk power reliability standards, certification, monitoring

                                              Who: Northeast Power Coordinating Council
                                              What: Northeastern North American grid reliability, standards, compliance

Investor Overview – Post First Quarter 2018                                                                                            23
CONSTRUCTIVE RATE REGULATOR (OEB)
 Consistent, independent regulator with a transparent rate-setting process
  •   Transmission and distribution businesses rate-regulated by the Ontario Energy Board (OEB)
  •   Deemed debt / equity ratio of 60% / 40% for both transmission and distribution segments
  •   Hydro One has earned or exceeded its allowed ROE on a consolidated basis over past five years
  •   Reduced regulatory lag through forward-looking test years, revenue decoupling and adjustment mechanisms
                                                                                              Effective
                                             Current rate Allowed                  Expected term of next
                                             methodology    ROE                   rate base1 application                   Comments

                                                                                      2018                                   Four-year incentive based rate filing expected
                                                  Cost of           2018                           File in 2018
                Transmission                                                         $11.87                                  to be filed later in 2018 for rates effective
                                                  Service           9.00%                          for 2019-22
                                                                                     billion                                 January 1, 2019

                                                                                               Effective
                                             Current rate Allowed                 Expected term of next
                                             methodology ROE3                    rate base2,3 application                  Comments

                                                                                                                             Five-year incentive based rate filing made
                                                                    2018              2018     Filed on 31st
                                                  Cost of                                                                    March 31, 2017. Decision for phased
                Distribution                                                                   March, 2017
                                                  Service           9.00%        $7.87 billion for 2018-22                   transition to fixed residential rates
                                                                                                                             (decoupling) already in place.

(1)   Transmission rate base includes 100% of B2M JV and Hydro One Sault Ste. Marie
(2)   Distribution Rate Base includes recent LDC acquisitions and Hydro One Remote Communities
(3)   Company estimates subject to change and include amounts from March 2017 filed distribution rate application which is subject to OEB approval

 Investor Overview – Post First Quarter 2018                                                                                                                                  24
DISTRIBUTION SEGMENT INCENTIVE
  REGULATORY CONSTRUCT
   The transition from cost of service to incentive based regulatory model
   coincident with transformation of business will create value for both customers
   and shareholders
      • Filed March 31, 2017 under OEB’s Custom Incentive Rate Making model for 2018 – 2022 five year term
      • 2018 is considered “rebasing” year where a cost of service forward test year rate model is applied
      • Revenue requirement for each of the ensuing four years determined annually by
          • i) applying an inflation adjustment factor,
          • ii) offset by a productivity and stretch factor of 0.45%, and
          • iii) adding a capital factor (added revenue requirement to recover planned capital investments)
      • ROE and short term debt rate set based on OEB approved Cost of Capital Parameter Update, issued
        November 23 2017. Additional update in 2021 requested
      • 50% of earnings that exceed allowed ROE by more than 100 basis points in any year of the term of the filing
        shared with customers (actual sharing deferred until 2023 rebasing)
      • Previously acquired Norfolk, Haldimand and Woodstock LDC’s brought into rate base in 2021
      • Planned rate base CAGR of 5% over five year term of filing
      • Average annual impact on rates over the five year term of the rate application is approximately 3.5%
      • Transmission segment incentive rate filing expected to be filed under same construct in 2018 for four year
        period 2019 – 2022

Investor Overview – Post First Quarter 2018                                                                           25
DELIVERING CLEAN AND
    SUSTAINABLE ENERGY
     Transmitting and delivering some of the cleanest energy in North America
     • Ontario was the first North American jurisdiction to fully eliminate coal
       electricity generation and leads Canada in wind and solar capacity
     • Recent five year Ontario Climate Change Action Plan will further
       accelerate province’s leadership in reduction of greenhouse gas emissions
     • One of only four utilities in Canada to achieve the Sustainable Energy
       Company designation from the Canadian Electrical Association
     • Ontario electricity now generated by: nuclear 58%, hydro 23%, natural gas 10%, wind 7%, solar 2%
     • Ranked as the top utility in Corporate Knights Canada’s 2016 Best Corporate Citizens on a set of 12
       sustainability metrics, including carbon productivity and gender diversity in leadership
     • Environmental stewards of thousands of kilometers of transmission grid corridor lands, including
       management of vegetation for habitat preservation and protection of species at risk
     • ISO 14001 Compatible Environmental Management System to identify and proactively manage
       environmental risks for continual improvement
     • Greener Choices program actively engages employees in sustainability improvement efforts for energy
       efficiency, recycling and waste reduction at work

Investor Overview – Post First Quarter 2018                                                                  26
WHY INVEST IN HYDRO ONE
   A unique low-risk opportunity to participate in the transformation of a
   premium, large scale regulated electric utility
   • One of the largest electric utilities in North America with significant scale and leadership position across
     Canada’s most populated province
   • Unique combination of pure-play electric power transmission and local distribution, with no generation or
     material exposure to commodity prices
   • 99% of business is rate-regulated in a constructive, stable, transparent and collaborative regulatory
     environment
   • Predictable growth profile with expanding rate base and strong cash flows, together with broad support for
     refurbishment of aging infrastructure
   • Opportunities to transform to a performance driven culture, capture productivity improvements and
     transition to incentive-based regulatory model
   • One of the strongest investment grade balance sheets in the North American utility sector
   • Increased $0.92 annualized dividend with 70% - 80% target payout ratio and opportunity for continued
     dividend growth with rate base expansion, continued consolidation and efficiency realization
   • Float and liquidity increased without dilution as phased privatization by Province of Ontario was executed
   • Blue chip fully independent board together with legislated governance structure allow company to operate
     autonomously, transform culture and drive shareholder value creation on multiple fronts
   • Proven management team with demonstrated experience transforming organizations, accelerating
     performance and creating significant shareholder value

Investor Overview – Post First Quarter 2018                                                                         27
APPENDIX
HYDRO ONE LIMITED

1Q18 FINANCIAL SUMMARY                                                        First Quarter                                                                        Full Year
    ($ millions)                                                           2018         2017                             % Change                        2017              2016                       % Change
     Revenue
     Transmission                                                              421                      367                     14.7%                    $1,578                    $1,584                    (0.4%)
     Distribution                                                            1,145                     1,279                   (10.5%)                    4,366                     4,915                   (11.2%)
     Distribution (Net of Purchased Power)                                     394                      390                      1.0%                     1,491                     1,488                     0.2%
     Other                                                                      10                       12                    (16.7%)                      46                        53                    (13.2%)
        Consolidated                                                          1576                     1658                     (4.9%)                    5,990                     6,552                    (8.6%)
     Consolidated (Net of Purchased Power)                                     825                      769                      7.3%                     3,115                     3,125                    (0.3%)
     OM&A Costs                                                                270                      271                     (0.4%)                    1,066                     1,069                    (0.3%)
     Earnings Before Financing Charges and Income Taxes (EBIT)
     Transmission                                                              213                      164                     29.9%                      783                       812                     (3.6%)
     Distribution                                                              157                      153                      2.6%                      508                       501                      1.4%
     Other                                                                     (12)                     (14)                    14.3%                       (59)                     (35)                   (68.6%)
     Consolidated                                                              358                      303                     18.2%                     1,232                     1,278                    (3.6%)
     Net   Income1                                                             222                      167                     32.9%                      658                       721                     (8.7%)
     Adjusted Net Income1,2                                                    210                      167                     25.7%                      694                       721                     (3.7%)
     Basic EPS                                                               $0.37                     $0.28                    32.1%                     $1.11                     $1.21                    (8.3%)
     Adjusted Basic EPS1                                                     $0.35                     $0.28                    25.0%                     $1.17                     $1.21                    (3.3%)
     Capital Investments                                                       305                      350                    (12.9%)                    1,567                     1,697                    (7.7%)
     Assets Placed In-Service
     Transmission                                                               38                       82                    (53.7%)                     889                       937                     (5.1%)
     Distribution                                                              105                      146                    (28.1%)                     689                       662                      4.1%
     Other                                                                       2                        0                         -                       14                         6                         -
     Consolidated                                                              145                      228                    (36.4%)                    1,592                     1,605                    (0.8%)

Investor Overview – Post First Quarter 2018                                                                                                                                                                               29
 Financial Statements reported under U.S. GAAP
 (1) Net Income is attributable to common shareholders and is after non-controlling interest, dividends to preferred shareholders, (2) Adjusted Net Income excludes items related to the Avista Corporation acquisition
TOP TRANSMISSION CAPITAL
PROJECTS UNDERWAY
                                                                                                              Anticipated                   Estimated           Capital Cost
Development Project Name                          Location                             Type
                                                                                                            In-Service Date                    Cost               To-Date
Clarington Transmission Station           Oshawa area                       New transmission                        2018                    $252 million        $228 million
                                          Southwestern Ontario              station
Niagara Reinforcement Project             Niagara area                      New transmission                        2019                    $119 million        $102 million
                                          Southwestern Ontario              line

East-West Tie Station Expansion           Northern Ontario                  New transmission                        2021                    $157 million         $9 million
                                                                            connection and
                                                                            station expansion
Northwest Bulk Transmission               Thunder Bay area                  New transmission                        2024                    $350 million         $1 million
Line                                      Northwestern Ontario              line

                                                                                                              Anticipated                   Estimated           Capital Cost
 Sustainment Project Name                         Location                             Type
                                                                                                            In-Service Date                    Cost               To-Date
Bruce A Transmission Station1             Tiverton area                      Stations                               2020                    $109 million        $109 million
                                          Southwestern Ontario               sustainment
Richview TS Circuit Breaker               Toronto area                       Stations                               2019                    $103 million         $88 million
Replacement                               Southwestern Ontario               sustainment

Lennox TS Circuit Breaker                 Napanee area                       Stations                               2023                    $95 million          $48 million
Replacement                               Southeastern Ontario               sustainment
Beck #2 TS Circuit Breaker                Niagara area                       Stations                               2022                    $93 million          $54 million
Replacement                               Southwestern Ontario               sustainment

Investor Overview – Post First Quarter 2018           (1)   The estimated cost to complete the Bruce A Transmission Station project is currently under review                  30
INDEPENDENT BOARD OF DIRECTORS
                                                                                                         James Hinds Currently a Director of Allbanc Split Corp., a mutual fund company and the
    David Denison, O.C., FCPA, FCA Currently a Director of Royal Bank of Canada (Audit
                                                                                                         former Board Chair of the Independent Electricity System Operator and of the Ontario Power
    Committee Chair), Bell Canada, and Sinai Health Systems (Vice-Chair). Formerly President and
                                                                                                         Authority (Board Chair). A retired investment banker, he previously served as Managing Director of
    CEO of the Canada Pension Plan Investment Board, President of Fidelity Investments Canada
                                                                                                         TD Securities Inc., and also held senior positions with CIBC Wood Gundy Inc. and Newcrest
    Limited and of Bentall Kennedy LP (Board Chair), and Director of Allison Transmission Holdings.
                                                                                                         Capital Inc.

    Ian Bourne, ICD.D, F.ICD         Currently a Director of Ballard Power Systems (Board Chair) and a
                                                                                                         Roberta Jamieson C.M., I.P.C, LL.B, LL.D (Hon) Currently the President and CEO of
    Director of Canada Pension Plan Investment Board, Wajax Corporation, and the Canadian Public
                                                                                                         Indspire. Formerly a Director of Ontario Power Generation, Member of the Elections Canada
    Accountability Board. Formerly the Board Chair and interim CEO of SNC-Lavalin Group, Executive
                                                                                                         Advisory Board, Chief of the Six Nations of the Grand River, and Ombudsman of Ontario (1989-
    Vice President and CFO of TransAlta Corporation, President and Director of TransAlta Power LP,
                                                                                                         1999).
    and Director of Canadian Oil Sands Limited.

                                                                                                         Hon. Frances L. Lankin, P.C., C.M. Currently a member of the Senate of Canada and a
    Charles Brindamour Currently is Chief Executive Officer of Intact Financial Corporation,
                                                                                                         Director of the Ontario Lottery and Gaming Corporation. Formerly an MPP and Cabinet Minister,
    which, under his leadership, became an independent and widely-held Canadian company in
                                                                                                         Member of the Queen’s Privy Council for Canada and Member of its Security Intelligence Review
    2009. Currently a board member of Intact Financial Corporation, of the C.D. Howe Institute and of
                                                                                                         Committee, President and CEO of the United Way – Toronto, and Director of the Institute of
    the Insurance Bureau of Canada, and a member of the Advisory Committee of the Climate Change
                                                                                                         Corporate Directors and the National NewsMedia Council (Board Chair).
    Adaptation Project, an initiative of the University of Waterloo.

    Marcello (Marc) Caira Currently a Director of Restaurant Brands International Inc. (Vice-            Philip S. Orsino, O.C., FCPA, FCA Currently a Director of the Bank of Montreal (Audit and
    Chairman), Director of Gildan Activeware, and Director of The Minto Group. Formerly President        Conduct Review Committee Chair) and of The Minto Group. Formerly a Director of Clairvest Group
    and CEO of Tim Hortons Inc., held extensive senior management and executive roles with Nestlé        Inc. (Audit Committee Chair), Biox Corporation (Board Chair), University Health Network (Board
    Canada, Nestlé S.A. and Parmalat North America Inc., including serving as COO of Parmalat            Chair), President and CEO Jeld-Wen Inc. and President and CEO of Masonite International
    Canada Inc. and President and CEO of Parmalat North America.                                         Corporation.

                                                                                                         Jane Peverett, FCMA, ICD.D Currently a Director of the Canadian Imperial Bank of
    Christie Clark, FCA, FCPA Currently a Director of Loblaw Companies, Air Canada, and
                                                                                                         Commerce (Audit Committee Chair), Canadian Pacific Railway, and Northwest Natural Gas.
    Choice Properties Real Estate Investment Trust and a member of the Advisory Board of the Smith
                                                                                                         Formerly a Director of the Canadian Electricity Association, Encana Corporation (Audit Committee
    School of Business at Queen’s University. Formerly the CEO and Senior Partner of
                                                                                                         Chair), AEGIS Insurance Services, President and CEO of the British Columbia Transmission
    PricewaterhouseCoopers Canada and served as PwC’s National Managing Partner and a member
                                                                                                         Corporation and President and CEO of Union Gas.
    of the firm’s Executive Committee.

    George Cooke A Director of Hydro One since 2010. Currently a Director of OMERS
    Administration Corporation (Board Chair), CANATICS, and the Ontario Lottery and Gaming
                                                                                                         Gale Rubenstein A Director of Hydro One since 2007. Currently a Partner of Goodmans LLP
    Corporation. Formerly President, CEO and Director of The Dominion of Canada General Insurance
                                                                                                         and a member of the firm’s Executive Committee and a Fellow of the Insolvency Institute of Canada.
    Company, a Director of the Insurance Bureau of Canada, a Director and Executive Vice President
    of E-L Financial Corporation Limited, Director of Empire Life Insurance and AECL (Atomic Energy of
    Canada Limited).

    Margaret (Marianne) Harris Currently a Director of the Investment Industry Regulatory
    Organization of Canada (Board Chair) and a Director of Sun Life Financial Inc., Sun Life Assurance
    Company of Canada and Loblaw Companies Limited. Formerly a Director of Agrium Inc.,
    Managing Director of the Bank of America Merrill Lynch, President of Corporate and Investment
    Banking for Merrill Lynch Canada Inc. and Head of the Financial Institutions Group at RBC Capital
    Markets.

Investor Overview – Post First Quarter 2018                                                                                                                                                                   31
DISCLAIMERS
 DISCLAIMERS
 In this presentation, all amounts are in Canadian dollars, unless otherwise indicated. Any graphs, tables or other information in this presentation
 demonstrating the historical performance of the Company or any other entity contained in this presentation are intended only to illustrate past
 performance of such entitles and are not necessarily indicative of future performance of Hydro One. In this presentation, “Hydro One” refers to
 Hydro One Limited and its subsidiaries and other investments, taken together as a whole.

 Forward-Looking Information
 This presentation contains “forward-looking information” within the meaning of applicable Canadian securities laws. Forward-looking information
 in this presentation is based on current expectations, estimates, forecasts and projections about Hydro One’s business and the industry in which
 Hydro One operates and includes beliefs of and assumptions made by management. Such statements include, but are not limited to: statements
 regarding planned securities filings; statements related to dividends; statements regarding future equity issuances; expectations regarding funding
 for planned capital investments; statements related to rate applications, proceedings and models; and statements regarding rate base and cash
 flows.

 Words such as “aim”, “could”, “would”, “expect”, “anticipate”, “intend”, “attempt”, “may”, “plan”, “will”, “believe”, “seek”, “estimate”,
 “goal”, “target”, and variations of such words and similar expressions are intended to identify such forward-looking information. These
 statements are not guarantees of future performance and involve assumptions and risks and uncertainties that are difficult to predict. Therefore,
 actual outcomes and results may differ materially from what is expressed, implied or forecasted in such forward-looking information. Hydro One
 does not intend, and it disclaims any obligation to update any forward-looking information, except as required by law.

 The forward-looking information in this presentation is based on a variety of factors and assumptions, as described in the financial statements and
 management’s discussion and analysis. Actual results may differ materially from those predicted by such forward-looking information. While
 Hydro One does not know what impact any of these differences may have, Hydro One’s business, results of operations and financial condition
 may be materially adversely affected if any such differences occur. Factors that could cause actual results or outcomes to differ materially from the
 results expressed or implied by forward-looking information are described in the financial statements and management’s discussion and analysis.

 Non-GAAP Measures
 Hydro One prepares and presents its financial statements in accordance with U.S. GAAP. “Funds from Operations” or “FFO”, “Adjusted Net
 Income”, “Revenue Net of Purchased Power” and “Adjusted Earnings Per Share” are not recognized measures under U.S. GAAP and do not
 have standardized meanings prescribed by U.S. GAAP. These are therefore unlikely to be comparable to similar measures presented by other
 companies. Funds from Operations should not be considered in isolation nor as a substitute for analysis of Hydro One’s financial information
 reported under U.S. GAAP. “Funds from Operations” or “FFO” is defined as net cash from operating activities, adjusted for the following: (i)
 changes in non-cash balances related to operations, (ii) dividends paid on preferred shares, and (iii) non-controlling interest distributions.
 Management believes that these measures will be helpful as a supplemental measure of the Company’s operating cash flows and earnings. For
 more information, see “Non-GAAP Measures” in Hydro One’s 2017 full year MD&A.

Investor Overview – Post First Quarter 2018                                                                                                              32
CONTACT

        Omar Javed
        Vice President, Investor Relations
        ojaved@HydroOne.com
        (416) 345-5943

        HydroOne.com/InvestorRelations

Investor Overview – Post First Quarter 2018   33
You can also read