Age specific social mixing of school aged children in a US setting using proximity detecting sensors and contact surveys - Nature
←
→
Page content transcription
If your browser does not render page correctly, please read the page content below
www.nature.com/scientificreports
OPEN Age‑specific social mixing
of school‑aged children in a US
setting using proximity detecting
sensors and contact surveys
Kyra H. Grantz 1,2,3, Derek A. T. Cummings 1,2,3, Shanta Zimmer4,5, Charles Vukotich Jr.4,
David Galloway6, Mary Lou Schweizer4, Hasan Guclu 6,11, Jennifer Cousins6,12,
Carrie Lingle6,13, Gabby M. H. Yearwood7, Kan Li 6,14, Patti Calderone4, Eva Noble3,
Hongjiang Gao8, Jeanette Rainey8,15, Amra Uzicanin8 & Jonathan M. Read 9,10*
Comparisons of the utility and accuracy of methods for measuring social interactions relevant to
disease transmission are rare. To increase the evidence base supporting specific methods to measure
social interaction, we compared data from self-reported contact surveys and wearable proximity
sensors from a cohort of schoolchildren in the Pittsburgh metropolitan area. Although the number
and type of contacts recorded by each participant differed between the two methods, we found good
correspondence between the two methods in aggregate measures of age-specific interactions. Fewer,
but longer, contacts were reported in surveys, relative to the generally short proximal interactions
captured by wearable sensors. When adjusted for expectations of proportionate mixing, though,
the two methods produced highly similar, assortative age-mixing matrices. These aggregate mixing
matrices, when used in simulation, resulted in similar estimates of risk of infection by age. While
proximity sensors and survey methods may not be interchangeable for capturing individual contacts,
they can generate highly correlated data on age-specific mixing patterns relevant to the dynamics of
respiratory virus transmission.
Social interactions or person-to-person contacts can influence the transmission of many infectious diseases.
Respiratory viruses, such as influenza, are transmitted primarily through large infectious droplets when an ill
person coughs or sneezes within relatively short distances of others1,2. Close contact facilitates transmission of
respiratory diseases, but the extent to which various populations are connected by these potential transmission
events remains unclear. Identifying more precisely the routes of disease transmission therefore has important
implications for public health policy and pandemic response, and can direct resources to most efficiently target
groups at high risk of transmission.
The POLYMOD study3 was the first large-scale, survey-based study aimed at quantifying social contact
patterns in eight European countries, showing differential contact rates by age and age-assortative mixing.
The empirical data on social interactions and contact behaviours collected through POLYMOD and other
1
Department of Biology, University of Florida, Gainesville, FL 32611, USA. 2Emerging Pathogens Institute,
University of Florida, Gainesville, FL 32611, USA. 3Department of Epidemiology, Johns Hopkins Bloomberg School
of Public Health, Baltimore, MD 21205, USA. 4Division of General Internal Medicine, University of Pittsburgh
School of Medicine, Pittsburgh, PA 15213, USA. 5Department of Medicine, University of Colorado School of
Medicine, Denver, CO 80045, USA. 6Graduate School of Public Health, University of Pittsburgh, Pittsburgh,
PA 15213, USA. 7Department of Anthropology, University of Pittsburgh, Pittsburgh, PA 15213, USA. 8Division of
Global Migration and Quarantine, US Centers for Disease Control and Prevention, Atlanta, GA 30033, USA. 9Centre
for Health Informatics Computing and Statistics, Lancaster Medical School, Lancaster University, Lancaster LA1
4YW, UK. 10Institute of Infection and Global Health, University of Liverpool, Liverpool L69 7BE, UK. 11Present
address: Department of Biostatistics and Medical Informatics, School of Medicine, Istanbul Medeniyet University,
Istanbul, Turkey. 12Present address: Department of Psychology, University of Pittsburgh, Pittsburgh, PA,
USA. 13Present address: Toledo Lucas County Health Department, Toledo, OH, USA. 14Present address: Merck
Pharmaceuticals, Philadelphia, PA, USA. 15Present address: Division of Global Health Protection, US Centers for
Disease Control and Prevention, Atlanta, GA, USA. *email: jonathan.read@lancaster.ac.uk
Scientific Reports | (2021) 11:2319 | https://doi.org/10.1038/s41598-021-81673-y 1
Vol.:(0123456789)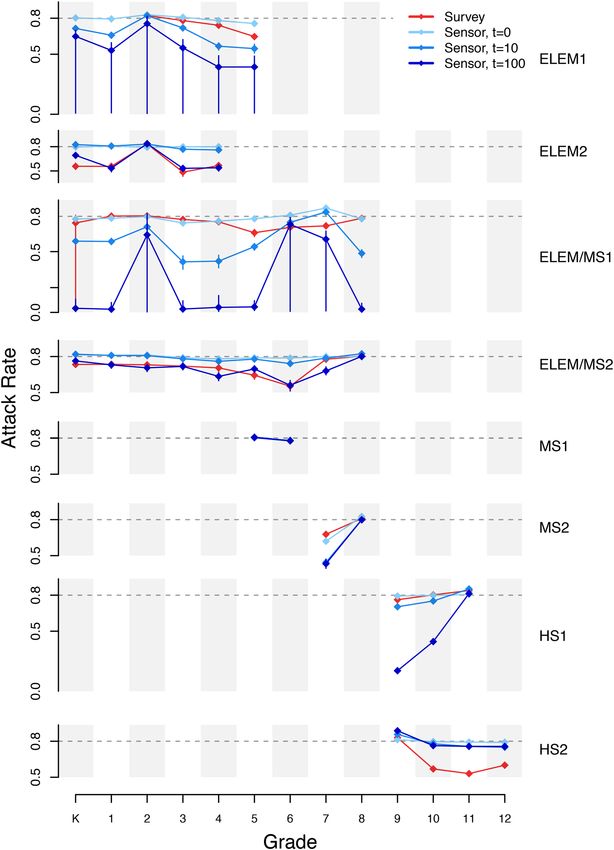
www.nature.com/scientificreports/
survey-based studies have improved efforts to explain and predict spread of infectious disease, including mumps
and influenza4–10. Many studies since have sought to characterize social mixing patterns in a variety of popula-
tions using contact s urveys11–28 as well as wearable proximity s ensors11,22,23,29–33, social media or mobile phone
data22,34,35, direct observation36, and model-based approaches incorporating demographic and time-use data37–39.
Few studies, though, have considered the use of non-survey social contact data in parameterizing mathematical
models9,40.
There has been particular interest in the role of school-aged children (approximately 5–18 years of age) in
transmission of many respiratory infections41. Schoolchildren are at high risk of infection by influenza and
other respiratory p athogens42,43. The local nature of geographic spread during the 2009 A/H1N1 pandemic, the
strong associations between pandemic onset and school openings, and the high attack rates observed within
schools all confirm the critical role schoolchildren play in facilitating t ransmission44–47. Schoolchildren gener-
ally display highly assortative mixing by age (i.e., they preferentially interact with children of the same age) and
high contact rates with adults and the elderly (their parents and grandparents) which may facilitate transmission
among schoolchildren and within their surrounding c ommunities3,4,13,16,25,48. Many public health interventions,
including school closures and vaccination campaigns, focus on the role of schoolchildren in the spread of res-
piratory infections49,50.
One challenge in drawing links between patterns of social contacts and respiratory disease transmission is
the difficulty in empirically measuring patterns of proximal social interaction. Social contacts that can lead to
transmission of pathogens can potentially be transient, non-synchronous (i.e., through contamination of the envi-
ronment), and of varying i ntensity2,51. Multiple methods have been used to measure social contact, the relative
disadvantages and advantages of which have been described e lsewhere51. The majority have used interviews or
surveys to collect data on self-reported contacts, raising the possibility of significant recall bias52. These contacts
may or may not involve conversation, physical touch, or other features that may make them more memorable
and thus more likely to be reported. Proximity-detecting wearable sensors, or motes, offer an alternative to
self-reported data by automatically logging other sensors when nearby31. These proximal interactions, though,
may differ in important ways from self-reported interactions and may not capture aspects of social interactions
that are critical to the transmission of respiratory pathogens. Little information is available on the comparative
reliability and limitations of these methods in characterizing epidemiologically important social contacts11,52–56.
To support the use of social contact data to inform epidemic models, we conducted paper and online contact
surveys and deployed proximity sensors in a population of US schoolchildren. We compared individual-level
and aggregate age-specific mixing patterns captured by both methods and considered qualitative and quantita-
tive differences in predicted attack rates from transmission models of respiratory pathogens using these data.
Results
Study population and average contact patterns. The Social Mixing and Respiratory Transmission
(SMART) study was conducted in eight schools in the Pittsburgh standard metropolitan statistical area from
February 2012 to June 2012. Students in kindergarten (K) to 12th grade were eligible to participate. At least one
contact survey distribution overlapped with a proximity sensor deployment in each school, and students could
participate in more than one contact survey distribution.
Of the 2,337 students enrolled in the eight participating schools, 1,325 (56.7%) completed 2,155 contact
surveys, and 1,834 (78.5%) participated in a school-based sensor deployment (Table 1). Of the students who
participated in a sensor deployment, 1,125 (61.3%) completed at least one contact survey, 826 (45.0%) students
completed a survey about a day on which they also wore a sensor, and 730 (39.8%) completed two surveys.
Generally, younger students were overrepresented in the sensor deployment populations and underrepresented
in the survey-completing populations (Fig. 1, Supp. Table S1).
Proximity sensors on average captured more contacts, defined as the total number of participants with whom
an individual recorded at least one sensor interaction, per student than self-reported surveys, which captured self-
reported social contacts with all students, including interactions which involved speaking, playing, or touching
(Table 1, Supp. Table S1). The range in the number of survey-reported contacts, particularly for total contacts,
was large (Fig. 1). Few paper surveys reported more than 30 contacts per day (0.5%, 8/1760), compared to web-
completed surveys (3.0%, 12/395). The distribution of the number of unique sensor-recorded contacts was less
skewed, but the presence of several high-degree nodes (individuals with many contacts) became increasingly
apparent as the minimum number of cumulative contacts (an approximation of contact duration) required to
be considered a unique contact was increased. The average duration of a survey-reported contact was 124.3 min,
compared to just 7.5 min for sensor-recorded contacts. There was marked similarity between the distribution
of survey-reported in-school contacts (Fig. 1C) and unique sensor-recorded contact events with at least 100
cumulative contacts (Fig. 1G), but the association at an individual level was unclear.
Individual‑level concordance of contact surveys and sensors. In multivariate regression analysis
adjusted for participant age, sex, and survey design, sensor-recorded and survey-reported contacts rarely served
as significant predictors of one another (Fig. 2, Supp. Fig. S1). Increasing the cumulative contact threshold for
sensor contacts did not improve these associations. Generally, the number of survey-reported contacts increased
with age. Duration of survey-reported contacts increased with age as well, but the effect size was reduced com-
pared to the number of contacts. Survey type or method of administration was not associated with number
or duration of recorded contacts. Male students were less likely than female students to report contacts and
reported shorter contacts on average in contact surveys.
Scientific Reports | (2021) 11:2319 | https://doi.org/10.1038/s41598-021-81673-y 2
Vol:.(1234567890)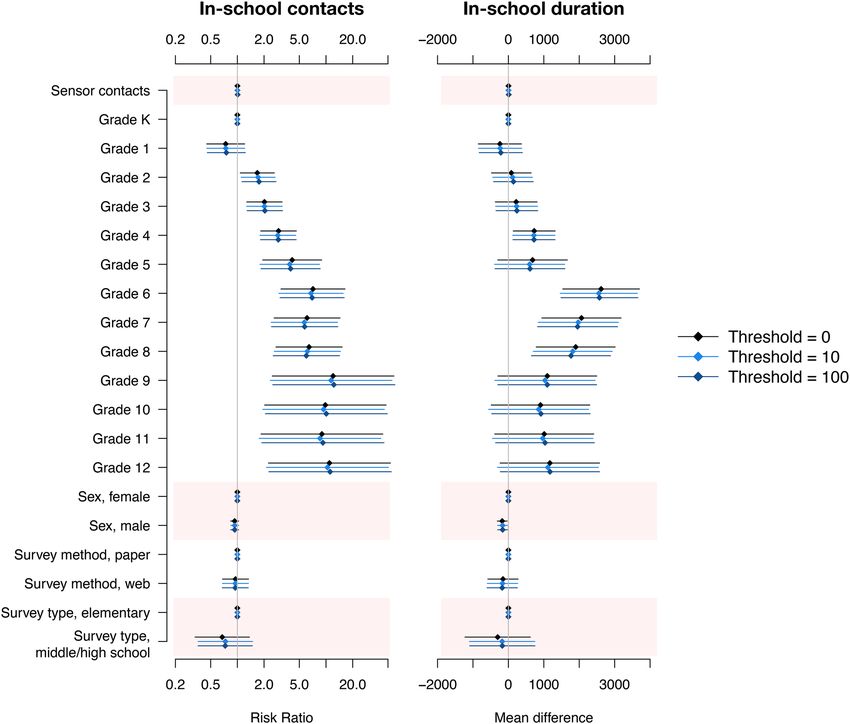
www.nature.com/scientificreports/

Grade       K           1           2           3            4            5            6            7            8            9            10           11           12       Total
Completed ≥ 1 contact survey
No. par-
            49          46          75          91           100          97           81           146          108          134          171          119          108      1325
ticipants
No.
survey      53          55          110         175          143          175          139          219          176          197          302          212          199      2155
responses
Mean no.
detailed                                                                                                                                                             16.0
            5.0 (2.2)   3.7 (2.3)   9.7 (6.5)   11.0 (7.2)   15.2 (8.0)   10.8 (8.2)   16.5 (9.5)   18.7 (9.7)   16.0 (9.4)   17.2 (9.3)   13.9 (9.0)   14.3 (9.0)            14.2 (9.4)
contacts                                                                                                                                                             (10.7)
(sd)
Participated in a sensor deployment
No. par-
            119         131         100         131          136          245          215          157          127          125          149          108          91       1834
ticipants
Mean no.
unique      84.6        81.2        81.8        81.3         83.1         83.2         91.8         92.8         76.3         109.0        109.6        111.9        102.5
                                                                                                                                                                              90.8 (31.9)
contacts    (31.4)      (22.6)      (29.0)      (28.0)       (24.5)       (25.6)       (28.4)       (25.8)       (33.7)       (32.9)       (35.1)       (38.2)       (36.0)
(sd)
Completed ≥ 1 contact survey and participated in sensor deployment
No. par-
            43          43          65          84           88           81           55           129          82           119          143          106          87       1125
ticipants
No.
survey      46          51          99          163          131          149          104          192          134          179          258          190          159      1855
responses
No.
partici-
pants with
           0            0           28          66           65           68           53           56           61           118          129          99           83       826
sensor-
day
survey

                                         Table 1.  Study population and average number of contacts recorded by self-reported contact surveys and
                                         proximity-detecting sensors in a US school setting. Detailed survey-reported contacts are those interactions
                                         for which a student also reported contact age, sex, duration, and context. Unique sensor-recorded contacts for
                                         each participant is the total number of other participants with whom their proximity sensor recorded at least
                                         one interaction during a sensor deployment. Sd standard deviation.

                                         Figure 1.  Distribution of the number of contact events recorded in a US school setting by self-reported contact
                                         surveys and proximity-detecting sensors: (A) total survey-reported contacts; (B) detailed survey-reported
                                         contacts; (C) survey-reported in-school contacts; (E) all unique contacts recorded by sensors; (F) all unique
                                         contacts with more than 10 cumulative contacts (roughly 3 min of interaction); and (G) all unique contacts with
                                         more than 100 cumulative contacts (roughly 30 min of interaction). Insets in (E–G) show the plot of in-school
                                         survey contacts versus each metric of sensor-recorded contacts with a cubic smoothing spline. (D) shows the
                                         population distribution by grade of participants who completed at least one contact survey or participated in a
                                         sensor deployment, compared to the population distribution of the Pittsburgh standard metropolitan statistical
                                         area (PSMSA) for 2012.

Scientific Reports |        (2021) 11:2319 |                       https://doi.org/10.1038/s41598-021-81673-y                                                                          3

                                                                                                                                                                                Vol.:(0123456789)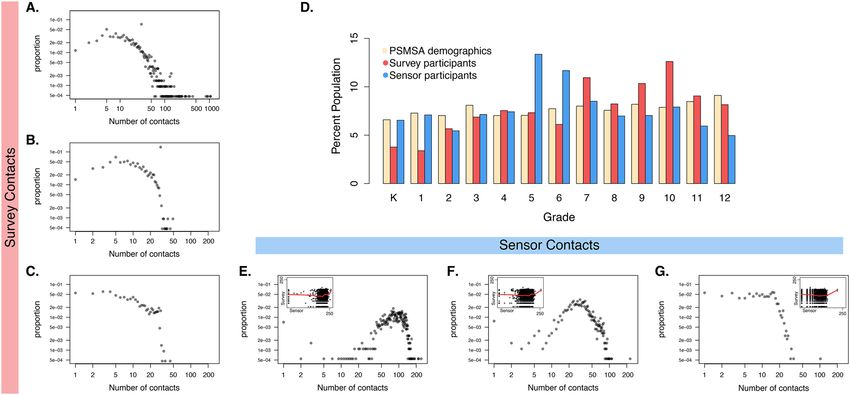
www.nature.com/scientificreports/
Figure 2. Factors associated with the number and duration of survey-reported in-school contacts in a US
school setting. All models include a random intercept for day of survey completion.
Results using multiple thresholds of cumulative sensor contact are shown in the supplement (Supp. Fig. S2).
We found significant associations between sensor outcomes and number of survey-recorded contacts; however,
the effect size was small relative to other factors (e.g., age).
Age‑specific mixing patterns. Age-specific contact patterns derived from both data collection methods
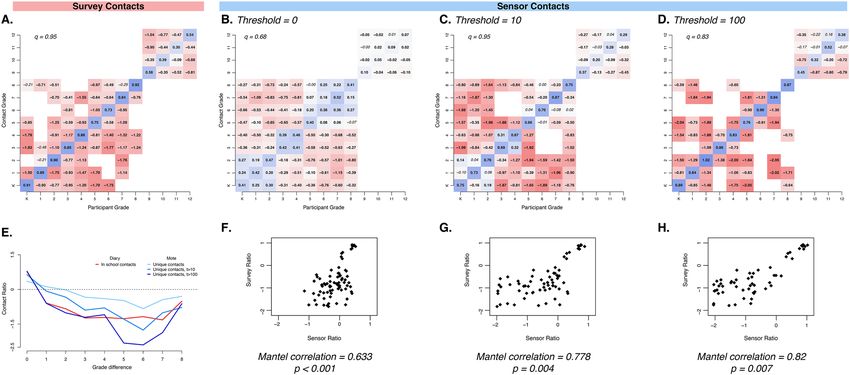
showed highly assortative mixing. For example, in contact surveys, participants reported up to eight times as
many in-school contacts with students of the same grade than would be expected under proportionate mixing
assumptions (Fig. 3A). There was also a striking consistency between pairwise survey- and sensor-recorded
contact ratios as a function of the difference in grade. The average departure from proportionate mixing expecta-
tions for participants in the same grade was 4.07, compared to just 0.72 for participants one grade apart and 0.15
for participants two or more grades apart (Fig. 3E).
Assortativity of age-specific matrices based on contact surveys and sensor data ranged from q = 0.68 to q = 0.95
(Fig. 3). The range was partially due to the structure of the participating schools; in this study, there were no
schools with both high school and non-high school students. However, even within each school, mixing patterns
showed high degrees of assortative mixing (e.g., in-school contact survey-based matrices range from q = 0.62
to q = 0.99, Supp. Fig. S2).
The effect of school structure on mixing patterns was most apparent in matrices based on unique sensor con-
tacts, which revealed three elementary grade clusters (K–2, 3–4, 5–8) within which there was strong assortative
mixing (Fig. 3B). High school students (grades 9 to 12) represented a well-mixed, modular cluster (q = 0.05 and
0.12 for HS1 and HS2, Supp. Fig. S3). Assortativity increased when a threshold of cumulative sensor contacts was
applied (Fig. 3C,D), as did the correlation between the age-specific contact ratios of survey- and sensor-based
matrices (Mantel correlation coefficients 0.63 to 0.88). Matrices based on rate of contact (that is, unadjusted
Scientific Reports | (2021) 11:2319 | https://doi.org/10.1038/s41598-021-81673-y 4
Vol:.(1234567890)www.nature.com/scientificreports/
Figure 3. Age-specific mixing matrices generated from in-school survey contacts and unique sensor-
recorded contacts in a US school setting at various cumulative contact thresholds. Matrices are presented as
log-10 ratio of observed contacts relative to expectation under proportionate mixing assumptions for survey-
reported in-school contacts (A) and sensor-recorded unique contacts with thresholds of 0 (B), 10 (C), and
100 (D) cumulative contacts. Blue colours indicate more contacts than expected under proportionate mixing
assumptions, and red colours indicate less mixing than expected. Bolded ratio values deviate significantly
from the null expectation, ɑ = 0.05, and q equals the degree of assortative mixing. Scatterplots (F–H) show the
corresponding i,j values of the survey- and sensor-based mixing matrices at each threshold (0, 10, 100). (E)
shows the average departure from proportionate mixing as a function of difference between grade for each
matrix.
for proportionate mixing expectations) were qualitatively similar to ratio-based matrices but, as they did not
account for school demography and participation rates across grades, were poor correlates between the two
methods. Age-specific matrices based on survey-recorded contact events lasting longer than 10 min, contact
events reported on days of sensor deployments, and survey- and sensor-recorded contact durations displayed
similar patterns of age assortativity (Supp. Figs. S4, S5).
Transmission models. When used in age-specific simulation, sensor- and survey-based mixing matrices
produced similar attack rates when adjusted by proportionate mixing expectations (Fig. 4). Increasing the con-
tact threshold resulted in more heterogeneity relative to the proportionate mixing baseline. There was discord-
ance between the sensor- and survey-based predicted attack rates in particular schools, which increased with
cumulative sensor contact threshold and disjuncture in contact matrices. However, in other schools, there was
a marked degree of similarity between attack rates regardless of contact matrix employed. In simulations based
on unadjusted contact rate matrices, predicted attack rates were lower in younger children when using survey-
based matrices, a reflection of the different reporting rates by age and specific demography of each school (Supp.
Fig. S6). We explored multiple parameters in our transmission model, assuming reproductive numbers of 1.5, 2
and 3. We found little qualitative difference between these simulations (Supp. Fig. S7).
Discussion
The utility of social contact data to the study of infectious diseases has been limited in part by questions of how
to best measure social interactions relevant to transmission. In this project, we found that, while the two com-
monly used methods captured different information at the individual level, they gave similar results in several
aggregate patterns of contact that are thought to be relevant to pathogen transmission, namely, patterns of
age-specific mixing and probability distributions of the total number of contacts. As in other work, we found
evidence for strong assortativity of contacts by g rade32. This work has important implications for the empirical
parameterization of mathematical models of transmission, particularly of respiratory pathogens. This work
suggests that either empirical approach could be used to characterize age-specific interactions suitable for use
in modelling to inform policy.
Previous studies11,22,23,57 which compared contact surveys to proximity sensors also found poor individual-
level concordance between the two methods: anywhere from 15 to 96% of contacts captured through proximity
sensors were not recorded in contact surveys. Despite the poor individual-level comparisons in these studies,
some found agreement in aggregate patterns across age ranges using two different m ethods30,57.
We also observed substantial absolute differences in the number and type of contacts recorded by self-reported
contact surveys and proximity sensors. We found either metric was a poor predictor of the other, even when
Scientific Reports | (2021) 11:2319 | https://doi.org/10.1038/s41598-021-81673-y 5
Vol.:(0123456789)www.nature.com/scientificreports/
Figure 4. Grade-specific final predicted attack rates of a respiratory virus in a US school setting, based on
stochastic simulation using mixing matrices of in-school survey contacts and unique sensor-recorded contacts
at various contact thresholds, adjusted by proportionate mixing expectations, within each school (ELEM,
elementary; MS, middle school; HS, high school).
adjusting for age, sex, and study factors. However, we found stronger individual-level correspondence between
the measures when we restricted sensor data to contacts with longer cumulative duration (true for 3-min and
30-min minimum thresholds), consistent with earlier work which found longer contacts were more likely to be
reported in surveys11,22,23. In practice, the two methods are designed to capture different social interactions. Per
the study protocol, survey-recorded contacts should only have included those with interactions that involved
talking, playing, or touching, while sensors recorded all other sensors within proximity regardless of whether
participants were socially interacting. That the correspondence increased when limiting sensor information to
proximal contacts with longer duration suggests that these were more likely to be contacts which include social
Scientific Reports | (2021) 11:2319 | https://doi.org/10.1038/s41598-021-81673-y 6
Vol:.(1234567890)www.nature.com/scientificreports/
interactions. It is unclear which type of contact (proximal or social interaction) is most relevant for the spread
of respiratory pathogens.
To determine whether contact patterns measured using different empirical approaches lead to different trans-
mission dynamics, we simulated transmission using models parameterized with data from the two empirical
techniques. In simulations using mixing matrices adjusted by proportionate mixing expectations, similar age-
specific infection patterns were found using sensor and survey data. Previous work has similarly found that, while
simulations using unadjusted contact data from surveys and proximity sensors differ, appropriate adjustment to
survey data which capture key structural elements of the contact network (e.g., age assortativity) leads to consist-
ent simulation results using both kinds of contact data57. Here, differences in attack rates appear to be driven by
increasing disjuncture between grades and age assortativity in certain mixing matrices.
Importantly, the metric we used to compare age-specific contact patterns from survey- and sensor-recorded
data did not account for absolute differences in the overall contact rates of children in each grade. In simulation,
the β estimation procedure (see Supplementary Methods) scaled the overall rate of contact between age-specific
contact matrices, but did not account for possible age-specific differences in average contact rates. Absolute dif-
ference in contact probability may have important epidemiological consequences, particularly when considering
onward transmission to the community. Transmission to family and community members outside school is a
critical component of schoolchildren’s key role in respiratory disease transmission which we do not consider
here. Furthermore, contact patterns are likely to be different on school holidays, weekends, or even when a child
has symptomatic i llness13,58,59; the feasibility of electronic sensors in these contexts has yet to be shown. Future
studies linking the mixing patterns and incidence of respiratory disease among schoolchildren with disease risk
in their communities would provide valuable evidence for planning and control measures.
Our study has some important limitations. Though we adjusted for the demographics of the specific schools
and deployments that we conducted, our results may not be generalizable to other settings. The physical and
architectural environment of our schools, the density of sensors that we were able to deploy in our schools,
and the specific days that we deployed our study may all have affected our results. Technical issues, though not
common, did occur with the sensors, resulting in lost data for some sensors. Similarly, recall bias and misclas-
sification by participants when completing contact surveys may have obscured the relationship between our two
methodological measurements. We found that the design and administration of contact surveys led to some
censoring in the number of contacts reported (Fig. 1). Nonetheless, we believe that the relationships we found
were robust to the misclassifications and biases that may be generated by these sources.
Previous work has indicated that risk of infection with influenza is more closely linked to the average mixing
patterns of an individual’s age group, rather than the individual’s contact b ehaviour7. We found that two common
methods of collecting social contact data, self-reported surveys and proximity sensors, recorded qualitatively and
quantitatively different individual social mixing behaviour but could still generate similar aggregate age-specific
social contact patterns. The collection of high-quality social contact data through either method has important
implications for surveillance, prediction, and prevention of respiratory virus transmission. Our finding that
these two methods found some commonality in aggregate age-specific social contact patterns suggests that these
phenomena are not an artefact of either specific empirical method but attributes of these study populations.
Methods
Study description. Enrolment in the Social Mixing and Respiratory Transmission (SMART) study oper-
ated on an opt-out basis, and all students registered in a participating school before the start of the study were
eligible to participate. Students in kindergarten (typically aged 5 years) to 12th grade (typically aged 18 years)
from two elementary (K to 4th grade, K to 5th grade), two middle (5th to 6th grade, 7th to 8th grade), two
elementary-middle (K to 8th grade), and two high (both 9th to 12th grade) schools were eligible to participate in
SMART. Participation rates were high in all schools (82 to 99%). Each school provided aggregate demographic
information about the school population, and individual grade and sex of participating students.
Proximity sensor deployments. The details of proximity sensor deployments have been described in
detail elsewhere60. In brief, participating students were given proximity sensors in plastic pouches and instructed
to wear the pouch around their neck for the duration of the school day without removing or otherwise tamper-
ing with the sensor. In six of the eight schools, all participating students were given a sensor; in two schools, the
large student population limited the deployment to randomly selected classrooms in each grade. Deployments
typically lasted from the first class period (08:00–09:00) to the last class period (14:00–15:00). Deployment days
in each school were chosen to be representative of a typical school day, without any special schoolwide or grade-
specific activities that could modify normal contact patterns.
We used TelosB wireless s ensors61 programmed in the NesC language to send beacons every 20 s (beacon
frequency 3 per min). The receiving sensor recorded the contacting sensor’s identity, an internal time stamp,
and a radio strength signal indicator (RSSI). Signal strength provided an estimate of physical proximity, but was
highly dependent on the orientation of the two sensors and any obstructions between them and therefore could
not be used to define an exact distance between contacts. Based on pilot studies and previous work on effective
distances of respiratory virus t ransmission29,62, we chose a signal threshold (-80 dBm) that should correspond
to contacts of relevance to respiratory disease transmission.
The number of unique proximity sensor contacts recorded for a participant was defined as the total number of
other participants with whom their proximity sensor recorded at least one interaction during each deployment.
To explore patterns of contacts of varying length, we considered several values of the contact threshold, or the
minimum number of recorded interactions between two proximity sensors required to be considered a unique
Scientific Reports | (2021) 11:2319 | https://doi.org/10.1038/s41598-021-81673-y 7
Vol.:(0123456789)www.nature.com/scientificreports/
contact. The number of interactions between any given pair of sensors was taken to be the maximum number of
interactions recorded by either sensor, to account for battery failure, measurement error, or other malfunctions.
Contact survey design. Contact surveys were completed by participants in school under the supervision
of project staff and teachers. Each sheet of the paper version allowed for information on up to 30 contacts to be
recorded; additional sheets could be requested. Two versions were designed: one for middle- and high-school
students, and a simplified version for elementary school students (although some elementary school children
completed the middle- and high-school version, upon consultation with school administrators and teachers).
Classrooms were randomly selected to participate from each grade, and students of several classrooms com-
pleted more than one contact survey over the course of the study period.
Participants were asked to report information about any individual they talked with, played with, or touched
the previous day, including the contact’s age and sex, whether they attended the same school as the participant,
the context in which the contact was made, whether the contact involved direct or indirect (through a shared
object) touch, and approximate duration of the contact. Students reported the total number of contacts made in
the previous day, without detailed information, and additional demographic information about themselves and
their household. The surveys were completed either on paper or by computer, depending on resources available
in each school.
We defined total survey contacts as the total number of individuals a student reported having interacted with
on the day before the survey was completed. Detailed contacts were the subset of total contacts for which the
student reported contact age, sex, duration, and context. We considered further subsets of detailed survey con-
tacts, including those occurring within school, those reported to have lasted more than 10 min over the course
of the day, and those occurring on the same day as a sensor deployment.
Statistical analysis of individual contact patterns. Transmission risk is likely dependent on both the
type and length of interaction. We therefore estimated contact durations for survey- and sensor-recorded con-
tacts using an exponential fitting method, following the work of Read and Danon12,18 (Supplementary Methods).
Briefly, each sensor interaction was assumed to represent an independent contact of between 0 and 20 s; the total
interactions between a pair of participants were summed to compute the total duration of contact in one deploy-
ment. Participants were asked to record the approximate durations of survey-reported contacts.
We used negative binomial regression to investigate which factors were associated with the number of
reported contacts for each student who participated in a sensor deployment and completed at least one contact
survey. Each model included participant grade, gender, and a random intercept term for day of survey comple-
tion or sensor deployment. Survey administration and sensor deployment days were unique to each school.
Terms for the type and method of survey administration were added to models of survey-recorded outcomes.
Age‑specific mixing matrices. We estimated two metrics of age-specific contact patterns: an average per-
capita mixing rate, and the age-specific mixing ratio of observed contact rates to those expected under the
assumption of proportionate mixing.
Average per‑capita mixing rate. The first metric is the average number or duration of contacts recorded
or reported by a participant in any grade i with a student in grade j:
cij
mij = , i, j ∈ {K, 1, 2, . . . , 12}
ri
where ci,j is the total number or duration of contacts recorded by participants of grade i with individuals in grade
j, divided by the number of participants in grade i, ri. In sensor deployments, contacts could only be recorded
with other participants (sensor-wearers) in grade j. If a certain grade was underrepresented among participants
relative to other grades, fewer contacts would be recorded with individuals in that grade because of the low sen-
sor coverage. Therefore, the sensor contact rate was adjusted by the ratio of the proportion of the total school
n /n
population in grade j to the proportion of sensor participants in grade j, rjj /r , where nj is the number of students
in grade j regardless of participation.
Age‑specific mixing ratio. We also estimated the ratio of the observed age-specific contact rate to the
expected contact rate if the probability of contact were dependent solely on the availability of potential contacts
in a given grade (proportionate mixing assumption).
cij
xj , i � = j
ci ∗ x−1
Kij =
cij
xj −1 , i = j
ci ∗ x−1
where xj is the number of individuals in grade j with whom participants in grade i could record a contact, and
all other terms are as defined above. Values greater than 1 indicate more contacts were recorded by participants
in grade i with individuals of grade j than would be expected under proportionate mixing. Proportionate mix-
ing assumes that an individual in grade i mixing at random will contact individuals in grade j with a probability
Scientific Reports | (2021) 11:2319 | https://doi.org/10.1038/s41598-021-81673-y 8
Vol:.(1234567890)www.nature.com/scientificreports/
equal to the proportion of the population in grade j, but no assumption is made on the probability of individuals
in grade i making any contact relative to other groups.
By design, rj, the participant population, is equal to xj, the contact population, in sensor deployments. For
within-school contacts, we used the demographic information of all registered students in each school to define
the potential contact population. Combined K-12 matrices were generated by averaging age-specific matrices
from all participating schools, weighted by the number of participants in each school.
Confidence intervals were calculated using 1,000 resampled bootstrap replicates of contact events. Mantel
correlation coefficients were used to compare mixing matrices. The degree of assortative mixing, q, was calculated
as the ratio of the first minor eigenvalue to the dominant e igenvalue63, where q ranges from -1, representing
completely disassortative mixing, to 1, completely assortative mixing.
Transmission models. To explore the expected transmission dynamics under different assumptions of
social mixing patterns, we used an age-structured stochastic Susceptible-Exposed-Infectious-Recovered (SEIR)
transmission model to age-specific attack rates (Supplementary Methods). We used transmission parameters
consistent with influenza taken from the literature64 and simulated multiple stochastic realizations of a single
outbreak in a closed population. Recognizing that proximity sensors and self-reported surveys were likely to
record contacts with different transmission potential, we fitted β for each set of parameters, including the age-
specific mixing matrix, using the next-generation matrix to give an R0 of 2.0, a moderate estimate of pandemic
influenza64,65 (Supplementary Methods). Stochastic simulations were conducted using Gillespie’s direct algo-
rithm.
Ethical considerations and approvals. Informed consent was obtained through an opt-out process,
where parents and legal guardians of students in participating schools were sent study information (including an
opt-out declaration to return), prior to study activities and data collection in the schools. All study design of The
SMART study, including the opt-out consenting process, was approved by the ethics committees at the Univer-
sity of Pittsburgh (PRO1102050), the University of Florida (IRB201701941), the University of Liverpool, and the
Centers for Disease Control and Prevention (IRB00000319). Participating students were able to opt out at any
time by simply saying that they did not wish to participate in a study activity. Non-participating students were
given the option to wear non-operative electronic sensors to avoid any stigma associated with not participating
in study activity. All research was performed in accordance with the protocol approved by the above institutions
and in accordance with the relevant guidelines and regulations.
Data availability
De-identified datasets will be made available through the Dryad Repository and through institutional website
(ufiddynamics.org).
Received: 25 February 2019; Accepted: 23 December 2020
References
1. Weber, T. P. & Stilianakis, N. I. Inactivation of influenza A viruses in the environment and modes of transmission: A critical review.
J. Infect. 57, 361–373 (2008).
2. Brankston, G., Gitterman, L., Hirji, Z., Lemieux, C. & Gardam, M. Transmission of influenza A in human beings. Lancet Infect.
Dis. 7, 257–265 (2007).
3. Mossong, J. et al. Social contacts and mixing patterns relevant to the spread of infectious diseases. PLoS Med. 5, 0381–0391 (2008).
4. Wallinga, J., Teunis, P. & Kretzschmar, M. Using data on social contacts to estimate age-specific transmission parameters for
respiratory-spread infectious agents. Am. J. Epidemiol. 164, 936–944 (2006).
5. Rohani, P., Zhong, X. & King, A. A. Contact network structure explains the changing epidemiology of pertussis. Science 330,
982–985 (2010).
6. Ogunjimi, B. et al. Using empirical social contact data to model person to person infectious disease transmission: An illustration
for varicella. Math. Biosci. 218, 80–87 (2009).
7. Kucharski, A. J. et al. The contribution of social behaviour to the transmission of influenza a in a human population. PLoS Pathog.
10, e1004206 (2014).
8. Goeyvaerts, N. et al. Estimating infectious disease parameters from data on social contacts and serological status. J. R. Stat. Soc.
C 59, 255–277 (2010).
9. De Cao, E., Zagheni, E., Manfredi, P. & Melegaro, A. The relative importance of frequency of contacts and duration of exposure
for the spread of directly transmitted infections. Biostatistics 15, 470–483 (2014).
10. Melegaro, A., Jit, M., Gay, N., Zagheni, E. & Edmunds, W. J. What types of contacts are important for the spread of infections?
Using contact survey data to explore European mixing patterns. Epidemics 3, 143–151 (2011).
11. Smieszek, T. et al. How should social mixing be measured: comparing web-based survey and sensor-based methods. BMC Public
Health 14, 136 (2014).
12. Read, J. M. et al. Social mixing patterns in rural and urban areas of southern China. Proc. R. Soc. Lond. B 281, 20140628 (2014).
13. Mikolajczyk, R. T., Akmatov, M. K., Rastin, S. & Kretzschmar, M. Social contacts of school children and the transmission of
respiratory-spread pathogens. Epidemiol. Infect. 136, 813–822 (2008).
14. Grijalva, C. G. et al. A household-based study of contact networks relevant for the spread of infectious diseases in the highlands
of peru. PLoS ONE 10, e0118457 (2015).
15. Danon, L., Read, J. M., House, T. A., Vernon, M. C. & Keeling, M. J. Social encounter networks: Characterizing great Britain. Proc.
R. Soc. B Biol. Sci. 280, 20131037 (2013).
16. Ajelli, M. & Litvinova, M. Estimating contact patterns relevant to the spread of infectious diseases in Russia. J. Theor. Biol. 419,
1–7 (2017).
17. Kiti, M. C. et al. Quantifying age-related rates of social contact using diaries in a rural coastal population of Kenya. PLoS ONE 9,
e104786 (2014).
Scientific Reports | (2021) 11:2319 | https://doi.org/10.1038/s41598-021-81673-y 9
Vol.:(0123456789)www.nature.com/scientificreports/
18. Danon, L., House, T. A., Read, J. M. & Keeling, M. J. Social encounter networks: Collective properties and disease transmission.
J. R. Soc. Interface 9, 2826–2833 (2012).
19. Watson, C. H. et al. Social mixing in Fiji: Who-eats-with-whom contact patterns and the implications of age and ethnic hetero-
geneity for disease dynamics in the Pacific Islands. PLoS ONE 12, e0186911 (2017).
20. Leung, K., Jit, M., Lau, E. H. Y. & Wu, J. T. Social contact patterns relevant to the spread of respiratory infectious diseases in Hong
Kong. Sci. Rep. 7, 7974 (2017).
21. Read, J. M., Eames, K. T. D. & Edmunds, W. J. Dynamic social networks and the implications for the spread of infectious disease.
J. R. Soc. Interface 5, 1001–1007 (2008).
22. Mastrandrea, R., Fournet, J. & Barrat, A. Contact patterns in a high school: A comparison between data collected using wearable
sensors, contact diaries and friendship surveys. PLoS ONE 10, e0136497 (2015).
23. Leecaster, M. et al. Estimates of social contact in a middle school based on self-report and wireless sensor data. PLoS ONE 11,
e0153690 (2016).
24. Ibuka, Y. et al. Social contacts, vaccination, decisions and influenza in Japan. J Epidemiol Community Heal. 70, 162–167 (2016).
25. Glass, L. M. & Glass, R. J. Social contact networks for the spread of pandemic influenza in children and teenagers. BMC Public
Health 8, 61 (2008).
26. Edmunds, W. J., Kafatos, G., Wallinga, J. & Mossong, J. R. Mixing patterns and the spread of close-contact infectious diseases.
Emerg. Themes Epidemiol. 3, 10 (2006).
27. Béraud, G. et al. The French Connection: The first large population-based contact survey in france relevant for the spread of infec-
tious diseases. PLoS ONE 10, e0133203 (2015).
28. Conlan, A. J. K. et al. Measuring social networks in British primary schools through scientific engagement. Proc. R. Soc. Lond. B
278, 1467–1475 (2011).
29. Salathé, M. et al. A high-resolution human contact network for infectious disease transmission. Proc. Natl. Acad. Sci. USA 107,
22020–22025 (2010).
30. Fournet, J. & Barrat, A. Contact patterns among high school students. PLoS ONE 9, e107878 (2014).
31. Cattuto, C. et al. Dynamics of person-to-person interactions from distributed RFID sensor networks. PLoS ONE 5, e11596 (2010).
32. Stehlé, J. et al. High-resolution measurements of face-to-face contact patterns in a primary school. PLoS ONE 6, e23176 (2011).
33. Ozella, L. et al. Close encounters between infants and household members measured through wearable proximity sensors. PLoS
ONE 13, e0198733 (2018).
34. Stopczynski, A. et al. Measuring large-scale social networks with high resolution. PLoS ONE 9, e95978 (2014).
35. Eagle, N., Pentland, A. & Lazer, D. Inferring friendship network structure by using mobile phone data. Proc. Natl. Acad. Sci. USA
106, 15274–15278 (2009).
36. Talbot, T. R. et al. Influenza vaccination of healthcare workers and vaccine allocation for healthcare workers during vaccine short-
ages. Infect. Control Hosp. Epidemiol. 26, 882–890 (2005).
37. Iozzi, F. et al. Little Italy: An agent-based approach to the estimation of contact patterns—fitting predicted matrices to serological
data. PLoS Comput. Biol. 6, e1001021 (2010).
38. Del Valle, S. Y., Hyman, J. M., Hethcote, H. W. & Eubank, S. G. Mixing patterns between age groups in social networks. Soc. Netw.
29, 539–554 (2007).
39. Prem, K., Cook, A. R. & Jit, M. Projecting social contact matrices in 152 countries using contact surveys and demographic data.
PLoS Comput. Biol. 13, e1005697 (2017).
40. Toth, D. J. A. et al. The role of heterogeneity in contact timing and duration in network models of influenza spread in schools. J.
R. Soc. Interface 12, 20150279 (2015).
41. Glezen, W. P. Emerging infections: Pandemic influenza. Epidemiol. Rev. 18, 64–76 (1996).
42. Worby, C. J. et al. On the relative role of different age groups in influenza epidemics. Epidemics 13, 10–16 (2015).
43. Goldstein, E. et al. On the relative role of different age groups during epidemics associated with respiratory syncytial virus. J. Infect.
Dis. 217, 238–244 (2018).
44. Cauchemez, S. et al. Role of social networks in shaping disease transmission during a community outbreak of 2009 H1N1 pandemic
influenza. Proc. Natl. Acad. Sci. USA 108, 2825–2830 (2011).
45. Lessler, J., Reich, N. G. & Cummings, D. A. T. Outbreak of 2009 Pandemic Influenza A (H1N1) at a New York City School. N. Engl.
J. Med. 361, 2628–2636 (2009).
46. Chao, D. L., Halloran, M. & Longini, I. M. School opening dates predict pandemic influenza A(H1N1) outbreaks in the United
States. J. Infect. Dis. 202, 877–880 (2010).
47. Gog, J. R. et al. Spatial Transmission of 2009 Pandemic Influenza in the US. PLoS Comput. Biol. 10, e1003635 (2014).
48. Hens, N. et al. Estimating the impact of school closure on social mixing behaviour and the transmission of close contact infections
in eight European countries. BMC Infect. Dis. 9, 187 (2009).
49. House, T. et al. Modelling the impact of local reactive school closures on critical care provision during an influenza pandemic.
Proc. R. Soc. B Biol. Sci. 278, 2753–2760 (2011).
50. Grohskopf, L. A. et al. Prevention and Control of Influenza with Vaccines: Recommendations of the Advisory Committee on
Immunization Practices, United States, 2015–16 Influenza Season. MMWR. Morb. Mortal. Wkly. Rep. 64, 818–825 (2015).
51. Read, J. M., Edmunds, W. J., Riley, S., Lessler, J. & Cummings, D. A. T. Close encounters of the infectious kind: Methods to measure
social mixing behaviour. Epidemiol. Infect. 140, 2117–2130 (2012).
52. Smieszek, T., Burri, E. U., Scherzinger, R. & Scholz, R. W. Collecting close-contact social mixing data with contact diaries: Report-
ing errors and biases. Epidemiol. Infect. 140, 744–752 (2012).
53. Smieszek, T. et al. Contact diaries versus wearable proximity sensors in measuring contact patterns at a conference: Method
comparison and participants’ attitudes. BMC Infect. Dis. 16, 341 (2016).
54. Beutels, P., Shkedy, Z., Aerts, M. & Van Damme, P. Social mixing patterns for transmission models of close contact infections:
Exploring self-evaluation and diary-based data collection through a web-based interface. Epidemiol. Infect. 134, 1158–1166 (2006).
55. Mikolajczyk, R. T. & Kretzschmar, M. Collecting social contact data in the context of disease transmission: Prospective and ret-
rospective study designs. Soc. Netw. 30, 127–135 (2008).
56. McCaw, J. M. et al. Comparison of three methods for ascertainment of contact information relevant to respiratory pathogen
transmission in encounter networks. BMC Infect. Dis. 10, 166 (2010).
57. Mastrandrea, R. & Barrat, A. How to estimate epidemic risk from incomplete contact diaries data?. PLoS Comput. Biol. 12, e1005002
(2016).
58. Eames, K. T. D., Tilston, N. L. & Edmunds, W. J. The impact of school holidays on the social mixing patterns of school children.
Epidemics 3, 103–108 (2011).
59. Van Kerckhove, K., Hens, N., Edmunds, W. J. & Eames, K. T. D. The impact of illness on social networks: Implications for transmis-
sion and control of influenza. Am. J. Epidemiol. 178, 1655–1662 (2013).
60. Guclu, H. et al. Social contact networks and mixing among students in K-12 Schools in Pittsburgh, PA. PLoS ONE 11, e0151139
(2016).
61. Polastre, J., Szewczyk, R. & Culler, D. Telos: Enabling ultra-low power wireless research. In 2005 4th International Symposium on
Information Processing in Sensor Networks, IPSN 2005 364–369 (IEEE, 2005).
Scientific Reports | (2021) 11:2319 | https://doi.org/10.1038/s41598-021-81673-y 10
Vol:.(1234567890)www.nature.com/scientificreports/
62. Xie, X., Li, Y., Chwang, A. T. Y., Ho, P. L. & Seto, W. H. How far droplets can move in indoor environments? Revisiting the Wells
evaporation falling curve. Indoor Air 17, 211–225 (2007).
63. Keeling, M. J. & Rohani, P. Modeling Infectious Diseases in Humans and Animals (Princeton University Press, Princeton, 2008).
64. Yang, W., Lipsitch, M. & Shaman, J. Inference of seasonal and pandemic influenza transmission dynamics. Proc. Natl. Acad. Sci.
USA 112, 2723–2728 (2015).
65. Lessler, J., Cummings, D. A. T., Fishman, S., Vora, A. & Burke, D. S. Transmissibility of swine flu at Fort Dix, 1976. J. R. Soc. Interface
4, 755–762 (2007).
Acknowledgements
We are sincerely grateful to all students, teachers, administrators, and school district officials for their participa-
tion in and support of the SMART study. This research was supported by the US Centers for Disease Control and
Prevention (CDC Cooperative Agreement 1U01CK00179-01). DATC and KHG received additional support from
the US NIH MIDAS program U54 GM088491. JMR acknowledges support from the Engineering and Physical
Sciences Research Council (EP/N014499/1). The findings and conclusions in this report are those of the authors
and do not necessarily represent the official position of CDC.
Author contributions
K.H.G., D.A.T.C., S.Z., C.V.J., J.M.R. designed research. D.A.T.C., S.Z., C.V.J., D.G., M.L.S., H.G., J.C., C.L.,
G.M.H.Y., K.L., P.C., E.N., J.M.R. performed research. K.H.G., D.A.T.C., J.M.R. analysed data and wrote manu-
script. All authors reviewed the manuscript and contributed to interpretation of results.
Competing interests
The authors declare no competing interests.
Additional information
Supplementary Information The online version contains supplementary material available at https://doi.
org/10.1038/s41598-021-81673-y.
Correspondence and requests for materials should be addressed to J.M.R.
Reprints and permissions information is available at www.nature.com/reprints.
Publisher’s note Springer Nature remains neutral with regard to jurisdictional claims in published maps and
institutional affiliations.
Open Access This article is licensed under a Creative Commons Attribution 4.0 International
License, which permits use, sharing, adaptation, distribution and reproduction in any medium or
format, as long as you give appropriate credit to the original author(s) and the source, provide a link to the
Creative Commons licence, and indicate if changes were made. The images or other third party material in this
article are included in the article’s Creative Commons licence, unless indicated otherwise in a credit line to the
material. If material is not included in the article’s Creative Commons licence and your intended use is not
permitted by statutory regulation or exceeds the permitted use, you will need to obtain permission directly from
the copyright holder. To view a copy of this licence, visit http://creativecommons.org/licenses/by/4.0/.
© The Author(s) 2021
Scientific Reports | (2021) 11:2319 | https://doi.org/10.1038/s41598-021-81673-y 11
Vol.:(0123456789)You can also read