WORKING PAPER KIEL Fossil fuel subsidy inventories vs. net carbon prices: A consistent approach for measuring fossil fuel price incentives - Kiel ...
←
→
Page content transcription
If your browser does not render page correctly, please read the page content below
KIEL
WORKING
PAPER
Fossil fuel subsidy
inventories vs. net
carbon prices: A
consistent approach
for measuring fossil
fuel price incentives

 No. 2186 May 2021
Jens Böhm, Sonja Peterson

Kiel Institute for the World Economy
ISSN 1862–1155
ABSTRACT
FOSSIL FUEL SUBSIDY INVENTORIES VS.
NET CARBON PRICES: A CONSISTENT
APPROACH FOR MEASURING FOSSIL FUEL
PRICE INCENTIVES
Jens Böhm, Sonja Peterson
Different reports including the broadly cited OECD fossil fuel subsidy inventory arrive at high monetary
values of fossil fuel subsidies and suggest that phasing out these subsidies has a high potential to
increase the efficiency of climate policies. We show that the inventory approach gives misleading
information about this potential since there is little correlation with net carbon prices that actually
reflect the stringency of climate policies. We use data on net fossil fuel taxation from the OECD´s Taxing
Energy Use report and augment it with data on subsidies and emission permits, to calculate national
and sectoral net carbon prices for the top six emitters (China, US, India, Russia, Japan and Germany) and
for Poland and Sweden, two European countries perceived as examples of opposing environmental
policies. Our results show that in high‐income countries, subsidies mainly relate to reduced fuel tax rates
for certain uses, so that e.g. Sweden, for which the OECD inventory reports subsidies per ton of CO2 26
times higher than the US, has a 770% higher national net carbon price than the US. While Germany and
Russia have similar subsidy levels in the OECD inventory, the national net carbon price in Germany is 50
€/tCO2, while producer subsidies lead to a negative net carbon price of ‐6€/tCO2 in Russia. Our results
illustrate that raising taxes on fossil fuels will often lead to higher reported inventory subsidies.
Inventory measures thus give little information about the efficiency of climate policy. Our analysis also
shows the large differences in net carbon prices across countries and across sectors within countries.
Net carbon prices should replace fossil fuel subsidies in the policy debates and become the basis for
national energy tax reforms and international agreements on minimum carbon prices.
Keywords: fossil fuel subsidies, carbon pricing, energy taxation, climate policy
JEL classification: H2; Q48; Q54

Jens Böhm Corresponding Author
Kiel Institute for the World Economy Sonja Peterson
Kiellinie 66 Kiel Institute for the World Economy
D‐24105 Kiel, Germany Kiellinie 66
Email: D‐24105 Kiel, Germany
jenscboehm@gmail.com Email:
www.ifw‐kiel.de sonja.peterson@ifw‐kiel.de
 www.ifw‐kiel.de

The responsibility for the contents of this publication rests with the author, not the Institute. Since working papers are of a
preliminary nature, it may be useful to contact the author of a particular issue about results or caveats before referring to, or
quoting, a paper. Any comments should be sent directly to the author.
1. Introduction
Pricing fossil fuels is essential to reduce the harmful emissions that cause anthropogenic climate change
(Stiglitz et al., 2017). Yet, it is also common practice to subsidize fossil fuels which counteracts climate
policy measures (including in particular carbon pricing) since the subsidies affect marginal incentives to
use these carbon intensive fuels. Reducing fossil fuel subsidies is therefore an important focus of
international climate policy (G20, 2009 and later), and various efforts exists to measure global fossil fuel
subsidies, most notably by the OECD, the IMF and the IEA (see OECD, 2021a, IMF, 2019 and IEA, 2021a).
The resulting high monetary values of fossil fuel subsidy levels are often used in policy debates on the
perverse incentives the subsidies induce and it is suggested that phasing out these subsidies has a high
potential to increase the efficiency of climate policies. Most notably, the joint IEA/OECD fossil fuel
subsidy report prepared for the G20 (OECD/IEA 2019) which is based on the OECD inventory claims to
inform global policy decisions regarding fossil fuel subsidy reforms.
We identify two main problems in how fuel tax subsidies are reported and measured under the OECD
inventory approach. First, we show that with the current inventory methodology, some types of fuel tax
differentiation are considered as subsidies, while other types of differentiation are not. This leaves out
important information on inefficient fuel price differentiation. Second, the value of identified fuel tax
subsidies is measured using tax rate benchmarks specific to the subsidy measure. This is called revenue‐
forgone measurement and implies that the subsidy estimate is sensitive both to the choice of
benchmark fuel rate and the tax structure of the country. This has implications especially for high
income countries, where the majority of identified subsidies are fuel tax reductions and exemptions.
To measure effective price incentives, we develop an alternative Net Carbon Price approach that
extends the also existing OECD´s TEU report. This TEU report reports net fuel tax rates for OECD member
and partner countries (OECD, 2019) and accounts for tax exemptions. To this existing measure we add
price incentives of further subsidy‐types covered in the OECD inventory and for completeness also of
emissions trading schemes. The resulting net carbon price thus includes fuel and carbon taxes, marginal
subsidies and ETS price information and provides a measure of overall price incentives to use or
economize on fossil fuels.
To illustrate the difference between fossil fuel inventory data and net carbon prices and to derive policy
recommendations for sensible climate policy and subsidy reforms, we calculate national‐ and sectoral‐
average net carbon prices for the six largest emitters worldwide (China, US, India, Russia, Japan and
Germany), as well as for Sweden and Poland – two European countries with a perceived opposing focus
in energy and environmental policy.
The contribution of this paper is thus twofold. The first contribution is a methodological one. We
highlight why the existing inventory measures of fossil fuel subsidies give little information about
perverse incentives. We then argue that our alternative measure of net carbon prices avoids the
problems of the inventory approach and is better suited to inform about efficient climate policy and
subsidy reforms. The second contribution is to derive specific policy recommendations from our
calculation of net carbon prices for major emitters.
The paper proceeds as follows. In section 2 we discuss the existing approaches to measure fossil fuel
subsidies and their fundamental problems in detail. This is followed by the presentation of our
alternative net carbon price approach in section 3 that also includes the methodology and data for our
calculations. In section 4 we present our quantitative estimates for net carbon prices and discuss these
with respect to a comparison with inventory data. Section 5 concludes.
2. Methodological Problems of the OECD´s inventory approach for
subsidy measurement
The first global approach used to measure fossil fuel subsidies was the price‐gap approach. It only
recorded a subsidy when prices for a fuel where below international market prices1. The OECD´s subsidy
inventory was developed to also measure fossil fuel subsidies in high‐income countries, where fuel
prices are generally above international market prices due to general (value added taxes) and specific
(fuel) taxes. The OECD inventory includes individual subsidy measures: budgetary transfer subsidies,
fuel tax subsidies and other tax subsidies. Each subsidy measure is quantified individually based on data
from national subsidy transparency reports that identify relevant subsidy measures and their
subsidization amount. The OECD´s subsidy figures are derived by adding up all measures identified for
a country. Globally, their latest 2019 subsidy estimates sum up to of 178 bn (OECD, 2021a).
In this study, we make a distinction between fuel tax subsidies, which lower fuel taxation but do not
provide negative price incentives for fossil fuel use, and other tax subsidies, for example through the
income tax system, which have a real negative price effect. Fuel tax subsidies make up a significant part
of recorded subsidies, especially in high‐income countries. Yet, there are two methodological issues
with how fuel tax subsidies are measured. Firstly, only some fuel tax differentiation is counted as a
subsidy, while other differentiation is not. Secondly, to estimate the monetary value of fuel tax subsidy
measures, a specific headline rate is chosen for each measure based on national subsidy inventories.
We discuss the implicit, uncodified conventions which govern which fuel tax differentiation is deemed
a subsidy measure and show how this so‐called revenue‐forgone estimation and its use of measure‐
specific headline rates affects results.

2.1 – Fuel tax differentiation for subsidy measures
Fuel tax subsidies are identified by uncodified conventions determining which fuel tax differentiations
are deemed normal and which differentiations are deemed a subsidy. National fuel taxes are typically
differentiated by certain characteristics. The main characteristics are fuel type, energy usage (mainly
heating vs. propulsion) and usage sector (e.g. industry). But most of this differentiation is not considered
a subsidy. For example, a higher fuel tax on gasoline than on natural gas, a higher fuel tax on diesel used
for propulsion compared to diesel used for heating or a higher fuel tax on natural gas for residential use
compared to natural gas used for electricity generation – is usually not considered a subsidy by national
authorities and therefore not captured in the data of the OECD inventory.
In general, only fuel tax differentiation by sector is considered a fuel tax subsidy, and even then, only
some type of sector differentiation is commonly considered. There are four general economic sectors –
road/transport, residential/commercial, industry and electricity generation – between which fuel tax
differentiation is generally not considered a subsidy. A fuel tax subsidy is only reported when there is
differentiation within these general sectors. For example, a lower fuel tax on diesel used for agricultural
transport compared to standard transport diesel is usually considered a subsidy, as are lower fuel tax
rates specifically for energy intensive industry (compared to general industry fuel tax rates).

1
 See (IEA, 2021a) for details on this approach and Koplow (2018) or Bárány & Grigonytė (2015) for a comparison
of major subsidy reports from IEA, IMF and OECD.
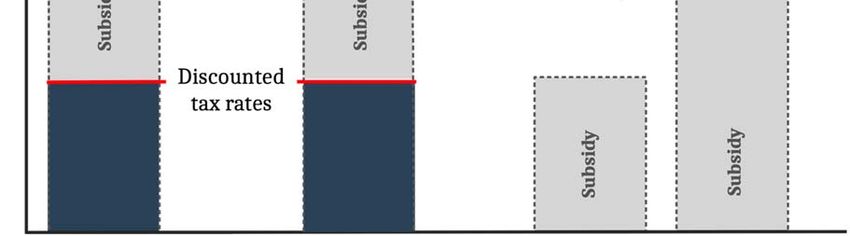
We derive two main insights from this. First, only a small fraction of fuel tax differentiation is counted
in the OECD inventory. Second, removing fuel tax subsidies would not lead to a more level playing field
of more equal fuel taxation, because many cases of differentiated taxation would not be addressed.

2.2 – Problems in quantifying fuel tax subsidies
To quantify the identified fuel tax subsidies the subsidy tax rate is compared with a case‐specific (higher)
headline rate. This is called revenue‐forgone measurement and stems from governments subsidy
transparency reports (see for example BMF, 2017 or Swedish Ministry of Finance, 2019). Revenue‐
forgone is derived by the following simple calculation:
(1)
 ℎ ∗
The headline tax rate is chosen according to how the finance ministry judges the differentiation, usually
it is a fuel tax rate on the same fuel in the same general sector (as described in 2.1). The difference
between headline and discount rate, together with the consumption of the discounted fuel, determines
revenue forgone.
We derive three main insights from the this. First, an increase in taxation will lead to higher subsidy
estimates, if the increased tax rate is a headline rate for a fuel tax subsidy measure. We illustrate this
scenario in figure 1. It shows how the increase of a fuel tax rate can lead to increased reported subsidies.
While the discount rate on the bottom is unchanged, an increase in the headline tax rate used to
measure the subsidization will increase the difference between the rates and therefore reported
inventory subsidies. In this case, higher implicit carbon price for fossil fuels and thus a stricter climate
policy leads to an increase in reported subsidies, which are generally understood as counterproductive
implicit negative carbon prices.

Figure 1: Increases in a headline rate lead to increased reported subsidies

Second, higher headline rates allow for more potential differentiation between headline and discount
rates, therefore higher subsidies will often be reported in higher taxed countries, as we illustrate in
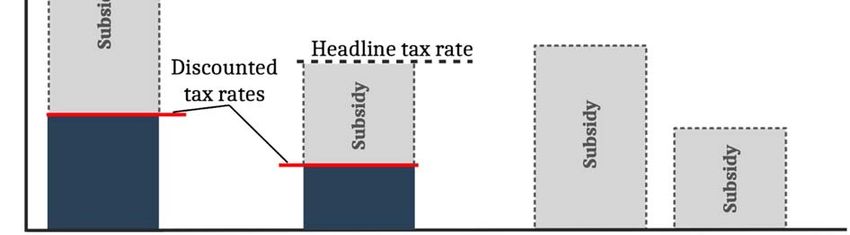
figure 2. It visualizes a scenario where subsidization is calculated for two countries, one with high fuel‐
taxation and one with low fuel‐taxation. The high‐tax country in this example has universally higher tax
rates on the same fuels – a higher headline fuel tax rate as well as a higher discounted fuel tax rate. The
comparison of the subsidy estimate shows that with the revenue‐forgone approach, the high‐tax
country will report higher subsidization.

Figure 2: How a high‐tax country reports higher subsidies, despite universally higher subsidies

Third, fuels which are generally taxed at low rates, like coal, are not represented in the inventory. This
is because same‐fuel rates are generally chosen as the benchmark rate, therefore only a small
differentiation is measurable using revenue‐forgone estimation.
In summary, the inventory approach is inaccurate when it comes to fuel tax price incentives. Only a
small share of fuel tax differentiation is recorded, and recorded subsidies are measured in a way that is
inaccurate in regard to actual price incentives. In the next section, we outline an approach to better
measure effective price incentives for fossil fuel use: net carbon prices. It addresses overcomes the
shortcomings of the inventory approach and we use it in section 4 to show that the OECD inventory
does indeed report higher subsidization for high‐tax countries, even when taking into account other
types of subsidies.

3. Net carbon prices
The shortcomings discussed in section 2 imply that inventory measures of fuel tax subsidies do not
reflect underlying price incentives for fossil fuel use. This is especially true in high‐income countries,
where fuel‐tax subsidies are often the majority of reported subsidies2.

2
 See table A‐1 in the appendix for an overview of the share of different subsidy types we identified in the OECD
inventory
To inform (climate) policy makers and facilitate efficient abatement, all relevant price incentives
including those by explicit or implicit subsidies should be presented in a coherent and encompassing
approach. This can be achieved by a measure that combines all relevant marginal price incentives on
carbon emissions. Such a measure of a net carbon price should have three parts: First, direct carbon
pricing through carbon taxes and allowance prices within emissions trading schemes (ETS) which are
already measured per ton CO2. Second, incentives of fuel taxes, and third, marginal non‐fuel‐tax
subsidies. The two latter parts should also be measured per ton CO2.
In the following we define net carbon prices more precisely and show how they address the
shortcomings of inventory subsidy measurement we identified in section 2. We then present the data
we use to measure the three sources of price incentives included in net carbon price for the top six
emitters (China, US, India, Russia, Japan and Germany), as well as Sweden and Poland, two European
countries with a perceived opposing focus in energy and environmental policy. We thus calculate carbon
price incentives in countries which accounted for over 60% of worldwide emissions in 2019 (EDGAR,
2020). We report sectoral rates for four sectors: transport, industry, residential/commercial and
industry.

3.1 Net carbon prices as a measure to account for overall price incentives – including subsidies
We define net carbon prices as the net effect of any governmental price intervention that applies
specifically to fossil fuel use on carbon emissions. Naturally, such a net carbon price should thus be
measured in €/tCO2. It is intended to capture any deviation in effective price from a neutral market
price, with neutral meaning free from any fossil fuel specific market intervention. Net carbon prices
therefore do not cover value‐added tax or any other general taxation, only fossil fuel specific price
incentives, both positive (fuel/carbon taxes and ETS) and negative (marginal subsidies).
At its most basic, non‐aggregated level, a net carbon price is particular to a fuel and its circumstances
of usage. A very narrow net carbon price example would be a net carbon price for diesel fuel used for
heating in a private home of a low‐income household in the U.S.‐state of California. Diesel fuel is suspect
to different fuel tax rates depending on the sector and usage type – residential heating in our example.
Low‐income households often get direct or indirect energy assistance, therefore specific price
incentives apply here because of subsidization. And in California, most fossil fuel use is also covered by
California’s emission trading scheme. All these price incentives for fossil fuel use combine to a net
carbon price particular to these circumstances.
To calculate national or sectoral data, fuel consumption data is needed, to weight the specific net carbon
prices. Figure 3 illustrates how individual net carbon prices are aggregated to a sector and then country
average. The individual, non‐aggregated net carbon prices in the transport sector are shown on the left,
combined with the consumption per individual fuel. The second step is the consumption‐weighted
average net carbon price for the transport sector. The same principles apply on the right side, sector‐
average net carbon prices are aggregated to a country‐average net carbon price. An aggregation per
fuel – to for example the average net carbon price for all diesel use – is also possible, but not reported
in this paper.
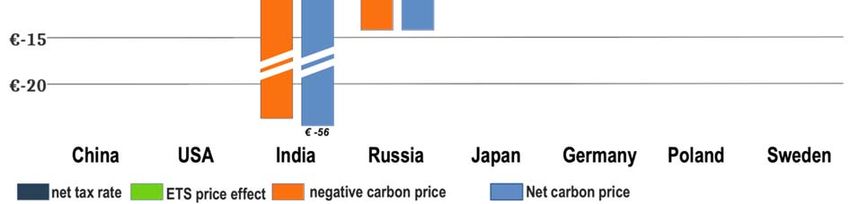
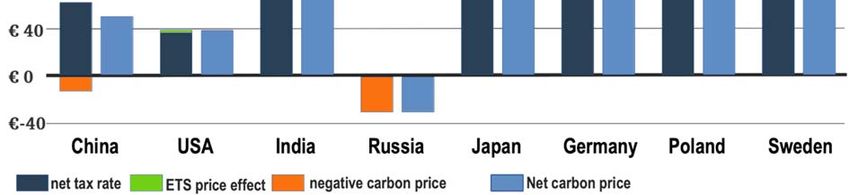
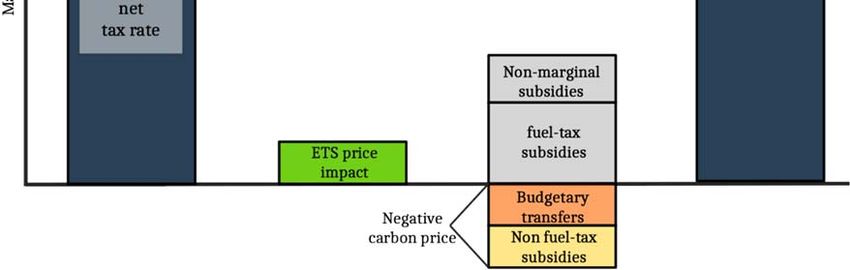
Figure 3: From individual net carbon prices to a country‐average net carbon price

Next, figure 4 illustrates the different elements of the net carbon price and data sources used and how
our results are presented. To calculate net carbon prices, we use data on net fuel taxation and carbon
taxes from the OECD´s Taxing Energy Use (TEU) report that includes direct carbon taxes and is already
calculated in €/tCO2. For ETS price incentives, we match permit prices to covered emission quantities
and sectors, based primarily on information provided by the World Banks Carbon Pricing Dashboard
(World Bank, 2021). For marginal subsidies other than fuel‐tax subsidies, we devise our own data set
based on subsidies recorded in the OECD inventory and differentiate between four categories of which
two provide marginal incentives and two do not. Net resulting net carbon price is then the sum of the
first two bars minus the negative carbon price of implicit subsidies.

Figure 4: Negative carbon price elements and data sources

We term the fuel and carbon tax rates provided by the TEU report net tax rates and use the term
negative carbon prices for the marginal subsidies included in net carbon prices. Note also, that in Figure
4, the sum of non‐marginal and fuel subsidies plus the negative carbon price equals the value of the
inventory data not in terms of absolute monetary value but per tCO2. In the next section, we describe
the individual parts of net carbon prices and the data sources we used to calculate results for our
country sample in more detail.

3.2 – Data sources
3.2.1 Fuel and carbon tax data from the OECD TEU report
We take data on net tax rates (fuel and carbon taxation) as well as fuel consumption data from the OECD
Taxing Energy Use (TEU) report (OECD, 2019). The TEU report provides an overview of net tax rates for
the year 2018, which we assume stay unchanged for 2019. Data is reported for 44 OECD and partner
countries, structured by fuel for six sectors: road, off‐road, industry, agriculture & fisheries, residential
& commercial and electricity. This is provided both as tax rate per TJ of fuel consumption and as tax rate
per CO2‐emissions. For this paper, only the tax rates per CO2‐emissions are relevant and used for further
analysis. We take the data from the TEU as they are, but consolidate the six sectors into four. We
aggregate road and off‐road sectors to transport, and include agriculture and fisheries into industry.
Both the off‐road sector and the agricultural and fisheries sector do not account for significant emissions
and therefore would not add much additional information.
The matching of fuel tax rates to consumption quantities of the taxed fuels is an important part of the
TEU data, as in practice, gathering data on differentiated tax rates is relatively straightforward compared
to matching consumption statistics to each individual fuel tax rate. This is the case because fossil fuel
consumption statistics are often not differentiated by the same characteristics as fuel tax rates are3. The
tax agencies in the individual countries obviously possess the fuel consumption data directly matched
to individual tax rates, but usually report aggregated tax revenue from different rates for the same fuel.
The close cooperation between the OECD and IEA, which is the publisher of the most comprehensive
statistics on worldwide fossil fuel use, allows the OECD to match consumption to tax rates in more detail
and for a large set of countries, although we assume that the TEU still has to estimate the dedicated
consumption for certain fuel tax rates to some degree. While there is other data available, for example
by the EU which publishes an overview of most differentiated fuel tax rates of its member countries (EU
COM, 2021), the required matching of tax rates to consumption makes the TEU data the best available
for a country overview and comparison.
3.2.2 Carbon prices in emission trading systems
ETS schemes provide significant price incentives, particularly the EU ETS. These price incentives act
similar to carbon taxes, with the only difference being the volatility of permit prices. Due to this volatility,
we show ETS data separately in our results. While the OECD publishes a companion report to the TEU,
the Effective Carbon Rates report (OECD, 2018 and 2021d), which includes ETS prices in addition to the
TEU carbon and fuel tax data, we do not use this data because the latest 2021 report only reports data
for 2018 and not in enough detail, while we calculate net carbon prices for 2019. We therefore estimate
ETS price incentives using data on emission caps and sector coverage from the World Bank´s State and
Trends of Carbon Pricing report (World Bank, 2020), data on auction prices from the International
Carbon Action Partnership (ICAP, 2021), as well as European Environmental Agency (EEA, 2021) data on
emissions covered by the EU ETS. We used 2019 permit quantities and 2019 average auction prices for
all schemes. In addition to the EU ETS, we included data from regional schemes in the US and China.

3
 To test our approach independently of the TEU data, we compiled our own net fuel tax rates for Germany, using
Eurostat consumption statistics. While our results were almost similar (ca. 4% difference), there where difficulties
matching certain tax rate differentiations (see the appendix for further details).
Tokyo also has a regional ETS scheme, but as its coverage is limited – the total value of permits is under
€10 Mio. (World Bank, 2021) – we did not include ETS price data for Japan. Details on sector attribution
for the different ETS schemes covered can be found in the appendix. All prices are converted to €/tCO2
using ECB reference exchange rates (ECB, 2020).
3.2.3 Subsidy data
We include subsidy data on two subsidy types: budgetary transfer subsides and non‐fuel‐tax subsidies.
Budgetary transfers are direct payments to support fossil fuel use, for example price support benefitting
domestic coal. Non‐fuel‐tax subsidies are tax deductions which benefit fossil fuel use, but where
reimbursements for fossil fuel expenses are facilitated through deductions from tax bills other than fuel
taxes, for example income tax. These two types of subsidies in effect act as negative carbon prices,
because they provide real negative price incentives for fossil fuel use – they can and in some cases do
push net carbon prices negative.
We use data from the OECD´s Inventory of Support Measures for Fossil Fuels for our negative carbon
price calculation because it is the most comprehensive overview of fossil fuel subsidies for the countries
we cover in this study4. While overall OECD inventory results are skewed by the inclusion of fuel tax
subsidies as discussed in section 25, the OECD inventory also reports data on budgetary transfer and
non‐fuel tax expenditures, which do provide relevant marginal price incentives. The OECD’s inventory
uses a bottom‐up approach, collecting data on all measures that fall under the OECD’s definition (see
OECD, 2021b) for 50 OECD and OECD partner countries. The inventory provides yearly estimates of the
monetary value of each measure on a per fuel basis by attributing the subsidy to individual fuels by
share of consumption6. It includes consumer and producer subsidies, as well as a general services
category (which is mostly not relevant for this analysis because it consists predominantly of non‐
marginal subsidies like R&D support, social benefit programs and cleanup costs for past mining
activities). We evaluate each individual inventory measure from the OECD inventory for our country
sample and select budgetary transfer subsidies and non‐fuel‐tax exemption which provide a marginal
price incentive for fossil fuel production and use. Because net carbon prices are presented per sector
for this paper, we determine the associated sector of each subsidy. If the subsidy cannot be linked to a
specific sector, the subsidy is allocated to sectors depending on fuel usage, using IEA sector fuel
consumption data (IEA, 2021b). We combine total subsidization per sector with TEU sector consumption
data to calculate negative carbon prices in €/tCO2.
Finally, to compare country‐average net carbon prices to OECD inventory subsidies we convert the
absolute subsidy numbers again to subsidies per tCO2. We divide total recorded subsidies per country
for the year 2019 from the OECD´s inventory by total CO2 emissions from fossil fuel combustion, using
IEA/OECD emission data (OECD, 2021c).

4
 A possible future extension of net carbon prices would be to also include IEA subsidy estimates (IEA, 2021a) in
addition to OECD inventory subsidies for countries which subsidize fossil fuels below market prices. The impact of
this is most important in developing economies which are also major fossil fuel producers.
5
 While tax subsidy measurement remains unchanged for now, the OECD is discussing options for future changes
in its 2021 Inventory Companion (OECD, 2021b. See p.48ff). The primary option retains many of the shortcomings
described, because of the OECD´s focus on country‐level benchmark rates and the declared objective of leaving
the identification of fuel tax subsidy measures up to individual countries.
6
 While this is not stated explicitly in the companion guide to the inventory (OECD, 2018b), this was evident when
we replicated the results in our own calculation of German net fuel tax rates and negative carbon prices from
primary sources. This is discussed in more detail in the appendix.
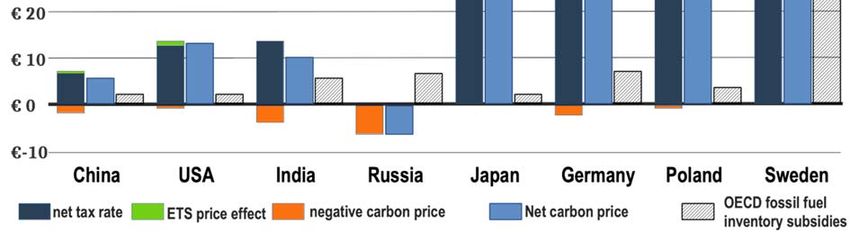
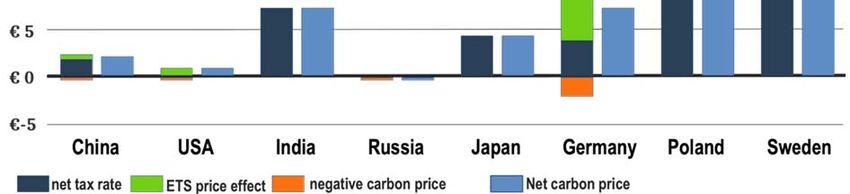
4. Description of Results
This section describes the results of our analysis. The data underlying all figures can be found in Tables
A‐2 – A‐6 in the Appendix. Furthermore, the Appendix contains some additional information about the
OECD subsidy data and sectoral emissions.

4.1 Country‐Average results
First, in Figure 5 we present country‐average net carbon prices, covering all fossil fuel related emissions.
Emission profiles of countries differ, but as net carbon prices are a weighted average our figures show
the average price incentive for all national combustion emissions. As described above we show the four
components net tax rates, ETS price, budgetary transfers and non‐fuel tax subsidies. These are
aggregated to the overall net carbon price in the next bar. This is supplemented with information on
fossil fuel subsidies as recorded in the OECD´s inventory (without any modification, counting all
subsidies), as a comparison figure to show what results the different methodologies produce.
We first examine Sweden that illustrates the drawbacks of the inventory approach. Sweden has both
the highest net carbon price as well as the highest per tCO2 subsidies from the OECD inventory. The
OECD inventory reports per CO2 subsidies for Sweden which are for example 26 times higher than those
of the US, while our net carbon price results show that Sweden has a 770 percent higher effective price
on carbon emissions than the US.

Figure 5: Country‐average net carbon price and OECD inventory subsidies for 2019 – country
comparison

While the OECD Inventory includes considerable subsidies for Sweden we do not report a negative
carbon prices component, because Sweden only reports fuel tax exemptions. These are quite high for
two reasons. Firstly, Sweden has by far the highest country average net fuel tax rate in our analysis, due
to the combination of fuel and carbon taxes/ETS coverage on most fuels, and also the small amount of
fossil fuels used in the less‐highly taxed non‐transport sectors. Higher average tax rates lead to a larger
difference between the headline rate and the discount rate used to calculate fuel tax subsidies. The
second and somewhat unique reason is Sweden´s broader definition of fuel tax subsidies. While most
countries choose a different tax rate of the same fuel as the benchmark, Sweden uses the highest rate
in the same sector (Swedish Ministry of Finance, 2019). This implies that more tax rate differentiation
than usual is detected by the Swedish approach, contributing to the high inventory subsidy figures from
the OECD7.
High CO2 taxation going hand in hand with high subsidies is present also in most other high‐income
countries in our study (US, Germany, Poland), but to a lesser extent. The US, for example have both the
lowest net carbon price and the lowest inventory subsidy figure in our country sample. The only outlier
is Japan, which has relatively low inventory subsidies despite a high taxation level. While Japan does
have differentiated fuel tax rates and even regulated fuel prices for certain sectors (OECD, 2020), it does
not consider tax rate reductions a subsidy. We do not report a negative carbon price for Japan because
the budgetary transfer subsidies inventory includes only non‐marginal subsidies – mostly concerning
stockpiling as well as fossil fuel related R&D and exploration subsidies.
The correlation of high tax rates and high subsidy figures is most pronounced in high‐income countries
because these countries tend to have a higher share of tax subsidies – at least 50% of recorded subsidies
and often significantly more for all high‐income countries in our sample except Japan. Of the higher‐
income countries, Germany is notable for its price support for domestic coal production, which has only
run out in 2020. Because of these budgetary transfers we report a relatively large negative carbon price
for Germany, based on 2019 subsidy figures.
Lower‐income countries like China and India have a lower share of only one‐third tax subsidies in 2019
(OECD, 2021a). They report more direct price support measures (budgetary transfers). This is why we
show a higher negative carbon price for these countries. The total amount of tax expenditure is also
relatively low for China and India, as both countries subsidize certain fuels below international market
prices, as documented by the IEA´s subsidy estimation using the price gap approach (IEA, 2021a).
The subsidy figures in Russia are typical for nations which are fossil fuel producers. The majority of its
subsidies are production subsidies, as Russia is a major producer of oil and natural gas, as well as coal.
We count these production subsidies towards the domestic sectors in which those fuels are used. Coal
is usually mined and consumed domestically (Bachmeier and Griffin, 2006), but in the case of more
internationally traded fossil fuels like oil and gas, it could be argued that at least part of the subsidies go
toward the international market and should not be counted. We nevertheless assume a significant
effect of these production subsidies on domestic fossil fuel prices. This is supported for example by the
IEA´s finding that natural gas prices in Russia are significantly below international market prices (IEA,
2021a). Russia is also special in that it does not raise any fuel taxes at all on any fossil fuel consumption,
and therefore also has no fuel tax exemptions. This is why the OECD´s inventory subsidy figure and our
reported negative carbon price are very similar in this case. The effect is that while Russia and Germany
have similar per tCO2 subsidy figures reported by the OECD, producer subsidies and the lack of fuel
taxation lead to a negative country‐average net carbon price of ‐6€ in Russia, while we report a national
net carbon price of 50€/tCO2 for Germany.
Results in figure 5 also show that the EU ETS is a major contributor to fossil fuel price incentives in the
EU The effect is especially notable for Poland, which otherwise has relatively low average fuel tax rates.
Because Poland`s industry and electricity sector mainly use emission intensive coal, the EU ETS increases

7
 For example, all transport sector fuel tax rates are compared to the tax rate on gasoline, and subsidization is
therefore reported on diesel fuel as well as other fuels. For fuels used for heating, this measuring approach actually
led to a harmonization of tax rates, with all rates being raised to the per joule rate of heating oil (Swedish Ministry
of Finance, 2019).
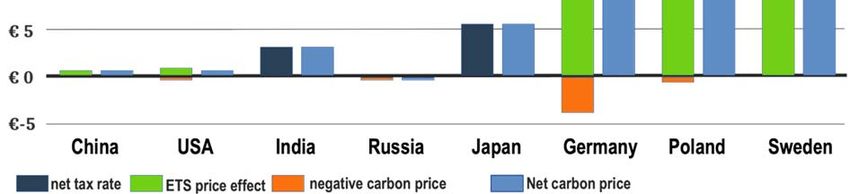
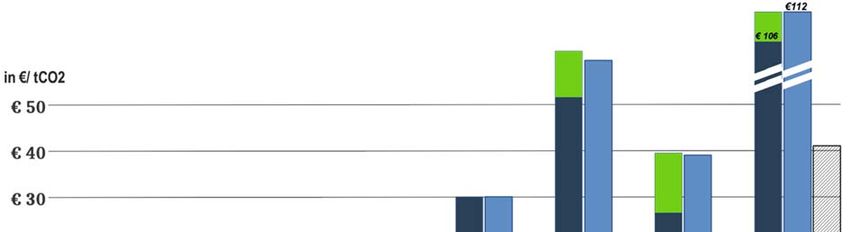
average price incentives significantly by almost 13€/tCO2 across all sectors, making total price incentives
for fossil fuel use in Poland higher than in Japan (39€ vs. 30€/tCO2). The average ETS effect is smaller in
Germany and Sweden because the electricity and industry sectors have a smaller share of overall
emissions in these countries. The regional ETS schemes also have a price impact in the US and China,
but because of the relatively small share of US countrywide emissions covered by ETS schemes and low
permit prices in the Chinese regional schemes, the impact on overall results is much smaller.
In general, we see a distinction between high‐income and lower‐income countries. Higher‐income
countries tend towards fuel tax subsidies, which provide mostly meaningless figures of fossil fuel
inventories when one is concerned with actual fossil fuel price incentives. Lower‐income countries
mostly use other types of subsidies, which are often marginal in their effect and therefore mostly
actually function like negative carbon prices. Furthermore, the effect of different subsidy definitions can
be seen when comparing Sweden and Japan which have – as discussed above ‐ very contrasting tax
expenditure definitions.
Given the shortcomings of the OECD inventory figure, we will in the following, focus not on the
comparison between these figures and our results, but on the resulting net carbon prices in different
sectors.

4.2 Sectoral results
Price incentives on fossil fuel use are not uniform but differ substantially between fuels and sectors. We
present sector average net carbon prices for the four sectors – transport, industry, residential and
commercial and electricity generation to reveal differentiation by usage sector.
Figure 1: Sector‐average net carbon prices (2019) – Transport sector

The general trend of the countrywide overview of Figure 5 carries over to the transport sector overview
in Figure 6 because fuel taxes are much higher than in other sectors, thus having a strong influence on
the country‐averages. This is the case even though transport emissions account for only about 17% of
total fossil fuel combustion related emissions for our country sample (see table A‐7 in the appendix for
an overview of sector emissions). Notable outliers are the US with a 34% share of combustion emissions
in the transport sector and also Sweden with 48%. The US is an outlier because of high per‐capita
transport emissions – more than 2.5 times higher than the second highest per‐capita transport
emissions of Germany. Sweden has more typical per‐capita emissions in the transport sector, but much
lower emissions in other sectors due to its substantial use of biofuels and nuclear power8. The US
continues to be an outlier from the other higher‐income countries in our analysis, with much lower
taxation of fossil fuels used for transport of 37€/tCO2, lower than China and India with 49€/tCO2 and
76€/tCO2 respectively. Russia completely lacks fuel taxation. Combined with its production subsidies
this leads to an overall negative net carbon price of 29€/tCO2
In the other high‐income countries in our analysis, the transport sector average rate is significantly
above 100€/tCO2, and about 200€/tCO2 for both Germany and Sweden. Poland sets both gasoline and
diesel tax rates at the EU‐mandated minimum rate for these fuels, one of the only countries in the EU
to do so (see EEA, 2019).
A common feature of transport fuel tax rates which is not visible in Figure 5 is that diesel fuel is taxed
at a lower rate than gasoline, usually at about two‐thirds the rate in terms of tax rate per tCO2. The only
exemptions to this in our analysis are the US – which taxes both at the same rate – and obviously Russia.
This has contributed to an increase of passenger cars using diesel as fuel, especially in Europe.
The higher fuel tax rates for transport fuels compared to other sectors is partly justified with these taxes
covering road infrastructure costs, although some countries like Germany have raised transport fuel
taxes with explicitly environmental reasons (Steiner and Cludius, 2010). Also, Harding (2014) argues that
diesel would need to be taxed considerably higher than gasoline due to its higher carbon content and
higher non‐climate externalities like local air pollution. We do not account for any share of fuel taxes
partially addressing non‐CO2 externalities as we simply state price incentives in terms of tCO2.
Furthermore, any share of road fuel taxes addressing specific externalities is difficult to quantify9.
Except for Russia and China, negative carbon prices are not present in the transport sector, as transport
sector subsidies usually take the form of lowered fuel tax rates (often for example for agricultural diesel
use). As discussed, these do not imply a real negative price impact. In the case of China, almost half of
all inventory subsidies are from a single price support measure for diesel fuel, which directly
compensates certain consumers – mostly taxi drivers and agricultural users – for a regulatory change
from regulated prices to a more market‐based that dates back to 2006 (although the new system still
includes a price cap). For Russia, the large negative carbon price on transport fuels is due to extraction
subsidies on oil which are allocated to usage sectors, which in the case of oil is mostly transport.
ETS coverage in the transport sector is low, with California´s CaT being the only scheme to cover most
transport sector emissions. The EU ETS so‐far only covers the otherwise non‐taxed aviation emissions,
even though there is some discussion on extending the EU ETS also to road transport.
The industry sector (see Figure 7) is taxed much lower than transport in all countries in our analysis,
while being responsible for the largest share of carbon emissions across our country sample (38%
overall). The emissions in the industry sector as a share of total emissions are highest in lower‐income
countries.

8
 Sweden has one of the lowest per capita emissions of any high‐income country with 4.47 tCO2/capita in 2018,
according to the EDGAR (2020) emission database. For the countries in our analysis, only India has lower per capita
emissions of 1.94 tCO2/capita. This mostly affects the non‐transport sectors in Sweden, see OECD TEU (2019)
Annex 3.A for an overview of biofuel use per sector.
9
 An exceptional example where such as share is stated is the Highway Trust fund in the US, which receives an
exact amount per liter of transportation fuels sold (FHWA, 2017). Also, see Matthes (2020, p. 25) for an estimate
of the share of road financing in fuel taxes for Germany.
Figure 2: Sector‐average net carbon price (2019) – Industry sector

While Sweden has the highest net carbon price, Sweden’s Industry sector average rate of 14€/tCO2 is
much lower than Sweden´s country average rate of 106€/tCO2. This rises to 22€/tCO2 when factoring in
the EU ETS. The same sectoral differentials and low taxation in the industry sector can also be observed
for the other countries. Outside the transport sector, taxes on fossil fuels are mostly close to zero. Oil
derivatives – mainly heating oil and LPG – tend to be taxed highest for industry use, while natural gas
and especially coal are most commonly not subject to a fuel tax at all and in some cases subsidized.
Relatively low fuel taxes in the industry sector imply that ETS schemes significantly drive overall results,
especially in EU countries. The ETS schemes covered in our analysis all predominantly cover emissions
in the industry and electricity sectors. While the focus on these specific sectors means that not all fossil
fuel use is equally affected by the ETS´s carbon pricing, our sector overviews show that this is not
necessarily as inefficient as it may seem when only considering direct carbon pricing, as ETS schemes
tend to affect the fuels that are not otherwise covered by fuel taxes. Since not all EU ETS emission are
covered by the EU ETS and since the share of industrial activities covered by the EU ETS differs across
EU countries, so does the size of the ETS price.
Overall, more than half of all industry sector emissions from the combustion of fossil fuels is from coal
use, followed by natural gas. At the same time, coal is the least taxed fuel l across all sectors (in CO2
terms as well as per energy unit). This is significant since coal is the most carbon intense fuel per energy
unit and also has high non‐climate negative externalities compared to other fossil fuels. The US National
Research Council (2010) estimates that for existing US power plants, coal has non‐climate negative
externalities that are ca. 20 times higher than electricity production using natural gas.
Apart from heat generation, major uses of coal in the industry sector include steel production and
electricity generation – electricity produced and consumed directly by industry is counted towards
industry sector consumption (see TEU 2019).
Most coal is mined domestically, and trade is mostly limited to higher quality hard coal used for example
for coking. Negative carbon prices are mostly due to subsidies on domestically produced coal, most
notably in Germany with its (expiring) price support for domestic production of hard coal. In our country
sample, only Japan and Sweden import more coal than they produce domestically.
Overall, fuel taxation is relatively low in the industry sector and the EU ETS is the main driver of net
carbon prices in the EU results, especially on coal with its otherwise low production prices, low fuel
taxation and high carbon intensity.
The Residential and Commercial sector (see Figure 8) has the lowest emission share of the four sectors
with 9% overall and a slightly higher share in higher‐income countries. Sector average net carbon prices
vary significantly between countries, with India and Russia substantially subsidizing fossil fuels in this
sector at ‐56€/tCO2 and ‐13€/tCO2 respectively, while Sweden is taxing them at an average of
150€/tCO2. California´s CaT is the only ETS that covers household and commercial emissions, but the
effect is outweighed by US subsidies, resulting in a negative net carbon price of ‐2€ for the US Residential
and Commercial sector.
Figure 3: Sector‐average net carbon price (2019) – Residential and Commercial sector

With ‐55€/tCO2 India´s residential fossil fuel subsidies face the most significant negative net carbon price
in our analysis. This is due to the world´s largest direct transfer scheme, which benefits LPG used by
low‐income households and is administered by direct cash transfer to low‐income household´s bank
accounts10. The aim of the scheme is to provide support to low‐income households and also to promote
a shift from traditional biofuels (wood, dung) to cleaner fuels, to reduce the negative health effects of
indoor cooking (Sharma et al., 2019). As of 2018, biofuels still accounted for over 80% of energy use in

10
 The direct transfer scheme was established in 2013 and succeeded a previous system of unlimited direct delivery
of subsidized LPG to low‐income households. The new system is credited with greatly improving efficiency and
reducing leakage of subsidies (Mittal et al., 2017).
the Residential and Commercial sector in India. India also provides price support to Kerosene for the
same reason.
In Russia, natural gas production subsidies lead to below world market prices for natural gas (IEA,
2021a). This partly benefits residential and commercial users of natural gas, which makes up the bulk of
fossil fuel use in this sector. In the US, the negative rate is due to non‐existent federal fossil fuel taxation
outside the transport sector, along with federal and state level heating aid for low‐income households
and state level sales tax exemptions for heating fuels.
China also has small scale subsidies for home heating in colder regions of the country, but low positive
rates on heating oil and LPG lead to an overall positive sector‐average rate for China. Poland does not
report subsidies for the Residential and Commercial sector, and as (untaxed) coal is the most common
fuel used for home heating, the average sector rate is relatively low at 2€/tCO2.
Germany and Japan tax Residential and Commercial fossil fuel use at a moderate rate, while Sweden
taxation of fossil fuel use in the sector are comparatively very high. Sweden also has a large usage share
of biofuels in the sector11. Poland´s low average rate is due low‐taxed coal being the most‐used fuel for
home heating.
Figure 4: Sector‐average net carbon price (2019) – Electricity sector

The Electricity sector is the sector with the second highest emissions share (37% overall and a very
similar share in most countries). It also has the highest share of emissions from coal (84% of total sector
emissions). This is notable, because the electricity sector is generally considered especially important
for decarbonization efforts, by facilitating electrification in other sectors.
Fuel taxation in the electricity sector is uniformly low or zero. While there is almost no fuel tax levied
on any fuel used for electricity production, the electricity produced is usually subject to an electricity
tax. Any fuel taxes that would otherwise apply to the fossil fuel inputs are usually waived to avoid double
taxation – with the output taxed instead. These high electricity taxes are often seen as a major
impediment to the electricity‐based decarbonization of e.g. heating or transport.

11
 While utilizing mostly wood and wood production residue for energy use (IRENA, 2019), it is notable that Sweden
also uses a small amount of peat in district heating plants (Sgu.se, 2021), which is a very carbon intensive (bio)fuel.
The only significant price effect in the electricity sector in our analysis comes from the EU ETS. As virtually all electricity sector emissions are covered by the EU ETS, the ETS price effect is the same for the EU‐countries at the 2019 permit price level of 24.42€/tCO2. The negative carbon tax rates displayed above are all due to subsidies on domestically mined coal. 5. Summary and Conclusion Reducing fossil fuel subsidies is broadly seen as an important step towards more efficient climate policy. This is often justified by high numbers of reported subsidies. Yet, what is relevant in the end are the resulting price incentives for the use of fossil fuels. Against this background the first contribution of this paper is that we have carved out methodological problems in how the common inventory approach measures fuel tax subsidies and we have in response devised net carbon prices as a holistic approach to measure fossil fuel price incentives. Net carbon prices summarize the net effect of different governmental price interventions and are able to address three main issues we identified with the inventory approach of subsidy measurement: While only a small fraction of all fuel tax differentiation is counted as fuel tax subsidies, net carbon prices include all fuel tax differentiation, because the basis of net fuel tax rates are the individual fuel tax rates and the consumption of the respective fuels. While increases in fuel taxation can lead to higher inventory subsidy estimates, they always lead to a corresponding increase in net carbon prices, because different fuel tax rates are measured individually without the need for benchmark rates While high‐tax countries may unintuitively report higher inventory subsidies, countries with higher taxation level will always report higher net carbon prices – unless the fuel taxation is counteracted by other, non‐fuel tax related subsidies The OECD´s fossil fuel subsidy inventory uses data from countries subsidy reports, which were not created to measure climate incentives of policy, but mainly to assess budget implications of specific policy and taxing decisions. Our comparison of net carbon prices and OECD inventory subsidies show how these often used and cited OECD subsidy figures can misrepresent actual price incentives. Especially in high‐income‐countries the largest share of subsidies are tax reductions which depend on headline taxes and therefore very high subsidy figures and very high effective taxation go hand in hand. This implies that neither single country analysis nor cross‐country comparisons of fossil fuel subsidy values captured by inventory reports are not meaningful. We illustrated this comparing Sweden to the US: per CO2 subsidies for Sweden measured using the inventory approach are 26 times higher than those of the US, while the net carbon price in Sweden is more than seven times higher than in the US. In light of the role of tax exemptions in fossil fuel subsidies at least in high‐income countries which fail to put focus on the most underpriced fuel usage, it is also misleading to stress the need for phasing out fossil fuel subsidies. So instead of calling for a phasing out fossil fuel subsidies, the G20 should rather aim at joint minimum effective carbon price. Such a minimum price can also play an important role in international climate negotiations. For example, Cramton et al. (2017) argue that the current pledge‐ and‐review structure as part of the Paris Agreement inhibits cooperation. One proposed solution is a common minimum carbon‐price commitment. Such a simpler “single focal point” may help address the externality problem of climate negotiations by introducing a common commitment instead of many individual commitments. A net carbon price as proposed in this paper could help track such commitments. For efficient minimum carbon pricing, existing energy taxation should be taken into
account, as well as subsidization. Net carbon prices would for example highlight if a country introduces
an agreed carbon tax on fossil fuel use of 10$/tCO2, but then reimburses users through another
measure.
Another implication of our analysis is that subsidy data should not be used to argue for specific fuel
price reforms. Only some fuel price differentiation is recorded as a subsidy in the OECD inventory, and
already higher taxed fuels tend to show higher subsidization figures. Fuel tax subsidy motivated “subsidy
removal” would therefore be inefficient, as low taxed fuels would tend to be overlooked. Yet, these
should instead be a focus of price reform to facilitate efficient abatement. Also, phasing out tax
exemptions without energy tax reform would raise price incentives but preserve inefficient pricing
differentiation. Our illustrative analysis shows the large differences in net carbon prices across sectors
and the potential for efficiency gains through harmonized taxation and carbon pricing. Our findings thus
reiterate the need for an accompanying energy price reform especially in high‐income countries which
has been stressed for example by Agora Energiewende (2017) for Germany. In the EU a revision of the
Energy Taxing Directive is part of the policy reforms to deliver on the targets of the European Green
Deal. According to the EU12 this includes realigning the taxation of energy products and rationalizing the
use of optional tax exemptions and reductions.
Finally, fossil fuel subsidy policy should focus on non‐fuel subsidies and particularly non‐marginal
subsidies. Non‐marginal subsidies are still important and do not easily fit in the net carbon price
framework. Most have an indirect effect on consumption and may even encourage path‐dependent
fossil fuel investment. The OECD inventory provides an overview over these measures and can help in
identifying the measures providing the most harmful incentives.
In summary, there are two main contributions of the paper. The first is to illustrate the shortcomings of
the inventory approach to measure fossil fuel subsidies when it comes to policy implications. These
inventory data are incomplete, not useful for cross‐country comparisons and give little information
about how far countries diverge from effective and uniform carbon pricing. Also, since in high‐income
countries fossil fuel subsidies consist mainly of tax exemptions, the issue is rather not phasing out fossil
fuel subsidies but an encompassing energy tax reform. The second contribution is the development of
net carbon prices as an alternative measure to account for fossil fuel subsidies. Our illustrative analysis
for eight selected countries, among them the top 6 global emitters, shows the different components of
effective carbon pricing (carbon and fuel taxation, subsidies, emission allowances) and how resulting
net carbon prices differ both across countries and across sectors within countries.
A worthwhile endeavor that is beyond the scope of this study would be to calculate the different
components of net carbon prices and resulting overall carbon price incentives for a broader set of
countries and to analyze these data in more detail. In this context it might also be useful to differentiate
in the net tax measure between direct CO2‐taxes and general fuel taxes to get a full picture of direct and
indirect carbon price incentives. Such a broad and encompassing calculation of effective carbon pricing
would provide important information related to the measurement of national climate policy stringency.
It could potentially become a measure to define minimum carbon prices in the context of international
climate negotiations.

12
 See https://ec.europa.eu/info/law/better‐regulation/have‐your‐say/initiatives/12227‐EU‐Green‐Deal‐Revision‐
of‐the‐Energy‐Taxation‐Directive_en
References
Agora Energiewende (2017): Neue Preismodelle für Energie. Grundlagen einer Reform der Entgelte,
Steuern, Abgaben und Umlagen auf Strom und fossile Energieträger. Hintergrund. Berlin, April 2017.
Bachmeier, L. J., & Griffin, J. M. 2006. Testing for market integration: crude oil, coal, and natural
gas. The Energy Journal, 27(2): 55‐71.
Bárány, A. & Grigonytė, D. 2015. Measuring fossil fuel subsidies. ECFIN Economic Brief, 40, 1‐13.
BMF 2017. 26. Subventionsbericht: Bericht der Bundesregierung über die Entwicklung der Finanzhilfen
des Bundes und der Steuervergünstigungen für die Jahre 2015 – 2018. Bundesministerium der
Finanzen, Berlin.
Cramton, P. et al. 2017. Global carbon pricing: the path to climate cooperation. The MIT Press,
Cambridge, MA, USA.
EDGAR 2020. Fossil CO2 and GHG emissions of all world countries, 2020 report [Online]. Available:
https://edgar.jrc.ec.europa.eu/overview.php?v=booklet2020&sort=des8 [Accessed 03. Oct. 2020].
EEA 2019. Data Visualization: Road fuel excise duties [Online]. Available:
https://www.eea.europa.eu/data‐and‐maps/daviz/road‐fuel‐excise‐duties‐6#tab‐chart_1 [Accessed
11. Sep. 2020].
EEA 2021. EU Emissions Trading System (ETS) data viewer [Online]. Available:
https://www.eea.europa.eu/data‐and‐maps/dashboards/emissions‐trading‐viewer‐1 [Accessed 22.
Jan. 2021].
EU Commission 2021. Taxes in Europe Database v3 [Online]. Available:
https://ec.europa.eu/taxation_customs/tedb/taxSearch.html [Accessed 11. Jan. 2021].
Federal Highway Administration (FHWA) 2017. Fact Sheets – Highway Trust Fund and Taxes [Online].
Available: https://www.fhwa.dot.gov/fastact/factsheets/htffs.cfm [Accessed 12. Dec. 2020].
G20 2009. G20 leaders statement: The Pittsburgh Summit. G 20 Pittsburgh Summit, Pittsburgh, PA,
USA.
Harding, M. (2014). The diesel differential: Differences in the tax treatment of gasoline and diesel for
road use. OECD Publishing, Paris, France.
ICAP 2021. ETS Detailed Information – USA ‐ California Cap‐and‐Trade Program [Online]. Available:
https://icapcarbonaction.com/en/?option=com_etsmap&task=export&format=pdf&layout=list&syste
ms%5b%5d=45 [Accessed 23. Jan. 2021]
IEA 2021a. Energy subsidies ‐ Tracking the impact of fossil‐fuel subsidies [Online]. Available:
https://www.iea.org/topics/energy‐subsidies [Accessed 19. Jan. 2021]
IEA 2021b. International Energy Agency ‐ Statistics data browser ‐ CO2 emissions by sector, United
States 1990‐2018 [Online]. Available: https://www.iea.org/data‐and‐
statistics?country=USA&fuel=CO2%20emissions&indicator=CO2BySector [Accessed 24. Jan. 2021]
IMF 2019. Global Fossil Fuel Subsidies Remain Large: An Update Based on Country‐Level Estimates,
Washington, D.C., USA: IMF Working Paper 19/89, 1‐39.
IRENA 2019. Bioenergy from boreal forests: Swedish approach to sustainable wood use. International
Renewable Energy Agency, Abu Dhabi, UAE.
You can also read