Pricing Methodology

Prepared By:
Buller Electricity Limited
Robertson Street
Westport

Date: 31 March 2020
←
→
Page content transcription
If your browser does not render page correctly, please read the page content below

Pricing Methodology Prepared By: Buller Electricity Limited Robertson Street Westport Date: 31 March 2020
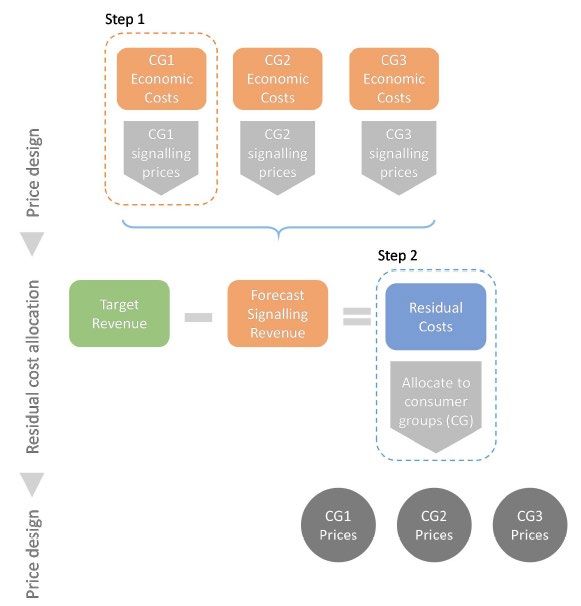
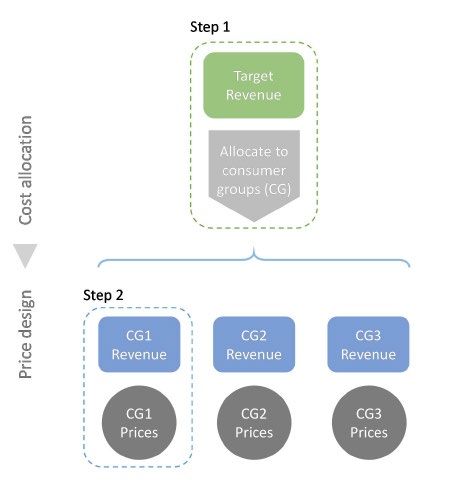
Table of Contents

1.   Introduction .............................................................................................................................. 1

2.   Pricing Principles, Strategy & Considerations........................................................................... 2
     2.1         Delivery Services .......................................................................................................... 2
     2.2         Delivery Prices, Line Charges & Retailer Charges ........................................................ 2
     2.3         Economic Considerations ............................................................................................ 3
     2.4         Even-Handedness & Practical Considerations ............................................................. 3
     2.5         Regulatory Considerations........................................................................................... 3
     2.6         Changes to the Pricing Methodology .......................................................................... 4
     2.7         Consumer Consultation ............................................................................................... 4
     2.8         Pricing Strategy ............................................................................................................ 5
     2.9         Pricing History – Fixed Revenue Proportion ................................................................ 6
     2.10        Future Pricing Objectives ............................................................................................. 8

3.   Overview of the Price-Setting Methodology ............................................................................ 9
     3.1         Determining the Target Revenue ................................................................................ 9
     3.2         Consumer Group & Price-Structure Review .............................................................. 10
     3.3         Cost Allocation & Price Calculation ........................................................................... 10
     3.4         Traditional & Cost-Reflective Price-Setting Methodologies ...................................... 12

4.   Target Revenue ....................................................................................................................... 15
     4.1         Target Revenue Components .................................................................................... 15
     4.2         Capital Contributions ................................................................................................. 16
     4.3         Discretionary Discounts and Rebates ........................................................................ 16
     4.4         Metering and Load Control Equipment ..................................................................... 16

5.   Consumer Groups ................................................................................................................... 17
     5.1         Residential Connections ............................................................................................ 18
     5.2         Commercial Connections ........................................................................................... 18
     5.3         Temporary Connections ............................................................................................ 18
     5.4         Unmetered Connections............................................................................................ 18
     5.5         Streetlight Connections ............................................................................................. 19
     5.6         Irrigation Connections ............................................................................................... 19

Buller Electricity Limited
6.    Allocating Costs to Consumer Groups .................................................................................... 20
      6.1        Cost Allocation Parameters & Cost Allocators........................................................... 20
      6.2        Cost Allocator – Connection % .................................................................................. 22
      6.3        Cost Allocator – Energy % .......................................................................................... 22
      6.4        Cost Allocator – RCPD % ............................................................................................ 22
      6.5        Cost Allocator – CAMD % ........................................................................................... 23
      6.6        Cost Allocator – Asset % ............................................................................................ 23
      6.7        Target Consumer Group Revenue ............................................................................. 24

7.    Pricing Structure & Price Calculation ...................................................................................... 25
      7.1        Fixed Revenue Proportion ......................................................................................... 25
      7.2        Locational Price Differentiation ................................................................................. 25
      7.3        Fixed Price Components – Daily ($/day) .................................................................... 26
      7.4        Fixed Price Components – Fixed Capacity ($/kW/day).............................................. 26
      7.5        Variable Price Components – Energy Consumption ($/kWh).................................... 26
      7.6        Power Factor .............................................................................................................. 26
      7.7        Price Calculation ........................................................................................................ 27
      7.8        Forecast Consumer Group Revenue .......................................................................... 27
      7.9        Consumer Group Overall Delivery Price Increases for 2020/21 ................................ 29

Appendix A – Delivery Price Schedule 2020/21 ............................................................................. 30

Appendix B – Distribution Pricing Principles .................................................................................. 32
      B.1        Electricity Authority Pricing Principles ....................................................................... 32
      B.2        Principle (A) – Signalling Economic Cost .................................................................... 33
      B.3        Principle (B) – Allocation of Residual Costs ............................................................... 34
      B.4        Principle (C) – Responsiveness to End Users ............................................................. 35
      B.5        Principle (D) – Transparency ...................................................................................... 35

Buller Electricity Limited
Pricing Methodology 2020/21 1. Introduction Buller Electricity Limited (BEL) owns and operates the electricity distribution network on the northern West Coast of the South Island, New Zealand. Our distribution network extends from Meybille Bay in the south (5km north of Punakaiki) to Karamea in the north, and lies entirely within the boundaries of area administered by the Buller District Council. Much of the distribution area covered is rural incorporating significant dairy and other farming activities, with the main population being based in the Westport township. Coal mining at the Stockton opencast mine continues to be a major employer and electricity consumer in the region. Established in 1947, BEL is owned by its consumers via the Buller Electric Power Trust (BEPT). While our core activity is electricity distribution, BEL also operates an electrical contracting business (Electro Services Limited), and is a significant owner of the electricity retailer Pulse Energy Limited. BEL receives electricity from Transpower’s national grid and local embedded (distributed) generation and we distribute this electricity using our network to approx. 4,600 homes and businesses (our consumers). The service we provide is the delivery of electricity only – we do not buy and sell electricity, we simply deliver it to the customers of electricity retailers that operate in our area. We charge electricity retailers on a wholesale basis for this delivery service, and they in turn include this cost in their retail electricity prices to their customers. Our network is a natural monopoly – due to economies of scale a competitor could not profitably duplicate our network. As a result, we are not exposed to the competitive pressures that drive improved efficiencies and service levels in other markets. As a surrogate for these competitive pressures, the Government has developed regulations for electricity network owners under the Commerce Act 1986 (the Act). The Act is administered by the Commerce Commission and requires BEL to disclose certain information about our business, including our Pricing Methodology. The purpose of information disclosure is to promote efficient operation of electricity distribution businesses by ensuring that electricity distributors make publicly available reliable and timely information about the operation and behaviour of their businesses. Information disclosures about such factors as profits, costs, asset values, price, quality, security, reliability and the methods used for price-setting enable interested persons to assess if the prices set by distributors promote efficiency and how whether the benefits of efficiency gains are being shared with consumers. It therefore supports assessment of whether the purpose of the Act is being met. Buller Electricity Limited Page 1 of 36
Pricing Methodology 2020/21

2. Pricing Principles, Strategy & Considerations
In simple terms BEL sets prices in a manner to provide sufficient revenue to recover the costs of
operating our distribution network while seeking to comply with the regulations. The structure of
our pricing aims to reflect the economic costs of providing our Delivery Service. With this approach,
consumers can make efficient decisions about which form of energy to use and when to use it, which
contributes to economic welfare. Recognising these high-level objectives, the following
considerations influence our pricing decisions. In many situations it is necessary to achieve an
appropriate trade-off or balance between the various competing considerations.

2.1 Delivery Services
The primary services BEL provides to consumers are as follows:

    •   Demand/Capacity – access to an agreed level of electricity supply
    •   Reliability & Security – in simple terms keeping the power on
    •   Power Quality – ensuring the quality of supply is within acceptable/regulatory limits
    •   Load Control – control of load e.g. electric hot water heating to minimise collective costs
    •   Fault Repair – repair and restoration of electricity supply on an on-call 24/7 basis

2.2 Delivery Prices, Line Charges & Retailer Charges
Delivery Prices are used to determine the Deliver Charges – also commonly referred to as Line
Charges – which will be levied on a Retailer for their customers use of BEL’s network. Distributors
are paid by Retailers on a monthly basis as part of the Retailer Billing process, and the billing
quantities (for example the number of connections and energy consumption) are normally explicitly
itemised at the individual consumer level in the Retailer Billing data. As a result the Delivery Charges
for every connection can be readily identified by the Retailer and Distributor.
In terms of the charges consumers see of their power account with their Retailer, the Retailer will
either:
    •   Separately disclose the different components of their overall electricity bill in relation to
        electricity charges, delivery charges, administration charges, metering charges and/or
        Electricity Authority levy etc,
    •   Or alternatively repackage and include one of more of the charge components listed above
        into their own retail prices, in which case the charge components are not disclosed
        separately.
While the Distributor also has the option of billing consumers directly for their delivery service, this
is not the common/standard practice, and is generally only considered for the billing of the largest
consumers. BEL currently does not direct bill any consumers.

Buller Electricity Limited                                                                   Page 2 of 36
Pricing Methodology 2020/21
2.3 Economic Considerations
In terms of the structure of our pricing, we aim to ensure that our pricing is economically efficient,
which means that:
• Customers choosing to use our network should face the appropriate cost of that decision
and be incentivised to weigh up the value of the service and the cost of alternatives,
• And consequently, investments in our network over time will be at an appropriate level and
in the interest of customers.
2.4 Even-Handedness & Practical Considerations
BEL takes into account the need for even-handedness and practicality in determining consumer
groupings, cost allocations and the structure of our pricing. Specifically, we:
• Apply price averaging over large groups of connections, because it is generally not practical
to single out individual connections for cost-specific delivery pricing,
• Recognise that all consumers should share in the benefits of greater utilisation of shared
assets (and other enhanced economies of scale),
• Recognise that consumers change their demand behaviour only over relatively long periods
of time and it is important that we provide compelling and consistent pricing incentives
aimed at maximising the efficient utilisation of our assets (for example, low night time prices
that support off-peak usage),
• Seek to make our price signals effective by balancing strong price signals with easily
understood application and measurement,
• Treat connections with similar electrical attributes consistently,
• Set prices that are the same for all retailers, providing a ‘level playing field’ to promote retail
competition.
2.5 Regulatory Considerations
EDB’s are subject to the Electricity Distribution Information Disclosure Determination (IDD) 2012 1
determined pursuant to Part 4 of the Commerce Act 1986. In the Determination, Clauses 2.4.1 –
2.4.5 set out the requirements for BEL to disclose its Pricing Methodology, including:
• Target Revenue information
1 https://comcom.govt.nz/__data/assets/pdf_file/0025/78703/Electricity-distribution-information-disclosure-determination-2012-
consolidated-3-April-2018.pdf
Buller Electricity Limited Page 3 of 36Pricing Methodology 2020/21
• Discussion of the extent of consistency of the Pricing Methodology with the Pricing
Principles 2 – administered by the Electricity Authority and last updated in July 2019
• Pricing Strategy
• Approach to pricing for non-standard contracts and distributed generation
• Disclosure of consumer consultation on price and quality
The Commerce Commission notes that pricing disclosures help interested persons to understand:
• How prices are set and enable comparison between the different consumer groups
• How efficiency is promoted
• Whether they are sharing the benefits of efficiency gains with other consumers.
Additional regulatory guidance for BEL in preparing its pricing methodology comes from the Low
Fixed Charge (LFC) Regulations 2004 3.
As a consumer-owned EDB BEL is exempt from the Commerce Commission’s Default Price-Quality
Path (DPP) regime 4 which is beginning its 3rd 5-year control period on 1 April 2020. While exempt
EDB’s are subject to a lower level of scrutiny in comparison with their non-exempt peers, BEL has
determined that it is in our interests, the interests of its consumer-owners, and the interests of
consumers connected to the BEL network, to align its Pricing Methodology and practices to those of
our non-exempt peers. A key aspect of this is industry benchmarking, so far as practically possible,
using information available from the Information Disclosure Determination (IDD).
2.6 Changes to the Pricing Methodology
While BEL’s Price-Setting Methodology has not been changed for the 2020/21 financial year, this
document (the Pricing Methodology) has been substantially rewritten in an effort to:
• Improve our understanding of the key issues which exist in relation to pricing,
• Improve our overall internal processes and decision-making framework,
• Demonstrate consistency with the updated Electricity Authority Pricing Principles,
• And improve the level of documentation and explanations we provide to interested parties.
2.7 Consumer Consultation
While has not undertaken formally consultations on pricing with our consumers for a number of
years, price-quality trade-off related questions are routinely included in the consumer surveys we
2 https://www.ea.govt.nz/dmsdocument/25436-more-efficient-distribution-prices-principles-and-practice
3 http://www.legislation.govt.nz/regulation/public/2004/0272/latest/DLM283614.html
4 https://comcom.govt.nz/regulated-industries/electricity-lines/projects/2020-2025-default-price-quality-path
Buller Electricity Limited Page 4 of 36Pricing Methodology 2020/21
undertake on a tri-annual basis. The most recent of these surveys was undertaken in mid-2019 and
the majority of responders have been happy with the status quo and are not inclined to trade-off
current reliability levels for higher or lower prices.
As our distribution pricing reform work progresses and the time comes for us to make more
significant changes to our pricing structures, we will issue formal pricing consultations documents on
our website. Furthermore, we intend to notify consumers directly of pricing changes in situations
where the associated impacts are deemed to warrant this – subject to the approval of Retailers.
2.8 Pricing Strategy
BEL is committed to establishing a formal and prescribed Pricing Methodology, as well as overall
Company processes and a decision-making framework, which results in desirable outcomes in
relation to the economic, social and regulatory considerations associated with our network and
detailed in this document.
Our high-level Delivery Pricing Strategy has been approved by the BEL Board and is as follows:
Our Delivery Pricing Strategy
We aim to set our delivery prices to provide sufficient revenue to recover our prudent and efficient
costs, including our cost of capital, while seeking to comply with the regulations.
We aim to reflect the long-term economic costs of providing consumers with the quality of delivery
service that they require. Cost recovery is fundamental to retaining our incentives to invest in our
network in the long-term interests of consumers. In structuring and setting our prices we take a
medium to long term view, and we consider economic efficiency, equity and practicality. We seek to
ensure that our pricing is economically efficient, which means that customers who use our network
face the appropriate cost of that use, and are incentivised to weigh up the value of our delivery
service and the alternatives. Cost-reflective prices should help to ensure that our investments in our
network over time will be at an appropriate level.
Recognising that consumer capital contributions are a component of the overall recovery of our
costs – in simple terms the level of contributions determines how much is recovered up front as
opposed to on an ongoing basis – we will incorporate our approach to contributions into our set of
pricing documentation.
In determining customer groupings, cost allocation and the structure of our pricing we:
• apply price averaging over large numbers of connections, because it is generally not
practicable to single out individual connections for cost-reflective delivery pricing. Where it
is practicable to do so we allocate assets and costs to the specific connection categories that
use them,
• recognise that all consumers should share in the benefits of greater utilisation of shared
assets and economies of scale,
• recognise that consumers generally change their demand behaviour over relatively long
periods of time, and it is important that we provide compelling and consistent pricing
incentives aimed at maximising the efficient utilisation of our assets,
Buller Electricity Limited Page 5 of 36Pricing Methodology 2020/21
• seek to make our prices effective, by balancing strong price signals with simple application
and measurement,
• set prices that are the same for all retailers, providing a ‘level playing field’ to promote retail
competition.
Key considerations relating to our pricing over the next five years include:
• our developing thinking on sustainability and the way we manage the trade-offs between
the environmental and affordability aspects of the energy trilemma in New Zealand’s
transition to a low carbon economy,
• preserving incentives for managed water heating load,
• the impact of changing use of the network due to emerging technologies such as distributed
generation, battery storage, off-grid systems, and electric vehicles,
• the recommendations of the government’s Electricity Price Review, in particular its
recommendations regarding the low fixed charge regulations,
• the Electricity Authority’s:
• continuing review of Transpower’s transmission pricing methodology (TPM),
• recent review of the pricing principles and associated practice note and scorecards.
The way we implement our pricing strategy is updated and publicly disclosed in our Pricing
Methodology document. We usually change our delivery prices on 1 April each year.
2.9 Pricing History – Fixed Revenue Proportion
Historically BEL Line Charge revenue was been heavily weighted towards variable (energy/
consumption based) revenue compared with fixed (daily charge based) revenue. Starting in the
2016/17 financial year BEL initiated a 4-year program to significantly increase the proportion of
revenue received via fixed charges where this was appropriate and possible, with the aim of there
being an even split between fixed and variable revenue for all Consumer Groups by the end of the
2019/20 financial year. This change to our Price-Structure was undertaken over several years to
ensure consumers experienced price stability and to limit the potential for price shocks.
The overall results and success of this program are shown in Figure 1 which shows the portion of our
revenue which has been collected via fixed charges. The blue bars show the results for all Consumer
Groups while the red bars show the results for a Consumer Group Subset (excluding fixed charge
constrained consumers). This consumer subset excludes consumers for which an even split between
fixed and variable charges can currently not be attained for the following reasons:
• Residential Low-User Connections
The fixed price for these consumers is set at $0.15/day by the LFC Regulations 2004, and as a
result the portion of fixed charges for these consumer connections can essentially not be
changed – the current value is approx. 8% for this connection category
Buller Electricity Limited Page 6 of 36Pricing Methodology 2020/21
• Small Commercial Connections
A long-standing issue currently exists in relation to our ability to increase the fixed Delivery
Prices and associated proportion of fixed charges for this connection category. Given the
wide range of consumers in this connection category – in terms of both maximum demand
and energy consumption – it has been deemed inappropriate to further increase the overall
percentage of fixed revenue, as it would result in unreasonably high fixed charges for those
consumers with low energy consumption. BEL intends to address this issue in our 2021/22
pricing as detailed in our plan for the adoption for efficient distribution pricing 5.
Excluding these fixed charge constrained connections from the results (red bars in Figure 1) provides
an accurate portrayal of our efforts to increase the Fixed Revenue proportion.
Fixed Revenue Proportion
All Consumer Groups Consumer Group Subset
60%
49.5%
50% 47.3%
45.1%
40.5%
40% 35.1%
33.6%
30% 25.3%
20%
10%
0%
2013/14 2014/15 2015/16 2016/17 2017/18 2018/19 2019/20
Figure 1 Fixed Revenue Proportion
5 https://www.bullerelectricity.co.nz/adoption-of-efficient-pricing/
Buller Electricity Limited Page 7 of 36Pricing Methodology 2020/21
2.10 Future Pricing Objectives
BEL is currently progressing a distribution pricing reform work program, and our current plans for
the adoption of more efficient distribution pricing can be found on our website here.
Options for distribution pricing reform which the BEL Management and Board have currently
decided are not to be considered for implementation are:
• Increasing the overall level of fixed revenue in any Consumer Group to be greater than 50%
• Urban/rural locational pricing differentiation
BEL also recognises the economic impacts electricity price increases have had on members of our
community and one of our pricing objectives is where possible to the minimise any increases to
residential consumers.
Buller Electricity Limited Page 8 of 36Pricing Methodology 2020/21
3. Overview of the Price-Setting Methodology
This section provides an overview of the Price-Setting Methodology BEL uses to determine electricity
Delivery Prices. The major tasks which comprise the Price-Setting Process are as follows:
• Determining the Target Revenue
• Review (and possible change) the Consumer Groups & Price-Structure
• Allocation of costs to the Consumer Groups and Price Calculation
The nature of these tasks is detailed below, and this is followed by a discussion the difference
between Traditional and Cost-Reflective Price-Setting Methodologies, and how BEL’s current Pricing
Methodology aligns.
3.1 Determining the Target Revenue
The Target Revenue is obtained using a building blocks approach from the budgets and Asset
Management Plan as shown in Figure 2. The budget takes into consideration the costs associated
with providing an electricity delivery service to consumers such as network maintenance, asset base
depreciation, transmission costs, and business support (administration).
Asset Management Plan
Asset Base
÷ Asset Life
× WACC
BUDGET Maintenance Business Support Depreciation Transmission
Funding
Target Revenue
Figure 2 Process for Determining the Target Revenue
Buller Electricity Limited Page 9 of 36Pricing Methodology 2020/21
3.2 Consumer Group & Price-Structure Review
Consumer connections are categorised into Consumer Groups (Electricity Registry Price Categories)
which have similar maximum demand, capacity, network usage characteristics, and other energy
delivery cost drivers. These groups are reviewed annually using information from our consumer
database, Pricing-Strategy and historic Retailer Billing & consumption data.
The Price-Structure is reviewed annually with reference to BEL’s Pricing Policy & Strategy. It
determines the way in which the Target Revenue will be collected from the Consumer Groups in
relation to:
• The proportion of revenue/charges to collected as fixed revenue/charges versus variable
revenue/charges
• The fixed charge types e.g. fixed daily charge ($/day) or fixed demand/capacity charge
($/kW/day)
• The variable (consumption) charge types e.g. Uncontrolled/Controlled, All Inclusive,
Day/Night or Time-of-Use (TOU)
The Consumer Groups and Price-Structure provides the platform/framework on which the later Cost
Allocation & Price-Calculation tasks of the overall Price-Setting Methodology are undertaken. They
are stable from year to year, and any significant changes would generally require consultation with
Retailers and/or consumers well in advance of when BEL completes the annual Price-Setting in
November/December each year.
The Consumer Groups and Price-Structure, in conjunction with the associated historic data, allow
Retailer Billing quantity forecasts to be made, which are key inputs to the following Cost Allocation
and Price Calculation tasks the Price-Setting Methodology.
3.3 Cost Allocation & Price Calculation
The Cost Allocation & Price Calculation tasks of the Price-Setting Methodology are depicted in Figure
3 where the blue boxes represent inputs. The Target Revenue is allocated to the Consumer Groups
using the Cost Allocation Algorithm. This algorithm identifies the costs associated with the
electricity delivery service provided to each Consumer Group, with the end result being the Target
Consumer Group Revenue.
Price Calculation involves determining the individual prices which will be applied to the Retailer
Billing qualities e.g. number of consumers, capacity and energy consumption, to calculate the
charges to consumers in each Consumer Group. The previous year’s prices are normally used as the
initial prices, and these prices are then modified in an iterative manner, with a goal of achieving the
best pricing solution subject to a range of criteria such as:
• The desired proportion of fixed versus variable charges
• Overall Consumer Group revenue impacts, and possibly also the charge impacts at the
individual consumer level if deemed necessary
Buller Electricity Limited Page 10 of 36Pricing Methodology 2020/21
• The difference between the Target Revenue and Forecast Revenue for each Consumer
Group
• The difference between the overall Target Revenue and Forecast Revenue
• The percentage change in prices between years
Cost Allocation
ALLOCATION
Asset Database Target Revenue
Algorithm
COST
Consumer
Target Consumer Group Revenue
Information
Consumer Impact Analysis
PRICE CALCULATION
Price Structure Compare,
Forecast Revenue
Review & Iterate
Initial Prices PRICES
Figure 3 Cost Allocation & Price Calculation Tasks of the Price-Setting Methodology
Buller Electricity Limited Page 11 of 36Pricing Methodology 2020/21
3.4 Traditional & Cost-Reflective Price-Setting Methodologies
The Electricity Authority updated the Pricing Principles in its Distribution Pricing Decision Paper 6
released in July 2019 and published a further Distribution Pricing Practice Note 7 in August 2019. In
Figure 1 of the Practice Note the Authority provided diagrams which highlight the differences which
exist between Traditional & Cost-Reflective Price-Setting Methodologies – and these diagrams are
reproduced in Figure 4 and Figure 5 for reference.
A Cost-Reflective Price-Setting Methodology is essentially a Traditional Price-Setting Methodology
with an additional initial step where:
• The Economic Cost is allocated to the Consumer Groups and appropriate cost-signalling
prices are calculated to recover these costs. The combined forecast revenue associated with
these signalling-prices is referred to as the Forecast Signalling Revenue.
• The Residual Costs (Target Revenue less Forecast Signalling Revenue) are then allocated to
the Consumer Groups using a (modified) Traditional Price-Setting Methodology – which
results in the least distortion in network use – and appropriate prices are calculated to
recover these costs.
With regard to the Authority’s Price-Setting terminology, Price Design refers to combination of the
separate BEL pricing tasks which we refer to as:
• Price-Structure Review
• Price Calculation
The Price-Structure Review and Price Calculation tasks differ in the sense that the Price-Structure
provides the platform/framework on which the Price Calculation is undertaken. Price-Structure
changes will often require Retailer/consumer consultation as they are generally more permanent
and/or significant, for example the introduction of a new price component or significant change in
the proportion of fixed revenue. Retailer/consumer consultation takes time and as the Price-
Structure is generally not changed regularly, we use the term ‘review’ as more often than not it is a
review rather than a change.
In contrast Price Calculation is undertaken annually and prices generally change from year to year.
Price changes generally only require Retailer/consumer notification, rather than consultation,
provided the price/charge changes are within reasonable bounds and do not constitute price shocks.
Historically BEL’s Pricing-Setting Methodology has taken the form of a Traditional Price-Setting
Methodology and this continues to be the case for 2020/21. It is however noted that in the situation
where the Economic Costs are zero (or near zero), the Cost-Reflective Methodology reverts to the
form of a Traditional Price-Setting Methodology e.g. no initial step to determine the signalling-prices
and Signalling Revenue is required.
6 https://www.ea.govt.nz/dmsdocument/25436-more-efficient-distribution-prices-principles-and-practice
7 https://www.ea.govt.nz/dmsdocument/25528-distribution-pricing-practice-note-august-2019
Buller Electricity Limited Page 12 of 36Pricing Methodology 2020/21
BEL is of the view that the Economic Costs associated with our Consumer Groups is currently zero for
the following reasons:
• Network demand has not experienced growth in recent years and this is forecast to continue
in the foreseeable future
• Significant spare capacity exists on our network and there are no congestion issues
• No capex expenditure is forecast to manage network growth or relieve constraints
BEL’s Asset Management Plan 2020-30, available from our website here, provides details on our
Load Forecasts, Constraints & Proposed Capex Program in Sections 6.6 – 6.8 respectively. Section
6.8.2 states that, as BEL is forecasting zero growth for the 2020-30 planning period no allowance has
been made for capex expenditure for system growth.
Given this information BEL is of the view that the Price-Setting Methodology we have been using for
a number of years is, and continues to be, consistent with a Cost-Reflective Price-Setting
Methodology.
Figure 4 Price-Setting Methodology 8
8 ‘Price design’ includes the separate BEL pricing tasks we referred to as ‘Price-Structure Review’ and ‘Price Calculation’
Buller Electricity Limited Page 13 of 36Pricing Methodology 2020/21 Figure 5 Price-Setting Methodology – Cost-Reflective Buller Electricity Limited Page 14 of 36
Pricing Methodology 2020/21

4. Target Revenue
As a consumer-owned Electricity Distribution Business (EDB), BEL is exempt from the Default Price
Path (DPP) regime administered by the Commerce Commission. However, BEL has determined that
it is in its interests, the interests of its consumer-owners, and the interests of consumers connected
to the BEL network, to align its Pricing Methodology to that of its non-exempt peers. It is therefore
integral to BEL’s Pricing Methodology that a ‘building blocks’ approach is used to determine the
appropriate level of costs to be recovered – this being the Target Revenue required for the year.
BEL has two subsidiaries – a wholly owned electrical contracting business and an investment holding
company which holds c.47% of a limited partnership electricity retail business. BEL’s pricing
approach for the network business is on a standalone basis and is not influenced or diluted by any of
the subsidiary businesses.

4.1 Target Revenue Components
The Target Revenue has been determined to be $7,599k for the 2020/21 financial year, and consists
of the following major cost components (also see Figure 6):

    •   Maintenance $928k
        The direct costs associated with maintaining the system assets, and includes the
        management of designing and running the lines business and the management of the
        computerised load control system and geographical information system. Network
        operational costs are included in Maintenance.
    •   Transmission Costs $1,061k
        Costs paid to Transpower for our connection to the national transmission grid together with
        ‘Avoided Transmission’ costs paid to local generators. These are referred to as Recoverable
        Costs by the Commerce Commission.

    •   Business Support $1,899k
        Includes the other indirect costs (such as Administration and Overhead costs) necessarily
        incurred in providing the distribution service. Pass-through costs (another term used by the
        Commerce Commission) includes some industry Levies, and Local Authority rates and these
        are included as Business Support costs.

    •   Depreciation $1,442k
        The cost of network assets is returned over time as depreciation, with the amount of
        depreciation being determined by the useful life of the assets

    •   Return on Investment $2,268k
        Comparable to a post-tax Weighted Average Cost of Capital (WACC)

Buller Electricity Limited                                                               Page 15 of 36
Pricing Methodology 2020/21
Major Components of the Target Revenue
3.0
2.5 2.268
2.0 1.899
Revenue ($M)
1.442
1.5
1.061
0.928
1.0
0.5
0.0
Maintenance Transmission Costs Business Support Depreciation Return on
Investment
Figure 6 Major Components of the Target Revenue
4.2 Capital Contributions
In addition to line charge revenue BEL receives from consumer groups, BEL also receives capital
contributions from consumers that require new or upgraded power supply to their properties.
As the requirement for a capital contribution can only be determined once details of the specific
connection are known, BEL does not have a schedule of charges. However, as there is a high degree
of consistency in prices for similar categories of connection, the level of capital contribution is
transparent to consumers.
Being a small rural based network with limited growth and limited or no building of network
extensions, the level of capital contributions compared with our Target Revenue is very low, and as a
result the value budgeted for this revenue is zero.
4.3 Discretionary Discounts and Rebates
BEL does not have specific policies in place regarding discretionary discounts or rebates. Any
decision to provide a discount or make a rebate will be determined by the BEL Board following input
from management and our trust owners.
4.4 Metering and Load Control Equipment
Whilst BEL sold its metering and ripple control relays to TrustPower in the late 1990’s following the
deregulation of the electricity industry, it retained the equipment and operational services for
sending out load control signals (ripple signals) and BEL charges consumers for this service. The
costs associated with providing this load control service is included in the Business Support
component of the Target Revenue.
Buller Electricity Limited Page 16 of 36Pricing Methodology 2020/21
5. Consumer Groups
Consumer connections are categorised into Consumer Groups (Electricity Registry Price Categories)
which have similar maximum demand, connection capacity, network usage characteristics, and other
energy delivery cost drivers in order to simplify the processes of:
• Price-Setting
• Revenue recovery via Retailer Billing or direct consumer billing
• Administration
• Meeting Regulatory requirements e.g. Low Fixed Charge (LFC) Regulations 2004
The key cost drivers for the supply of electricity to a consumer are identified as being maximum
demand, connection capacity, network usage characteristics and location. For the time being BEL
does not use consumer location to determine Delivery Prices, and as a result the costs associated
with location variation is averaged across the BEL’s distribution region. The 6 Consumer Groups that
will apply through to the end of the 2020/21 pricing year are set out in Table 1.
Price Category Consumer Group Description Capacity No. of Connections
LG1 Residential Standard Connections ≤ 15kVA 1,360
LG1L Residential Low-User Connections ≤ 15kVA 2,706
LG2 Small Commercial Connections ≤ 15kVA 517
LG3 Medium Commercial Connections > 15kVA 85
LG4 Large Commercial Connections > 100kVA 11
LG7 Commercial Connections > 1,000kVA 1
Total 4,680
Table 1 Price Category, Consumer Group Description, Capacity & Number of Connections – Active
Installation Control Points (ICPs) as recorded on the Electricity Registry on 1st November 2019
BEL currently uses capacity as the primary characteristic to categorise connections into Consumer
Groups. In general terms the capacity of a connection is derived from one or a combination of the
following:
• kVA fuse rating of the connection – for residential and small commercial connections
connected to the general LV network
• Installed kVA capacity of the supply transformer – for small-large commercial connections
where a dedicated supply transformer exists
• Half-hour metered maximum demand (kW) – for LG4 and LG7 consumers
Buller Electricity Limited Page 17 of 36Pricing Methodology 2020/21
In addition to capacity further distinction is made between Consumer Groups as follows:
• Residential low-user (LG1L) is required for regulatory purposes
• Residential and commercial consumers have historically been separated for the purposes of
reporting and identifying the different network usage characteristics/profiles associated
with these connections
5.1 Residential Connections
Residential standard and low-user Delivery Prices are set so that a typical consumer using 8,000kWh
annually would experience the same annual Line Charges on either standard or low-user prices, as
required by the Low Fixed Charge (LFC) Regulations 2004. Only connections which are the primary
place of residence are eligible for low-user pricing. Consumers using more than 8,000kWh will
generally be better off on standard residential pricing, while those using less than 8,000kWh will
generally be better off on low-user residential pricing.
The average residential consumer connected to the BEL Network uses 4,771kWh annually, and as a
result it is expected that most residential consumers would be better off on low-user residential
pricing. Most consumers are not actively engaged in the decision to be standard or low-user
consumers and allow their Retailer to make this decision for them. The LFC Regulations 2004 are
currently under review by the Government and it is expected that they soon be either removed or
replaced.
5.2 Commercial Connections
BEL currently uses four capacity-based Consumer Groups (LG2, LG3, LG4 & LG7) for the
administration, pricing and billing of commercial connections.
5.3 Temporary Connections
BEL does not have a specific Consumer Group for temporary connections as these are treated in the
same manner as permanent connections. Temporary supplies are always metered connections.
Builders Temporary Supplies (BTS) for the construction of new homes are normally categorised as
residential connections, although some Retailers choose to set these up as commercial connections
during the construction period when the power account is held under the name of a commercial
enterprise – the builder or otherwise.
5.4 Unmetered Connections
BEL does not have a specific Consumer Group or pricing for unmetered load. The most significant
unmetered load consists of approx. 150 Buller District Council streetlights (recorded in the RAMM
streetlight database), which are aggregated onto a single Distributed Unmetered Load (DUML) ICP
on the Electricity Registry.
Buller Electricity Limited Page 18 of 36Pricing Methodology 2020/21 Phone Booths and Cabinets are also unmetered and are charged as small commercial connections on individual ICPs at the standard rates of consumption for these loads. 5.5 Streetlight Connections BEL does not have a specific Consumer Group for streetlight connections, but we are considering creating a Streetlight Consumer Group for the 2021/22 financial year. 5.6 Irrigation Connections BEL does not have a specific Consumer Group for irrigation load as this type of connection does not represent a significant proportion of the load on our network. Buller Electricity Limited Page 19 of 36
Pricing Methodology 2020/21

6. Allocating Costs to Consumer Groups
The Cost Allocation Algorithm is used to allocate the components of the Target Revenue detailed in
Section 4 to the Consumer Groups using the Cost Allocators listed in Table 2. The Cost Allocators
chosen are considered to be the most appropriate in term of providing Consumer Group allocations
which will are cost-reflective and service-based. The methods employed to determine the Cost
Allocators and the results of the Cost Allocation are detailed in the following Sections.

 Target Revenue Component                       Cost Allocator                    Cost ($k)

 Maintenance                                       Asset %                           928

 Transmission Costs                                RCPD %                           1,061

 Business Support                                 Energy %                          1,899

 Depreciation                                      Asset %                          1,443

 Return on Investment                              Asset %                          2,353

 Total                                                                              7,684

Table 2 Allocators used to Allocate the Target Revenue Components to the Consumer Groups

6.1 Cost Allocation Parameters & Cost Allocators
The Cost Allocators are described as follows:
    •    Asset % – Consumer Group Value of Assets Used as a Proportion of the Total

    •    RCPD % – Consumer Group Regional Coincident Peak Demand (RCPD) as a Proportion of the
         Total
    •    Energy % – Consumer Group Energy Consumption as a Proportion of the Total
The following additional Cost Allocators are also required to determine the Asset % Cost Allocator:
    •    Connection % – Consumer Group Connections as a Proportion of the Total

    •    CAMD % – Consumer Group Coincident Any-Time Maximum Demand (CAMD) as a
         Proportion of the Total
The Cost Allocators are simply derived from the Cost Allocation Parameters given in Table 3 as the
value for each Consumer Group as a proportion of the total (expressed as a percentage). The Cost
Allocator are given in Table 4 and shown graphically in
Figure 7. It is noted that the RCPD % and CAMD % allocators are very similar. The methods used to
determine the value of the different Allocation Parameters for each Consumer Group are described
in the following Sections.

Buller Electricity Limited                                                                 Page 20 of 36
Pricing Methodology 2020/21
Parameter LG1 LG1L LG2 LG3 LG4 LG7 Total
Connection (#) 1,360 2,706 517 85 11 1 4,680
Energy (GWh) 8.2 11.2 9.0 4.8 5.3 10.8 49.3
RCPD (kW) 1,265 1,728 1,389 741 895 1,519 7,537
CAMD (kW) 1,722 2,352 1,890 1,008 857 2,275 10,104
Asset (Value $M) 8.81 12.52 9.11 4.75 3.20 3.67 42.06
Table 3 Allocation Parameters
Parameter LG1 LG1L LG2 LG3 LG4 LG7
Connections % 29.1% 57.8% 11.0% 1.8% 0.2% 0.0%
Energy % 16.6% 22.7% 18.3% 9.7% 10.8% 21.9%
RCPD % 16.8% 22.9% 18.4% 9.8% 11.9% 20.2%
CAMD % 17.0% 23.3% 18.7% 10.0% 8.5% 22.5%
Asset % 20.9% 29.8% 21.7% 11.3% 7.6% 8.7%
Table 4 Cost Allocators
Cost Allocators
LG1 LG1L LG2 LG3 LG4 LG7
70%
60%
50%
40%
30%
20%
10%
0%
Connection % GWh % RCPD % CAMD % Asset % Cost %
Figure 7 Cost Allocators
Buller Electricity Limited Page 21 of 36Pricing Methodology 2020/21
6.2 Cost Allocator – Connection %
Consumer Group Connections as a Proportion of the Total
The forecast average number of Active connections in each Consumer Group for the 2020/21
financial year. Due to the static and limited growth nature of our network these are taken to be the
number of connections as at 1st November 2019.
6.3 Cost Allocator – Energy %
Consumer Group Energy Consumption as a Proportion of the Total
The forecast energy consumption (kWh) in each Consumer Group for the 2020/21 financial year.
These quantities are estimated using historic Retailer Billing data in conjunction with the forecast
number of connections.
6.4 Cost Allocator – RCPD %
Consumer Group Regional Coincident Peak Demand (RCPD) as a Proportion of the Total
This cost allocator is only partially known for the Consumer Groups and certain assumptions and
approximations must be made in order to obtain a value for all Consumer Groups. This parameter is
derived from the BEL network load which is coincident with the 100 highest peaks of the Upper
South Island (USI) Transmission System for the Capacity Measurement Period (1-year) ending 31st
August 2019.
The RCPD at Grid Exit Points (GXPs) during these periods is used by Transpower to determine its
Interconnection Charges for the 2020/21 financial year and is therefore an appropriate allocator for
these charges.
The Consumer Group RCPD is calculated using the following 3-step process:
1. Determine the total RCPD of the BEL network load (at consumers’ meters) from a knowledge
of GXP RCPD, significant local distribution generation, and assuming network losses of 7.0%.
The BEL network RCPD is determined to be 7,537 kW.
2. Determine the contribution of half-hour metered LG4 and LG7 Consumer Group connections
to the RCPD. Estimate the RCPD contribution of non-half-hour metered LG4 and LG7
connections. Combining these known and estimated RCPD quantities allows the RCPD for
Consumer Groups LG4 and LG7 to be determined.
3. The remaining portion of the 7,537kW RCPD is allocated across the LG1 – LG3 Consumer
Groups on a pro-rata using the Energy (GWh) allocation parameter.
Buller Electricity Limited Page 22 of 36Pricing Methodology 2020/21 6.5 Cost Allocator – CAMD % Consumer Group Coincident Any-Time Maximum Demand (CAMD) as a Proportion of the Total This allocator is only partially known for the Consumer Groups and certain assumptions and approximations must be made to obtain a value for all Consumer Groups. This parameter provides a measure of the contribution of the Consumer Group connections to the peak demand on the distribution network over the year ending 31st October 2019. A peak demand of 10,864kW occurred on the BEL network on 20/8/2019 in Trading Period 35. Assuming a 7.0% loss this corresponds to an CAMD of 10,104kW at consumers’ meters. CAMD is apportioned across the Consumer Groups in a similar manner to RCPD. For Consumer Groups LG4 & LG7 half-hour meter data is used where available, otherwise estimates are made to determine the contribution of an individual connection to the CAMD. The remaining CAMD is allocated between across the LG1 – LG3 Consumer Groups on a pro-rata basis using the Energy (GWh) allocation parameter. 6.6 Cost Allocator – Asset % Consumer Group Value of Assets Used as a Proportion of the Total The value of the different network asset classes (replacement cost) has been obtained from BEL’s Asset Database (as detailed in Table 6) and allocated across the Consumer Groups using the indicated Cost Allocator. CAMD % is deemed to be the most appropriate Cost Allocator for asset usage and asset related costs for the majority of the asset classes. This Cost Allocator however needs to be modified if an asset class is not utilised by a Consumer Group – in which case a modified CAMD % allocation Parameter needs to be used. For example, LG4 and LG7 Consumer Groups do not use the 400V network and as a result this asset class is only allocated across Consumer Groups LG1 – LG3. The modified CAMD % Cost Allocators are provided in Table 5. In the case of Zone Substation and 33kV Network Assets, LG7 is deemed to utilise 33% of these assets. The asset values listed in Table 5 were last updated for the 2018/19 pricing year. The asset class values are multiplied by the Allocation Parameter to obtain Asset Value associated with each Consumer Group given in Table 3. Allocation Parameter LG1 LG1L LG2 LG3 LG4 LG7 CAMD % 17.0% 23.3% 18.7% 10.0% 8.5% 22.5% CAMD % with LG7 set to 33% 14.7% 20.1% 16.2% 8.6% 7.3% 33.0% CAMD % with LG7 excluded 22.0% 30.0% 24.1% 12.9% 10.9% – CAMD % with LG4 – LG7 excluded 24.7% 33.7% 27.1% 14.5% – – Table 5 Modified CAMD % Cost Allocators Buller Electricity Limited Page 23 of 36
Pricing Methodology 2020/21

 Asset Class                                                       Cost Allocator                Value ($k)

 110kV + GXP Assets                                                  CAMD %                        3,143

 Zone Substation                                         CAMD % with LG7 set to 33%                2,971

 33kV Network                                            CAMD % with LG7 set to 33%                6,017

 11kV Network                                            CAMD % with LG7 excluded                  20,710

 400V Network                                          CAMD % with LG4 – LG7 excluded              6,542

 SCADA + Communications + Load Control                             Connections %                   1,779

 Generators                                                        Connections %                    901

 Total                                                                                             42,063

Table 6 Asset classes, values, and allocation methods used

6.7 Target Consumer Group Revenue
The Cost Allocators are applied to the Target Revenue Components (see Table 2) to obtain Target
Consumer Group Revenue as detailed in Table 7.

 Revenue Component                   LG1       LG1L          LG2         LG3        LG4    LG7         Total

 Maintenance ($k)                    194        276          201         105        71      81            928

 Transmission Costs ($k)             178        243          195         104        126     214        1,061

 Business Support ($k)               316        431          347         185        204     416        1,899

 Depreciation ($k)                   302        429          313         163        110     126        1,443

 Return on Investment ($k)           401        548          440         235        200     530        2,353

 Total ($k)                         1,392      1,928       1,496         792        710    1,367       7,684

 Total (%)                          18.1%     25.1%        19.5%        10.3%       9.3%   17.8%       100%

Table 7 Allocation of the Target Revenue Components to the Consumer Groups

Buller Electricity Limited                                                                    Page 24 of 36
Pricing Methodology 2020/21

7. Pricing Structure & Price Calculation
This Section firstly documents the Price-Structure on which the Price Calculation task is performed

    •   Fixed Revenue Proportion
    •   Locational Price (Urban vs Rural) Differentiation

    •   Fixed & Variable Price Components
The results of the Price Calculation and the Forecast Consumer Group Revenue for the 2020/21
financial year are then presented. A full list of the Price Components which exist in the different
Consumer Groups is provided in Appendix A.

7.1 Fixed Revenue Proportion
Given that the Economic Costs associated with the operation of our network are near zero the
pricing guidelines issued by the Electricity Authority advocate that BEL should be receiving all of its
revenue via fixed charges. BEL is however of the view that any move to increase the overall Fixed
Revenue proportion in any Consumer Group to over 50% is inappropriate, given that it would result
in unreasonably high fixed charges for those consumers with low energy consumption. We intend to
further increase the Fixed Revenue proportion for the Consumer Groups which are currently fixed
charge constrained further towards 50% once this is possible and consider appropriate.

7.2 Locational Price Differentiation
Lower density rural areas require a greater level of investment for each consumer connection, both
in terms of establishing connections and maintaining the network. While this provides a basis for
applying higher prices to our consumers in rural and remote rural areas BEL’s current policy is not
implement locational price differentiation. Our reasons for this are outlined as follows:

    •   Rural consumers make a greater (capital) contribution when first connecting to the network
        and this provides a clear locational signal
    •   We are conscious that rural customers receive a lower level of service with a greater number
        of faults and longer restoration times, and this somewhat offsets the higher on-going costs
        of supply to rural areas
    •   We recognise that consumers have made long-term investment and/or consumption
        decisions on the basis of expectations that have been shaped from past pricing
        arrangements. Significant increases in our prices to rural connections does not support
        these previous decisions and/or provide price stability.
    •   A significant proportion of the existing rural and remote network was funded via the Rural
        Electrical Reticulation Council (RERC) which operated from 1946 to 1993, rather than by our
        connected consumers (owners)
How BEL addresses pricing has the potential to create significant implications for the future use of
our network in both urban and rural areas. With the continual decrease in the cost of new

Buller Electricity Limited                                                               Page 25 of 36
Pricing Methodology 2020/21 technologies, such as off-grid and alternative energy storage systems, we are actively monitoring the relevant economic factors and the long-term benefits which exist to consumers, BEL, and the wider community. Given the higher costs associated with rural connections, off-grid supplies in these areas will in general become economic before those in urban areas. 7.3 Fixed Price Components – Daily ($/day) All connections except those in Consumer Groups LG4 and LG7 are subject to fixed daily price ($/day) component. For low-user residential consumers (LG1L) the fixed price amount is set at $0.15/day by the LFC regulations 2004. 7.4 Fixed Price Components – Fixed Capacity ($/kW/day) Consumers in Consumer Groups LG4 and LG7 are subject to a fixed capacity price ($/kW/day) component. This is a lagged charge using the half-hour Anytime Maximum Demand (AMD) in the previous November to October period e.g. for 2020/21 pricing the relevant period is November 2018 – October 2019. This AMD value is also referred to as the Charge Capacity as this value is recorded in the Electricity Registry in the Chargeable Capacity of the Pricing section. The AMD is determined from the half-hour revenue meter data which is used in the Retailer Billing process for the majority of LG4 & LG7 connections. Where half-hour meter data is unavailable BEL load monitoring or estimates are used. 7.5 Variable Price Components – Energy Consumption ($/kWh) All consumers are subject to variable price components which are dependent on the energy (kWh) units consumed, as recorded by the revenue meter. In each Consumer Group BEL offers Uncontrolled (24 hour), Day (8am-Midnight) and Night (Midnight-8am), and All Inclusive variable price components. In addition, Controlled (water heating) variable price components are also offered to residential and small commercial connections. Our variable prices are set in a manner to incentivise the use of electricity during off peak times (Night), and to encourage consumers to offer their hot water heating as controllable load. 7.6 Power Factor While BEL currently does not apply a Power Factor charges to any connections the provision for such a charge exists as part of the legacy Use of System Agreement (UoSA) we have with the major Retailers trading on our network. Buller Electricity Limited Page 26 of 36
You can also read


