Business experiences in 2020 and outlook for 2021 - December 2020 - Ai Group ...
←
→
Page content transcription
If your browser does not render page correctly, please read the page content below
Business
experiences in
2020 and
outlook for 2021

December 2020
About Australian Industry Group
The Australian Industry Group (Ai Group ®) is a peak employer organisation representing traditional,
innovative and emerging industry sectors. We are a truly national organisation which has been
supporting businesses across Australia for more than 140 years.

Ai Group is genuinely representative of Australian industry. Together with partner organisations we
represent the interests of more than 60,000 businesses employing more than 1 million staff. Our
members are small and large businesses in sectors including manufacturing, construction, engineering,
transport & logistics, labour hire, mining services, the defence industry, civil airlines and ICT.

Our vision is for a thriving industry and a prosperous community. We offer our membership strong
advocacy and an effective voice at all levels of government underpinned by our respected position of
policy leadership and political non-partisanship.

With more than 250 staff and networks of relationships that extend beyond borders (domestic and
international) we have the resources and the expertise to meet the changing needs of our membership.
We provide the practical information, advice and assistance you need to run your business. Our deep
experience of industrial relations and workplace law positions Ai Group as Australia’s leading industrial
advocate.

We listen and we support our members in facing their challenges by remaining at the cutting edge of
policy debate and legislative change. We provide solution-driven advice to address business
opportunities and risks.

Australian Industry Group contact for this report
Dr Peter Burn
Chief Policy Adviser
Australian Industry Group
51 Walker Street, North Sydney, NSW 2060 Australia
T: 02 9466 5566

© The Australian Industry Group, 2020
The copyright in this work is owned by the publisher, The Australian Industry Group, 51 Walker Street,
North Sydney NSW 2060. All rights reserved. No part of this work may be reproduced or copied in any
form or by any means (graphic, electronic or mechanical) without the written permission of the publisher.

The Australian Industry Group •   Business experiences in 2020 and outlook for 2021                    2
CONTENTS

KEY FINDINGS

2020

1. Ai Group assistance to Australian businesses

2. The impact of COVID-19 on Australian business

3. Business responses to the COVID-19 pandemic

4. Assistance to help business manage their response to COVID-19

2021

5. What will businesses do in 2021?

6. Outlook for 2021 and beyond

Appendix: business responses by month, industry and state

The Australian Industry Group •   Business experiences in 2020 and outlook for 2021   3
KEY FINDINGS

This report is the last in a series of monthly reports by Ai Group about Australia’s
business experiences during the COVID-19 pandemic and recession in 2020.
Throughout 2020, Ai Group provided assistance, information and advice to thousands
of businesses experiencing activity restrictions, adjustments to workplaces and work
practices, reduced demand and reduced incomes due to COVID-19.

In the course of our work, we collected almost 1,900 detailed reports from Australian
businesses about their experiences, through sources including emails, surveys, web
queries, phone calls and (remote) meetings. This report summarises the impacts,
responses and requirements of businesses due to the COVID-19 pandemic during
2020, and their plans for 2021.

2020
The majority of businesses reported negative impacts as a result of COVID-19 in
every month from March to November. The total proportion of businesses reporting a
negative impact peaked close to 90% in April, fell to around 78% in June but then rose
to 87% in September due to the ‘second wave’ of infections and associated restrictions
to activity and internal travel. In November, despite the beginnings of the recovery,
84% of businesses were still reporting negative impacts on their business as a result
of COVID-19. The most frequently reported business impact in every month of 2020
was reduced customer demand.
A small proportion of businesses reported no impacts or a positive impact as a
result of COVID-19 in each month of 2020. Businesses reporting low or no impact
ranged from just 5% in March to a high of 22% in June as conditions improved, but
then fell back to 16% in November. 11% of businesses reported a lift in demand for
their products in March due to local stockpiling and/or supply disruptions for imported
competing products, but this effect quickly waned as pent-up demand was met.

Business responses to these impacts in 2020 initially focussed on risk mitigation
and workplace health and safety. Businesses moved staff to home-based work where
possible and developed COVID-19 safety plans. As the crisis wore on, reduced
demand and revenue forced more businesses to cut work hours and/or employment.
A major task for many businesses in April was to assess eligibility for and, where
applicable, to meet JobKeeper requirements. From May, businesses shifted towards
adjusting work practices, worksites and product offerings to accommodate ‘safe
working’ requirements.

The types of assistance sought by businesses changed over the course of 2020,
with clear information and directions needed in the early stages, followed by financial

The Australian Industry Group • Business experiences in 2020 and outlook for 2021     4
assistance as the pandemic worsened. Jobkeeper became an essential support for
many businesses from May onwards proving decisive in stemming job losses and
business closures. By September, businesses mainly wanted to see evidence of a safe
path to easing out of local activity restrictions and border restrictions.

2021
In November, Ai Group asked businesses if they intended to retain into 2021 any of
the changes that they had made in response to the COVID-19 pandemic. In total:

•   Around 20% of businesses said they do not yet know (7%) or they do not plan
    to keep doing any of the changes they have made in response to COVID-19 in 2021
    (14%). These businesses appear to be less affected by the remaining COVID-19
    activity restrictions in late 2020 and/or they hope a vaccine will become widely
    available in Australia by mid-2021, allowing a return to more normal conditions.
•   Around 80% of businesses said they will keep at least some of the changes
    they have introduced in 2020 in response to COVID-19, well into 2021. In line with
    the physical distancing and ‘demand shock’ nature of this pandemic, the measures
    that businesses plan to keep in 2021 are mainly aimed at maintaining or improving
    their communications with customers, staff and suppliers and/or COVID-19 safety
    and hygiene measures as part of their ‘COVID-safe’ business plans (Chart 1).

          Chart 1: COVID-19 practices that businesses plan to keep in 2021

The Australian Industry Group • Business experiences in 2020 and outlook for 2021   5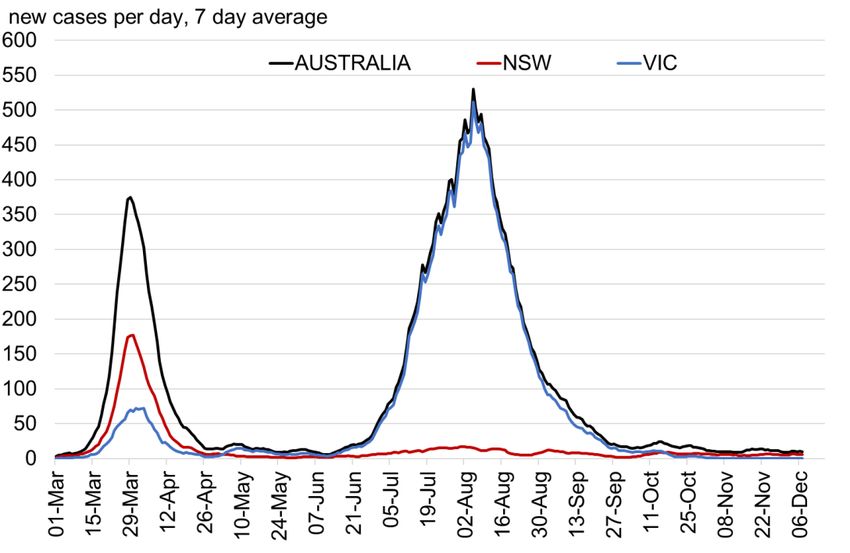
1. Ai Group assistance to Australian
businesses

Ai Group has skilled advisers, business improvement resources and a network of
experienced business consultants to assist your business, backed by our 140 years of
experience in understanding what drives successful Australian businesses.
Ai Group has launched a dedicated Coronavirus COVID-19 Advice and Resources hub
with resources to help you navigate the pandemic and stay up-to-date with the latest
information and advice. This site is being updated daily as issues develop.
The Workplace Advice Line is available to Ai Group members every weekday to
provide advice on a range of workplace issues. Phone 1300 55 66 77 (press option 1)
8.30am to 5.30pm (AEST) or email workplaceadvice@aigroup.com.au for a call back.
Supported by Ai Group Workplace Lawyers and our HR experts, the HR Resource
Centre provides comprehensive and practical HR information, advice and resources.
The HR Resource Centre is updated regularly and includes numerous resources to
assist member businesses to deal with the HR implications of the COVID-19 crisis.
Developed by our WHS experts, the Health and Safety Resource Centre provides
cutting edge tools, information, advice and resources on topics such as safety
management, emergency management, risk management and mental health.
The Ai Group Economics Resource Centre features a range of regular reports,
factsheets and research notes about economics trends and issues that affect
Australian business and industry, including the highly regarded Economics Weekly,
and the Performance of Manufacturing, Services, Construction and Business Indexes.

Ai Group's Business Improvement & Growth Hub (BIG Hub) has over 200 Fact sheets,
self-assessments, checklists and company case studies to identify internal skill gaps,
improve company operations and strategy. It also hosts a consultant referral service
to help you find quality providers.
Additionally, Ai Group is a proud Delivery Partner of the Australian Government’s
Entrepreneurs’ Programme in Tasmania, Victoria and Western Australia. Ai Group’s
Entrepreneurs’ Programme Facilitators are working closely with businesses as they
seek to pivot towards new markets, product offerings and ways of doing business. If
you are ready to transform your business, the Entrepreneurs’ Programme and Ai
Group can help you take the next step. Contact Ai Group to be connected to an Ai
Group Entrepreneurs’ Programme Facilitator.

The Australian Industry Group • Business experiences in 2020 and outlook for 2021    6
2. The impact of COVID-19 on
Australian business

COVID-19 pandemic in Australia
The COVID-19 pandemic emerged in Wuhan, China, in December 2019 and began to
spread to other countries from January 2020. Australia experienced two ‘waves’ of
COVID-19 infections and control measures in 2020. The first wave (March to May) saw
small numbers of infections and strict activity restrictions in all states. In the second
wave (July to September), almost all COVID-19 infections were in Melbourne, Victoria
(chart 2.1), but international and interstate border closures, travel restrictions and
various other activity restrictions affected businesses and communities nationally.
          Chart 2.1: New COVID-19 cases per day in Australia, NSW and Vic

       Source: www.covid19data.com.au

The economic toll of COVID-19 has been heaviest and most visible in Australia’s labour
market. At its peak, the ABS estimate that 2.3 million people – 20% of Australia’s
workforce – were affected by job loss or reduced working hours and income between
March and May of 2020 due to COVID-19. A recovery in activity and employment was
evident from June but began later in Victoria due to the ‘second wave.’ As of mid-
November, ABS data on payroll jobs and wages (for all employees paid through the
ATO ‘single touch’ payroll system) confirm that employment is continuing to recover
nationwide. Compared to the pre-COVID-19 levels recorded on 14 March, however,
payroll jobs were still 2.9% lower (about 320,000 fewer jobs) and total wages paid were
3.9% lower. Job advertisements have also recovered, which augurs well for 2021.

The Australian Industry Group • Business experiences in 2020 and outlook for 2021      7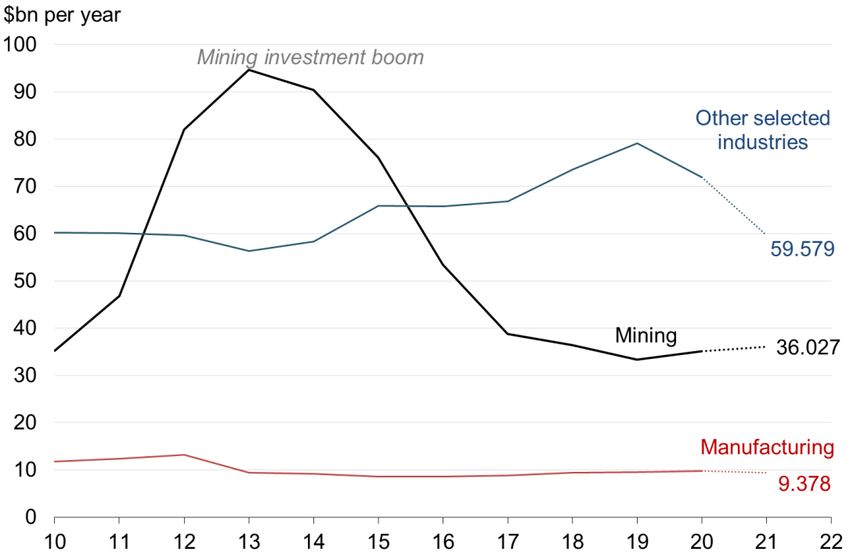
Impact of the COVID-19 pandemic on Australian business
Australian businesses reported a range of impacts upon their operations due to the
COVID-19 pandemic and the associated activity restrictions between March and
November 2020 (see Chart 2.2, Box 2.1 and Table 2.2).
The majority of businesses reported negative impacts as a result of COVID-19 in
each month from March to November. The total proportion of businesses reporting a
negative impact peaked close to 90% in April, fell to around 78% in June but then rose
to 87% in September due to the ‘second wave’ of infections. In November, 84% of
businesses were still reporting negative impacts on their business as a result of
COVID-19. The most frequently reported business impact in every month of 2020 was
reduced customer demand, highlighting the ‘demand shock’ nature of this recession.
Top five negative impacts on business from COVID-19 in November 2020
1. Reduced customer demand 43% of businesses
2. Activity restrictions 22% of businesses
3. Disruption to supply 9% of businesses
4. Reduced productivity 7% of businesses
5. Increased costs 5% of businesses
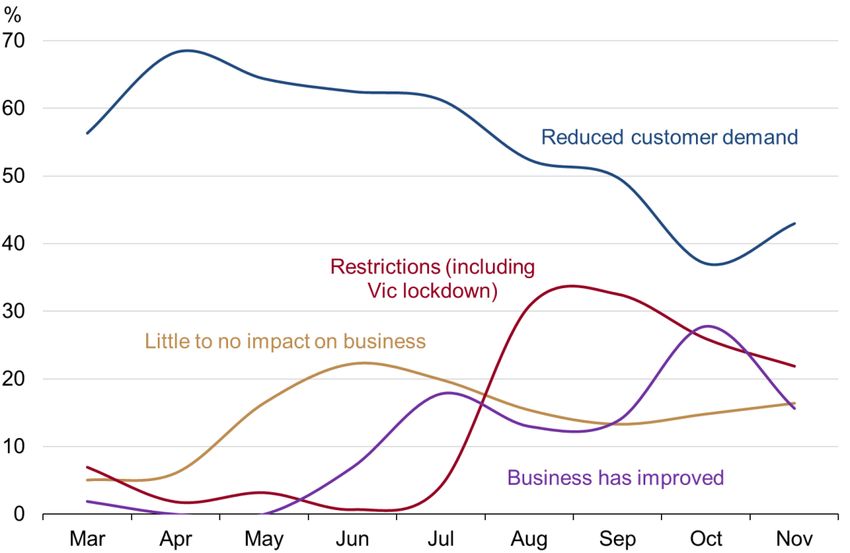
Chart 2.2: Impacts of COVID-19 on Australian businesses in 2020,
most frequent responses, March to November 2020
Source: Ai Group
The Australian Industry Group • Business experiences in 2020 and outlook for 2021 8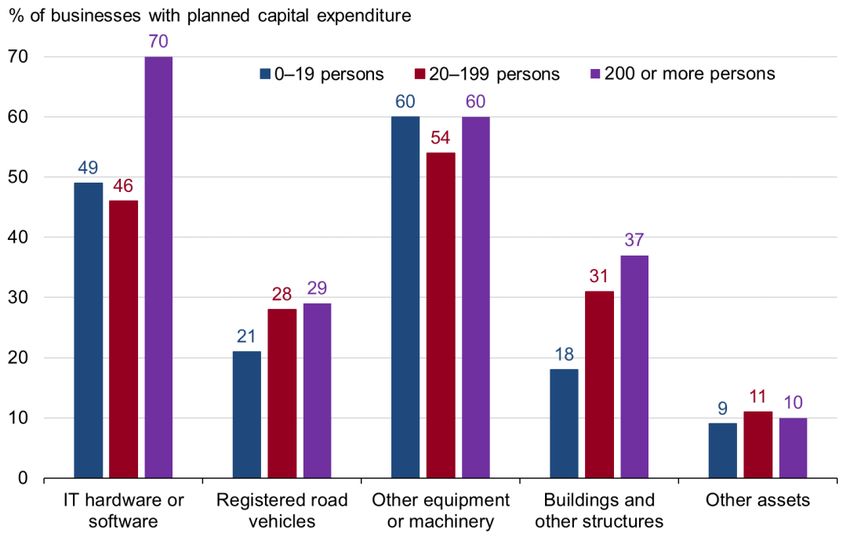
The most frequently reported negative impacts over the course of 2020 were:

•   In March and April, the most commonly reported impact on Australian businesses
    was overwhelmingly the sudden reduction in customer demand (56% and 68%
    of respondents in March and April, respectively). Sales and orders from local and
    overseas customers dropped as uncertainty about the pandemic and ongoing
    conditions took hold. Some respondents told us their sales increased due to
    consumer panic buying and business customers brought orders forward concerned
    about future supplies of stock. Respondents noted an increase in costs in March,
    which fell as a comment across June, July and August but picked up again in
    October and November.

•   Increased workloads were a large factor in the early stages as 25% of
    respondents reported increased cleaning and sanitising in March (13% in April).
    For 22% of businesses in March, the management workload grew as businesses
    moved people to work from home, developed new policies and procedures and
    provided unprecedented levels of support to their staff. Increased uncertainty had
    a major impact on 23% of businesses in March, as did the high levels of anxiety
    within their workforce; the announcement of the JobKeeper wage subsidy in April
    went some way to relieving some of these pressures.

•   May and June saw a reduction in adverse impacts for businesses, with an
    increasing number reported little to no impact over the middle of the year (16%
    May, 22% June, 20% July). For other respondents, reduced customer demand
    remained high (64% May, 63% June, 61% July). Restrictions started to ease in
    some locations resulting in an improvement in activity in June (7%) and July (18%).

•   In July, disruption to supplies re-emerged as a major factor impacting businesses
    and this was sustained across August, September and October.

•   From August, border restrictions, Victorian restrictions and Stage-4 lockdown in
    Melbourne resulted in a large constriction of trade, particularly across August,
    September and October. Restrictions on conditions, particularly regarding capacity
    restraints still inhibited businesses in November.

•   In October, there was a noticeable improvement as conditions changed for
    manufacturers in Victoria. Locations other than Melbourne saw a return to more
    ‘normal’ conditions, although the stage-4 lockdown continued to be a drag on
    demand for businesses across the country.

•   Reduced demand increased as an impact again in November even as activity
    restrictions reduced. The number of businesses saying there had been little to no
    impact in the month remained consistent, but those saying business had recently
    improved fell to 16% in November, down from 28% in October. This probably
    reflects the surge in pent-up demand that needed to be met in October as the
    second wave of restrictions ended, with this effect dissipating through November.

The Australian Industry Group • Business experiences in 2020 and outlook for 2021    9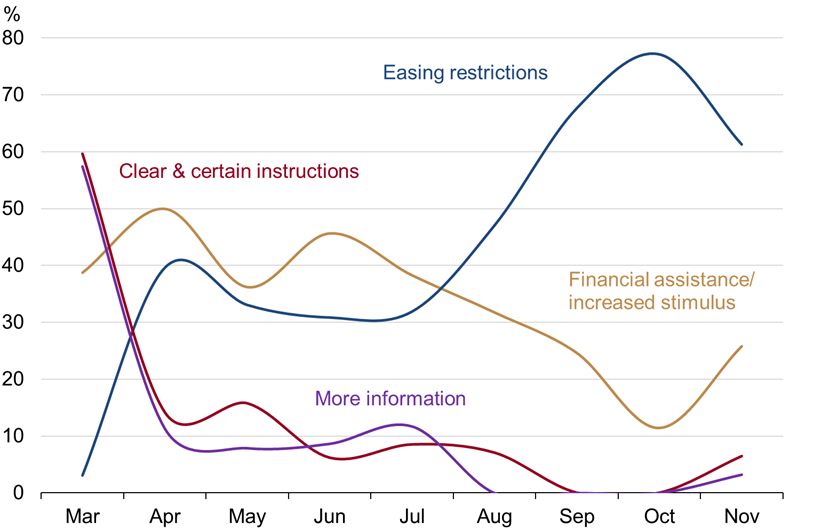
Box 2.1        How was 2020 for Australian business?
      Businesses started telling us about the impact of COVID-19 on their trade in
      February 2020. From October there was a clear indication that things had recovered
      somewhat, although not to pre-February levels.
      “Our customer base had reduced activity overseas due to COVID restrictions and
      downturns in their markets, some of our customers’ turnover declined 75%. Things
      seem to have picked up recently. For Q1 2020, revenue was down more than 50%
      compared to the same time last year.”

      “Covid-19 saw a 20% reduction in operating hours both in production and office and
      sales. This has now almost reversed itself with 90% of employees back to full time
      work.”

      “Major lock-down issues in our primary states of Victoria and NSW, not being able
      to access our client base and now the global vehicle manufacturers shutting down
      for the second time this year is creating delays in supplies and impacting our ability
      to generate all of our revenue streams.”
      “The reduction of hours to 80% of our workforce has increased our lead times and
      we’re unable to deliver on time to customers’ expectations.”

      “The inability to travel between Australian states increased costs and delayed
      projects. In some cases, we had to engage local contractors which are an additional
      cost, and in other cases had to defer project deadlines to work around border
      restrictions. In some instances, we needed video conferencing which required
      investment in IT hardware and subscription services. COVID driven demand for sea-
      freight has caused extensive delays for inbound deliveries, creating higher costs
      and lost revenue opportunities. We have had to absorb costs, reduce our profit
      expectations and have forgone sales revenue from missed opportunities.”
      “Covid-19 has limited movement between operating sites and challenged us with
      the careful management of increased employee mental health issues, but beyond
      that it has had little effect on our business.”
      “Border closures had significant mental health impact on team members, we paid
      for an additional office on the other side of the border, but this was unsustainable.
      Travel times were sometimes very excessive compared to usual arrangements. It
      was a different set of rules for staff on either side of border in their ability to engage
      within their communities.”
      “There was a huge reduction in our bricks & mortar retail business and a big
      increase online.”

The Australian Industry Group • Business experiences in 2020 and outlook for 2021          10
Table 2.1: Impacts of COVID-19 on businesses in 2020
Mar Apr May Jun Jul Aug Sep Oct Nov
% of businesses that reported
each impact in each month % % % % % % % % %
(multiple per business possible)
Negative impacts
Reduced customer demand 56 68 64 63 61 52 50 37 43
Activity restrictions 7 2 3 1 4 31 33 26 22
Disruption to supply 16 7 5 7 10 12 10 15 9
Reduced productivity 4 7 9 1 3 4 3 10 7
Increased costs 6 6 4 1 2 2 2 6 5
Increased workload -
22 4 3 0 5 6 8 2 2
management
Increased workload - cleaning 25 13 9 6 5 6 4 3 2
Increased uncertainty 23 2 3 1 3 8 3 4 1
Neutral or positive impacts
Little to no impact on business 5 6 16 22 20 15 13 15 16
Increased customer demand 11 7 6 1 1 0 4 3 6
Business has recently improved 2 0 0 7 18 13 14 28 16
The Australian Industry Group • Business experiences in 2020 and outlook for 2021 11Impact of the COVID-19 pandemic on Australian industries
Australia’s COVID-19 recession in 2020 has been Australia’s first recession in almost
30 years. Compared to past Australian recessions, this one has been deep but also
very rapid. Australian GDP dipped in Q1 due to bushfires, drought and the first impacts
of COVID-19 globally, and then plunged by a record 7.0% q/q in Q2 as the COVID-19
pandemic arrived in Australia. By the end of Q3 however, Australian GDP had already
recovered by 3.3% q/q, equal to about 40% of the GDP that was lost in the first half of
2020. Even after this rapid recovery, total GDP in Q3 was still 3.8% lower than one
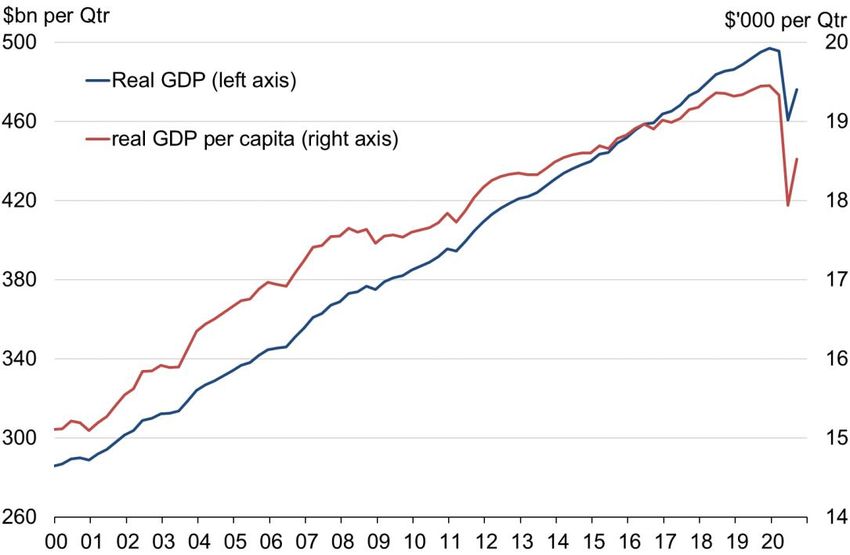
year earlier, with real GDP at the same level as it had been in March 2018. In per capita
terms, GDP was about the same level as in June 2014 (chart 2.3).
As of December 2020, local COVID-19 activity and travel restrictions had eased
considerably and Australia’s recovery was well underway, supported by a fast recovery
in consumer spending and an understandable jump in government spending.
Chart 2.3: real GDP* and real GDP* per capita, 2000 to 2020
* seasonally adjusted and inflation adjusted. Source: ABS, National Accounts, Sep 2020.
Across industries, the National Accounts indicate that all major industries recovered
some output in Q3 except for agriculture (-0.6% q/q) and mining (-1.7% q/q). However,
14 of the 19 major industry groups were still producing less in Q3 2020 than they did
in Q3 of 2019 (chart 2.4). In Q3 the largest recoveries were in the services industries
that suffered the largest losses in Q2. Hospitality (food & accommodation services)
output was up by 41% q/q and arts and recreation services output was up by 14.7%
q/q, although both industries remain down significantly from 2019.
Manufacturing suffered smaller falls in output and employment in Q2 than many other
Australian industries. Total manufacturing output recovered by 4.0% q/q in Q3, with
almost all the growth occurring in food and beverages production (+12.6% q/q and
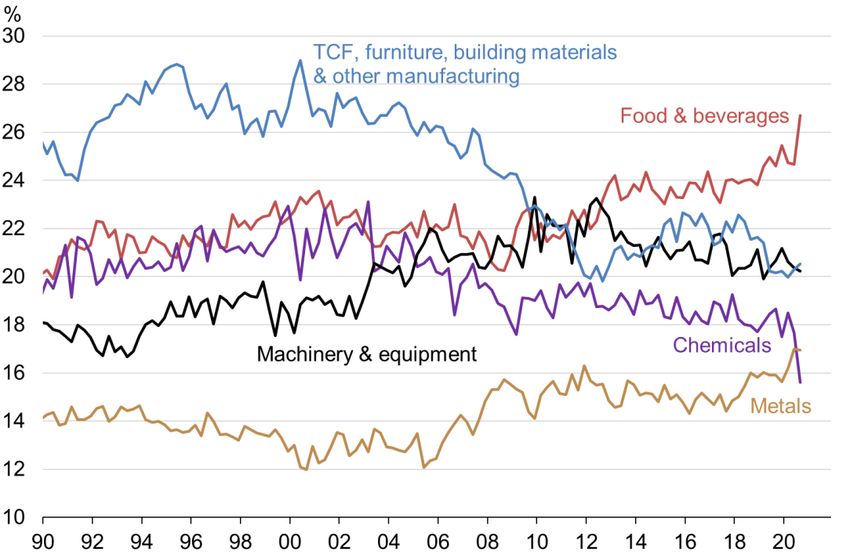
The Australian Industry Group • Business experiences in 2020 and outlook for 2021 12accounting for 26.7% of all manufacturing output) (chart 2.5). Metal products,
machinery and equipment and ‘other manufacturing’ also recovered in Q3.
Chart 2.4: Industry output and growth, Q3 2020
Source: ABS, National Accounts, Sep 2020.
Chart 2.5: Manufacturing sectors, share of manufacturing output,
1990 to Q3 2020
Source: ABS, National Accounts, Sep 2020.
The Australian Industry Group • Business experiences in 2020 and outlook for 2021 13Ai Group’s Australian Performance of Manufacturing Index (PMI ®), Performance of
Services Index (PSI®), and Performance of Construction Index (PCI®) collectively
indicated an ongoing recovery in local business activity as of November 2020, across
most but not all major industries (Chart 2.6 and Table 2.2).
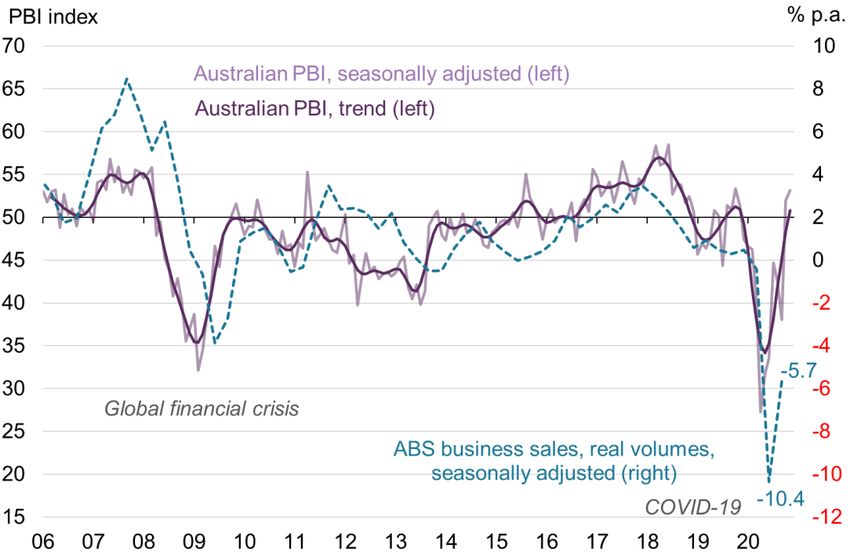
The Ai Group Australian Performance of Business Index (PBI, a weighted composite
of the PMI®, PSI® and PCI®) turned positive in October and November for the first time
since November 2019. This indicated that in Q4, non-mining businesses were, on
average, experiencing positive conditions again in Australia.
Chart 2.6: Ai Group Australian PBI* and ABS real business sales,
2006 to Nov 2020
* weighted composite of Ai Group Australian PMI, PSI and PCI. Source: Ai Group.
Across the industries covered by Ai Group’s monthly business surveys (Table 2.2):
• Manufacturing industries fared better than most industries during 2020. In March,
there was a huge surge in demand for manufactured food, groceries and personal
care items, as shoppers stock up on processed food, toilet paper, cleaning products
and other household essentials. Bright spots persisted in food-related
manufacturing, distribution and retailing.
• Construction was experiencing a cyclical downturn before the COVID-19 pandemic.
This downturn was further exacerbated throughout the middle of 2020 by increased
uncertainty and activity restrictions. As of November, housebuilders noted the
success of government grants plus low interest rates in supporting demand for new
houses and renovations. Builders in commercial and engineering construction said
activity and forward orders are returning to a more ‘normal’ pace in Q4 2020. In
contrast, new apartment building activity slowed further due to reduced demand
from developers and investors.
The Australian Industry Group • Business experiences in 2020 and outlook for 2021 14This experience is very different to previous Australian recessions in the 1980s and
1990s, due to the unusual circumstances of the current COVID-19 recession. In
previous Australian recessions, business conditions, activity and employment fell
hardest in industrial sectors such as manufacturing and construction.
In contrast, the COVID-19 recession of 2020 has fallen hardest in customer-facing
service industries such as travel, hospitality, retail and the arts (Table 2.2). These
industries faced the earliest and strictest activity restrictions and enforced business
closures. Customer density limits and international travel restrictions will continue well
into 2021. Longer-term changes in consumer caution, sentiment and purchasing
preferences are also likely, so weakness in these sectors could continue to play out.
Table 2.2: Australian industry conditions in 2020
35 50 65
Contracting Stable Expanding
Industry (trend) Jan Feb Mar Apr May Jun Jul Aug Sep Oct Nov
Manufacturing (PMI, trend) 46.5 45.1 44.6 44.9 45.8 47.2 48.9 50.4 51.6 52.7 53.0
Manufacturing sectors
Food & beverage products 57.6 55.8 54.9 54.9 55.7 57.0 58.0 58.0 57.2 55.9 53.5
Machinery & equipment 46.4 44.6 44.4 45.6 47.5 49.8 51.9 53.3 54.2 55.1 55.2
Metal products 38.5 36.1 35.3 36.3 38.6 41.4 44.0 46.2 48.1 49.8 51.3
Chemical & rubber products 48.3 48.6 49.0 48.6 47.6 46.5 46.2 47.5 50.0 52.8 55.6
Building materials, furniture, other 37.5 37.0 37.4 38.0 38.5 39.1 40.2 41.7 43.3 44.9 45.5
TCF, paper, printing products 37.5 34.3 32.7 33.3 35.9 40.3 45.5 50.4 54.1 57.6 59.9
Construction (PCI, trend) 39.4 36.6 33.4 30.8 29.8 31.0 34.6 39.3 43.7 47.9 51.0
Construction sectors
Housing 50.3 45.5 39.5 34.0 31.4 33.1 38.8 46.5 53.5 60.0 64.6
Apartments 33.2 29.9 27.2 25.7 26.4 28.9 32.5 36.1 39.0 41.6 43.0
Commercial construction 36.8 32.0 27.4 24.6 24.2 26.8 31.6 37.0 41.7 45.7 48.5
Engineering construction 37.4 37.1 35.9 33.9 31.8 30.9 32.1 34.9 38.1 41.7 45.0
Service businesses (PSI, trend) 46.8 42.0 37.6 34.6 33.4 34.4 37.2 40.9 44.3 47.6 50.2
Business services sectors
Business & property 44.6 41.9 39.0 36.3 34.6 34.3 35.8 38.6 41.7 44.7 47.5
Logistics 47.6 43.0 38.4 35.5 35.0 37.0 40.8 45.0 48.7 52.3 55.3
Finance & insurance 54.2 46.7 39.5 33.1 29.4 30.0 34.3 40.1 45.7 50.9 54.6
Consumer services sectors
Retail trade & hospitality 42.6 36.8 33.5 33.3 35.5 38.3 40.5 42.1 42.8 43.4 42.9
Health, welfare & education 43.9 41.6 39.8 38.0 35.6 34.1 34.5 36.7 40.1 44.3 48.2
Recreation, personal & other 54.1 48.8 42.6 37.5 35.4 36.7 41.1 46.1 49.9 52.6 55.3
All Businesses (PBI, seas. adj.) 46.6 46.3 39.8 27.2 31.8 33.6 44.7 42.6 38.0 52.0 53.1
All Businesses (PBI, trend) 45.9 41.6 37.8 35.1 34.2 35.3 38.1 41.8 45.2 48.3 50.8
Source: Ai Group.
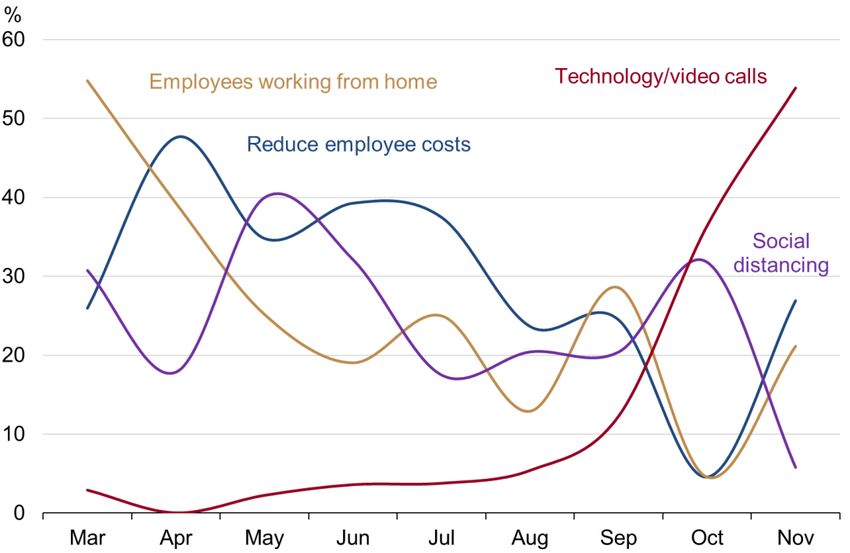
The Australian Industry Group • Business experiences in 2020 and outlook for 2021 153. Business responses to COVID-19 and activity restrictions in 2020 Businesses have responded to the COVID-19 global pandemic with a range of strategies. In March, working from home for some or all staff was implemented as an initial response by 55% of businesses reporting to Ai Group. This reflected the strong focus on health and safety in the first phase of the pandemic. This was accompanied by about a third of respondents saying they had made changes to accommodate social distancing, especially for staff that could not work from home. By April, cash flow issues were emerging. The most common responses were to reduce employee costs by reducing work hours or reducing staff levels. Throughout this pandemic reducing employee hours has been preferred as a strategy over reducing employee numbers. Throughout May to July, most states started easing activity restrictions. More businesses re-opened and made changes to accommodate social distancing. Businesses made changes to their processes and how their shifts were organised to abide by social distancing rules. During this period, businesses also highlighted the importance of JobKeeper in helping them keep their staff on the payroll. Throughout August and September, staff working from home continued to be a priority for businesses, with the Victorian Government requiring all office staff to work from home. More businesses adopted video conferencing and increased their usage of technology. It appears many businesses will replace at least parts of their business travel for video conferencing after the pandemic. Top five business responses to COVID-19 that were introduced in November 2020 1. Increase use of technology/video calls 54% of businesses 2. Reduce employee costs 27% of businesses 3. Staff work from home 21% of businesses 4. Change business strategy 8% of businesses 5. Change to accommodate social distancing 6% of businesses The Australian Industry Group • Business experiences in 2020 and outlook for 2021 16
Chart 3.1: Business responses to COVID-19, most frequent responses
               introduced in each month, March to November 2020

       Source: Ai Group.

The Australian Industry Group • Business experiences in 2020 and outlook for 2021   17
Box 3.1 Positive responses to COVID-19
“Our investments in remote working technology and ‘flexible first’ workplace
culture allowed for a successful and seamless transition to a working from home
model and one that we will continue to adopt on return. Our VIC offices will
continue to work from home in line with Government advice. All international air
travel and all domestic air travel has been suspended. We're scheduling phone or
video meetings wherever possible, the ‘new normal’ for Australian business.”
“We have increased the frequency and intensity of cleaning at our assets and are
actively promoting social distancing and personal hygiene for our staff, customers
and partners.”
“Most of us are working from home. It's been great and not many want to go back
into the workplace but are happy to stay working from home.”
“We moved the staff we could to WFH, we provided alternate services to
customers and we're slowly reopening services as restrictions ease.”
“We have operated under a COVID safe plan with increased hygiene, as well as
office and plant restrictions for visitors. The cost of doing this has not been
significant but it has impacted new business discussions that are now conducted
on Zoom and other communication platforms.”
“Our entire team has worked remotely since March. Whilst this has presented
challenges in client engagement, we have adapted very well to using video
technology and we continue to move the business and the implementation of
these solutions forward.”
The Australian Industry Group • Business experiences in 2020 and outlook for 2021 18Table 3.1: Business responses to COVID-19 and activity restrictions in 2020
Mar Apr May Jun Jul Aug Sep Oct Nov
% of businesses that reported
introducing a response in each
% % % % % % % % %
month (multiple answers
possible for each business)
Reduce employee costs 26 48 35 39 38 24 24 5 27
Staff work at home 55 39 25 19 25 13 29 5 21
Increase use of
3 0 2 4 4 5 12 36 54
technology/video calls
Change business strategy 10 10 8 6 8 10 8 14 8
Change to accommodate
31 18 40 32 18 20 20 32 6
social distancing
Find new business/suppliers 0 1 2 0 3 1 2 0 4
Reduce costs other than
0 6 5 4 0 5 4 5 2
wages
Increase work hours or recruit
3 1 1 1 3 3 4 5 0
additional staff
Utilise JobKeeper 1 1 19 17 26 26 14 0 0
Increase business
4 1 1 1 0 1 0 0 0
innovation/investment
Source: Ai Group.
The Australian Industry Group • Business experiences in 2020 and outlook for 2021 194. Assistance to help businesses
manage their response to COVID-19
The assistance that businesses were seeking from Government and others as a result
of the COVID-19 pandemic shifted considerably during 2020. Businesses often
reported on their own plans for recovery in combination with requests for assistance
from Government and others. These reports indicate three distinct stages during 2020:
1. March to April. Needing more information along with clear & certain instructions.
At the start of the pandemic uncertainty was the greatest concern, with businesses
wanting clear & certain instructions and more information about safety and activity.
2. April to June. Needing financial assistance to ease cash flow pressures. By April
cash flow became a major business concern, with 50% of businesses responding to
this question saying they needed financial assistance. The Government announced
JobKeeper on 30 March. At its peak in Q3, JobKeeper was supporting an estimated
900,000 businesses and 3.5 million workers. RBA research suggests JobKeeper
reduced total employment losses by at least 700,000 people between April and July.
3. August to November. Easing restrictions. As strict activity limits were reimposed
in Victoria and interstate borders were closed, the most common priority stated by
businesses was to (safely) ease activity and site restrictions and to re-open state
borders.
Chart 4.1: Assistance to help businesses manage the response to COVID19,
March to November 2020
Source: Ai Group.
The Australian Industry Group • Business experiences in 2020 and outlook for 2021 20Table 4.2: Assistance to help businesses manage the response to COVID-19
What would assist your
Mar Apr May Jun Jul Aug Sep Oct Nov
business?
% of businesses asking for each
form of assistance in each month
% % % % % % % % %
(multiple answers possible for
each business)
Easing restrictions 3 40 33 31 32 47 68 77 61
Financial assistance/increased
39 50 36 46 38 32 25 11 26
stimulus
Clear certain instructions and
60 14 16 6 9 7 0 0 6
rules
Infrastructure investment /local
0 0 17 23 11 7 11 6 6
procurement
Increased demand for locally
0 0 0 0 4 8 6 0 6
made products
More information 57 11 8 9 12 0 0 0 3
Increased certainty 0 0 0 0 9 11 2 23 0
Assistance with employee
11 1 1 0 0 2 0 0 0
management
Improved access to PPE &
9 1 2 0 0 1 0 0 0
hygiene products
Assistance with domestic and
1 3 3 0 0 0 0 0 0
international freight
Source: Ai Group.
The Australian Industry Group • Business experiences in 2020 and outlook for 2021 215. What will businesses do in 2021?
From an initial crisis response in March when the potential effects of COVID-19 on the
workforce and the broader population were unknown, to the planning for 2021,
Australian businesses responded in a fast, responsible and capable manner. During
most months of 2020, some businesses told Ai Group that they would ‘wait and see’
what the outcomes after restrictions eased were, before adjusting their business plans.
In the early stages of the pandemic, businesses said they would continue to reduce
employee accrued leave and run-down inventory; reduce employee hours and
numbers as well as managing other costs. When business picked up after May, they
intended to employ new staff, increase investment, increase focus on marketing, take
advantage of the digital gains that have been made (e.g. online meetings instead of
travel) and the increased comfort level their customers now have with online platforms.
In November, Ai Group asked businesses what changes made during the pandemic
they will keep in 2021. In total:
• Around 20% of businesses said they do not yet know (7%) or they do not plan
to keep any of the changes they have made in response to COVID-19 in 2021
(14%). These businesses appear to be less affected by the COVID-19 activity
restrictions and/or they expect a vaccine to become widely available by mid-2021.
• Around 80% of businesses said they will keep at least some of the changes
they have introduced in 2020 in response to COVID-19, well into 2021.
The most common COVID-19 responses that businesses plan to keep in 2021 are:
1. Increasing marketing and communications to customers and suppliers.
2. Remaining COVID safe with a detailed plan for their worksites and workers.
3. Increasing their use of technology.
4. Maintain increased cleaning and social distancing in 2021.
All respondents that reported that they will maintain increased cleaning or social
distancing have COVID safe plans, but not all said they will keep their COVID-safe
plans once no longer required.
5. Maintain their increases in employees working from home, where possible.
Top three COVID-19 measures that businesses plan to keep 2021
1. Increase marketing and communication 26% of businesses
2. Keep additional cleaning (12%) and social distancing
24% of businesses
practices (12%), with COVID-safe plans
3. Maintain increased use of digital technology and/or
17% of businesses
reduced travel
The Australian Industry Group • Business experiences in 2020 and outlook for 2021 22Chart 5.1: What COVID-19 measures do businesses plan to keep or do in
2021? (as reported in November 2020)
The Australian Industry Group • Business experiences in 2020 and outlook for 2021 23Business investment intentions for 2020-21
Business investment is one of the key pathways to growth in productivity and incomes
across the economy. For that reason, it is closely monitored and supported by fiscal
and monetary policy.
Outside of the mining sector, business investment growth has been relatively weak in
Australia over the past decade. COVID-19 has exacerbated this problem; business
investment (as measured by the ABS in the National Accounts) fell by 3.0% q/q and
9.7% p.a. to Q3, including a drop of 3.2% q/q and 11.6% p.a. in spending on new
machinery and equipment.
Within individual industries, the quarterly ABS capital expenditure survey (CAPEX)
showed growth or at least some recovery in Q3 in a handful of industries including
utilities (+4.6% q/q), wholesale trade (+10.6% q/q and +5.8% p.a.), retail trade (+4.6%
q/q and +1.0% p.a.) and financial services (+3.7% q/q). It is not clear how much of
these increases in CAPEX were due to PPE and other equipment purchases required
by businesses in these consumer-oriented services industries, in order to respond to
the COVID-19 pandemic.
The Federal Government introduced a range of measures targeted specifically at
encouraging business investment over the course of 2020.
• In March, eligibility for instant asset write-off provisions for assets with a value of
less than $150,000 (previously $30,000) purchased before June 2020 was
extended to businesses with turnover of less than $500 million (up from $50 million)
and a 50% deduction in the year of purchase was allowed for the capital value of
all depreciable assets for similarly-sized businesses until 30 June 2022;
• In June, the instant asset write-off arrangements were extended to apply to assets
put in place before 31 December 2020; and,
• In the October Budget, full expensing in the year of purchase of eligible depreciable
assets put in place before the end of June 2022 was introduced for businesses in
groups with aggregated turnover of less than $5 billion. Eligibility for the immediate
expensing measure was subsequently extended by allowing an alternative test that
excluded from the $5 billion threshold income earned outside Australia for some
businesses.
All of these measures impact on the timing of deductions related to investment but not
on the total amount deducted nor on the rate at which tax is levied. Nevertheless, by
bringing forward deductions, the measures will increase the net present value of
investments undertaken by eligible businesses.
Further, these changes were complemented by a range of other policy measures
favourable to business investment including lower interest rates, greater credit
availability and business cash flow measures.
The Australian Industry Group • Business experiences in 2020 and outlook for 2021 24Prior to the 2020-21 Budget (released in October 2020), business investment
intentions for 2021 were still indicating that investment levels would improve from the
depths of 2020 but were likely to remain problematic. The Treasury noted that:
…The protracted period of weakness in business investment due to the
COVID-19 pandemic will lower growth in the capital stock and in turn labour
productivity and future productive capacity until there is a recovery in business
investment. This is partly offset by economic support measures that are expected
to increase business investment and in turn lead to higher labour productivity
growth than otherwise would have occurred.” (Federal Budget Papers, 2020-21)
Looking ahead, the latest quarterly ABS CAPEX survey (conducted over 8 weeks in
October and November) included the fourth estimate of business CAPEX for the 2020-
21 financial year. In nominal terms, businesses expected to spend a total of $104.9bn
in 2020-21. This is 6.3% higher than the previous estimate, but 10.1% lower than total
business CAPEX in 2019-20. When adjusted with average realisation ratios over the
past five years, this fourth estimate implies annual CAPEX of $110.2bn in 2020-21.
This would be 5.6% lower than actual total CAPEX in 2019-20.
Across the three major industry categories that are included in the ABS CAPEX survey:
• Mining expects to spend $36bn in 2020-21, including $25.9bn on buildings and
$10.1bn on equipment. This is 2.5% more than actual mining CAPEX in 2019-20
but is about the same after adjusting with a five-year average realisation ratio
(-0.4% p.a.). The mining industry has lowered its CAPEX plans for 2020-21 in each
of the four estimates reported this year (after adjusting for average realisation ratios
for each estimate).
• Manufacturing expects to spend $9.4bn in 2020-21, including $2.69bn on
buildings and $6.7bn on equipment. This is 3.7% less than actual manufacturing
CAPEX in 2019-20 but only 1.4% lower after adjusting with a five-year average
realisation ratio. The manufacturing industry has lowered its 2020-21 CAPEX plans
since April-May (after adjusting with average realisation ratios for each estimate).
This cut to CAPEX in 2021 will end the modest recovery in manufacturing CAPEX
over the past four years (1.5% growth or better in each year).
• Other industries that are included in the ABS CAPEX survey expect to spend
$59.5bn in 2020-21, including $31.2bn on buildings and $28.3bn on equipment.
This is 7.5% less than actual CAPEX by these industries in 2019-20, after adjusting
with a five-year average realisation ratio. These industries have, in aggregate,
raised their CAPEX plans for 2020-21 since July-August (after adjusting with five-
year average realisation ratios for each estimate). In raw terms, this fourth estimate
of CAPEX for ‘other industries’ is 14.1% higher than estimate 3 for 2020-21, which
is one of the largest quarterly upgrades ever recorded in this CAPEX survey. This
suggests better business confidence since the beginning of the pandemic, but it is
not yet buoyant enough to bring CAPEX back to pre-COVID-19 levels.
The Australian Industry Group • Business experiences in 2020 and outlook for 2021 25Chart 5.2: Nominal annual CAPEX estimates by industry, 2010 to 2021
Source: ABS, CAPEX, Sep 2020.
A separate ABS business survey (conducted by telephone from 4 to 11 November)
indicate that CAPEX spending in 2021 is likely to be concentrated in a relatively small
proportion of businesses. A large proportion (78%) of all businesses had no definite
CAPEX plans for the three months from November 2020, including 66% of medium-
sized businesses and 45% of large businesses. Just 11% of businesses planned to
‘spend more than usual’ on CAPEX in the three months from November (chart 5.3).
Chart 5.3: Plans for capital expenditure (CAPEX) by business over the three
months from November 2020
Source: ABS, Business Indicators, Business Impacts of COVID-19, November 2020.
The Australian Industry Group • Business experiences in 2020 and outlook for 2021 26The factors influencing business decisions to invest at the end of 2020 closely mirror
the impacts listed by businesses that reported their experiences to Ai Group (see
Chapter 2). 78% of businesses said they had no CAPEX plans for the closing months
of 2020 or that they did not know of their plans. For this group, ‘future economic
uncertainty’ is the most significant reason for their investment decisions (33% of these
businesses with no definite CAPEX plans).
Only 22% of businesses planned to invest during the three months from November of
2020. For this group, ‘demand for products or services’ from their own customers is a
significant reason for investing (49% of this group), followed by tax incentives (40% of
this group) and other government support measures (37% of this group). 32% of
businesses with CAPEX plans said they are doing so because they need to make
‘modifications in response to COVID-19’ and 21% said they are investing in response
to ‘domestic or international supply chain disruptions’ (Chart 5.4).
Among the 22% of businesses that planned to invest in the three months from
November 2020 (chart 5.5):
• 59% plan to invest in equipment and machinery other than IT equipment, including
60% of small businesses and 60% of large ones;
• 49% plan to invest in IT equipment, hardware or software, including 70% of large
businesses;
• 22% plan to buy one or more road vehicle, including 29% of large businesses; and
• 19% plan to invest in new buildings or other built structures, including 37% of large
businesses.
Chart 5.4: Factors that significantly influence business CAPEX plans for the
three months from November 2020
Source: ABS, Business Indicators, Business Impacts of COVID-19, November 2020.
The Australian Industry Group • Business experiences in 2020 and outlook for 2021 27Chart 5.5: Assets that businesses plan to purchase over the three months to
December 2020
Source: ABS, Business Indicators, Business Impacts of COVID-19, November 2020.
The Australian Industry Group • Business experiences in 2020 and outlook for 2021 286. Outlook for 2021 and beyond
The economic outlook for Australian business activity and investment in 2021 improved
considerably during Q3 and Q4 of 2020, as local outbreaks of COVID-19 subsided,
and economic growth recovered. As conditions improved, the Australian Treasury, the
RBA and the OECD revised up their recovery expectations for Australia in 2021.
In the all-important jobs market, Australia had already recovered the majority (but not
all) of jobs lost during the first wave of COVID19 by the end of 2020. The RBA therefore
expects Australia’s unemployment rate to have peaked at around 8% during Q4 of
2020, with a long period of relatively elevated unemployment to come (Table 6.1).
However, the OECD expects the economic fallout for Australia to continue well into
2021 due to the ongoing effects of international trade and border disruptions. It expects
Australia’s unemployment rate to peak at around 8% during 2021, as more people re-
enter the labour market from non-participation (that is, as discouraged jobseekers
become active in seeking work again), as government support programs taper off and
as some of the larger services industries continue to operate at reduced capacity
and/or reduced demand (Table 6.2).
Table 6.1. Australian economy: latest growth rates and RBA forecasts
Mar Jun Dec Jun Dec Jun Dec
% change over the year
2020 2020 2020 2021 2021 2022 2022
Gross domestic product (GDP) 1.4 -6.3 -4 6 5 4 4
Household consumption -0.2 -12.7 -5 13 6 4 4
Dwelling investment −9.7 -11.2 -12 0 5 1 2
Business investment −2.9 -5.5 -14 -9 4 9 9
Public demand 5.4 6.1 6 4 2 0 1
Gross national expenditure 0.2 -7.7 -3 8 4 4 3
Imports -7.7 -19.1 -10 15 6 6 6
Exports -2.0 -10.6 -12 3 6 5 7
Terms of trade −0.9 -1.8 3 -5 -7 -4 -2
Real household disposable income 2.4 5.8 2 -6 0 4 3
Unemployment rate
5.2 7.0 8.0 7.5 6.5 6.5 6.0
(quarter average, %)
Employment growth
1.8 -4.3 -3.0 3.0 2.0 2.0 2.0
(quarter average, % p.a.)
Wage price index (WPI) 2.1 1.8 1.25 1.00 1.25 1.5 1.75
Trimmed mean inflation (core) 1.8 1.2 1.0 1.25 1.0 1.25 1.5
Consumer price index (CPI) 2.2 -0.3 0.5 2.25 1.0 1.25 1.5
= actual. = forecast. RBA forecasts include the following technical assumptions: The cash rate
is assumed to remain at its current level (0.1%) and the 0.1% target for the 3‐year government bond
yield is assumed to remain consistent with current settings. Other technical assumptions include the
TWI at 60, A$ at US$0.70 and Brent crude oil price at US$42 per barrel.
Sources: ABS, various data; RBA ‘baseline scenario’ in Statement on Monetary Policy, 6 Nov 2020.
The Australian Industry Group • Business experiences in 2020 and outlook for 2021 29Table 6.2: Australian economy: OECD forecasts (Dec 2020)
% change over the year 2019a 2020f 2021f 2022f
Gross domestic product (real GDP) 1.8 -3.8 3.2 3.1
Household consumption 1.4 -7.5 4.7 4.2
Government consumption 5.4 7.8 4.7 0.9
Gross fixed capital formation (investment) -2.0 -9.7 2.1 3.8
Exports 3.2 -9.3 1.0 3.8
Imports -1.3 -12.7 6.6 5.7
Unemployment rate (% of labour force, year average) 5.2 6.8 7.9 7.4
Household savings ratio, net (% of disposable income) 3.7 14.4 11.7 8.9
Trimmed mean inflation (core) 1.6 1.1 1.3 1.6
Consumer price index (CPI) 1.6 0.7 1.6 1.6
a = actual. f = forecast. Source: OECD Economic Outlook Australia, Dec 2020.
The outlook remains especially unclear however, with the recovery from COVID-19
expected to be gradual and uneven, locally and globally. The OECD has identified the
following three immediate risks for the Australian economy in 2021:
1. the impact of global border closures and traveller caution regarding long-distance
travel on Australia’s services exports (i.e. international student and tourist arrivals);
2. the impact of global geopolitical tensions with China on all Australian exports; and
3. the unintended consequences of Australian government support measures being
reduced too early or too fast. “A risk is that the recovery in business and consumer
sentiment is hampered by a rise in business insolvencies and renewed labour
market weakness as policy support is scaled back in 2021 … Fiscal and monetary
support should be maintained until the economic recovery is firmly entrenched”.
In the longer-term, the COVID-19 pandemic will slow Australia’s population growth
rates for many years. Treasury estimates that border closures in 2020 have seen
Australia’s net overseas migration decline from around 154,000 persons in 2019-20 to
an outright fall (net emigration) of around 2,000 persons by the end of 2020-21. This is
the first time that Australia’s net overseas migration has turned negative since 1946.
As a result, Australia’s total population growth is expected to slow to just 0.2% in 2020-
21 and 0.4% in 2021-22, which will be the weakest growth in over a century (since
WW1). This will be due to an expected fall in the birth rate and an absolute decline in
net migration in these years. While migration will eventually return to the levels that
Australia is accustomed to, these ‘lost years’ of net migration – and the population
growth that they would have brought - will not be replaced.
Population growth is a major contributor to Australian economic growth and so this will
have a detrimental effect on Australia’s long-run potential growth rate (that is, the
maximum GDP growth that can be achieved with our resources). As a result, Treasury
has downgraded its estimates of Australia’s ‘potential GDP growth rate’ to less than
2% p.a. resulting from the pandemic (chart 6.1).
The Australian Industry Group • Business experiences in 2020 and outlook for 2021 30Chart 6.1: Treasury estimates of Australia’s ‘potential GDP’
(MYEFO and 2020-21 Budget)
Sources: ABS Australian National Accounts, and Treasury, Federal Budget 2020-21.
This sudden deceleration in population growth and potential GDP growth means that
any long-term recovery and improvement in economic activity and incomes will require:
• stronger productivity growth, supported by deeper business and community
investment in technology, equipment, trade, energy, workplaces; skills and
education; and
• stronger workforce participation, supported by industrial relations, education,
and taxation systems that enable Australians of all ages, abilities, skill levels and
backgrounds to participate more fully in education, work and business life.
The Australian Industry Group • Business experiences in 2020 and outlook for 2021 31Appendix: business responses by
month, industry and state
Ai Group received 1,899 detailed reports from businesses about their experience of
the COVID-19 pandemic from March to the end of November 2020. A small number of
businesses offered feedback in each of these months. Most businesses reported their
experiences in detail more than once across this period. Business responses were
received from all industries and states (Table 6.1).
These business reports are not intended to provide a representative sample of all
Australian businesses or all of the Australian economy. Instead, they illustrate the
concerns, issues and factors that businesses reported to Ai Group about the effects of
the COVID-19 pandemic on their business in each of these months.
The data for each month includes all reports received from the first day of the month
until the last, including reports added retrospectively.
Table 6.1: Business responses to Ai Group about COVID-19
Industry Mar Apr May Jun Jul Aug Sep Oct Nov Total
Business services 50 31 43 23 38 40 35 36 31 327
Consumer services 26 7 17 11 19 16 14 16 12 138
Manufacturing* 57 24 36 28 25 34 36 33 30 303
Manufacturing -
machinery & 24 29 40 30 37 37 39 27 32 295
equipment
Manufacturing - metal
28 29 54 49 33 38 40 30 22 323
products
Construction & mining
10 87 72 49 59 62 69 50 55 513
services
TOTAL 195 207 262 190 211 227 233 192 182 1899
NSW 63 57 92 58 67 71 72 61 62 603
VIC 78 67 83 57 75 83 89 65 63 660
QLD 37 37 36 34 28 31 34 20 23 280
Other states 17 46 51 41 41 42 38 46 34 356
TOTAL 195 207 262 190 211 227 233 192 182 1899
The Australian Industry Group • Business experiences in 2020 and outlook for 2021 32Contact Us
1300 55 66 77
aigroup.com.au
economics@aigroup.com.au
The Australian Industry Group • Business experiences in 2020 and outlook for 2021 33You can also read