SA Future Economy - COVID-19 and the labour market: Estimating the eff ects of South Africa's national lockdown - Johannesburg
←
→
Page content transcription
If your browser does not render page correctly, please read the page content below

SA Future Economy

COVID-19 and the labour market: Estimating the
effects of South Africa’s national lockdown)

Timothy Köhler | Haroon Bhorat | Robert Hill | Benjamin Stanwix
   | COVID-19 and the labour market: Estimating the effects of South Africa’s national lockdown
                                                                                                 Page 1
COVID-19 and the labour market: Estimating the effects of South Africa’s
                               national lockdown

          Timothy Köhler | Haroon Bhorat | Robert Hill | Benjamin Stanwix

              Development Policy Research Unit, School of Economics, University of Cape Town
                                                                               (February 2021)1
1. Introduction

South Africa has been one of the countries affected most adversely by the COVID-19 pandemic in
Africa. By the end of November 2020, South Africa accounted for the highest number of confirmed
cases per capita – with approximately 800 000 cumulative cases, representing over a third (36%)
of total cases on the continent. In response, like most governments around the world, South Africa
implemented a national lockdown to prepare the necessary health infrastructure as well as to delay
and minimise the spread of the virus. This initial lockdown, which began on 26 March 2020 and lasted
for five weeks, was relatively stringent by international standards (Bhorat et al. 2020; Gustafsson
2020), making no allowance for any non-essential activities outside the home. Following this, a
phased easing of restrictions was introduced in five levels, with the initial lockdown period classified
as level 5. Regulation under levels 4 (1 to 31 May) and 3 (1 June to 17 August) gradually permitted
specific categories of ‘non-essential’ work to resume. Estimates using pre-crisis data suggest that
just 40% of the employed were permitted to work under level 5, rising to 71% under level 3 (Francis,
Ramburuth-Hurt, and Valodia 2020).2

Although the pandemic continues to pose important risks to public health, South Africa’s lockdown
was always expected to lead to substantial short- and long-term economic costs. Official labour force
data shows that there were approximately 2.2 million fewer people employed in the second quarter
of 2020 relative to the first3 – essentially erasing the last 10 years of job growth in the economy. Only
a partial recovery can be observed in data from the third and fourth quarters of the year, with net
employment still down 1.4 million relative to pre-pandemic levels. Research conducted during the
lockdown suggests that job losses have been concentrated among a range of already vulnerable
groups, particularly individuals in the poorest households (Köhler and Bhorat 2020), less-skilled
and low-wage workers (Jain et al. 2020; Ranchhod and Daniels 2020), informal workers (Benhura
and Magejo 2020), those with transient employment or persistent non-employment histories (Espi,
Leibbrandt, and Ranchhod 2020), those living in poor urban communities (Visagie and Turok 2020),
and women – particularly the poorest (Hill and Köhler 2020; Casale and Posel 2020; Casale and
Shepherd 2020). Many of these findings are consistent with those observed in labour markets across
the world (International Labour Organization (ILO) 2020).

Despite the large amount of important work that has already been done to measure the various
socio-economic impacts of South Africa’s lockdown, many of these studies are largely descriptive
All comments and queries can be directed to haroon.bhorat@uct.ac.za
1

The assumptions to arrive at these estimates are discussed in detail in Francis et al. (2020).
2

A similar change in employment is observed if one alternatively uses year-on-year changes.
3

      Page 2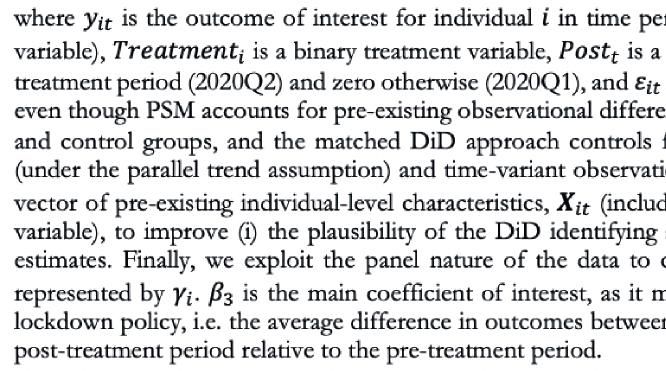
in nature. In this paper, we use representative labour force data – the Quarterly Labour Force
Survey (QLFS) – to provide both a detailed descriptive and econometric account of the effects
of the COVID-19 pandemic on employment. In terms of the econometric approach, we rely on
a quasi-experimental estimation technique by exploiting the variation in South Africa’s lockdown
policy to estimate the causal effect of the lockdown on the probability of employment for those not
permitted to work. We do so by making use of the coincidental timing of the national lockdown and
the data collection dates of the QLFS. Specifically, we employ a propensity score-matched (PSM)
difference-in-differences (DiD) approach to measure employment effects across observationally
comparable affected and unaffected workers. Simply put, we examine the effect of the lockdown
on the probability of employment amongst workers who were not permitted to work, relative to
those who were.

Several findings from our analysis stand out. In our descriptive analysis, we show that employment
loss was concentrated amongst the youth, those with lower levels of formal education, those
living in urban areas, the private sector, non-union members, the secondary sector (particularly
manufacturing and construction), and low- and semi-skilled workers. Notably, the lockdown
disproportionately affected informal-sector workers, who accounted for one in every two net jobs
lost, despite representing just 25% of pre-pandemic employment. This latter finding is consistent
with our quasi-experimental findings. We find that the national lockdown decreased the probability
of employment for those not permitted to work, by eight percentage points relative to the control
group – a finding that holds across several robustness tests. We find larger effects for more stringent
lockdown levels and distinct sub-groups – specifically own-account workers (most of whom are
in the informal sector) – who experienced a nearly three times larger negative employment effect
than the overall average treatment effect. This latter finding is indicative that working in the informal
sector seems to be a key determinant of not being employed during the lockdown period.

The rest of the paper is structured as follows. We begin by describing our data and identification
strategy in Section 2. In Section 3, we present descriptive statistics on labour market outcomes prior
to and during the first three months of South Africa’s national lockdown, including a disaggregated
assessment of differences between and within various groups of workers. In Section 4, we present
and discuss the main findings of our PSM-DiD models. Section 5 reflects on our results and
concludes.

2. Data and identification strategy

2.1. The Quarterly Labour Force Survey

The analysis in this paper uses individual-level survey data from Statistics South Africa’s (StatsSA)
Quarterly Labour Force Survey (QLFS). The QLFS is a cross-sectional, nationally representative
household survey, conducted every quarter since 2008, that contains detailed information on a
wide array of demographic and socioeconomic characteristics and labour market activities for
    | COVID-19 and the labour market: Estimating the effects of South Africa’s national lockdown
                                                                                                  Page 3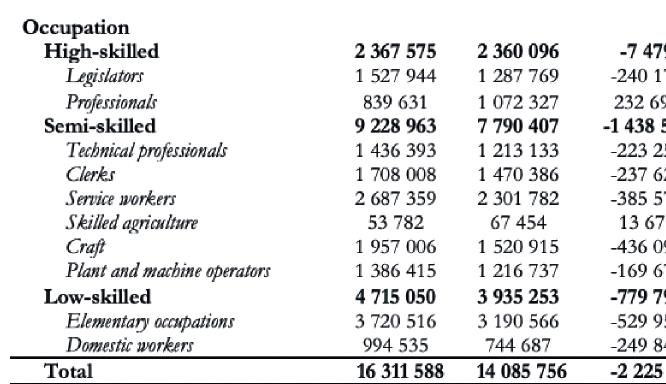
individuals aged 15 years and older. Although it is a cross-sectional dataset, the QLFS does have a
panel component, where 75% of the household sample is resurveyed in each quarter. This makes
it possible to follow the same dwelling unit for four consecutive quarters. However, there are a
number of important differences in the 2020 QLFS data that are worth noting in some detail here.

Prior to the COVID-19 pandemic in South Africa, the QLFS sample consisted of nearly 70 000
individuals, living in approximately 30 000 dwelling units, with data being collected via face-to-
face interviews. However, towards the end of March 2020, StatsSA suspended face-to-face data
collection as a result of COVID-19. Because of this, 621 sampled dwelling units (or 2% of the sample)
were not interviewed in the quarter 1 dataset. To adjust for this, StatsSA used the panel component
of the survey and made imputations where possible, using data from the previous quarter.

To continue providing labour market statistics for the second quarter of the year during the national
lockdown, StatsSA changed its data collection model from face-to-face interviews to computer-
assisted telephone interviewing (CATI). To facilitate this, and unlike in previous quarters, the sample
that was surveyed in 2020Q1 and for which StatsSA had contact numbers was surveyed again in
2020Q2. The result was that the 2020Q2 data included about 71% of the 2020Q1 sample because not
all dwelling units had contact numbers.4 The obvious concern here is that this will produce 2020Q2
estimates that suffer from selection bias; that is, it is likely that the underlying characteristics of
‘telephone’ and ‘non-telephone’ households are different. For example, we know from the 2020Q1
data that individuals in ‘non-telephone households’ were significantly more likely to be unemployed
relative to those in ‘telephone households’. To address this source of bias, StatsSA took a number
of steps to adjust the calibrated survey weights, using the 2020Q1 data and several bias-adjustment
factors, which we do not discuss here in detail (StatsSA, 2020a).

Table 1 below presents an overview of the sample sizes and weighted estimates of the South
African labour market for 2020Q1 and 2020Q2. We use the relevant bias-adjusted sampling
weights provided by StatsSA unless otherwise indicated, and restrict the sample to the working-
age population (those aged 15 to 64 years). Looking at the aggregated data, the bias-adjusted
2020Q2 weights appear to be appropriately computed. From an unweighted sample of 66 657
individuals, the weighted estimate of the South African population in 2020Q1 is 57.8 million. The
relevant 2020Q2 estimate is just under 58 million, despite the 2020Q2 sample consisting of nearly
20 000 fewer individuals. This is similar for the working-age population. In contrast, the weighted
estimates of specific labour market groups (such as the labour force and number of employed) are
statistically significantly different in size between quarters, which is what we would expect to see
as a result of the pandemic and associated government responses. However, it should be noted
that the sampling bias adjustments by StatsSA relied on observable characteristics, such as age,
gender, and race; however, respondents may still be unobservably different from non-respondents,
and hence possibly from the broader population. At the time of writing, an explicit external review
of the construction of these weights has yet to be conducted, and would require more information
4
 Additionally, amongst those who did have contact numbers, some contact numbers were found to be invalid or were not answered during data collection, and some households indicated
that they were no longer residing at the dwelling units they had occupied during 2020Q1. All of these were regarded as non-contact and were adjusted for during the weighting processes.

       Page 4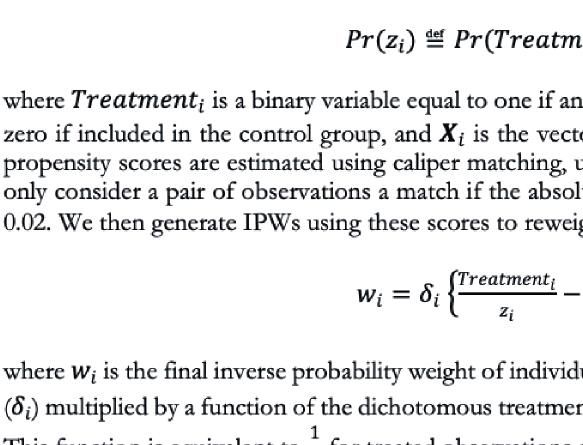
than is available in the public QLFS documentation.

Table 1: Sample sizes and weighted population estimates, by quarter

Source: QLFS 2020Q1 and 2020Q2 (StatsSA 2020a, 2020b). Authors’ own calculations.
Notes: [1] Relevant estimates weighted using sampling weights. [2] Labour market groups restricted
to the working age (15 to 64 years). [3] Official (narrow) definitions of unemployment used. [4]
* denotes statistical significance of a different 2020Q2 estimate relative to the relevant 2020Q1
estimate at the 95% confidence level.

2.2. Identification strategy: Propensity Score-Matched Difference-in-
Differences

Our aim in this paper is to estimate the causal effect of South Africa’s national lockdown on
employment probability, for which we require a suitable identification strategy. Using vocabulary from
the randomised evaluation literature, the ideal way to estimate a causal effect entails randomised
assignment of treatment (in this case, a national lockdown). Such randomisation would, subject to
several conditions, allow us to directly measure the effect of the policy in isolation. In the context
of South Africa’s national lockdown, however, treatment was not assigned randomly. Every worker
in the country was legally obligated to adhere to the lockdown regulations as they were specified
and adjusted over time. However, being permitted and able to continue working was dependent
on job type, which does provide a neat division of ‘treated’ and ‘untreated’ individuals over time.
As such, we estimate the causal effect of the lockdown by exploiting variation across industries
that were and were not permitted to work, as per the relevant Government Gazettes. We cross-
examine these lockdown regulations with the three-digit industry codes in the QLFS data to identify
individuals who were and were not permitted to work. To address selection bias and ensure that
employment probabilities are driven only by differences in treatment, we then employ a propensity
score matching (PSM) reweighting technique that seeks to provide a comparable set of individuals
across our treatment and control groups. We then use the timing of the national lockdown, and the
timing of the QLFS data collection interviews, to estimate difference-in-differences (DiD) models on
a matched panel sample. This approach is outlined in more detail below.

   | COVID-19 and the labour market: Estimating the effects of South Africa’s national lockdown
                                                                                                 Page 5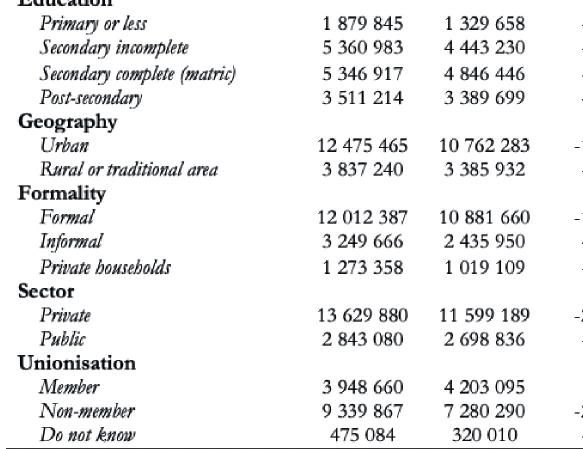
2.2.1. Difference-in-Differences
The DiD approach is a popular quasi-experimental technique for evaluating the effects of policies or
interventions that are implemented at a particular point in time. In this case, it exploits across-group
(treatment and control) and across-time (before and during the national lockdown) variation. We use
the 2020Q1 QLFS (January to March 2020) as our pre-treatment period and the 2020Q2 QLFS (April
to June 2020) as our post-treatment period.5 This is motivated by the observation that the lockdown
was implemented from the end of March 2020, coinciding with the change in QLFS quarters. We
thus can compare employment outcomes effectively for those not permitted to work versus those
permitted to work over the period. Specifically, our treatment group consists of all the individuals
in our sample who, as per legislation, were not permitted to work during the national lockdown.
We identify these individuals by cross-analysing over 150 three-digit industry codes in the QLFS
with the relevant Government Gazettes. Our control group thus consists of those who were legally
permitted to work. We additionally include in the control group anyone who was able to work due
to specific characteristics of their occupation and sector. This sub-category of workers would be
anyone working in the public sector and those, amongst the employed, who report working from
home.6,7 In our analysis to follow, we estimate several specifications using alternative control group
definitions (that is, ‘pure legal’ as well as ‘pure legal plus ability to work’ definitions) to examine the
sensitivity of our results.

Importantly, South Africa’s lockdown rules were not time-invariant. As noted above, from April
2020 the country adopted a five-stage risk-adjusted lockdown strategy, which outlined who was
permitted to work at each lockdown level. To account for this, we make use of QLFS 2020Q2
‘interview date’ data provided by StatsSA, which indicates whether an individual was surveyed in
April, May or June 2020. These periods fortunately coincide with changes in the national lockdown
levels, with Level 5 in place from 1 to 30 April, Level 4 from 1 to 31 May, and Level 3 from 1 to 30
June in the 2020Q2 data.8 For example, individuals were included in the treatment group if they
were not permitted to work under Level 5 regulations and they were interviewed in April during Level
5, and similarly for Levels 4 and 3. Regardless of permission to work as per legislation or lockdown
level, all individuals working in the public sector or working from home were assigned to our main
control group. In some instances, firms in a given industry were permitted to operate, but only at
partial capacity. However, we cannot identify which workers were permitted to work in these ‘limited
capacity industry’ situations. To address this, we assign relevant individuals to the control group
(i.e. ‘permitted to work’) if they were permitted to work in a ‘limited capacity industry’, in which the
legislated capacity was equal to or exceeded 50%. In our analysis, we use alternative thresholds to
examine the sensitivity of our results to this assumption.

To give an indication of the groups we identified in the data, Table 2 presents the sample sizes and
weighted population estimates of the treatment and control groups by quarter. The table is arranged
5
 It should be noted that our identification strategy cannot account for seasonality, which may be important to note considering that the South African economy went into recession prior to
the pandemic in 2020Q1.
6
 The relevant work-from-home variable was included as an additional variable in the 2020Q2 QLFS as part of a special COVID-19 module and was only asked of the employed. We exploit
the panel nature of the 2020Q1 and 2020Q2 QLFS datasets to impute responses in 2020Q1 based on individuals’ 2020Q2 responses to this question.
7
 We include the unemployed who have worked before in the sample and use the relevant three-digit previous industry variable to assign them to treatment and control groups.
8
 We cannot account for any changes in legislature within lockdown levels, given that the frequency of the interview date data is monthly.

       Page 6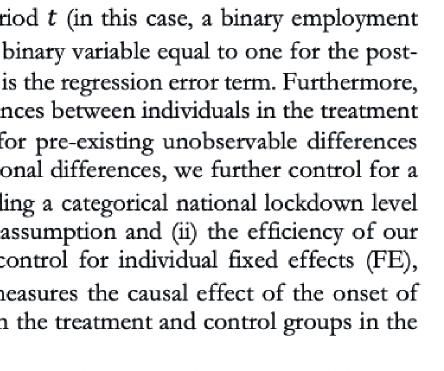
according to our alternative treatment and control group definitions. As discussed above, our
treatment group consistently consists of individuals who were legally not permitted to work during
a given lockdown level when they were interviewed. Our main control group (Group 3) consists of
those who were permitted to work during a given lockdown level when they were interviewed, as
well as anyone able to work (those working in the public sector or from home). The first alternative
control group consists solely of those who were legally permitted to work (Group 1), whereas the
second consists of those who were legally permitted to work or work in the public sector (Group 2).

Within each period it is clear that more individuals are assigned to the control group as the criteria
expand. For instance, when legislated permission to work is the only treatment criterion, our control
group in 2020Q1 consisted of about 10 000 individuals. Including those in the public sector in the
control group increases this sample to over 11 000. Following the inclusion of those who report
working from home, this sample further increases to just under 12 000. The size of the 2020Q2
samples are expectedly smaller than the 2020Q1 samples due to the changes in the QLFS sample
discussed above, where employment decreased dramatically.

Table 2: Sample sizes and weighted population estimates of treatment groups, by period

Source: QLFS 2020Q1 and 2020Q2 (StatsSA 2020a, 2020b). Authors’ own calculations.
Notes: [1] Relevant estimates weighted using sampling weights.

Based on the PSM reweighting approach discussed below, our DiD model is estimated according
to the following specification using ordinary least squares (OLS):

    | COVID-19 and the labour market: Estimating the effects of South Africa’s national lockdown
                                                                                                  Page 7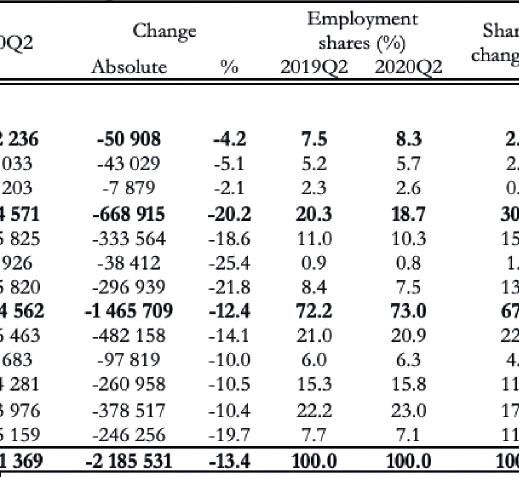
2.2.2. Propensity Score Matching
Out approach above measures differences in labour market outcomes between individuals who
were and were not permitted to work, but these may not necessarily be explained by the treatment
alone. Individuals in these two groups may differ by other characteristics, which may affect the
employment outcomes we are trying to identify. To address such selection bias we use PSM, which
seeks to identify similar individuals across treatment and control groups. Put differently, PSM is a
method to ensure balance in a set of common observable characteristics across treatment and
control groups in the pre-treatment period. The idea is to compare individuals who, conditional on
a set of observables, have very similar probabilities of being categorised in the treatment group (i.e.
propensity scores), even though those individuals differ with regard to actual treatment status. If two
individuals have the same propensity scores conditional on a vector of observable covariates, but one
is in the treatment group and one is not, then the two individuals are observationally exchangeable
and differences in their observed outcomes of interest are attributable to differences in treatment.9
Additional technical details regarding our use of PSM are in the Appendix.

3. Descriptive analysis

3.1.        Aggregate shifts in key labour market indicators
In Figure 1 we present the aggregate trends in key labour market indicators in South Africa for recent
years, supplemented by Table 3, which estimates even more recent annual and quarterly changes.
Expectedly, the effects of the pandemic have led to a substantial reduction in the number of people
who are employed in the country. Perhaps less expectedly, this was coupled with a decrease in the
number of official (searching) unemployed individuals, and an even larger increase in the number
of economically inactive individuals. These shifts can to a large extent be explained by the nature
of lockdown policy, which restricted the ability of people to work and to search for work. Relative
to 2020Q1, there were more than 2.2 million less employed people in the labour market in 2020Q2
– a 14% decrease, which is equivalent to employment levels between 2008 and 2012. The drop
in the employment rate can be summarised as follows: for every 100 people in the working-age
population, 42.1 were employed in 2020Q1, in contrast to 36.3 in 2020Q2.

9
 Assuming the conditional independence assumption (CIA) holds; that is, treatment (legislature not permitting work) conditional on the propensity score is independent of potential
outcomes, or is “as good as random”.

       Page 8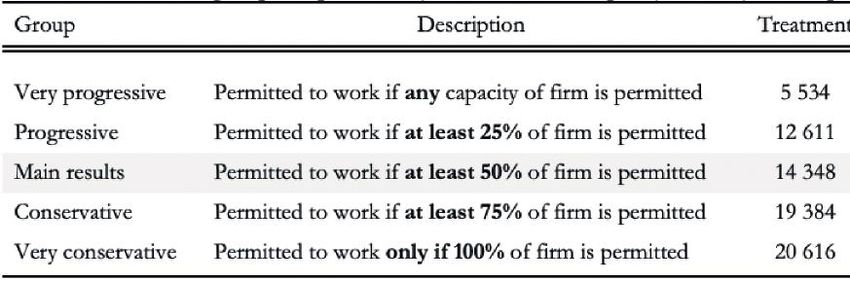
Figure 1: Trends in key labour market indicators in South Africa, 2018Q1 to 2020Q2
Source: QLFS 2018Q1 to 2020Q2 (StatsSA 2018, 2019, 2020a, 2020b). Authors’ own calculations.
Notes: [1] All estimates weighted using relevant sampling weights. [2] Official (narrow) definition of
unemployment used throughout.

Importantly, this substantial decrease in employment was coupled with more than 5 million more
economically inactive people – an increase of more than 33%. This latter group are not classified
amongst the discouraged unemployed because, when asked why they were not looking for work,
individuals in this group responded with reasons ‘Other’ than discouragement. This reason can
be attributed to the national lockdown policy, which restricted any activity deemed ‘non-essential’
outside the home. Indeed, this explains the changes in unemployment and, if observed alone, the
misleading decrease in the official unemployment rate – a simple definitional consequence of so
many people becoming economically inactive. Because individuals were not permitted to search
for work, the number of official (searching) unemployed individuals dropped by nearly 40%, from 7
million to 4.3 million. Coupled with the reduction in the labour force from reduced total employment
and searching unemployed, the official unemployment rate decreased from 30.1% to 23.3% – the
lowest recorded since the start of the QLFS in 2008. These unusual changes in unemployment and
inactivity have been observed in labour markets across the world (ILO 2020), but must be accepted
as nothing more than a statistical anomaly brought about by the inability of the unemployed to
search for jobs.

Table 3: Changes in key labour market indicators in South Africa

Source: QLFS 2019Q2, 2020Q1, and 2020Q2 (StatsSA 2019, 2020a, 2020b). Authors’ own
calculations.
Notes: [1] Sample restricted to working-age population (15 to 64 years). [2] All estimates weighted
using relevant sampling weights.

    | COVID-19 and the labour market: Estimating the effects of South Africa’s national lockdown
                                                                                                  Page 9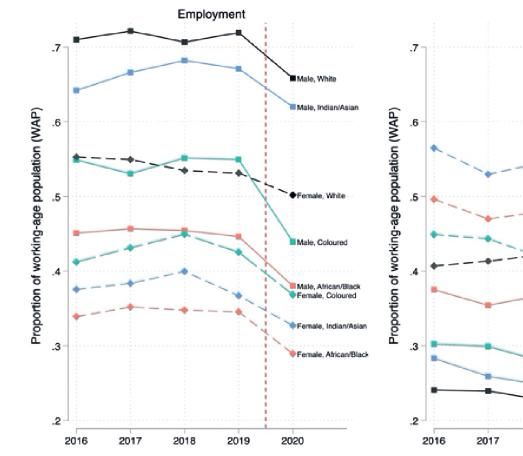
In addition to these cross-sectional trends, we can use the panel nature of the QLFS 2020Q1 and
2020Q2 data to measure transitions between different labour market states for a more accurate
sense of the quarter-on-quarter shifts taking place. Table 4, below, shows that nearly one in every four
(22.05%) of those who were employed in 2020Q1 were no longer employed in the following quarter,
with most (16.14%) becoming economically inactive. Importantly, just under 6% of the previously
employed reported looking for work in the next quarter. Also, more than half (55%) of the searching
unemployed in 2020Q1 became inactive the next quarter, whereas only a third (34%) continued
searching for work. The vast majority (80%) of those who were economically inactive in 2020Q1
remained inactive in 2020Q2. Again, the substantial increase in the number of individuals who
became inactive for reasons categorised as ‘Other’ is evident here. This is a notable characteristic
of the lockdown: the policy induced an inability to engage in the labour market, either due to job loss
or to the implicit prohibition of job search for both first-time entrants and long-term job-seekers.

Table 4: Transition matrix of conventional labour market statuses, 2020Q1 to 2020Q2

Source: QLFS 2020Q1 and 2020Q2 (StatsSA 2020a, 2020b). Authors’ own calculations.
Notes: [1] Sample restricted to working-age population (15 to 64 years). [2] Estimates weighted
using 2020Q2 bias-adjusted sampling weights.

Our descriptive analysis here focuses
largely on the extensive margin. However,
in addition to changes in employment
status, the pandemic has resulted in
significant changes in labour market
outcomes, even amongst those who
managed to retain their employment; that
is, changes in the intensive margin. In
particular, we observe a sharp reduction
in working hours. Figure 2 presents the
distribution of weekly working hours by
quarter. The shapes of the distributions are clearly dissimilar, with a distributional shift downward
and to the left, with the most notable changes at the bottom and in the middle of the distribution.

Figure 2: Distribution of weekly working hours, by quarter

  Page 10
Source: QLFS 2020Q1 and 2020Q2 (StatsSA 2020a, 2020b). Authors’ own calculations.
Notes: [1] Sample restricted to working-age population (15 to 64 years). [2] All estimates weighted
using relevant sampling weights. [3] Epanechnikov kernels estimated using a bandwidth of 2. [4]
Weekly working hours computed as the sum of actual daily working hours for Monday to Sunday in
the reference week.

Only 1.5% of workers reported working zero hours per week in 2020Q1, but this jumps to 16%
in the next quarter after the lockdown was introduced. This represents an increase from 250 000
workers to 2.2 million workers. Importantly, the data suggests that this increase was driven mostly
by reductions amongst those who previously worked 40 and 45 hours per week. Overall, through
examining changes in the aggregation of working hours amongst the employed, the South African
labour market lost approximately 200 million working hours from 2020Q1 to 2020Q2, equivalent to
over 4.4 million weekly working hour jobs. Another notable change in labour market outcomes on the
intensive margin relates to changes in the wages of those who remained employed. Unfortunately,
due to data unavailability we are unable to conduct such an analysis here.

3.2.      Variation in labour market outcomes within and between groups

The observed changes in aggregate labour market outcomes above are important to note, but they
also hide substantial underlying variation, both between and within various groups of individuals.
Figure 3 presents trends in employment and inactivity between individuals grouped by sex and
race. Clearly every group experienced a substantially lower level of employment, and A higher level
of inactivity, in 2020Q2 relative to all previous years. The extent of these changes, however, vary
considerably. In relative terms, self-reported Coloured men experienced the largest reduction in
employment rates (20%), followed by African/Black women (16%) and African/Black men (15%).
In absolute terms, nearly 80% of employment loss in 2020Q2 was accounted for by African/Black
individuals – this is discussed in more detail later. Interestingly, with the exception of Coloured men,
the ordinal rankings of these employment rates prior to 2020Q2 remained unchanged in 2020Q2.
Amongst the working-age population (WAP), White men (African/Black women) were consistently
more (less) likely to be employed relative to every other group.

       | COVID-19 and the labour market: Estimating the effects of South Africa’s national lockdown
                                                                                                     Page 11
Figure 3: Trends in employment and inactivity, by sex and race, 2016Q2 to 2020Q2 Source: QLFS 2016Q2, 2017Q2, 2018Q2, 2019Q2, and 2020Q2 (StatsSA 2016, 2017, 2018, 2019, 2020a, 2020b). Authors’ own calculations. Notes: [1] Sample restricted to working-age population (15 to 64 years). [2] Quarter 2 of each year used to control for seasonality. Considering inactivity, every group exhibited higher levels in 2020Q2 relative to previous years. Again, Coloured men experienced the largest increase, from 29.5% of the group’s WAP to 44.8% (representing a 52% increase). This increase in inactivity is followed by the 39% increase among African/Black men, whereas Indian/Asian and White women experienced the smallest increases, of 5% and 13%, respectively. The ordinal rankings of inactivity amongst these groups also remained largely unchanged. Table 5 presents year-on-year changes in employment for a variety of demographic characteristics, and includes employment shares and the shares of change in each case. This helps us to determine (i) how the composition of the labour market has changed and (ii) which groups were disproportionately affected. Of the 2.2 million fewer people employed in 2020Q2, African/Black individuals accounted for nearly 78%, or 1.7 million people – a slightly disproportionate burden of employment loss given that this group accounted for 75% of the employed prior to the lockdown. On the other hand, just 150 000 fewer White individuals were employed in 2020Q2 relative to before the pandemic, representing just 7% of employment loss despite accounting for 11.3% of the pre- pandemic employed. Considering gender, men accounted for a slightly higher share of employment loss (55.5%), with 1.2 million less employed. However, women were disproportionately affected, given that they accounted for a smaller share of pre-pandemic employment (43.7%), although this is small differentially. Perhaps most significantly, youth accounted for about half (50.6%, or 1.1 million) of employment loss, despite representing only over a third (36.6%) of pre-pandemic employment. Page 12
Table 5: Changes in employment by select demographic and labour market groups, 2019Q2
to 2020Q2

Source: QLFS 2019Q2 and 2020Q2 (StatsSA 2019, 2020b). Authors’ own calculations.
Notes: [1] Sample restricted to working-age population (15 to 64 years). [2] All estimates weighted
using relevant sampling weights.

Employment loss was disproportionately concentrated amongst individuals with relatively low levels
of formal education, those living in urban areas, those working in the informal sector or private
households, the private sector, and the non-unionised. Individuals whose highest level of education
is less than Grade 12 (matric) or equivalent accounted for more than 70% of employment loss (or
1.5 million people), despite representing only 45% of pre-pandemic employment. Job losses were
also concentrated in urban areas – as rural areas accounted for only 21% of the total employment
loss. Notably, although employment loss in the informal sector and private households together
represent about half of total employment loss, these sectors accounted for just under 28% of pre-
pandemic employment, showing that they were affected disproportionately. Most pre-pandemic
employment (73.6%) in South Africa is in the formal sector, although just 52.2% of employment
loss was located in this sector. Remarkably, almost all (93.8%) jobs lost were in the private sector,

   | COVID-19 and the labour market: Estimating the effects of South Africa’s national lockdown
                                                                                                 Page 13
despite the public sector accounting for nearly one in every five (17.4%) of the employed prior to the pandemic. Similarly, nearly all those who lost jobs (95.2%) were non-union members. In fact, union membership numbers grew slightly over the period, from 3.95 million to 4.2 million individuals. Significant regional variation in employment changes is also evident. Figure 4 presents a map of absolute and relative changes in employment levels, by province. Gauteng, KwaZulu-Natal, and the Western Cape experienced the largest absolute reductions in employment, with approximately 670 000, 380 000, and 320 000 fewer people employed, respectively. Gauteng alone accounts for nearly 30% of total jobs lost. However, these estimates do not account for differences in the number of people employed in the provinces prior to the pandemic. In relative terms then, the right panel of Figure 4 shows that the Northern Cape, Free State, and Limpopo were hardest hit, with 23%, 17%, and 17% fewer people employed, respectively. Figure 4: Changes in employment by province, 2020Q1 to 2020Q2 Source: QLFS 2020Q1 and 2020Q2 (StatsSA 2020a, 2020b). Authors’ own calculations. Notes: [1] Sample restricted to working-age population (15 to 64 years). [2] All estimates weighted using relevant sampling weights. We now turn to examine changes in employment by industry and occupation, as presented in Table 6. By sector, whilst the tertiary sector accounted for most of the total employment decrease (67.1%), this was not unexpected, given that most jobs can be found in this sector (72.2% prior to the pandemic). On the other hand, nearly a third (30.6%) of all jobs lost were in the secondary sectors, which exceed its share of total employment. These job losses were mostly in manufacturing (334 000 jobs lost) and construction (297 000 jobs lost). The primary sectors appear to have been relatively well insulated from the negative employment effects, but still shed over 50 000 jobs. By occupational category, we observe that low- and semi-skilled workers account for almost all jobs lost, with employment levels amongst high-skilled workers remaining statistically unchanged. Amongst the semi-skilled, shares of total job loss by occupation largely followed pre-pandemic Page 14
employment shares. The notable exception is craft workers, who alone accounted for 20% of
total employment loss (or 436 000 less people employed), despite representing just 12% of the
employed prior to the pandemic. Examples of these jobs include individuals working as bricklayers
and stonemasons, motor vehicle mechanics, and building electricians.

Table 6: Changes in employment by main industry and occupation, 2019Q2 to 2020Q2

Source: QLFS 2019Q2 and 2020Q2 (StatsSA 2019, 2020b). Authors’ own calculations.
Notes: [1] Sample restricted to working-age population (15 to 64 years). [2] All estimates weighted
using relevant sampling weights. [3] Industry and occupation totals do not sum because sample
here excludes workers in ‘Other’ industries and occupations.

Amongst low-skilled occupations, one in every four (or 250 000) domestic workers lost their jobs,
accounting for 11.2% of total employment loss despite representing just 6% of the pre-pandemic
employed. More than half a million (530 000) other less-skilled workers lost their jobs, including
farm labourers, manufacturing labourers, helpers and cleaners in offices and hotels, and street food
vendors.

   | COVID-19 and the labour market: Estimating the effects of South Africa’s national lockdown
                                                                                                 Page 15
Overall, our descriptive analysis thus far has shown that, of the 2.2 million fewer individuals employed
in the first few months of the lockdown, employment loss was concentrated amongst the youth,
those with lower levels of formal education, and those living in urban areas. Almost all employment
loss was observed in the private sector. We also observe some evidence of job protection
amongst union members, with non-union members accounting for nearly 100% of employment
loss. Additionally, low- and semi-skilled workers accounted for almost all jobs lost. Although the
tertiary sector accounted for the greatest absolute number of jobs lost, the secondary sector was
disproportionately affected – specifically within the manufacturing and construction sectors. One key
question going forward is whether these job losses in these industries are temporary or permanent.
Geographically, after accounting for national employment shares, we observe that the Northern
Cape, Free State, and Limpopo suffered the largest relative employment losses. Considering
outcomes other than employment, we document notable changes in the distribution of working
hours, with 2.2 million workers working zero hours in the second quarter. Finally, we show that the
lockdown disproportionately affected workers in the informal and domestic services sector, with
about 50% of total job loss attributable to the sector, despite it accounting for just under 28% of
pre-pandemic employment.10 It should be noted that these sectors are characterised by low costs
of entry, lending some hope for a potentially strong recovery.
3.3. Multivariate analysis: Estimating probabilities of employment transition
Before running our main PSM-DiD model, we exploit the panel nature of the QLFS data to examine
variation in the probability of transitioning into different labour market statuses during the lockdown.
That is, we ask: who was more or less likely to become (i) unemployed after being employed, (ii)
economically inactive after being employed, and (iii) economically inactive after being unemployed?
11
To do so, we generate the three relevant dependent variables and then use ordinary least squares
(OLS) to estimate multivariate linear probability models (LPMs) by regressing these dependent
variables on a vector of covariates. These covariates include a wide array of demographic and
labour market variables.12 We present the results of these models visually in several coefficient plots
in Figure 5, while the complete results are presented in Table A2 in the Appendix.
The informal sector here is inclusive of workers in private households.
10
We use the official (searching) definition of unemployment here.
11
In the models where we estimate the probability of transitioning from unemployment to inactivity, we do not include covariates relating to the labour market, given that these questions
12
were not asked of the unemployed in the questionnaire.
Page 16Figure 5: Coefficient plots of conditional probabilities of transitioning between employment
statuses between 2020Q1 and 2020Q2
Source: QLFS 2020Q1 and 2020Q2 (StatsSA 2020a, 2020b). Authors’ own calculations.
Notes: [1] Sample restricted to working-age population (15 to 64 years). [2] All estimates weighted
using relevant bias-adjusted weights for 2020Q2. [3] Estimates obtained by regressing select labour
market status transitions from 2020Q1 to 2020Q2 on a vector of observable covariates in 2020Q1.
Estimates as per models (2), (4), and (5), with full results presented in Table A1. [4] 90% confidence
intervals presented as capped spikes. [5] Reference groups = 15–34, African/Black, Married, Primary
education or less, Western Cape, Limited job duration, Union member, Firm size = 1 employee,
Formal sector, Agriculture, Legislators.
Several results stand out. Individuals employed in the informal sector were significantly more likely to
become unemployed, whereas those less likely to experience such a transition include women, older
individuals, White relative to African/Black individuals, those living in KwaZulu-Natal and Mpumalanga
relative to the Western Cape, and those whose contract is of a permanent nature. We observe no
significant variation in the probability of transitioning from employment to unemployment by industry
or occupation. Notably, those working in the public sector were significantly less likely to transition
from employment to either unemployment or inactivity. Considering the latter transition, women
were more likely to become inactive after being employed (as opposed to becoming unemployed, as
observed above), in addition to those with less than a complete secondary education, those living in
Limpopo relative to the Western Cape, union ¬non¬-members, and those with verbal employment
contracts. Youth were also more likely to experience an employment-inactivity transition relative to
older individuals. Moreover, our estimates suggest substantial heterogeneity in this transition by
industry and occupation. Lastly, relative to the Western Cape, individuals living in any province other
than Gauteng and the Eastern Cape were more likely to become inactive after being unemployed.
Again, the youth were also more likely to experience this transition.
The results from these employment transition regressions confirm much of our prior descriptive
analysis. Specifically, it seems more apparent that the pandemic disproportionately affected
workers in the informal sector, the youth, and those with lower levels of formal education. Again,
union members and those working in the public sector exhibit a notable extent of job protection.
| COVID-19 and the labour market: Estimating the effects of South Africa’s national lockdown
Page 17Although we observe no significant differences in the probability of transitioning from employment to unemployment by industry or occupation, we do find that workers in construction, TSC, and CSP services (by industry), as well as service workers, craft workers, and elementary workers (by occupation), were significantly more likely to experience an employment-inactivity transition. Notably, we estimate that women were no more likely than men to transition from employment to unemployment; however, they were more likely to become inactive, all else being equal. 4. Model results 4.1. Main results We now turn to our PSM-DiD analysis, where we estimate the causal effect of South Africa’s national lockdown policy on the probability of employment for those not allowed to work. A key identifying assumption of the DiD approach is the parallel trends assumption. We want to be sure that the control group (those permitted to work, those who can work from home, or those who work in the public sector) provides an appropriate counterfactual of the trend that the treatment group (those not permitted to work) would have followed in the absence of treatment (the onset of the national lockdown). We therefore first investigate whether this assumption holds visually in Figure 6, which presents the trends in our dependent variable of interest – the probability of employment – by treatment and control group over a five-year period, prior to accounting for any confounding variables through our PSM reweighting technique. Figure 6: Trends in the probability of employment, by treatment group Source: QLFS 2016Q2, 2017Q2, 2018Q2, 2019Q2, 2020Q1, and 2020Q2 (StatsSA 2016, 2017, 2018, 2019, 2020a, 2020b). Authors’ own calculations. Notes: [1] Sample restricted to working-age population (15 to 64 years). [2] All estimates weighted Page 18
using relevant sampling weights. [3] Standard errors clustered at the PSU level. [4] Capped spikes
represent 95% confidence intervals. [5] Treatment group here excludes those who can work from
home due to data limitations in pre-treatment years.

It is clear that both groups followed a relatively constant trend prior to the lockdown, which
informally satisfies the parallel trends assumption. Interestingly, individuals in the control group were
consistently more likely to be employed by about six percentage points relative to the treatment
group. This difference in levels is not a concern for our DiD analysis, given that this can be considered
as a group ‘fixed effect’, which is controlled for in the model. Once the lockdown commenced,
both groups experienced a substantial reduction in employment probability. The treatment group
experienced a larger reduction in employment probability, of about 14%, whereas the control group
experienced a reduction of 9.77%. This is indicative of the treatment effect we intend to measure;
however, this informal comparison is conducted on the unmatched sample and may be subject
to bias due to differences in characteristics between treatment groups. Our matched sample and
econometric results are presented next.

Table 7 presents our PSM-DiD results for the estimated effect of South Africa’s national lockdown on
the probability of employment, where the coefficient of interest represents the difference between
those permitted and not permitted to work during the national lockdown period.15 We present four
sets of results: first for the full 2020Q2 period, and then separately for the three lockdown stages
within this period. Noting, as per Figure 6, that employment probability was decreasing for both
the treatment and the control group, our overall estimates in model (1) suggest that the lockdown
decreased the probability of employment for those not permitted to work by eight percentage points
relative to the control group. When we disaggregate treatment by lockdown level,14 we find (as
expected) that the estimated effect is larger for more stringent lockdown levels: those not permitted
to work in level 5 were 9.3 percentage points less likely to be employed during the lockdown relative
to the control group, while for level 4 this decreases to 7.8 percentage points. We find no significant
effect on differential employment probabilities during level 3. This latter null result may be driven by
the fact that most individuals in our sample were permitted to work in level 3; however, it may also
be affected by the small sample size.

13
  The complete model results are presented in Table A3 in the Appendix, which presents our estimates before and after matching and controlling for a vector of observable covariates and
individual fixed effects.
14
  We do so by only including individuals in the treatment group for a given lockdown level if they were not permitted to work in the lockdown level and they were interviewed during the
lockdown level.

       | COVID-19 and the labour market: Estimating the effects of South Africa’s national lockdown
                                                                                                                                                                                 Page 19
Table 7: Propensity score-matched difference-in-difference estimates on the probability of
employment, by lockdown level
Source: QLFS 2020Q1 and 2020Q2 (StatsSA 2020a, 2020b). Authors’ own calculations.
Notes: [1] Sample restricted to working-age population (15 to 64 years). [2] All estimates weighted
using relevant inverse probability weights. [3] Standard errors clustered at the individual level.
4.2. Variation by group: Triple difference-in-differences estimates
The above estimated effect ought to be interpreted as an average treatment effect on the treated
(ATT); however, it is plausible that this effect varies between different groups. To investigate possible
heterogeneity, we re-estimate our above PSM-DiD model by interacting the DiD term with binary
variables for specific sub-groups, using triple difference-in-difference models.15 The results of these
models for select sub-groups of individuals are presented in Table 8.
Also referred to as difference-in-difference-in-difference (DiDiD) models.
15
Page 20Table 8: Propensity score-matched triple difference-in-difference estimates
Source: QLFS 2020Q1 and 2020Q2 (StatsSA 2020a, 2020b). Authors’ own calculations.
Notes: [1] Sample restricted to working-age population (15 to 64 years). [2] All estimates weighted
using relevant inverse probability weights. [3] Standard errors clustered at the individual level. [4]
n.e. = not estimated.
We find statistically significant, negative effects for two distinct groups: individuals living in urban
areas versus those in rural areas, and own-account workers versus employees. We estimate a
particularly large effect for the latter group. We do not find any evidence of variation in effects by
sex, age, education, or skill level. Specifically, our estimates suggest that the national lockdown
decreased the probability of employment for those who live in urban areas and were not permitted
to work by 5.3 percentage points relative to the control group. Amongst own-account workers,
the relative effect was a reduction in the probability of employment by 22.4 percentage points – an
effect nearly three times larger compared to the ATT of eight percentage points observed above.16
Importantly, given that the vast majority of own-account workers work in the informal sector (86.4%
of own-account workers, or 1.4 million workers as of 2020Q1), this result is arguably indicative of
the disproportionate effect of the lockdown on informal sector workers – in line with our descriptive
analysis in Section 3.17 What this suggests is that, while the ostensible disproportionate effects
amongst other vulnerable groups (the youth, less-educated, and less-skilled) seem to be muted in
these conditional estimates, working in the informal sector seems to be a key determinant of not
being employed during the lockdown period.
16
Importantly, these effects by group (i.e. for urban individuals and own-account workers) do not imply that only these groups were affected by the lockdown, but rather that the effects
relevant to them are statistically significantly different relative to their counterparts (i.e. non-urban individuals and non-own-account workers).
17
The informal sector here includes workers in private households. As opposed to own-account workers, we are unable to estimate a triple DiD effect for an explicit informal sector group of
workers, given that only the employed were asked the relevant question in the QLFS.
| COVID-19 and the labour market: Estimating the effects of South Africa’s national lockdown
Page 214.3. Robustness tests In this section, we conduct two sample-specific robustness tests to examine the sensitivity of our results to alternative (i) control group definitions and (ii) ‘limited capacity industry’ assumptions. In our main results, although our treatment group consistently consists of individuals legally not permitted to work during a given lockdown level at the time they were interviewed, the control group consists of individuals who were legally permitted to work, as well as anyone able to work during the lockdown (measured by working in the public sector or from home). Here we re-estimate our PSM- DiD models to examine the implications of including the latter two groups of workers in the control group. Specifically, we estimate models for the distinct control group definitions, similar to those in Table 2. The results of these models are presented in Table 9. Regardless of control group definition, we continue to find statistically significant and negative effects on the probability of employment that vary between four and eight percentage points. The estimated effect is smallest (50% of the estimate of our preferred control group) when the control group either includes only those legally not permitted to work, or additionally those who work in the public sector – the effects based on these two definitions are not statistically different from one another. Lastly, when the control group consists of those who were permitted to work or could work from home, the estimate increases by 85% to -0.074, which is not statistically different from the estimate for our preferred control group: -0.080. This suggests that our main result is slightly sensitive to control group criteria. Irrespective of this, however, the estimated effect is consistently negative and statistically significant – in line with our overall finding. Table 9: Propensity score-matched difference-in-difference estimates, by varying control group definition Page 22
Source: QLFS 2020Q1 and 2020Q2 (StatsSA 2020a, 2020b). Authors’ own calculations.
Notes: [1] Sample restricted to working-age population (15 to 64 years). [2] All estimates weighted
using relevant inverse probability weights. [3] Standard errors clustered at the individual level.

In our main results, we assume that individuals were permitted to work if their industry’s legislated
capacity was equal to, or exceeded, 50%, and not otherwise. This is an arbitrary threshold and
has implications for who is included in our control group, thus influencing our results. Our second
robustness check entails re-estimating our PSM-DiD models using several alternative threshold
assumptions to assign relevant individuals to the control group. Table 10 presents the four
alternative assumptions we make, and their implications for our treatment-group samples. Under a
‘very progressive’ assumption, we assign individuals to the control group if any proportion of their
industry was permitted to work. As expected, this results in the relatively largest control group of
31 500 observations. Under the ‘very conservative’ assumption, we assign individuals to the control
group only if 100% of their industry was permitted to work. This results in a much larger treatment
group and smaller control group. Intuitively, moving from ‘very progressive’ to ‘very conservative’
increases (decreases) the size of our treatment (control) group. Our main results – which use the
‘50%’ assumption – can be regarded as moderate in this regard.

Table 10: Treatment group sample sizes by varied ‘limited capacity industry’ assumptions

Source: QLFS 2020Q1 and 2020Q2 (StatsSA 2020a, 2020b). Authors’ own calculations.
Notes: [1] Sample restricted to working-age population (15 to 64 years).

The results of our re-estimated models under these varying assumptions are presented in Table
11.18 Regardless of assumption, we continue to find statistically significant and negative effects on
the probability of employment, which varies between eight and 14.9 percentage points.

 It should be noted that it is expected that the number of observations in our regression models in Table 11 are expected to vary, and in particular increase from ‘very progressive’ to ‘very
18

conservative’. This is because the size of the treatment group grows in this direction, and the propensity score-matching technique attempts to match appropriate control observations to the
number of treatment observations.

       | COVID-19 and the labour market: Estimating the effects of South Africa’s national lockdown
                                                                                                                                                                                    Page 23
Table 11: Propensity score-matched difference-in-difference estimates, by ‘limited industry
capacity’ assumption
Source: QLFS 2020Q1 and 2020Q2 (StatsSA 2020a, 2020b). Authors’ own calculations.
Notes: [1] Sample restricted to working-age population (15 to 64 years). [2] All estimates weighted
using relevant inverse probability weights. [3] Standard errors clustered at the individual level.
Although the estimate under the ‘very progressive’ assumption is nearly two times larger in magnitude
compared to our main estimate of -0.080, we note that in three of the four assumptions we find very
similar results to those of our main estimate. Arguably, the ‘very progressive’ assumption – that is,
individuals are permitted to work if any capacity of their firm in their industry was permitted to work –
is not a plausible assumption. We therefore take the remaining estimates as evidence that our main
result under the moderate ‘50%’ is fairly robust to alternative assumptions.
5. Conclusion
South Africa imposed a relatively stringent national lockdown in response to the COVID-19 pandemic
to prepare the necessary health infrastructure, as well as to delay and minimise the spread of the
virus. Although the pandemic continues to pose important risks to public health, the lockdown was
always expected to result in substantial short- and long-term economic costs. Several studies using
data collected during South Africa’s lockdown show that these costs have been disproportionately
borne by several vulnerable groups, such as less-skilled, low-wage, informal, and female workers.19
These studies, however, are largely descriptive in nature. In this paper, in addition to providing a
detailed descriptive account of the effects of the COVID-19 pandemic on the South African labour
market outcomes, we exploit quasi-experimental variation in the country’s national lockdown
policy to estimate the causal effect of the lockdown on the probability of employment for those
not permitted to work. By cross-examining the relevant legislature with three-digit industry codes
in representative labour force data, we do so by exploiting the coincidental timing of the lockdown
See Benhura and Magejo (2020), Casale and Posel (2020), Casale and Shepherd (2020), Hill and Köhler (2020), Jain et al. (2020), and Ranchhod and Daniels (2020).
19
Page 24You can also read