SPECIALIST DISABILITY ACCOMMODATION - Supply in Australia March 2019 - Get Building SDA
←
→
Page content transcription
If your browser does not render page correctly, please read the page content below
SPECIALIST DISABILITY
ACCOMMODATION
Supply in Australia
March 2019
SPECIALIST DISABILITY
ACCOMMODATION
Supply in Australia
March 2019
Social Ventures Australia
Funding • Investment • Advice
Brisbane | Melbourne | Perth | Sydney | ABN 94 100 487 572
info@socialventures.com.au | socialventures.com.au | @social_ventures

Summer Foundation
Summer Foundation Ltd
ABN 90 117 719 516
PO Box 208
Blackburn 3180
VIC Australia
Telephone: +613 9894 7006
Fax: +613 8456 6325
info@summerfoundation.org.au
www.summerfoundation.org.au

© 2019, Summer Foundation Ltd. A copy of this report is made available under a Creative Commons Attribution
4.0 License (international)

DISCLAIMERS
Social Ventures Australia and the Summer Foundation have prepared this report in good faith based on information available
to us at the date of publication. Information has been obtained from sources that we believe it to be reliable and up to date,
but we have not verified its accuracy or completeness. Social Ventures Australia and the Summer Foundation do not make
any warranty, express or implied, regarding any information in the report, including warranties as to the accuracy, completeness
or fitness for purpose of the information. Social Ventures Australia and the Summer Foundation are not liable to any person
for any damage or loss that has occurred, or may occur, in relation to that person taking or not taking action in respect of
any representation, statement, opinion or advice referred to in this report.
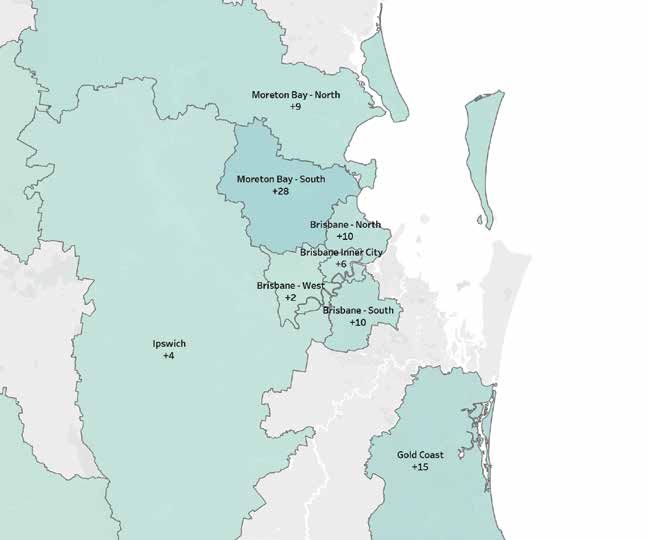
Table of contents

Foreword................................................... 3          Modelling SDA undersupply................... 21                          Appendix A: New SDA supply
                                                                                                                                                as reported in survey.............................. 36
Executive Summary.................................. 4                  Where is SDA undersupply?................... 21
                                                                          Introduction to maps...................................... 21         Appendix B: SDA supply and demand
Background............................................... 5
                                                                          Map 8: New South Wales............................... 22              – New South Wales................................. 37
   What is SDA.....................................................5
                                                                          Map 9: Victoria............................................... 23
   Previous SDA market analysis..........................5                                                                                      Appendix C: SDA supply and demand
                                                                          Map 10: Queensland...................................... 24           Queensland............................................. 38
   New SDA data from the NDIS...........................5
                                                                          Map 11: South Australia................................. 25
   Survey methodology.........................................6                                                                                 Appendix D: SDA supply and demand
                                                                          Map 12: Western Australia.............................. 26
                                                                                                                                                – Victoria and WA.................................... 39
National overview of results..................... 8                       Map 13: ACT and Northern Territory............... 27

Type of new SDA reported........................ 9                        Map 14: Tasmania.......................................... 28         Appendix E: SDA supply and demand
                                                                                                                                                – ACT, NT, SA and Tasmania................... 40
Stage of SDA development.................... 10                        SDA Provider Profiles............................. 29
                                                                          Melba Support Services/                                               TECHNICAL NOTES................................ 41
Profile of new SDA developers                                             Community Housing Limited.......................... 30
and providers.......................................... 11
                                                                          Access 2 Place............................................... 31
Where is the new SDA supply?.............. 13                             Summer Housing............................................ 32
   Introduction to maps...................................... 13          Youngcare....................................................... 33
   Map 1: New South Wales............................... 14               Connecting the new market –
   Map 2: Victoria............................................... 15      The Housing Hub............................................ 34

   Map 3: Queensland........................................ 16        New SDA Data from the National
   Map 4: South Australia................................... 17        Disability Insurance Agency................... 35
   Map 5: Tasmania............................................ 18
   Map 6: Western Australia................................ 20
   Map 7: ACT and Northern Territory................. 20

                                                                                                                                SPECIALIST DISABILITY ACCOMMODATION – Supply in Australia               1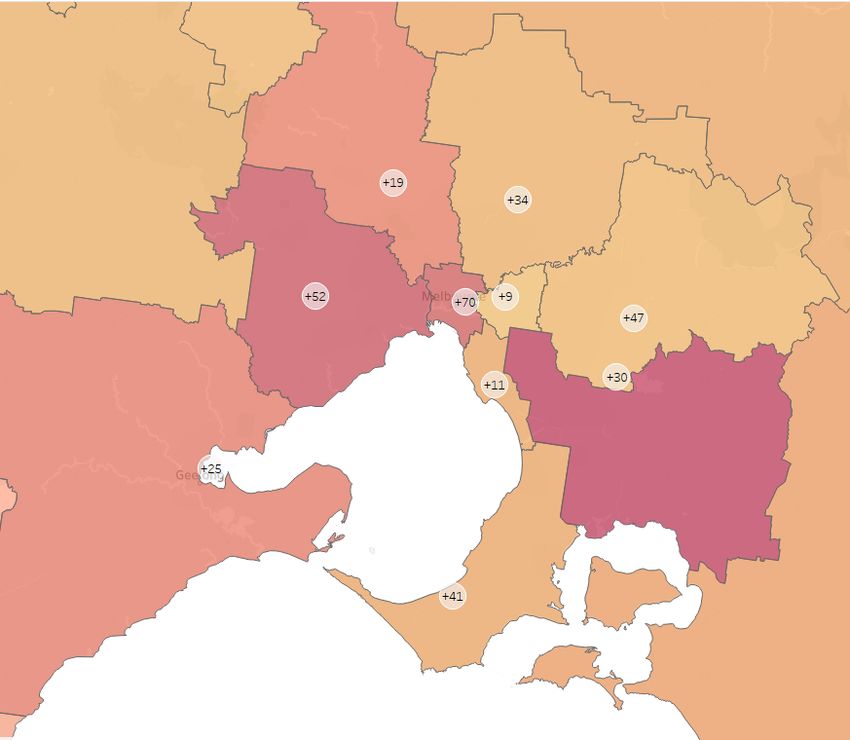
Figures and Tables                                   Table 1 – New SDA places by jurisdiction     GLOSSARY
Figure 1 – Location of new SDA places                Table 2 – New SDA supply by Building Type    CHP    Community Housing Provider
in development                                       and Design Category
                                                                                                  DGR    Deductible Gift Registration
Figure 2 – New SDA supply by jurisdiction            Table 3 – Provider type by Building Type
                                                                                                  DSP    Disability Support Provider
Figure 3 – New SDA supply by Building Type           Table 4 – Provider type by Design Category
                                                                                                  NDIA   National Disability Insurance Agency
Figure 4 – New SDA supply by Design Category         Table 5 – SDA modelled undersupply
                                                                                                  NDIS   National Disability Insurance Scheme
                                                     and new supply
Figure 5 – New SDA supply by stage
                                                                                                  NFP    Not for Profit
of development
                                                                                                  SA4    Statistical Area level 4
Figure 6 – New SDA supply – expected
completion date                                                                                   SDA    Specialist Disability Accommodation

Figure 7 – SDA provider type by number                                                            SIL    Supported Independent Living
of SDA places in development
Figure 8 – Number of providers by number
of SDA places in development
Figure 9 – New Build SDA enrolled compared
with new SDA supply
Figure 10 – New Build SDA enrolled compared
with new SDA supply by Design Category

2    SPECIALIST DISABILITY ACCOMMODATION – Supply in Australia
Foreword

It is with great enthusiasm and optimism that        Our organisations partnered on this report because
                                                                                                                           Luke Bosher
Social Ventures Australia and the Summer             we know that robust evidence and data are key
                                                                                                                           CEO,
Foundation present this report into the growth       enablers of a successful SDA market that delivers
                                                                                                                           Summer Foundation
in supply of Specialist Disability Accommodation     on this vision for people with disability.
(SDA) across Australia.
                                                     We hope this report will inform and guide the next
Specialist Disability Accommodation Supply in        phase of investment in SDA. Greater transparency
                                                                                                                           Diana Ferner
Australia is the most comprehensive snapshot         of what is underway and where, will enhance the
                                                                                                                           Director, Consulting and Disability Lead
undertaken to date on how the market is responding   confidence of those actively involved in the market
                                                                                                                           Social Ventures Australia
to the opportunity to expand housing supply for      and allow stakeholders to make more informed
people with disability.                              investment decisions.

The report’s finding, that more than 1,500 new SDA   We also anticipate that this data will aid governments
places are in the construction pipeline, should be   and market intermediaries to identify where the SDA
welcomed by people with disability, governments      market is lagging and where more focused efforts
and the broader supply market.                       to generate SDA supply might be needed.

This report highlights geographies and building      The SDA market is still in its infancy. There is still
types where the SDA market has had a strong early    much more to do to create an SDA market that
response, and shines a light on areas where SDA      delivers the scale of housing anticipated – including
supply remains weak and needs more focus by          12,000 new places and redevelopment of a large
providers and government.                            segment of the existing 16,000 places.

Social Ventures Australia and the Summer             Social Ventures Australia and the Summer
Foundation share a vision for an Australia where     Foundation look forward to continuing to work
people with disability have access to high quality   with people with disability, providers, investors and
housing that meets their needs and fosters           governments to create an SDA market that delivers
connection to communities.                           on the vision of housing for people with disability.

                                                                                                 SPECIALIST DISABILITY ACCOMMODATION – Supply in Australia       3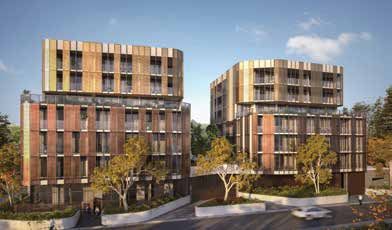
Executive Summary

Specialist Disability Accommodation Supply                The Specialist Disability Accommodation                • The estimated undersupply of SDA is
in Australia is a report on new supply and potential      Supply in Australia report was created to provide        concentrated in the major cities, except
undersupply of Specialist Disability Accommodation        much-needed data on the nascent SDA market to            for South Australia where Adelaide already
(SDA) across Australia.                                   encourage further investment and speed the creation      has significant new supply in the pipeline
                                                          of specialist housing for people with disability.
This report is based on a survey of SDA providers                                                               A range of provider types responded to the survey,
                                                          The report indicates that a solid start has been
across Australia undertaken in late 2018. The survey                                                            with not-for-profit providers dominating activity,
                                                          made in the new SDA market, with more than 2,000
collected data about new SDA projects under                                                                     mainly community housing providers (the latter
                                                          new SDA places either enrolled (registered with the
development in order to determine how many SDA                                                                  responsible for nearly 60% of the reported supply).
                                                          NDIS) or in the development pipeline. This takes
places are in the pipeline (i.e. being planned or
                                                          into account 718 places of newly built SDA enrolled
constructed). The data presented in the report came
                                                          with the NDIA as at 31 December 2018.
from 55 SDA providers who responded with details
of their SDA development projects.                        However, with around 12,000 new SDA places
                                                          needing to be created to meet the anticipated
The survey indicates that there are 1,518 SDA
                                                          demand from NDIS participants with SDA funding,
places in development around Australia, with the
                                                          increased market confidence to encourage further
most activity in NSW, Victoria and South Australia.
                                                          investment is essential.
Number of SDA places reported in development
or newly enrolled                                         The survey has revealed that:

                                                           • The current SDA development pipeline is
    ACT                                 32
                                                             dominated by High Physical Support designs,
    NSW                                 635
                                                             with very little Robust capacity being built
    NT                                   0
                                                           • The most common building types are
    QLD                                 99
                                                             apartments and group homes
    SA                                  336
                                                           • More than 80% of places are at pre-construction
    TAS                                 14                   or construction stages of development
    VIC                                 386
                                                           • Three-quarters of the reported supply would
    WA                                  16                   be delivered by early 2020
    National                           1,518

4         SPECIALIST DISABILITY ACCOMMODATION – Supply in Australia
Background

What is SDA?                                         The SDA housing market is a new and exciting            conducted a limited survey of SDA providers
Specialist Disability Accommodation (SDA) is         market which is expected to create thousands of         to determine how many SDA places were under
                                                     new dwellings for people with disability over the       development around Australia. Due to limitations
housing that has been specially designed to suit
                                                     next few years. However, there is complexity in the     in the survey responses and the relative immaturity
the needs of people who have ‘extreme functional
                                                     way policy governing SDA payments operates,             of the market, the results were not published.
impairment’ or ‘very high support needs’.
                                                     set out in the SDA Pricing and Payment Framework        But more than 900 places of new SDA were
SDA payments for individual participants under the   and associated documents (ndis.gov.au/providers/        identified through this survey.
National Disability Insurance Scheme (NDIS) enable   price-guides-and-information/sda-pricing-and-
                                                                                                             When the Market Insights report was presented
them to pay to live in SDA housing. It is expected   payments). To date there has been significant
                                                                                                             at a series of seminars and other forums around
that around 28,000 people under the NDIS will be     uncertainty in the market about where to build
                                                                                                             Australia in 2018, there were calls for data that
funded for SDA, with the NDIS eventually spending    new SDA housing and who for.
                                                                                                             would give an indication of the SDA development
around $700 million per year on SDA payments.
                                                     Previous SDA market analysis                            pipeline, to improve confidence in the direction
SDA payments are provided for purpose-built          In 2018 the Summer Foundation and SGS                   of locations for new SDA investment.
housing for NDIS participants with very high and     Economics and Planning published the Specialist
complex support needs, to enable them to lead
                                                                                                             New SDA data from the NDIS
                                                     Disability Accommodation Market Insights report
an ordinary life. These payments are made to a                                                               The lack of data about people being funded for SDA
                                                     which estimated current SDA supply and potential
provider of an SDA property when someone who                                                                 or current SDA supply was recognised in KPMG’s
                                                     demand. As NDIS data was not available at that
has been approved for SDA funding is living in it.                                                           NDIS Specialist Disability Accommodation Pricing
                                                     time, this analysis used a proxy data source
                                                     (Disability Services - National Minimum Data Set,       and Payments Framework Review to be a significant
The SDA model of funding under the NDIS creates                                                              barrier for investment in growing the stock of SDA.
a user-driven market that enables people with        providing administrative data from state disability
                                                     service systems) to establish demand and supply         The National Disability Insurance Agency (NDIA)
disability to decide where they live and who they
                                                     in indicative terms. You will find the Specialist       began providing more extended SDA data in
live with. The model will deliver better housing
                                                     Disability Accommodation Market Insights report         its September 2018 quarterly report. The latest
outcomes for people with very high and complex
                                                     at: summerfoundation.org.au/resources/                  available data (from the December 2018 report)
disability support needs.
                                                     sda-market-insights/                                    indicates 10,975 participants have SDA funding
                                                     In 2017, as part of the analysis being undertaken       in their plans (39% of an expected total of 28,000
                                                     for this report, the Summer Foundation and the          participants with SDA funding), and there are 2,593
                                                     Australian Housing and Urban Research Institute         dwellings enrolled as SDA.

                                                                                                SPECIALIST DISABILITY ACCOMMODATION – Supply in Australia          5
Background (continued)

However, there are a number of limitations with the         There is now a strong commitment from the NDIA,          In lieu of available data on the state of current and
reported data in providing indications of demand            backed by recent directions from the Disability          pipeline SDA supply from the NDIA, the Summer
for new SDA housing and where additional SDA                Reform Council, to continue to provide and improve       Foundation and Social Ventures Australia (SVA)
housing is needed:                                          SDA data on participants and supply.                     have partnered to undertake a survey on the
                                                                                                                     development pipeline of SDA supply to supplement
    • People living in supported accommodation              This report includes some newly released data
                                                                                                                     the previous Market Insights report. The results that
      prior to the transition to the NDIS often             on newly built SDA places provided by the NDIA.
                                                                                                                     follow highlight where the SDA market has had a
      automatically receive SDA funding in their plans      Refer to p.35 in this report.
                                                                                                                     strong early response and where there is a need
      reflecting the accommodation they are currently
                                                            In addition, as part of a number of reforms              for greater focus by providers and government.
      living in. If they move, it is unclear whether and
                                                            announced to the SDA Pricing and Payment
      at what level they would receive SDA funding                                                                   Survey methodology
                                                            Framework, a commitment has been made to
    • The number of enrolled dwellings is not               enable SDA providers to pre-certify dwellings            SVA partnered with the Summer Foundation to
      provided by number of bedrooms/places for             to be built. This is a potentially useful source of      develop the survey, undertake the data analysis
      SDA-funded participants, so it is difficult to        future data about the SDA development pipeline,          and jointly produce this report.
      assess capacity in current SDA supply                 but will only reflect those projects which are pre-      A survey instrument was designed to capture key
    • Enrolment data does not include “in-kind”             certified (not a mandatory process). Pre-certification   aspects of SDA development projects.
      SDA – these are dwellings owned by state and          processes for new SDA development are expected           Data items included:
      territory governments and enrolled as SDA, but        to commence later in 2019 (dss.gov.au/disability-
                                                                                                                      • Organisation
      SDA payments are treated as pre-paid support          and-carers-programs-services-government-
      in a participant’s plan. This housing is generally    international-disability-reform-council/review-           • SDA Building Type
      group homes or larger residential settings,           of-the-sda-pricing-and-payments-framework).               • SDA Design Category
      which do not reflect contemporary practice.                                                                     • Number of bedrooms
      This housing forms part of the current SDA
                                                                                                                      • SDA capacity (number of SDA places, which
      supply, but is not visible in the current reporting
                                                                                                                        could be less than number of bedrooms)
    • Due to the staged rollout of the NDIS, the
                                                                                                                      • Location
      quality of the data in some jurisdictions is less
      reliable than in others                                                                                         • Expected date available for occupancy
    • Enrolment data does not include committed
      SDA developments currently in the pipeline

6       SPECIALIST DISABILITY ACCOMMODATION – Supply in Australia
Background (continued)
• Stage of development: • SDA providers listing vacancies with
a. Completed after 1 April 2017 and enrolment The Housing Hub, an information platform
confirmed with NDIA to connect searchers with providers
b. Construction completed, pending enrolment • Providers who had engaged with the Summer
Foundation through seminars, meetings and
c. Under construction
other contacts
d. Development and building approval
completed and contractually committed • Peak provider organisations including the
to build Community Housing Industry Association,
PowerHousing and National Disability Services
e. Land secured, waiting for development
were approached to promote the survey
approval, building approval and/or
to their networks.
finance approval
At the closing date of the survey in January 2019,
The survey instrument was developed and tested
more than 80 responses had been received, with
with six active SDA developers of different types
60 organisations providing data and most others
and two SDA investors to check utility of the
indicating they had no SDA development planned,
resulting data and willingness to disclose
or that their projects were at an earlier stage.
information requested.
A small number of providers indicated they could
A survey invitation list was developed from not provide data for commercial reasons.
a number of sources:
Following data cleansing, data from a total of 55
• An edited version of the NDIA’s provider list for providers was used for the analysis in this report.
SDA services (duplicates across jurisdictions
were removed as well as providers listed that
did not have a clear public online presence,
or whose website indicated they were likely
to be providers of existing SDA)
SPECIALIST DISABILITY ACCOMMODATION – Supply in Australia 7National overview of results
Fifty-five SDA providers submitted data to the Most new SDA development activity is occurring in Figure 2 – New SDA supply by jurisdiction
survey and reported a total of 1,518 new SDA New South Wales, followed by Victoria and South 700
places, most of which are in the development and Australia. The following table sets out the number 635
600 NSW Home4Life project
construction phase. The following map indicates of SDA places in development or newly completed, (350 places)
the location of new SDA supply, as determined reported by jurisdiction. 500
from responses to the survey. 386
Table 1 – New SDA places by jurisdiction 400
336
Figure 1 – Location of new SDA places in development 300 SA Government
(221 places)
Number of SDA places
200
ACT 32 100
99
32
16 14
0
NSW 635 NSW VIC SA QLD ACT WA TAS
NT 0
Figure 2 indicates a large number of SDA places
in the pipeline in NSW. Note that in both NSW and
QLD 99
SA the data reported reflects government initiatives
to either transition existing SDA residents into
SA 336
improved SDA settings or create new SDA supply.
TAS 14 These are one-off supply initiatives outside normal
market processes (in the case of NSW this is
VIC 386 a supply initiative to rehouse people currently
living in large residential facilities).
WA 16
National 1,518
8 SPECIALIST DISABILITY ACCOMMODATION – Supply in AustraliaType of new SDA reported
The NDIS provides funding for SDA on the basis of Design Category Table 2 illustrates the spread of SDA design
specified building types and categories (refer SDA Figure 4 illustrates SDA places reported from the categories across building types in the development
price guide - ndis.gov.au/providers/price-guides- survey by Design Category. The most significant pipeline, indicating that most apartment and group
and-information/sda-pricing-and-payments). design category reported in the survey results was home places reported are in the High Physical
High Physical Support (960 places) with smaller Support design category but many houses are
Building Type
numbers of Improved Liveability (242 places) and in the Improved Liveability category.
Figure 3 illustrates SDA places reported from the
Fully Accessible (254 places) SDA. Only 62 Robust Table 2 – New SDA supply by Building Type
survey by Building Type. Apartments are the most
SDA places were reported. and Design Category
frequent building type reported from the survey
(534 places reported). However, there are also Figure 4 – New SDA supply by Design Category High
significant numbers of other building types – villa/ Improved Liveability 242 Improved Fully
Robust Physical
Liveability Accessible
duplexes of 1-3 residents (199 places), 1 to 3-bedroom Improved Liveability 242 Support
houses (336 places) and group homes of 4-5
residents (413 places – noting that 350 of these Fully Accessi ble 254 Apartment 88 121 325
are reported
Apartmentfrom
(1-2one provider, associated with
residents) 534 Fully Accessi ble 254
the NSW government-funded
Apartment
Apartment (1-2 residents) initiative to replace
(1-2residents) 534
534 Villa/
duplex/ 25 53 20 101
existing large residential
Apartment facilities in that state).
(1-2 residents) 534 Robust 62
townhouse
Villa Apartment
/ duplex / townhouse (1-3
(1-2 residents) 199 534 Robust 62
Figure 3 – New SDA supply by Building Type
residents)
Villa
Villa/Apartment
/duplex
duplex//townhouse
townhouse (1-3
(1-3
(1-2 residents) 534
199
199 House 129 52 30 125
residents)
residents)
Villa /Apartment
duplex / townhouse (1-3
(1-2 residents) 199 534 High Physical Support 960
residents)
Villa / duplex / townhouse (1-3
House (2-3 residents) 199336 High Physical Support 960 Group
residents)
Villa / duplex / townhouse (1-3 28 12 409
House
House (2-3
(2-3residents)
residents) 199336 home
residents) 336 0 500 1000
Villa / duplex / townhouse (1-3
House (2-3 residents) 199336
residents) 0 500 1000
GroupHouse
home (2-3
(4-5 residents) 336
413
GroupHouse
Group home (2-3
home(4-5 residents)
(4-5residents)
residents) 336
413
413
Group House (2-3 residents)
home (4-5 336
413
Larger
Group home (4-5homes (5+)
residents) 36 413
Group home (4-5homes
Larger
Larger residents)
homes (5+)
(5+) 36
36 413
Group home (4-5homes
Larger residents)
(5+) 0 362 00 400 413
600 800 1000 1200
Larger homes (5+) 36
00 2200
00 400
400 600
600 800
800 1000
10001200
1200
Larger homes (5+) 36
0 2 00 400 600 800 1000 1200
Larger homes (5+) 362 00 SPECIALIST DISABILITY ACCOMMODATION – Supply in Australia 9
0 400 600 800 1000 1200
0 2 00 400 600 800 1000 1200Stage of SDA development
Figure 5 illustrates the stage of development of the Figure 6 illustrates the expected completion date of SDA supply reported in the survey, with 76% of places
reported SDA supply in development (by number scheduled to be complete by early 2020.
of SDA places). This indicates most projects Figure 6 – New SDA supply – expected completion date
reported are at pre-construction and construction
phases (1,238 places in total). Fifty-three places 450
are reported as newly enrolled. 383
400
350
Figure 5 – New SDA supply by stage of development
300
600
250 191
533 200
150 118 120 119
500 93
100 67
46 35
418
50 18 20 4
400 0
Qtr1 Qtr2 Qtr3 Qtr4 Qtr1 Qtr2 Qtr3 Qtr4 Qtr1 Qtr2 Qtr3 Qtr4
287
300
227 2019 2020 2021
200
100
53
0
A B C D E
Legend: Development status
A. Completed after 1 April 2017 and enrolment confirmed
with NDIA
B. Construction completed, pending enrolment
C. Under construction
D. Development & building approval completed & contractually
committed to build
E. Land secured, waiting for development approval, building
approval and/or finance approval
10 SPECIALIST DISABILITY ACCOMMODATION – Supply in AustraliaProfile of new SDA developers and providers
The following charts and tables provide some insight Figure 7 – SDA provider type by number of SDA places Figure 8 indicates the providers by number of
into the scale of SDA development activity by type in development places being delivered, indicating more than half the
Community housing provider (CHP)
of provider, and the type of SDA being developed Community housing
Community housing
provider (CHP)
891
891
providers who responded to the survey have 11 or
provider (CHP)
by provider type. more SDA places in development, with 6 providers
NFP Disability service provider (DSP - NFP) 234
NFP Disability service
NFP Disability service provider (DSP - NFP) 234 with between 50 and 150 places in development.
This information highlights the range of provider (DSP - NFP)
organisations active in SDA development at this Prviate housing provider (Private housing) 217
Figure 8 – SDA providers by scale of SDA
Private housing
Prviate housing provider (Private provider
housing) 217 development activity
stage, including the key role being played by (Private housing)
not-for-profit organisations (especially community
NFP hous ing provider, non-CHP (NFP housing)
NFP housing provider
90
1 provider (NSW
NFP hous ing provider, non-CHP (NFP housing) 150+
90
housing providers), but also activity emerging from non-CHP (NFP housing) Home4Life project) 350
places
private SDA providers. Government 53
Government
Government 53 51 to 150 6 providers
483 places
Figure 7 shows that community housing providers
Private Dis ability service provider (DSP - P rivate) 33
dominate new SDA development at this point,Private Dis ability servicePrivate Disability service
provider (DSP - P rivate)
provider(DSP) - Private) 33 21 to 50 15 providers
437 places
associated with a total of 891 SDA places in 0 100 200 300 400 500 600 700 800 900 1000
0 100 200 300 400 500 600 700 800 900 1000
development. Figure 7 also indicates the diversity 9 providers
11 to 20
of providers developing new SDA. This includes Legend: Provider types 114 places
a range of not-for-profit and private housing Community housing provider (CHP): Organisations registered
with the National Regulatory System for Community Housing 1 to 10 24 providers
organisations and disability service provider (NRSCH) as a Tier 1, 2 or 3 housing provider 134 places
organisations involved in new SDA development, NFP housing provider, non-CHP (NFP housing): Organisations 0 100 200 300 400 500 600
as well as government agencies. with Deductible Gift Registration (DGR) status, that are not a
provider of NDIS core or SIL services and not a registered CHP
Private housing provider: Commercial entity that does not
have DGR status, not a provider of NDIS core or SIL services
Disability service provider (DSP): Organisations that are
a provider of NDIS core or SIL services or aged care service
(including not-for-profit and for-profit providers, private
landlords, family run projects and organisations providing
Residential Aged Care services)
Government: Commonwealth, State or Territory or Local
Government agencies that register as the SDA provider
SPECIALIST DISABILITY ACCOMMODATION – Supply in Australia 11Profile of new SDA developers and providers (continued)
The following tables show the building types and Table 3 – Provider type by building type
design categories of SDA being developed by Villa/duplex/
Apartment House Group home
different types of SDA providers. There are a number townhouse
of group homes and High Physical Support design Community housing
258 98 174 361
category places reported by community housing provider (CHP)
providers. This result is influenced by a NSW NFP Disability service
78 72 11 73
provider (DSP - NFP)
government initiative to build 350 new SDA places,
which is being delivered by a major community Private housing provider
93 27 87 10
(Private housing)
housing provider in that state. As noted earlier, this
NFP housing provider,
is a one-off initiative. Table 4 indicates the small 90
non-CHP (NFP housing)
number of Robust category places in development,
mainly by not-for-profit providers. Government 53
Private Disability service
15 2 11 5
provider (DSP - Private)
Table 4 – Provider type by design category
Improved Liveability Fully Accessible Robust High Physical Support
Community housing
167 133 40 551
provider (CHP)
NFP Disability service
19 105 20 90
provider (DSP - NFP)
Private housing provider
12 205
(Private housing)
NFP housing provider,
90
non-CHP (NFP housing)
Government 53
Private Disability service
3 4 2 24
provider (DSP - Private)
12 SPECIALIST DISABILITY ACCOMMODATION – Supply in AustraliaWhere is the new
SDA supply?
Liz’s story Introduction to maps
The following maps indicate the extent of
new SDA in development (as recorded in
survey responses) mapped to SA4 level
Moving in to her new apartment in Summer Housing’s Fairfield development this year (refers to Statistical Area Level 4 – for
has been life changing for Liz. explanation of statistical areas, refer to the
“I’m in my 30s and I’d never had a place of my own to live – ever,” Liz said. Australian Bureau of Statistics website:
www.abs.gov.au/websitedbs/D3310114.
“Nothing is yours when you live somewhere that’s run by an organisation because you nsf/homeAustralian+Statistical+Geography
always feel like you’re intruding. Now, I walk in the door and I think ‘hang on, I’m home +Standard+(ASGS)).
and I’m not intruding on anyone else’s space’. It’s awesome.”
Charts for each jurisdiction compare
Liz, who has cerebral palsy, had lived in two group homes over six years before she the distribution of new SDA supply
moved in to her Fairfield apartment. in that jurisdiction by building type
For the 33-year-old who works for a disability service provider, the location of the and design category with the national
development is perfect. “It takes me 15 minutes to get into the city on the train and there’s figures from the survey.
also a bus I could get, which I’m looking forward to trying. I actually have options now.” Note that these figures do not represent
Liz has an NDIS plan with SDA – high physical support. “My NDIS plan gives me flexibility all SDA development activity as a
of support and choice and control of who provides these supports.” numberof providers who may have
SDA developments underway did not
The Fairfield apartment is one of 10 peppered throughout a private development of respond to the survey.
77 units. The SDA apartments, in single or multiple bedroom layouts, feature accessible
and customisable kitchens and bathrooms, as well as smart home technology to enable Detailed data by SA4 is provided in
tenants to maximise their independence and privacy. Access to 24-hour on-site support the appendices.
is available.
“I’m actually living in the community now,” Liz said. “It’s just normal.”
13Map 1: New South Wales – New SDA development
New South Wales overview
There is significant SDA development
underway in the south and west of Sydney,
and around Newcastle.
NSW – SDA new supply by Building Type
37%
Apartment
35%
37%
Apartment
35%
Villa/duplex/townhouse 2%
13%
Villa/duplex/townhouse 2%
13%
House 3%
3% 22%
House
22%
59%
Group home 59%
Group home
30% 30%
0%
0% 10%
10% 20%20% 30% 30%40% 40%
5 0% 560%
0% 60%
70% 70%
NSW National
NSW National
NSW – SDA new supply by Design Category
37%
Apartment
35%
9%
Improved Liveability
16%
Villa/duplex/townhouse 2%
13%
Fully Accessi ble 14%
17%
House 3%
1% 22%
Robust
4% Key
59% SA4 name
Group home 76%
High Physical Support 30% 63% + New SDA supply
0% 10% 10%20%
0% 20%
30% 30% 50% 40%60%
40% 570%
0% 60%
80% 70%
NSW National
NSW National
14 SPECIALIST DISABILITY ACCOMMODATION – Supply in AustraliaMap 2: Victoria – New SDA development
2019Survey
New SDA supply
2019Survey 1 191
Victoria overview
New SDA development is mostly spread around the
Melbourne area, with some additional development
in the north-west. North West
+26
Shepparton
VIC – SDA new supply by Building Type Bendigo
+6 Melbourne - North West
39% +7 +19
Apartment Melbourne - North East
35% +34
39%
Apartment Melbourne - North West
23% 35%
Villa/duplex/townhouse +19
13% Warrnambool and South West
Melbourne - Inner South
+11
Villa/duplex/townhouse 23% +9
13% Mornington Peninsula Melbourne - Outer East
+41 Melbourne - Inner East +47
House 24% Melbourne - West
+9
22%
24%
+52 Melbourne - Inner
House +70
22%
15% Melbourne - Inner South
Group home 15% +11
30%
Map based on Longitude (generated) and Latitude (generated). Color shows sum of 2019SurveyCapacity. The marks are labeled by sum of 2019SurveyCapacity and Sa4 Name16. Details are shown for SA4. The data is filtered on Ste Name16, which keeps Victoria. The
Group home view is filtered on sum of 2019SurveyCapacity, which includes values greater than or equal to 1.
30%
0%
0% 5%
5% 10% 15%
10% 15%20%20%
25% 25%
30% 30% 35% 45%
35% 40% 40% 45%
Warrnambool and South West Melbourne - South East
+9 Geelong +30
VIC
VIC National
National +25
VIC – SDA new supply by Design Category
39%
Apartment
35%
Mornington Peninsula
5%
Improved Liveability +41
16%
Villa/duplex/townhouse 23%
13% Key
Fully Accessi ble 20%
17%
SA4 name
House 24% + New SDA supply
6% 22% Map based on Longitude (generated) and Latitude (generated). Color shows sum of 2019SurveyCapacity. The marks are labeled by sum of 2019SurveyCapacity and Sa4 Name16. Details are shown for SA4. The data is filtered on Ste Name16,
Robust
4% view is filtered on sum of 2019SurveyCapacity, which includes values greater than or equal to 1.
15%
Group home
High Physical Support
69%
30%
63%
0%
0% 5%
10% 10%
20% 15% 40%
30% 20% 50%
25% 60%
30% 70%
35% 80%
40% 45%
VIC
VIC National
National
SPECIALIST DISABILITY ACCOMMODATION – Supply in Australia 15Map 3: Queensland – New SDA development
Queensland State overview
New SDA development is concentrated
around Brisbane, with some development
in the Gold Coast and Townsville.
QLD – SDA new supply by Building Type 62%
Apartment
35%
62%
Apartment
Villa/duplex/townhouse 30%
35%
13%
Villa/duplex/townhouse 30%
13%
House 3%
22%
House 3%
22%
5%
Group home 5%
Group home 30%
30%
0% 0% 10%
10% 20%
20% 30%
30% 4 0%4 0% 50% 50%
60% 60%
70% 70%
QLD
QLD National
National
QLD – SDA new supply by Design Category
8%
Improved Liveability
16%
Fully Accessi ble 1%
17%
Key
Robust 4%
4% SA4 name
+ New SDA supply
87%
High Physical Support
63%
0% 20% 40% 60% 80% 100%
QLD National
16 SPECIALIST DISABILITY ACCOMMODATION – Supply in AustraliaMap 4: South Australia – New SDA development
2019Survey
2019Survey
New SDA supply
South Australia overview
1 191
New SDA development is occuring mainly
in Adelaide and the south-east.
South Australia - Outback Barossa - Yorke - Mid North
SA – SDA new supply by Building Type
+8
+6
16%
Apartment
35%
16%
Apartment
35%
Villa/duplex/townhouse 18%
13% Barossa - Yorke - Mid North
+6
Villa/duplex/townhouse 18%
13%
66% Adelaide - Central and Hills Adelaide - North
House +68 +77
22% 66%
House
22% South Australia - South East
+28
0%
Group home 0%
Group home 30% Adelaide - West
30%
+68
0% 0% 10%
10% 20%
20% 30%
30% 40% 5 0% 5 0%60%
40% 60%
70% 70%
Map based on Longitude (generated) and Latitude (generated). Color shows sum of 2019SurveyCapacity. The marks are labeled by sum of 2019SurveyCapacity and Sa4 Name16. Details are shown for SA4. The data is filtered on Ste Name16, which keeps South Australia.
The view is filtered on sum of 2019SurveyCapacity, which includes values greater than or equal to 1.
SA
SA National
National Adelaide - Central and Hills
+68
Adelaide - South
SA – SDA new supply by Design
16%
Category +81
Apartment
35%
46%
Improved Liveability
16%
18%
Villa/duplex/townhouse
13% South Australia - South East
Fully Accessi ble 22% +28
17%
House 66%
7%
22%
Robust
4%
Key
0% SA4 name
Group home 24% + New SDA supply
High Physical Support 30%
63%
0%
0% 10%
1 0% 20%
20% 30% 40%40% 50%
30% 5 0%60% 60%
70% 70%
SA
SA National
National
Map based on Longitude (generated) and Latitude (generated). Color shows sum of 2019SurveyCapacity. The marks are labeled by sum of 2019SurveyCapacity and Sa4 Name16. Details are shown for S
The view is filtered on sum of 2019SurveyCapacity, which includes values greater than or equal to 1.
SPECIALIST DISABILITY ACCOMMODATION – Supply in Australia 172019Survey
Map 5: Tasmania – New SDA development
Tasmania overview
Limited SDA development was reported for
Tasmania, with known activity in the north-east
and north-west.
TAS – SDA new supply by Building Type
0%
Apartment
35%
0%
Apartment
35%
Villa/duplex/townhouse 0% West and North West
13% +10
Villa/duplex/townhouse 0%
13% Launceston and North East
House 14% +4
House 14% 22%
22%
86%
GroupGroup
homehome 86%
30%
30%
0% 0% 10%
10% 20%
20% 30%
30% 4 40%
0% 50%
50%60%60%
70% 70%
80% 80%
90% 90%
TAS National
TAS National
TAS – SDA new supply by Design Category
0%
Apartment
35%
0%
Improved Liveability
16%
Villa/duplex/townhouse 0%
13% Key
Fully Accessi ble 86%
17% SA4 name
House 14% + New SDA supply
Robust 14% 22%
4%
86%
HighGroup
Physicalhome
0%
Support 30% 63%
0% 10%
0% 10% 20%
20% 30%
30% 40%
4 0%50%50%60% 60%
70% 80%
70% 90%
80% 90%
TAS National
TAS National
Map based on Longitude (generated) and Latitude (generated). Color shows sum of 2019SurveyCapacity. The marks are labeled by sum of 2019SurveyCapacity and Sa4 Name16. Details are shown for
view is filtered on sum of 2019SurveyCapacity, which includes values greater than or equal to 1.
18 SPECIALIST DISABILITY ACCOMMODATION – Supply in Australia2019Survey
New SDA supply
1 191
Map 6: Western Australia – New SDA development
2019Survey
Western Australia overview
Known new SDA development is occurring
north of Perth and in Mandurah.
WA – SDA new supply by Building Type Perth - North West
+14
100%
Apartment
35%
100%
Apartment
35%
Villa/duplex/townhouse 0%
13%
Villa/duplex/townhouse 0%
13%
House 0%
House 0% 22%
22%
Perth - North West
0%
GroupGroup
home home
0% +14
30%
30%
Mandurah
+2
0%0% 20%
20% 40%
40% 60%
60% 80% 80% 100% 120%
100% 120%
WA National
WA National
WA – SDA new supply by Design Category
100%
Apartment
35%
13%
Map based on Longitude (generated) and Latitude (generated). Color shows sum of 2019SurveyCapacity. The marks are labeled by sum of 2019SurveyCapacity and Sa4 Name16. Details are shown for SA4. The data is filtered on Ste Name16, which keeps Western
Improved Liveability
16%
Australia. The view is filtered on sum of 2019SurveyCapacity, which includes values greater than or equal to 1.
Villa/duplex/townhouse 0%
13%
Fully Accessi ble 0%
17%
Key
0% SA4 name Mandurah
House
Robust 0% 22% + New SDA supply +2
4%
0%
Group home
High Physical Support
88%
30% 63%
0%
0% 20%
20% 40%
40% 60%
60% 80%
80% 100%
100% 120%
WA National
WA National
Map based on Longitude (generated) and Latitude (generated). Color shows sum of 2019SurveyCapacity. The marks are labeled by sum of 2019SurveyCapacity and Sa4 Name16. Details are shown for SA4. The data is filtered on Ste Na
Australia. The view is filtered on sum of 2019SurveyCapacity, which includes values greater than or equal to 1.
SPECIALIST DISABILITY ACCOMMODATION – Supply in Australia 19Map 7: ACT and Northern Territory – New SDA development
Territories overview
ACT – SDA new supply by Building Type 63%
Apartment
35%
63%
Apartment
35%38%
Villa/duplex/townhouse
13%
Villa/duplex/townhouse 38%
13%
House 0%
22%
House 0%
22%
0%
Group home 0%
Group home 30%
30%
0% 0% 10%10% 20%
20% 30%
30% 4 0% 50%50% 60%
4 0% 60%70% 70%
ACT
ACT National
National
ACT – SDA new supply by Design Category
63%
Apartment
35%
0%
Improved Liveability
16%
Villa/duplex/townhouse 38%
13%
Fully Accessi ble 0%
17%
0% Key
House
0% 22% SA4 name
Robust
4%
+ New SDA supply
0%
Group home 100%
High Physical Support 30%
63%
0%0% 10%
20% 20%
40% 30%
60% 4 0%
80% 50%
100% 60%
120% 70% No data recorded
ACT
ACT National
National
20 SPECIALIST DISABILITY ACCOMMODATION Supply in AustraliaModelling SDA undersupply Where is the
SDA undersupply?
In the 2018 report Specialist Disability At a jurisdiction level, the Market Insights report Introduction to maps
Accommodation Market Insights, modelled supply found significant undersupply of SDA places in
of existing SDA (based on the number of people NSW, Victoria, Queensland and WA. This does not The following maps combine the location
receiving disability accommodation services under take into account any existing SDA stock which of the new SDA supply (drawn from
the pre-NDIS system) and indication of areas may need to be replaced. The results from this survey results) with the analysis of SDA
of undersupply was mapped across Australia. report (summarised in Table 5) indicate that an early undersupply published in 2018. The tables
start has been made to develop new SDA places, following indicate the modelled shortfall
“Undersupply” was modelled in that report using based on the Market Insights report, less
but there is a long way to go to make up the SDA
a proxy indicator of SDA supply from pre-NDIS
supply shortfall. the new supply from the survey.
administrative data (refer to Technical Notes, p.41).
Note: The data sources used in Table 5 and the
following maps are not based on NDIS SDA data
(due to the limitations on availibility). Analysis of
enrolled SDA ‘new build’ supply data available
Table 5 – SDA modelled undersupply from the NDIA is provided on p.35.
after existing and new supply
Existing SDA National distribution of SDA shortfall
New SDA Supply*
residents (pre-NDIS) SDA places (per capita) (places)**
Australian Capital
32 212 471 227
Territory
New South Wales 635 5,738 9,029 2,658
Northern Territory 0 165 286 121
Queensland 99 3,340 5,656 2,217
South Australia 336 1,720 1,998 -59
Tasmania 14 511 603 80
Victoria 386 4,262 7,210 2,559
Western Australia 16 1,580 2,871 1,341
National 1,518 17,528 28,124 9,144
*Reported from survey **Takes into account reported new supply
21Map 8: New South Wales – SDA undersupply
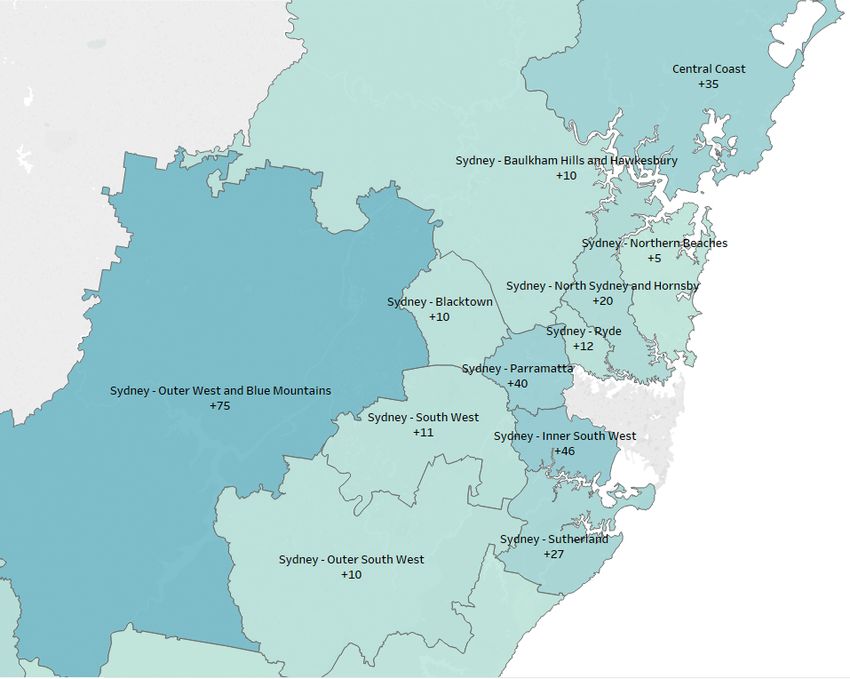
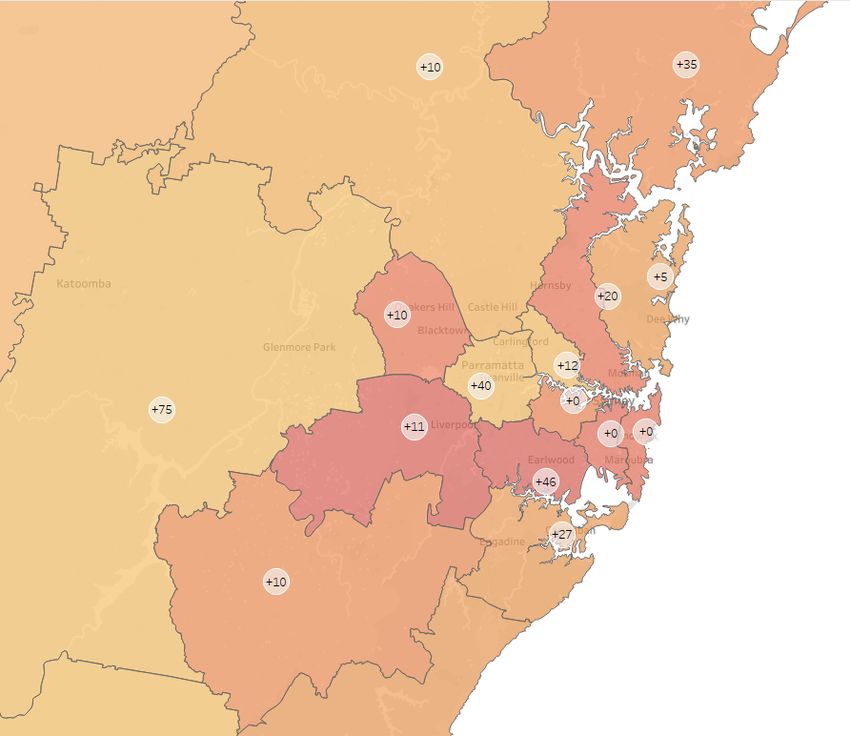
Highest areas of SDA undersupply
New SDA SDA shortfall
SA4
supply (places)* (places)**
Sydney - Inner
46 352
South West
Sydney - South
11 344
West
Sydney - City
0 291
and Inner South
Sydney - Eastern
0 262
Suburbs
Sydney - North
20 243
Sydney & Hornsby
NSW 635 2,658
*Reported from survey
**Takes into account reported new supply
Key
+1
New SDA supply
SDA undersupply per capita
22 SPECIALIST DISABILITY ACCOMMODATION – Supply in AustraliaMap 9: Victoria – SDA undersupply
Highest areas of SDA undersupply
New SDA supply SDA shortfall
SA4
(places)* (places)**
Melbourne -
30 582
South East
Melbourne -
52 494
West
Melbourne -
70 435
Inner
Geelong 25 287
Melbourne -
19 256
North West
VIC 386 2,559
*Reported from survey
**Takes into account reported new supply
Key
+1
New SDA supply
SDA undersupply per capita
SPECIALIST DISABILITY ACCOMMODATION – Supply in Australia 23Map 10: Queensland – SDA undersupply
RevisedShortfall
Highest areas of SDA undersupply
New SDA SDA shortfall
SA4
supply (places)* (places)**
Gold Coast 15 399 +9
Brisbane - South 10 233
Brisbane
6 192
Inner City
+28
Sunshine Coast 0 191
+10
Logan -
0 188
Beaudesert +2
+6
+0
QLD 99 2,217 +10 +0
*Reported from survey
**Takes into account reported new supply
Key
+4
+1
New SDA supply
+15
SDA undersupply per capita
Map based on Longitude (generated) and Latitude (generated) and Latitude (generated). The marks are labeled by sum of 2019SurveyCapacity. Details are shown for SA4. For pane Latitude (generated): Color show
The data is filtered on Ste Name16, which keeps Queensland.
24 SPECIALIST DISABILITY ACCOMMODATION – Supply in AustraliaMap 11: South Australia – SDA undersupply
RevisedShortfall
Highest areas of SDA undersupply
New SDA SDA shortfall
SA4
supply (places)* (places)**
+6
Barossa - Yorke -
6 73
Mid North
South Australia -
8 54
Outback
South Australia -
28 35
South East
+77
Adelaide -
68 25
Central and Hills +68
Adelaide - West 68 -16 +68
SA 336 -59
+81
*Reported from survey
**Takes into account reported new supply Key
+1
New SDA supply
SDA undersupply per capita
Map based on Longitude (generated) and Latitude (generated) and Latitude (generated). The marks are labeled by sum of 2019SurveyCapacity. Details are shown for SA4. For pane Latitude (generated): Color shows sum
The data is filtered on Ste Name16, which keeps South Australia.
SPECIALIST DISABILITY ACCOMMODATION – Supply in Australia 25Map 12: Western Australia – SDA undersupply
Highest areas of SDA undersupply
New SDA SDA shortfall
SA4
supply (places)* (places)**
Perth - North West 14 288
Perth - South West 0 279
Perth - South East 0 144
Western Australia -
0 140
Wheat Belt
Perth - Inner 0 139
WA 16 1,273
*Reported from survey
**Takes into account reported new supply Key
+1
New SDA supply
SDA undersupply per capita
26 SPECIALIST DISABILITY ACCOMMODATION – Supply in AustraliaMap 13: ACT and Northern Territory – SDA undersupply
RevisedShortfall
Highest areas of SDA undersupply -434 581
New SDA SDA shortfall
SA4
supply (places)* (places)**
ACT 32 227
New SDA SDA shortfall
SA4
supply (places)* (places)** +32
Darwin 0 79
Northern Territory
0 42
- Outback
NT 0 121
*Reported from survey
**Takes into account reported new supply
Map based on Longitude (generated) and Latitude (generated) and Latitude (generated). The marks are labeled by sum of 2019SurveyCapacity. Details are shown for SA4. For pane Latitude (generated): Color shows sum of Revised Shortfall.
The data is filtered on Ste Name16, which keeps Australian Capital Territory.
SPECIALIST DISABILITY ACCOMMODATION – Supply in Australia 27Map 14: Tasmania – SDA undersupply
Highest areas of SDA undersupply
New SDA SDA shortfall
SA4
supply (places)* (places)**
Launceston and
4 31
North East
Hobart 0 29
South East 0 21
West and
10 -1
North West
Tasmania 14 80
*Reported from survey
**Takes into account reported new supply
Key
+1
New SDA supply
SDA undersupply per capita
28 SPECIALIST DISABILITY ACCOMMODATION – Supply in AustraliaSDA provider
profiles
Kirby’s story The following four SDA providers, profiled
with one of their current projects, are
among the many providers who responded
to this survey. These profiles provide some
Kirby was a teacher working with special needs children. At 25 she bought her first home. of the stories behind the early new SDA
projects. They represent a range of not-for-
A stroke after surgery for a brain tumour when she was 28 changed everything.
profit providers – some well-established,
She was left paralysed and had to move into aged care to access rehabilitation.
some new – developing a variety of
She lived in aged care for a year before moving back to live with her mum and dad. SDA housing. Two of the projects are
Over the next two years the family worked towards Kirby’s eventual move in 2018 representative of SDA projects currently
to her own unit – an SDA high physical support category build that she purchased in the development pipeline that started
from an SDA developer. The unit is one of four in a development in regional Victoria. their early stages of development prior to
the SDA Pricing and Payments Framework
“I wouldn’t have been able to move out and in to my own unit without the SDA
being introduced in 2016. Three of the
funding in my NDIS plan,” Kirby said.
projects also highlight the important role
“I got in at the planning stage of the units. Being involved with the developer was good. of state and local government in providing
He was understanding and I made choices about the way I wanted my unit - like blinds access to well-located sites ideal for
I can operate myself, and tiles and flooring – to make it more my own.” SDA developments.
Independent living has brought choice and control back into Kirby’s life.
“I felt a big change coming through the doors, a sense of freedom,” she said. “It felt like
when I used to live on my own before.
“It feels good to make my own choices. I have my own space and I can choose what
I want to do and when I want to do it. It’s just the normal things I wanted.”
Having ticked off her goal of moving in to a home of her own, Kirby now has her sights
set on a return to school and study.
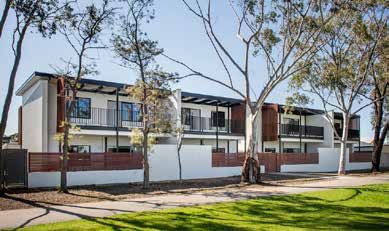
29Melba Support Services/Community Housing Limited
Melba Support Services is a disability support The project inception predated the introduction of The land for the project was purchased from
and accommodation provider established in the SDA Pricing and Payment Framework and is the Uniting Church by Melba, with agreement that
in 1972 by a group of parents that wanted to now under construction and due for completion Melba could use the church building on site to run
provide services for their children. Melba provides in early 2020. disability services and programs, but it would still
day programs and individual support, runs nine be used for the congregation to come together
The project is being undertaken collaboratively
group homes and will soon deliver DHHS services for church services, weddings and funerals.
with Melba Support Services and Community
in group homes across Victoria. The majority of
Housing Ltd (as developer). Community Housing The project has funding support from the
people Melba support have complex disability
Ltd will be the tenancy manager, and Melba will Victorian Property Fund, Melba Support
support needs.
provide 24/7 on-site support. Services, and Community Housing Ltd.
Originating in Victoria in 1993, Community
The development is in the heart of Lilydale, close
Housing Limited (CHL) has spread its operations
to shops, health services and other amenities, Regardless of how good our group
to South Asia, South-East Asia and South
and is a 10-minute walk or wheelchair ride to homes are, people want their
America. CHL currently has a portfolio of more
the train station. independence, they want to live
than 9,000 properties under management in
Australia across six states including Victoria, New The development comprises 15 dwellings, of with whom they choose, and we
South Wales, Western Australia, South Australia, which 11 are intended for SDA tenancies. The regard this as a human right.
Queensland and Tasmania. remaining four dwellings will be built to Livable
Housing Australia Platinum standard, which will
Melba regularly surveys the people they support,
ensure the units are customisable in the future.
including questions about their satisfaction with
They will be available as general community
current living arrangements. It was clear that
housing for people with disability. There is also
some of the people that they supported were
one dwelling suitable for housing a family.
not living where they wanted, or with whom
they wanted. Melba decided to do something
about this, and so the Anderson Street project in
Lilydale, Victoria, came to fruition.
30 SPECIALIST DISABILITY ACCOMMODATION – Supply in AustraliaAccess 2 Place
Access 2 Place Housing (A2P) is a community The project is being funded by A2P through
housing provider in South Australia with a focus investment from the organisation’s reserves and
on high needs disability housing. A2P aim for finance from Homestart Finance. The South
their homes to be accessible, affordable, secure Australian Government provided the land,
and appropriate to the person living in it. They are following a tender process.
guided by the understanding that their tenants
Tenants were sourced through referrals from
want to live just like anyone else does – they want
support providers, transfers from existing Access
an independent life, and to live in a home that
2 Place Housing homes, and via the Summer
allows them to flourish.
Foundation’s website, The Housing Hub.
A2P’s latest SDA development is in Adelaide.
Support arrangements are left to the choice of
The development has 10 dwellings: two
tenants. Most tenants on site have a different
2-bedroom homes, and four 1-bedroom
support provider, and A2P has not had any issues
apartments at ground level. These homes
with “traffic” of support providers coming on site.
all meet the Platinum standard. The upper floor
has a further four 1-bedroom apartments.
We don’t want to build houses
An additional on-site space, The Hub, provides
which stand out from the
an opportunity for support providers to stay
overnight if the tenants require 24/7 support. streetscape as ‘the disability
If this isn’t required, the space can be leased as house’. Our future developments
another two-bedroom home. The purpose of this will involve a co-design process
space has not been determined yet, but tenants to ensure we are building
of the development are in discussions with the to the needs of the
tenant engagement team to decide what they disability community.
would like to do with it. Tenants look after their
own support arrangements, as it minimises risk
and helps them support their tenancies.
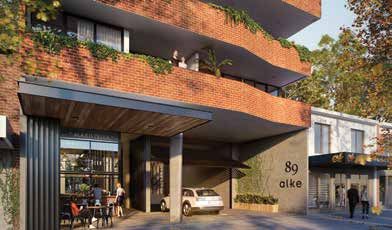
SPECIALIST DISABILITY ACCOMMODATION – Supply in Australia 31Summer Housing
Summer Housing is a registered SDA provider These dwellings have been acquired and designed
with a mission to expand the range and scale specifically for young people with disability. ummer Housing’s vision is to see all
S
of diverse housing options for people with Priority is given to young people with high support people with disability and complex
disability living in, or at risk of admission to, needs who are living in an aged care facility or care needs have the opportunity
residential aged care, particularly younger people. are at risk of entering aged care. The shared to live in high quality housing that
Established in 2017, Summer Housing aims not support model allows tenants to jointly select one enables them to live as independently
only to provide better lives and promote choice Supported Independent Living provider to provide as possible, enhancing their health,
and control for its tenants, but also role model 24-hour back up assistance as and when required. wellbeing and participation in
best practice outcomes through providing an Their daily one-to-one supports are provided by the community.
open source to all intellectual property. their own chosen support provider.
Summer Housing has recently acquired 11 An institutional social infrastructure investor has
apartments in the View development in Rockdale, financed Summer Housing’s View apartments.
New South Wales - 13km from Sydney CBD. The Summer Housing has acquired the 10+1
apartments are peppered throughout the 91-unit apartments and will receive a financial return
private residential development across 11 levels. to service third party debt funding, comprising
View features three retail tenancies, a garden the tenants’ rent contribution (which, under SDA
terrace situated on the fourth floor, and is within requirements, is capped at 25% of the disability
500 metres of the Rockdale shopping complex. support pension, plus Commonwealth Rent
Assistance) and SDA payments from the NDIS.
The apartments are built to meet SDA
requirements (including Livable Housing Tenants will be sourced and matched to the
Australia’s Platinum level certification). The use development with the assistance of the
of technology and customisable design are a core Summer Foundation, who have been engaged
feature of the Summer Housing model. The View to undertake the tenancy matching services
apartments all contain an accessible bedroom, for the project.
bathroom and kitchen, provision for assistive
and communication technology, and have access
to 24/7 on-site concierge support services.
View Apartments, Rockdale
32 SPECIALIST DISABILITY ACCOMMODATION – Supply in AustraliaYou can also read