Vaughan Growth Progress Report, 2015 - Land Use Planning and Economic Growth Report Preliminary Indicators for Discussion - YorkSpace
←
→
Page content transcription
If your browser does not render page correctly, please read the page content below
Vaughan Growth Progress Report, 2015
Land Use Planning and Economic Growth Report
Preliminary Indicators for Discussion

   Cesare Pittelli                                     Winter/Summer 2015
   MES Planning Candidate, Class of 2015
   Faculty of Environmental Studies, York University
1
Overview
What are we doing?
______
Land use planning has become a dominant force in creating diverse and vibrant communities in the modern
world. This report introduces 16 proposed indicators organized under four key themes to assess the
effectiveness and performance of land use planning and development in the City of Vaughan. The goal is to
implement each theme into the practices of the City, while the indicators are used to monitor the progress of
the implementation. Each theme and indicator proposed in the document is consistent with the City of
Vaughan Official Plan and Vaughan Vision 2020.
Themes and Indicators:
______
Theme 1: Achieving dense, safe, and diverse Theme 2: Making Vaughan a global city
communities Indicator 1: Planning for population and
Indicator 1: Achieving Intensification job growth in intensification areas
Indicator 2: Approving more development Indicator 2: Building infrastructure to
applications at the municipal level connect Vaughan to the world on global
Indicator 3: Residential and employment and regional levels
density at the Vaughan Metropolitan Indicator 3: Participating in the planning
Centre of regional transit linkages
Indicator 4: Density along major transit
routes
Indicator 5: Mixed-land uses
Indicator 6: Publicly accessible space and
community infrastructure
Indicator 7: Creating lit, vibrant, and
walkable streets
Theme 3: Achieving a stable and competitive Theme 4: Achieving growth while maintaining a
economy sustainable environment
Indicator 1: Generating income through Indicator 1: Preserving the Oak Ridges
development charges (approvals) Moraine and Greenbelt
Indicator 2: Creating more jobs in the City Indicator 2: Heritage – preserving local
Indicator 3: Emphasizing the use of local communities and neighborhoods such as
centres and attractions Kleinburg
Figure 1: Vaughan is centrally located in the Greater Golden
Indicator 3: Reducing land consumptions
Horseshoe while still supporting population and
employment growth
Source: City of Vaughan Official Plan
2
                                                                                                 Overview
                                                            Figure 2: Vaughan Population and Employment Growth Projections

Planning for the Future:
______
Vaughan has transformed dramatically since the
1970s, when it began changing from a rural
countryside to an urban centre. Now, the City is
undergoing yet another transformation, from a low-
rise suburban destination, to a global city. By the
1990s, the City had a population of over 100,000
people.1 By 2014, the City of Vaughan had a
population of 318,000, estimated to increase to over
416,000 by 2031, along with 266,100 jobs by that
time (Figure 2).1 As depicted in Figure 3, Vaughan is
one of the fastest growing metropolitan centres in                 Source: City of Vaughan Official Plan
Canada, next to Brampton.2 It has become a premier                 Figure 3: Fastest Growing Canadian Cities
destination for new and growing families, with its
superb suburban style single-family homes at
affordable prices in comparison to neighboring
municipalities around York Region and the rest of the
Greater Toronto Area, depending on the housing
type, as illustrated in Figures 4, 5, and 6. It is also
growing its employment opportunities and will
become a critical component to the economic success
of Canada and Ontario in the future.

Given the steady growth in population and jobs, it is
crucial that the City of Vaughan plans in a manner
that will accommodate future expansion and take
advantage of its many opportunities to gain global
recognition. Planning for resource and land uses to
accommodate future growth is critical to the success
of the City on social, economic, and political scales. If
the City does not manage its resources and land uses
effectively, it will experience more congestion, more
pollution, challenges with infrastructure growth and
housing supply, and a decrease in the number of jobs.
 Figure 4: Total Number of Resales and Average Price (all    Figure 5: 2013 Resales & Average Prices by Local
 dwelling types) by Local Municipality, 2012 and 2013        Municipality and Dwelling Type

                                                            Source: York Region Growth and Development Review, 2013
Source: York Region Growth and Development Review, 2013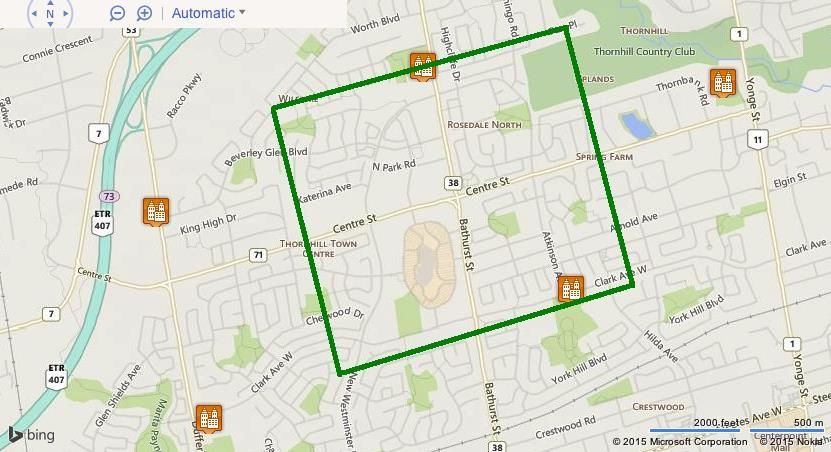
3
                                                                                             Overview
   Figure 6: York Region New Home Prices ($1,000s)

                                                             Source: City of Vaughan, 2015

                                                          What Exists?
Source: York Region Growth and Development Review, 2013   The City of Vaughan has already developed many
                                                          strategic plans and initiatives to guide future growth.
The Report:
______
The City of Vaughan Land Use Planning and                 Green Directions Vaughan:
Economic Growth Report (Vaughan Growth
Progress Report) sets a framework for
                                                          _____
                                                          Green Directions Vaughan is the City’s Community
development and environmental initiatives
                                                          Sustainability and Environmental Master Plan.3 This
across five amalgamated towns (Woodbridge,
                                                          is a long-term plan developed to guide the City to a
Maple, Thornhill, Concord, and Kleinburg) in
                                                          more sustainable future environmentally, culturally,
order to ensure the success and stability of its
                                                          socially, and economically.3 The plan is designed to
land, economy, and residents. The Report works
                                                          establish key principles of sustainability, which will
together with other City-wide and provincial
                                                          be used in the development of other initiatives and
initiatives, including the Vaughan Official Plan,
                                                          master plans to achieve a healthy natural
Vaughan Vision 2020, Green Directions Vaughan,
                                                          environment, vibrant and diverse communities, and
Greenbelt Plan, 2005, and the Oak Ridges
                                                          a competitive economy.3
Conservation Plan.

The Vaughan Growth Progress Report and its
proposed indicators are directly linked to the
themes expressed in the documents listed above,
namely the Vaughan Official Plan and the
Vaughan Vision 2020. The Growth Report
emphasizes community safety, environmental
sustainability, growth, economic well-being,
heritage protection, efficient transportation
networks, and better municipal services and
infrastructure.

Measuring Progress:                                        Source: City of Vaughan, 2015

The Report consists of four themes supported by
its indicators (listed on Page 2) to measure the
progress of maturation. The objective of the
Report is for the City to consider each theme
when making decisions regarding land use
planning and land development.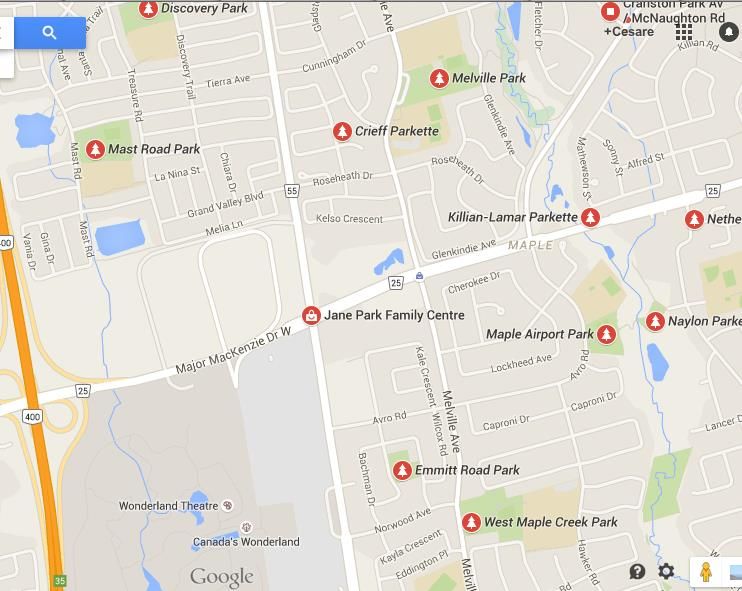
4
                                                                                           Overview

 Sustainability Metrics Initiative:
 _______
 The Sustainability Metrics Initiative, which is
 considered in the review of development applications
 across the City, meets a specific objective of Green
 Directions Vaughan, to create a City with sustainable
 built form.4 The main purpose of implementing the
 initiative in the development review process is to
 reduce the overall ecological footprint of new
 development or redevelopment projects.4 The City of
 Vaughan, in partnership with the City of Brampton and
 the Town of Richmond Hill, developed the initiative as
 a tool to achieve healthy, complete sustainable
 communities.4 The tool presents the City with a
 sustainability scoring system by using a set of Metrics
 to quantify the sustainability of new developments.4

                                                             Figure 7: Vaughan Vision Strategic Goals
Source: City of Vaughan, 2015

 Vaughan Vision 2020:
 ______
 The Vaughan Vision 2020 is the City of Vaughan’s
 Strategic Plan, which sets out a vision and direction
 for the City to the year 2020.5 The three major
 strategic goals outlined in the vision, as illustrated in
 Figure 7, are Service Excellence, Staff Excellence, and
 Organizational Excellence.5 The Plan also outlines
 Priority Strategic Initiatives, which include
 developing the plan required to build a dynamic
 Vaughan Metropolitan Centre, further evolving
 performance indicators, developing and
 implementing a Corporate-wide Asset Management
 System, and additional operational/business
 reviews.5
                                                                 Source: City of Vaughan, 2015

     Source: Places to Grow, 2006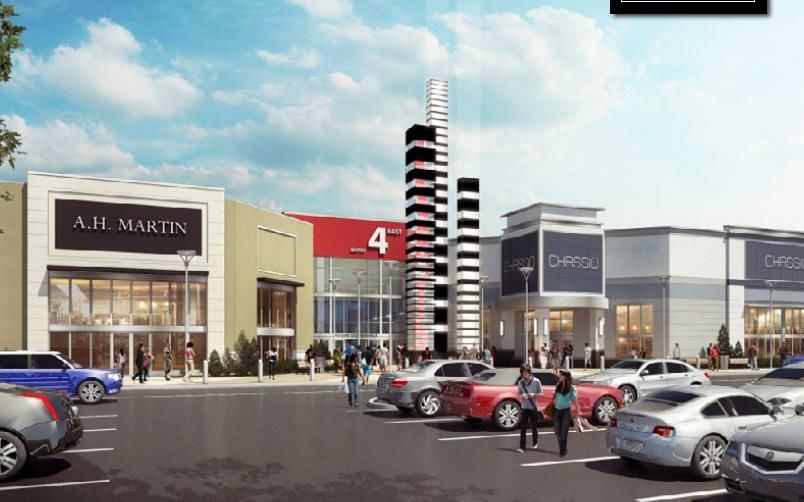
5
                                               Achieving dense, safe, and diverse communities

                                               Theme 1: Achieving dense,
                                               safe, and diverse communities
Source: Places to Grow, 2006

This Report supports the creation of more intensified, safe, and diverse neighborhoods across the City
of Vaughan. Achieving these types of vibrant, mixed-use communities enables Vaughan to plan for and
manage future population and employment growth in an effective manner. Mixed-use developments
allow residents to live, work, and play close to home. It also offers an “eyes on the street” approach due
to the large amount of people that are able to conduct various activities in one small area, making
them feel more safe.6 The Report recognizes the importance of the environment, as well as the safety
of residents, which is why the development of more intensified and complete communities is widely
supported.
The seven indicators will measure the progress in achieving the goal set out in this theme.

Indicator 1: Achieving Intensification
The indicator:                                            How do we measure?
The number of new residential                             The City analyzed ClearPoint data on the
dwellings constructed within the City.                    amount of development applications
                                                          submitted over the last six years.
Why intensify?
Being that Vaughan is the second fastest                  Results:
growing municipality in Canada, it is                     Findings indicate that the City received 181
crucial that growth is concentrated in                    development applications (OP Amendment,
large numbers in compact areas. Making                    Zoning Amendment, Site Development, Plan of
use of infrastructure in the most built-up                Subdivision, Plan of Condominium, and Part-
areas of the City is critical. This Report                lot Control) in 2009, 188 in 2010, 215 in 2011,
supports an increase in density with                      218 in 2012, 211 in 2013, and 182 in 2014.8
minimal impact on land consumption. The                   From 2007-2010, it was reported that the
Report also supports development in the                   Region of York averaged a 46% intensification
designated intensification areas of                       rate.9 It is evident that from 2009-2012,
Vaughan Mills Centre, Concord/GO Centre,                  Vaughan itself had a significant increase in
and Weston Road and Highway 7. The City                   development applications, rising from 181 to
has recently seen approvals for high-rise                 218. It experienced a small drop in 2013 to
residential developments along Highway                    211, and then decreased rapidly to 182 in
7, where the Vaughan Metropolitan Centre                  2014, back to its 2009 rate.
will also be located. This Report calls for
further intensification of the area in order
to concentrate future population and
employment growth along Highway 7, to
make use of existing hydro and water
infrastructure, as well as the future Bus
Rapid Transit lines. 7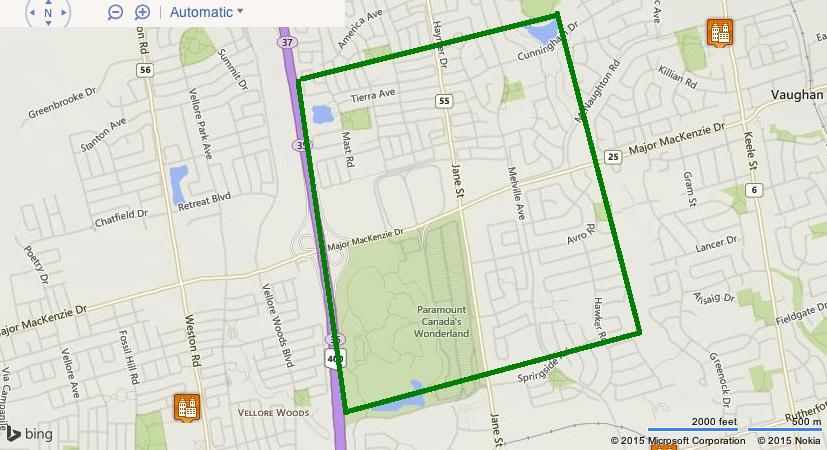
6
                                                      Achieving dense, safe, and diverse communities
Considerations:                                     Figure 8: Number of Development Applications by Type
This indicator was measured in full from
2009-2014, as it has incomplete data for
2015. The City of Vaughan does not have an
intensification rate for itself, as rates were
measured around the GTA by regions (York
Region has a 46% intensification rate), as
depicted in Figure 9, but results can be
measured by the change in applications by
type as depicted in Figure 8. Since the City
has experienced a significant decrease in
development applications in 2014, this
indicator will be used to measure progress
in order to get applications and
intensification rates back to 2012 figures.    Figure 9: Measuring Residential Intensification –
                                                  Average Annual Intensification Rates (2007-2010)

                                                                                              Source: Places to Grow, 2006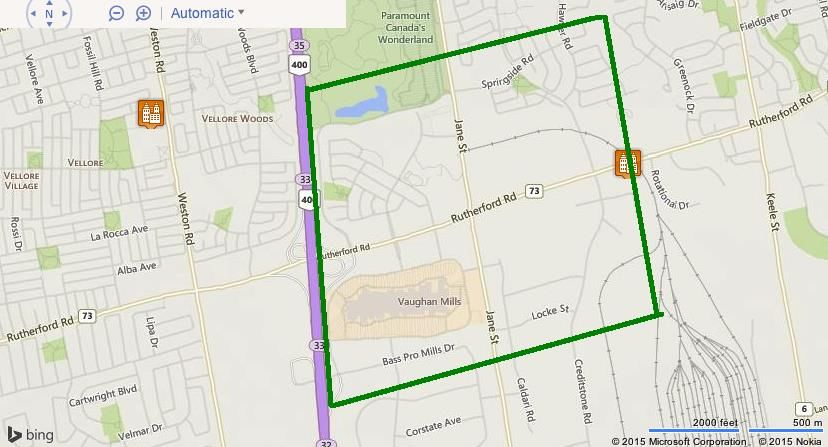
7
                                                      Achieving dense, safe, and diverse communities
Indicator 2: Approving more                                       Results:
                                                                  Measures for the Planning Department from
development applications at                                       2009-2013 indicate that a total of 547 hours were
                                                                  spent at the OMB in 2009, 81 in 2010, 240 in
the municipal level                                               2011, 266 in 2012, and 294 in 2013.10 The Legal
The indicator:                                                    Department spent 270 days on OMB hearings in
The number of development applications                            2009, 101 days for OMB hearings in 2010, 309
approved at city level without having to go to                    days for hearings in 2011, 320 days for hearings
Ontario Municipal Board.                                          in 2012, 600 days for hearings in 2013, and 600
                                                                  days for hearings in 2014.11 A comparison can
Why not OMB?                                                      also be drawn between the amount of time spent
City planners know what is and what is not                        at the OMB with the number of development
needed across the City. They know the geography                   applications received. In 2010, the City spent the
and zoning of the City, what has been approved in                 least amount of time at the OMB, and it was also
the past, and what the plans are for the future.                  one of the years where the City received a lower
This Report supports more applications being                      number of development applications. In 2012-
approved at the municipal level in accordance                     2013, the time spent at the OMB, along with the
with policies and regulations outlined in the                     number of development applications, remained
Official Plan, Vaughan Vision 2020, zoning by-                    consistent. In 2014, the amount of time spent at
law, Provincial Policy Statement, and many other                  the OMB remained consistent with the two
documents, including this Growth Report. In                       previous years, but the number of development
order to spur growth to accommodate the rapidly                   applications received experienced a decrease.
growing population and number of jobs, it will be
more effective for applications to be approved at                 Considerations:
the City level, rather than the OMB. The OMB is a                 The Planning results were only measured based
legislative body created by the provincial                        on 2009-2013 data due to unspecified data for
government to make decisions relating to land                     2014. The Legal Department data for 2014 are
use planning and development. When a decision                     estimated numbers.
is rejected or cannot be reached at the municipal
level, the applicant can appeal to the OMB for a
final decision on the development application.

How do we measure?
The City reviewed data on ClearPoint to
determine the total number of hours spent at
OMB hearings. Data is provided from the
Planning and Legal Departments.

Figure 10: Time spent on OMB Hearings (days & hours) from 2009-2014

Source: ClearPoint Strategy, 2015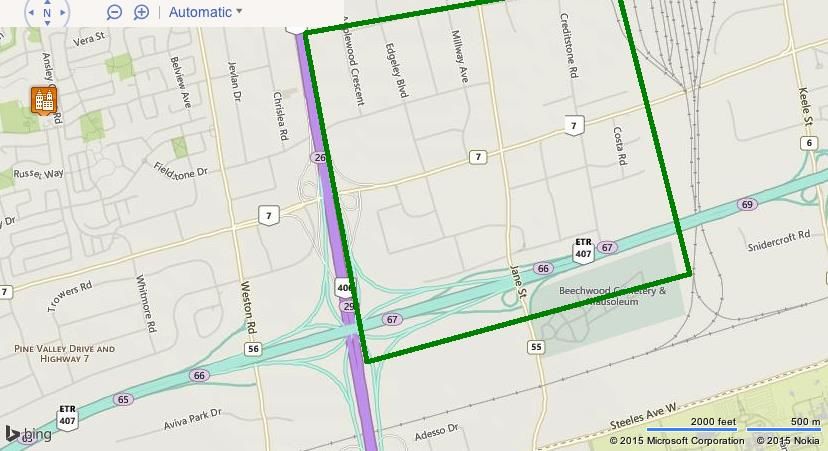
8
                                                    Achieving dense, safe, and diverse communities

Indicator 3: Residential and                                 Results:
                                                             There are approximately 179 hectares of
employment density at the                                    developable land within the area.12 The City is
                                                             calling for a minimum of 1.5 million square feet of
Vaughan Metropolitan Centre                                  office space, 750,000 square feet of retail, 12,000
                                                             residential units, density targets of 200 people
The indicator:                                               and jobs per hectare by 2031, and employment
The number of development applications                       targets of 11,500 jobs, 5,000 of which will be new
approved in the Vaughan Metropolitan Centre,                 office jobs.12 Approved are the Centro Square
along with the height and densities of the                   Condo Development by Liberty13 (one 33-storey
approvals.                                                   and one 31-storey mixed-use building), the Zzen
                                                             and Goldpark Development14 (two 40-storey
                                                             mixed-use buildings), Expo Condos by Cortel15
Why increase density?                                        (37-storey mixed-use building), The Met by Plaza
Similar to Indicator 1, the City must increase               Corp16 (30-storey mixed-use building with 60
densities in approved intensification areas,                 townhouses), and the Smartcentres/KPMG
including the VMC. Being the City’s new                      tower17 (17-storey mixed-use building), all
downtown, providing more residential and                     depicted in Figure 15. The Figure 13 – Height and
employment density to this area is crucial, as it            Density Parameters map also shows the
will make use of the future subway extension to              permitted heights within the VMC study area.
Vaughan, as well as accommodate future
population growth. The VMC will be the new                   Considerations:
transit and employment hub of the City and will              Findings have been measured based on the
create thousands of new jobs and move                        studies and development applications received to
thousands of people in and out of the City each              date and will continue to be measured over time.
week. This Report supports the growth and
expansion of the area, as well as housing                         Figure 12: Height and Density Parameters
thousands of new people in the area.

How do we measure?
The City will analyze the amount of development
applications approved within the VMC, along with
specifying the number of residential, commercial,
office, and industrial units, or the heights and
densities. The City will also determine the
amount of land area to be developed and what
the goals are for the area.
   Figure 11: VMC Plan

 Source: Google Images, 2015                                        Source:VMC Secondary Plan, 2013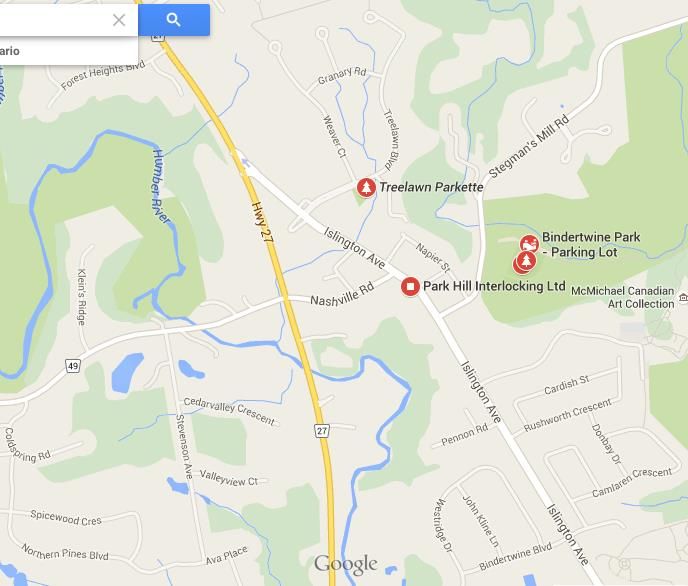
9
                                                  Achieving dense, safe, and diverse communities
 Figure 13: VMC Land Use
                                                      Figure 14: Development Approvals within VMC boundaries

   Source: VMC Secondary Plan, 2013                   Source: City of Vaughan, 2015

Indicator 4: Density along major transit routes
The indicator:                             Results:
The number of residents and jobs           It is anticipated that the VMC, which will be the largest transit hub in
within major transit station areas.        Vaughan in the coming years, will attract 25,000 new residents and
                                           create 11,500 jobs.12 Under the current Transportation Master Plan,
Why increase density?                      the VMC has been outlined as an important intensification area to
Making use of existing and future          utilize future transit.18 Along with the subway extension, York Region
transit in the City of Vaughan is a        is working collaboratively with the City of Vaughan to develop a Rapid
crucial component to this Growth           Transit Corridor along Major Mackenzie Drive, which will generate an
Report. This Report encourages a mix       estimated 2,000 users in the peak hour.18 York Region is also working
of uses, as well as intensification near   closely with the City of Toronto on the Jane Street LRT and Steeles
transit hubs within the City.              Avenue Rapid Transit Corridor, which will attract 1,700 and 2,000
Maximizing land uses to accommodate        users, respectively, during peak hour.18 Finally, York Region is also
population and employment targets, as      studying a possible Bathurst-Dufferin Rapid Transit Corridor to serve
well as attracting new professionals to    approximately 1,200 riders during peak hour.18 Figures 16 and 17
work in the City is critical to the        show the Transportation Plans for the VMC, while Figures 18 and 19
growth of Vaughan.                         illustrate future transit improvements in York Region.
How do we measure?
The City, through its Official Plan, has outlined that            Considerations:
intensification areas must be supported by efficient              Numbers listed in the results are the
transit. The City will measure this progress through the          anticipated number of residents,
review of the number of development applications                  employment, and users for future
approved along major transit routes, including GO, Bus            projects.
Rapid Transit, and subway networks.
10
Figure 15: VMC Transit Network Achieving dense, safe, and diverse communities
Figure 16: VMC Road Network
Source: VMC Secondary Plan, 2013
Source: VMC Secondary Plan, 2013
Figure 17: York Region 5-year Transit Improvement Figure 18: York Region 2031 Transit Improvements
Source: York Region Transportation Master Plan, 2009
Source: York Region Transportation Master Plan, 200911
Achieving dense, safe, and diverse communities
Indicator 5: Mixed-land Uses
The indicator: Considerations:
A mix of land uses in designated growth This indicator is a guide for future
centres within the City, as well as within development to increase the mix and
intensification areas in the City. diversity of land uses across the City.
Results can be measured by the City
Why a mix of land uses? through the amount of mixed-use
Mixed-land uses enable the City of developments that have occurred within
Vaughan to maximize space and land uses the City’s growth and intensification areas.
that will allow people to live, work, and
play in diverse neighborhoods. This will
also minimize travel and potentially Figure 19: Vaughan’s commuter to job ratio
maximize use of public transit hubs.
How do we measure?
The City will ensure that, in conformity
with its Official Plan and this Report, that a
mix of land uses is required for
development within its growth centers in
order to reduce travel. The City will
determine the amount of mixed-land use
developments that have occurred each
year within its growth centers.
Results:
Vaughan, along with Markham, has the Source: Invest in York, 2014
largest number of commuters. In Vaughan,
120,590 residents commute to work and
Figure 20: The future VMC Office Area
135,095 workers commute from outside
of Vaughan to jobs in Vaughan.19 Overall,
41,890 Vaughan residents commute to
jobs located in Vaughan.19 With the ratio of
Vaughan jobs to the total number of
Vaughan commuters at 1.12, all jobs
within Vaughan could employ every
Vaughan commuting resident, plus an
additional 12%.19 In 2001 and 2006, the
ratios sat at 1.30 and 1.25, respectively.19
In total, 31% of Vaughan jobs are filled by
Vaughan residents.19 The construction of
the VMC will only increase these numbers, Source: Google Images, 2015
as it will welcome an estimated 11,500
new jobs and over 25,000 new residents
to the City.1212
Achieving dense, safe, and diverse communities
Figure 21: Community infrastructure
Indicator 6: Publicly
accessible space and
community infrastructure
The indicator:
The number of people across the City
within walking distance of a park or
community centre.
Why measure?
This Report encourages a mix of land uses Figure 22: Parks within 1km buffer at Jane/Rutherford
and vibrant and diverse communities. This
would include accessible community
infrastructure, jobs, and a wide-range of
housing types.
How do we measure:
The City will develop comprehensive maps
of each growth centre with a 1-kilometer
buffer zone, showing parks, schools, and
community centres. The City will then
determine the number of households
within each area.
Results:
Results have been determined for five
major growth centres across Vaughan,
including Major Mackenzie Drive and Jane
Street, Rutherford Road and Jane Street, Source: Google Maps, 2015
Highway 7 and Jane Street, Bathurst and Figure 23: Parks within 1-km buffer at Jane/Major Mackenzie
Centre Streets, and Kleinburg (Islington
Avenue and Nashville Road) depicted in
Figure 21 and on more detailed maps in
Figures 22-31.
Considerations:
The indicator does not consider walking
routes (sidewalks and pathways are not
shown).
Source: Google Images, 201513
Achieving dense, safe, and diverse communities
Figure 24: Parks within 1-km buffer at Jane/Highway7
Figure 25: Parks within 1-km buffer at Bathurst/Centre
Source: Google Maps, 2015 Source: Google Maps, 2015
Figure 26: Parks within 1-km buffer at Nashville/Islington Figure 27: Community centres outside the 1-km buffer at
Jane/Major Mackenzie
Source: Vaughan Maps, 2015
Source: Google Maps, 2015
Figure 28: Community centres within (and outside) 1-km
buffer at Jane/Rutherford
Figure 31: Community centres outside 1-km buffer at
Figure 30: Community centres within (and outside) 1-km buffer at Islington/Nashville
Bathurst/Centre Source: Vaughan Maps, 2015
Source: Vaughan Maps, 201514
Achieving dense, safe, and diverse communities
Indicator 7: Creating lit, vibrant, and walkable streets
The indicator: Results:
Vibrant main and side streets in the City The results will be developed with the review of
allow for more pedestrian flow and development applications over time. The VMC
connections through communities. plans are a prime example of creating a mix of
Adequate lighting and walkability in uses, leading to a vibrant streetscape. Crime rates
various communities across the City of from 2012/2013 and 2013/2014 are depicted in
Vaughan is also encouraged to ensure Figures 33-34, which show a decrease in total
safety for residents. criminal violations from 2012-2014.
Why measure? Considerations:
This Report encourages the Jane Jacobs’ This Report should be used to guide future
notion of “eyes on the street”6 to ensure development practices within the City to ensure
vibrancy and safety throughout the City. The vibrancy and pedestrian connectivity in the City.
objective of this indicator is to create This indicator conforms with the Vaughan Vision
pedestrian connections to various shopping 2020, which outlines community safety as one of
opportunities, jobs, and community the main themes. Crime data is from 2012-2014
infrastructure for residents. The City of and does not include 2015.
Vaughan has a reputation for being one of the
safest cities in Canada. Another goal of this Figure 32
indicator is to maintain this image by
reducing the amount of crime in the City and
make it a destination for new residents.
How do we measure?
In approving future development plans, the
City will ensure that adequate pedestrian
connections to outer communities and within
the site are established through the Source: Google Images, 2015
Sustainability Metrics Initiative. Also, using
data from York Regional Police, the City can Figure 33: 2012/2013 Vaughan Crime rates
determine a rise or fall in crime rates in the
future.
Source: Places to Grow, 2006
Source: York Regional Police, 201315
Achieving dense, safe, and diverse communities
Figure 34: 2013/2014 Vaughan Crime Rates
Source: York Regional Police, 201416
Making Vaughan a world-class city
Theme 2: Making
Vaughan a world-
class city
Source: Google Images, 2015 Source: Google Images, 2015
The Vaughan Growth Progress Report considers the importance of the City being recognized on a global
scale. Being the second-fastest growing municipality in Canada, this theme will serve as a framework to
putting Vaughan on the map as a global competitor. It recognizes the significance of planning for economic
growth through increased job opportunities, planning for the intensification of urban growth centres in
the coming years, planning for regional transit linkages with neighboring municipalities, and building
large-scale infrastructure required to make Vaughan a global destination.
Indicator 1: Planning for How do we measure?
The City will ensure that, in conformity with its
population and job growth Official Plan, Secondary Plans, and zoning By-law,
efficient infrastructure and living improvements
in intensification areas are made to various communities within the City
The indicator: in order to ensure that growth can be adequately
Improving living conditions, jobs, accommodated. The City will measure progress
infrastructure, and quality of life in through the review of applications for new
intensification corridors to accommodate developments and permits for City infrastructure
growth of the City. improvements.
Why measure? Results:
The City of Vaughan has experienced a Existing high density residential, coupled with a
significant amount of growth since it was wide variety of shopping amenities in the Vaughan
established in the 1970s and will continue Mills area (Figures 36-38: Jane and Rutherford) is a
to grow into the future. Being the second prime example of how other intensification areas
fastest growing metropolitan centre in the around the City should be planned. The Vaughan
country,2 the City must plan accordingly in Mills Secondary Plan projects that the four main
order to ensure exceptional quality of life study areas in the plan will hold a combined
for all its citizens. The development of population of 7,839 residents and 10,912 jobs.21
more intensified and complete Planning in such a manner will allow many of those
communities will allow people to live, who live in Vaughan to work and shop here as well.
work, and play in one area, thus providing Similarly, the VMC area has also planned for
convenient living conditions for residents. significant population and job growth in its
Figure 35: Existing high rise residential at Bathurst and Centre secondary plan, projecting to host 11,500 new jobs
and 25,000 people.12 The Bathurst and Centre area,
home to many existing high-rise residential
buildings, is only continuing to grow (Figure 35).
This area also provides Vaughan residents with the
opportunity to live, work, and shop all in one area,
with Promenade Mall and various plazas and
Source: Google Images, 2015
grocery stores within close proximity of the
residential towers and low rise subdivisions.17
Making Vaughan a world-class city
Considerations: Figure 37: Vaughan intensification areas
The indicator is a guide to ensure future
accommodation for population and job growth in
tandem with the Official Plan and Secondary Plans.
Figure 36: Land Use Plan for Vaughan
Mills area.
Source: City of Vaughan Official Plan, 2010
Source: Vaughan Mills Secondary Plan, 2014
Figure 38: High
rise residential at
Jane/Rutherford.
Source: Vaughan
Mills Secondary Why measure?
Plan, 2014
Since the City of Vaughan is the second fastest
growing metropolitan centre in Canada, it is only
fitting that it begins building and establishing itself on
a global and regional scale. Large-scale municipal
Indicator 2: Building infrastructure projects, such as hospitals and transit
infrastructure to connect will help in making Vaughan as well known and
visited as its neighboring Toronto.
Vaughan to the world on
global and regional levels How do we measure?
Being that there are already plans in place and land
secured to build a hospital, the City will ensure that
The indicator: the project transitions smoothly until its completion.
Develop plans to build large infrastructure to
Vaughan will also turn its attention to other large
make the City a global and regional destination.
projects, such as extending transit connections. The
Spadina Subway extension and the Highway 7 Bus
Figure 39: The Rapid Transit connection to Markham are progress to
start of a more transit-oriented future in Vaughan. Progress
construction on will be measured throughout the construction
the new Vaughan process of the hospital and over time in planning for
hospital site.
other large-scale infrastructure projects.
Source: Mackenzie Health, 201518
Figure 40 Making Vaughan a world-class city
Results:
The City of Vaughan has acquired 82 acres on the
northwest corner of Major Mackenzie Drive and
Jane Street for a new hospital, as well as 5 acres
south of Major Mackenzie Drive as a potential
future transit hub.22 The hospital, a project
estimated to be worth over $1 billion with the
province providing $58 million and residents
paying for the $80 million land value through a
3D models
surcharge on taxes,23 was granted an early work illustrating the
preparation in July 2014 in order to be completed Figure 41 Vaughan hospital
on schedule.22 The construction on the site is set upon completion.
to begin in the 2015/2016 fiscal year and last Source: Vaughan,
approximately 3-4 years, with a targeted opening 2013
date in 2019.22 The Spadina Subway extension,
which will be an 8.6-kilometer stretch from
Downsview Station to the VMC, is a $2.6 billion
project jointly funded by the Federal Government
of Canada ($697 million), the Province of Ontario
($870 million), the City of Toronto ($526 million),
and York Region ($352 million).24 The line was Figure 42: Future BRT stop on Highway 7 at the VMC.
originally scheduled to be open for use in 2015,
and was then delayed to the fall of 2016, and was
recently delayed for a third time to the end of
2017.24 The Highway 7 BRT is being completed in
segments by VIVA. The $1.4 billion project is
already open for service and is 95% completed in
the Richmond Hill and Markham areas.25 The
completion to the VMC is expected to be open for
service by the end of 2016.25
Source: Metrolinx, 2015
Considerations: Figure 43: Spadina Subway Extension
This indicator will ensure that Vaughan becomes
established on a global/regional scale and that
quality of life is improved for residents in the
City. It will also act as a guide to ensure that all
future multi-level projects are completed on time
and on budget.
Source: Google Images, 201519
Making Vaughan a world-class city
Indicator 3: Participating in Results:
The Spadina Subway extension to the VMC has
the planning of regional not only created 20,000 new jobs throughout the
construction process, but will also add 36 million
transit linkages transit trips and eliminate 30 million car trips
each year.26 The VIVA BRT project has also
The indicator: created 14,000 new jobs throughout the
Being a two-tier system, the City will collaborate construction process and can serve at least
with York Region and neighboring municipalities 25,000 residents in the VMC area.26
in planning for regional transit linkages.
Considerations:
Why measure? This indicator will allow Vaughan to be accessed
With Vaughan’s growing population and job on a regional-scale and will enable it to become
opportunities, there are people continuously established as a global city.
moving in and out of the City. The goal of this
indicator is to provide further transit options for
those people. Linkages across the City and to
other major cities, such as Toronto and Markham,
are crucial for residents.
How do we measure?
Vaughan’s participation in the Yonge-University-
Spadina subway extension and the Hwy 7 Bus
Rapid Transit were successful. The City must now Source: Places to Grow, 2006
build on those successes in order to build more
transit for its residents.20
Achieving a stable and competitive economy
Theme 3: Achieving a stable and
competitive economy
Source: Google Images, 2015
The Vaughan Growth Progress Report recognizes the importance of maintaining a strong and competitive
economy through the efficient use of land and infrastructure. The Report considers the significance of transit
investment, road and hydro maintenance, and creating a high quality of life. It provides the City with a
framework to plan for all types of economic activities, including industrial, office, retail, or other services, in
order to support and maintain a stable economy and ensure all necessary infrastructure is upgraded to
support all the needs of the employment sector.
The Report also supports the development of new employment areas, such as new offices or commercial
buildings, in urban growth centres across the City in order to make use of existing infrastructure. Promoting
alternatives to the private car, such as walking, cycling, and transit, are crucial elements in reducing traffic
congestion along road systems to allow for the fast and efficient movement of goods and for other economic
activities.
The three indicators will measure the progress in achieving the goal set out in this theme.
Indicator 1: Generating Why measure?
Funds generated from development are critical
income through development components in developing and maintaining a
strong economy. Approving more development
charges (approvals) applications, namely those of a large-scale, will
generate significant revenue for the City through
The indicator: development charges, Section 37 funds, and
The number of development applications property taxes. This will allow Vaughan to
approved at the City, regional, and OMB levels in compete (economically) on a global scale and also
order to increase revenue from development build the infrastructure necessary to sustain a
charges. growing population.
Figure 44: Residential Permits Issued in York Region, 2012-2013
How do we measure?
The City will review data on ClearPoint to
determine the total number of applications
approved annually. The City will also determine
the dollar amounts on development permits
issued annually, as well as previous total revenue
generated from development charges. Finally, it
will analyze population forecasts and household
forecasts for future growth.
Source: York Region Growth and Development Review, 201321
Achieving a stable and competitive economy
Results: Considerations:
Findings indicate that the City received 181 The ClearPoint data was measured in full from
development applications (OP Amendment, Zoning 2009-2014, as it has incomplete data for 2015.
Amendment, Site Development, Plan of Subdivision, York Region data was measured from 2012-2013
Plan of Condominium, and Part-lot Control) in 2009, and net earnings from development charges was
188 in 2010, 215 in 2011, 218 in 2012, 211 in 2013, 2013 data.
and 182 in 2014, as illustrated in Figure 8.8 Results
also indicate that in 2014, construction values were Figure 45: Vaughan’s Development Charge Revenue, 2013
$105,523,741,27 while the value of the total building
permits issued was $790.6 million.28 In 2013, York
Region held the 6th largest number of residential
permits issued in Canada, with Vaughan playing a
major role.29
A total of 7,830 new residential building permits were
issued in 2013 in York Region, down 26.1% from the
previous years total of 10,598.29 The drop in permits
can be attributed to the large number of apartment
Source: Vaughan City Council Meeting Minutes, 2013
and multiple dwelling units issued permits in 2012.29
In 2012, Vaughan accounted for 1,415 of the total
permits and in 2013 the City accounted for 2,470
(31.6%) of the total permits, as shown in Figure 44.29 Figure 46: 2013 New Residential Building Permit Mix by
In 2013, 59% of the total permits issued in York Local Municipality
Region were for multiple unit dwellings.29 In the same
year, 64% of the total building permits issued in the
City were for multiple unit dwellings (Figure 46).29
Vaughan’s development charges (per unit) as of March
2015 total $68,490 for residential single/semi-
detached and $59,926 for multiple dwellings.30 Costs
for non-residential total $473.15 per square metre for
retail uses, $271.55 for industrial/office/institutional,
$465.66 for mid-high density mixed use (retail), and
$264.06 for mid-high density mixed use (non-retail), as
depicted in Figure 47.30 In 2013, Vaughan’s net Source: York Region Growth and Development Review, 2013
earnings gained from development charges was over
$174 million, as shown in Figure 45.31 It is estimated
that from 2012-2021 the city’s population will increase Overall, there was a steady increase in development
by 58,000 people, with population growth in new applications from 2009-2013, and a sudden decrease
housing units is expected to add another 63,000 in 2014. Vaughan also saw a steady increase in the
people over the same time.32 As of 2011, there were number of residential permits issued from 2013-
86,063 households in the city, expected to increase by 2014, with over 1,000 more permits handed out in
over 60,000 by 2021,32 which will increase total the two years, and most being for multiple-unit
revenues generated from development charges dwellings. Finally, the City has been gradually
dramatically. increasing its development charges for both
residential and non-residential over the years.22
Achieving a stable and competitive economy
Figure 47: Vaughan’s Development Charge Rate Schedule
Source: City of Vaughan, 2015
Indicator 2: Creating more How do we measure?
Using data from the York Region Employment
jobs in the City Survey, as well as a study conducted by
Hemson Consulting, the City will determine
The indicator: the number of jobs provided in the City in past
The number of jobs provided within the City years, as well as estimate future employment
each year. forecasts.
Figure 49: York Region jobs
Why measure?
Being that Vaughan has become a premier
City for living, residents should be able to
work and play close to home. Providing more
jobs in the City is crucial in making this idea a
reality. As one of the fastest growing
municipalities in Canada, the economy should
also be stable and competitive, making the
focus on employment even more important.
Figure 48: Ontario and GTA Unemployment
Rates, 2009-2013
Source: York Region Employment Survey, 2013
Figure 50
Source: York Region Growth and
Development Review, 2013
Source: York Region Employment Survey, 201323
Achieving
Figure 51 a stable and competitive economy
Results:
Of the total 42,350 jobs offered in York Region
between January and December 2013,
Vaughan accounted for 30.9% of the total jobs
(Figure 53).33 As of mid-year 2013, Vaughan
had a total of 186,019 confirmed jobs and
199,470 estimated jobs (Figure 49).34
Between 2012 and 2013, employment in
Vaughan grew by 5.5% or 9,723 jobs.34
Between 2003 and 2013, employment
increased from 133,751 jobs to 186,019, an
average annual increase of 3.4% or a total of
52,268 jobs.34 The largest employment sector
in 2013 was manufacturing at 23%, while the
fastest growing sector from 2012-2013 was
construction, with a net job growth of 2,852
or 13.9%.34 The city’s employment forecast is
expected to grow by over 77,000 employees Source: York Region Employment Survey, 2013
by 2021, with between 3.8 and 5.4 million
square metres of new non-residential building Figure 52: Employment by Type of Worker
space to accommodate.32
Considerations:
Most employment survey data is from 2012-
2013.
Source: York Region Employment Survey, 2013
Figure 53
Source: Job Posting Trends in York Region, 201324
Achieving a stable and competitive economy
Indicator 3: Emphasizing the Results:
Vaughan Mills Shopping Centre attracts 13.4
use of local centres and million consumers, families, and tourists each
year.35 It had $599 million in sales from June
attractions 2013-August 2013, with domestic shoppers
averaging $113 per visit in 91 minutes, and
The indicator: tourists averaging $128 per visit.35 The mall has
How much each tourist attraction and local also recently undergone a 200,000 square foot
centre is being used and the profits that are expansion, which will add over 50 new stores and
generated. cost $87 million.35
Canada’s Wonderland sells single day tickets
Why measure?
ranging from $39-$85 and season passes from
In order to have a competitive economy,
$70-$200 depending on the package type.36 In
Vaughan must make use of its already existing
2011, Canada’s Wonderland ranked 14th in North
money-makers. Emphasizing the use of and
America for attendance at 3,481,000 visitors, up
promoting these centres will be crucial to the
3% from 3,380,000 in 2010.37 It moved to 13th in
growth of the economy.
2012 with 3,655,000 visitors and went back
down to 14th in 2013 with 3,582,000.37
How do we measure?
The City will gather data on the revenue and The VMC is 179 hectares (442 acres) in size, and
the value that the number of visitors bring to will include 1.5 million square feet of office space
some of the major attractions in the City. at a minimum, 750,000 square feet of retail, and
12,000 residential units to house 25,000 people.12
It has density targets of 200 people and jobs per
hectare by 2031, and employment targets of
11,500 jobs, 5,000 of which will be office jobs.12
Considerations:
Figure 54: 3D model of the Vaughan Mills Mall extension. Vaughan Mills data is from 2013, Wonderland’s
visitor data is from 2010-2013, and VMC data is
estimated projections.
Source: Google Images, 2015
Source: Vaughan Mills Leasing Kit, 201325
Achieving growth while maintaining a sustainable environment
Theme 4: Achieving growth while
maintaining a sustainable
environment
Source: Places to Grow, 2006
The Vaughan Growth Progress Report works in tandem with the Greenbelt Plan, Oak Ridges Moraine
Conservation Plan, Vaughan Natural Heritage Network, Green Directions Vaughan, and the Sustainability
Metrics Initiative to protect, conserve, and maintain a healthy environment while achieving growth. The
Report supports and maintains the policies outlined in the Greenbelt and Oak Ridges Moraine Plans, as
well as the intensification and prosperity of urban growth centres across the City. It calls for the
development of more vibrant and dense communities, which will result in more efficient use of land and
reduce development pressures on sensitive lands outside of growth centres.
Indicator 1: Preserving the
Oak Ridges Moraine and
Greenbelt
The indicator: Results:
The steps taken to preserve Oak Ridges The Greenbelt is 1.8 million acres of protected land that
Moraine and Greenbelt lands. wraps around the Greater Golden Horseshoe, one of the
fastest growing regions in North America.38 In 2006, it
Why measure? had a population of 8.4 million people, expected to
The Province has seen a dramatic increase increase to 11 million people in 2031.38 The Greenbelt is
in urban sprawl over the last decade. It is designed to protect environmentally sensitive areas and
important that Vaughan take the productive farmlands from urban development and
appropriate steps in assisting the Province sprawl. It is also a solution for fresh air, clean water,
in preserving some of its diminishing local food, and a thriving economy.38 The natural
Greenfield and farmland. heritage of the Greenbelt consists of 535,000 acres of
lakes, wetlands, river valleys, and forests, along with 78
How do we measure?
endangered species.38 The implementation of the
As there are still applications being
Greenbelt is said to have offset the equivalent of 27
submitted and increasing pressure to allow
million cars driven in one year, as well as reduced the
development on the Greenbelt and Oak
average travel of food from 2500km to 250km.38
Ridges Moraine lands, the City will continue
Ontario’s Greenbelt provides the province with $9.1
to enforce the legislation that it is bounded
billion in economic benefits and 161,000 full-time jobs.38
by in the Greenbelt Plan and Oak Ridges
The Greenbelt’s wetlands, forests, and agricultural lands
Moraine Conservation Plan. The City will
are also vital to water safety in the province.38 Combined,
review how and why the conservation of
they save $2.3 billion each year in water filtration,
these areas is so important. It will also
drinking water treatment, flood control, and recreation.38
review recent applications in the Greenbelt
and Oak Ridges Moraine boundaries, and the
issue of “grandfathering” approvals for
applications submitted before the legislation
came into place.26
Achieving growth while maintaining a sustainable environment
In Vaughan, there has been controversy recently Inc. revived a 16-year old application to build 28
surrounding the approved Highway 427 extension that luxury homes on protected Moraine lands in
will connect Vaughan to Caledon in order to alleviate Caledon.39 The grandfather clause that allows all
traffic congestion on the other major routes.40 The four development applications submitted before
to six lane highway will pave through a large amount of November 16, 2001 to go forward, means that the
Greenbelt lands, pave prime farmland in Caledon, and subdivision will most likely be built.45 Activists
encroach on many watersheds along the way.40 There have called on provincial and municipal levels of
will be three new interchanges at Langstaff Road, government to put an end to the grandfathering
Rutherford Road, and Major Mackenzie Drive.41 With of development in the Moraine.45
much opposition to this first extension, more
controversy is expected with the door still open to a Overall, Vaughan can attempt to mitigate the
further extension to Highway 9, which will pave through effects of these loopholes in the legislation on
Greenbelt lands.41 Although the legislation was meant to Greenbelt and Oak Ridges Moraine lands. As the
curb sprawl, it does stipulate that the Province is Province is able to build on Greenbelt lands if
entitled to build infrastructure on it, such as a highway, necessary, the City of Vaughan can attempt to
if it serves growth and economic development in negotiate with the Province in using the least
Ontario.40 amount of land as possible, or perhaps,
suggesting a different location for the
The Oak Ridges Moraine is an irregular 190,000-hectare infrastructure. Vaughan can also take the same
ridge that stretches 160 kilometers through Peel, York, approach as Caledon, who conducted a “Caledon
and Durham regions, along with Northumberland Transportation Needs” Study Update, where it
County, City of Kawartha Lakes, Simcoe County, outlined that the Highway 427 extension should
Peterborough County, and Dufferin County.42 Being a have minimal impact on Greenbelt lands.48 As for
significant landform in Ontario, the Moraine divides the the “grandfathering” of applications on Oak
watersheds draining south into western Lake Ontario Ridges lands, the City of Vaughan can vote to
from those draining north into Georgian Bay, Lake reject any applications and force them to the
Simcoe, and the Trent River system.42 The Moraine offers OMB, where the City and residents can voice their
many features beneficial to the province, such as clean opinions and attempt to have it rejected.
and abundant water sources, a wide-range of species, Considerations:
attractive and distinct landscapes, prime agricultural Oak Ridges Moraine results were from Caledon
lands, and sand and gravel resources.42 There are 64 and King City. They were specified in this report
rivers or streams that begin on the Moraine and run in because similar issues can arise in Vaughan with
various directions draining into lakes and rivers.42 90- future applications.
percent of the Moraine is in private ownership and 60%
Figure 55
of the total area lies in the Greater Toronto Area and
crosses 32 municipalities.42 The current population on
the Moraine is 250,000-300,000 people, with another 5
million who live close by.43 One of the Moraine’s most
important functions is water recharge and discharge.43 It
is estimated that more than 250,000 people rely on the
Moraine to provide them with clean drinking water.43
There is also increasing development pressure for new
residential, commercial, industrial, and recreational uses
along the Moraine. There has been a significant issue
with the “grandfathering” of applications submitted
before the legislation protecting the Moraine came into Source: Oak Ridges Moraine Land Trust, 2015
place. For example, in February 2015, Riteland Holdings27
Achieving growth while maintaining a sustainable environment
Indicator 2: Heritage – preserving Results:
The City of Vaughan has a Natural Heritage
local communities and Network Study pending approval. The study will
assess the role of the existing Natural Heritage
neighborhoods such as Kleinburg Network in maintaining elements of biodiversity
and ecological functions for the long term, and
The indicator: propose additional NHN areas.46 It will determine
Limiting the amount of development near the viability and conservation of the current NHN
heritage lands. with respect to biodiversity and ecological
functions, identify suitable ecosystem targets for
Why measure? the NHN in the City of Vaughan balanced with
Vaughan has an extensive history in some of population and employment targets, and specify
its small communities, such as Kleinburg. potential NHN in the City of Vaughan to meet
Protecting and preserving some of that proposed ecosystem targets.46
history is crucial in maintaining the character
of the neighborhood and City itself. Vaughan has also developed an Economic
Development Strategy for Kleinburg, which
How do we measure? outlines the use of Business Improvement Areas
The Vaughan Growth Progress Report reviews in order to still generate income and spur
some of the regulations developed in regards economic growth from heritage buildings.47
to heritage preservation that halts
development or redevelopment of certain Considerations:
communities and encourages the reuse of The City must continue to develop and enforce
heritage buildings, while still considering regulations on heritage preservation.
economic growth. Figure 56: Map of Kleinburg and Study Area
Source: Kleinburg Economic Development Strategy, 201128
Achieving growth while maintaining a sustainable environment
Indicator 3: Reducing land Figure 57
consumptions while still
supporting population and
employment growth
The indicator:
The number of people and jobs per hectare of
land.
Why measure?
Although the City is the second-fastest
growing municipality in Canada, there is only
so much land available to be developed. With
most of the residential development being
low-rise single-family subdivisions, the City
must now encourage more densities per
hectare, along with mixed-use developments,
in order to accommodate its dramatically
growing population and employment sector.
How do we measure?
This indicator will be measured in new
developments using City data on the number
of people per hectare of land throughout each
area of the City.
Results:
The City’s newest and most significant mixed-
use development, the VMC, estimates that
there will be 200 jobs and people per hectare
of land.12
Considerations:
The City will measure developments of all
sizes.29
Conclusion
Conclusion
The Vaughan Growth Progress Report was prepared by Cesare Pittelli, a second-year Master of
Environmental Studies student at York University. The Report was developed for the City of Vaughan
Strategic Planning Department as a major project for the program.
The proposed indicators will be reviewed by staff at the City of Vaughan, who will determine if any will be
used in the future.
For further information, or any questions and comments pertaining to the Report, please email Cesare Pittelli
at pittelc@yorku.ca.30
References:
1. City of Vaughan Official Plan (2010)
2. Statistics Canada (2011). Focus on Geography Series, 2011 Census
3. City of Vaughan (2015). Green Directions Vaughan
4. City of Vaughan (2015). Sustainability Metrics Initiative
5. City of Vaughan (2015). Vaughan Vision 2020
6. Jane Jacobs (1961). The Death and Life of Great American Cities
7. City of Vaughan (2010). Official Plan Extract – Text for Chapter 4 (Transportation) – Appendix H
8. ClearPoint Strategy (2015). Development Planning – Number of Development Applications
9. Province of Ontario (2006). Places to Grow. Towards Performance Indicators – Growth Plan for the
Greater Golden Horseshoe
10. ClearPoint Strategy (2015). Development Planning – Number of hours spent on OMB hearings
11. ClearPoint Strategy (2015). Legal Department – Number of days spent at OMB hearings and litigations
12. City of Vaughan (2015). Economic Development – Vaughan Metropolitan Centre
13. Starr, Ryan (2012). Toronto Star – Centro Square the gateway to Vaughan
14. Graziani and Corazza Architects (2015). Projects – Jane and Highway 7 – Zzen Group of Companies
limited/Goldpark Group
15. BuzzBuzz Home (2015). Expo Condos by Cortel Group
16. TheMetCondo (2015). The Met Condos by Plaza Corp
17. McLean, Steve (2014). RENX – Real Estate News Exchange. KPMG Tower advances vision for
downtown Vaughan
18. York Region (2009). Moving on Sustainability. Transportation Master Plan Update
19. York Region (2014). Invest in York - Local Labour Market Update. Workforce Trends
20. Metro Land Media (2015). York Region – Vaughan Crime
21. City of Vaughan (2014). Vaughan Mills Centre Secondary Plan
22. Mackenzie Health (2015). Future Development – New Mackenzie Vaughan Hospital
23. Javed, Noor (2014). Toronto Star – Vaughan hospital project bogged down by infighting
24. Toronto Transit Commission (2013). Toronto-York Spadina Subway Extension
25. Metrolinx (2015). Viva in York Region – York Viva Bus Rapid Transit
26. Ontario Government (2014). Progress Report 2014: transit and infrastructure. Metrolinx Regional
Transportation Plan
27. City of Vaughan (2014). Building Standards Department - Building Permit Reports
28. City of Vaughan (2015). Building Permits
29. York Region (2013). Invest in York. Growth and Development Review
30. City of Vaughan (2015). Development Charges Rate Schedule
31. Ministry of Municipal Affairs and Housing (2013). Development Charges in Ontario. Consultation
Document
32. Hemson Consulting Ltd. (2013). City of Vaughan – Development Charges Background Study
33. York Region (2013). Job Postings in York Region – Trends
34. York Region (2013). Employment and Industry Report
35. Vaughan Mills Shopping Centre (2013). Vaughan Mills Leasing Kit
36. Canada’s Wonderland (2015). Season Passes/Tickets
37. Aecom (2013). TEA- Themed Entertainment Association – Global Attractions Attendance Report
38. Greenbelt Foundation (2015). About the Greenbelt31
39. Town of Caledon (2015). Public Meeting Information Report – 15877 Mount Wolfe Road
40. Javed, Noor (2015). Toronto Star – Proposed highway to pave parts of Greenbelt proving controversial
41. Region of Peel (2013). Provincial Transportation Initiatives Update
42. Oak Ridges Moraine Land Trust (2015). About the Oak Ridges Moraine
43. Oak Ridges Moraine Foundation (2015). ORM Fact Sheet
44. Shapero, Erin (2014). Environmental Defence. Big win for the Oak Ridges Moraine Conservation Plan
45. Oved, Marco C. (2015). Toronto Star. Subdivision to be built on Oak Ridges Moraine
46. City of Vaughan (2015). Natural Heritage Network Study
47. Urban Strategies Inc. (2011). Kleinburg Economic Development Strategy – A Mainstreet Revitalization
Project
48. Town of Caledon (2007). Caledon Transportation Needs Study UpdateYou can also read