West Schofields Housing Market Analysis April 2018 - Amazon AWS
←
→
Page content transcription
If your browser does not render page correctly, please read the page content below
West Schofields
Housing Market Analysis
April 2018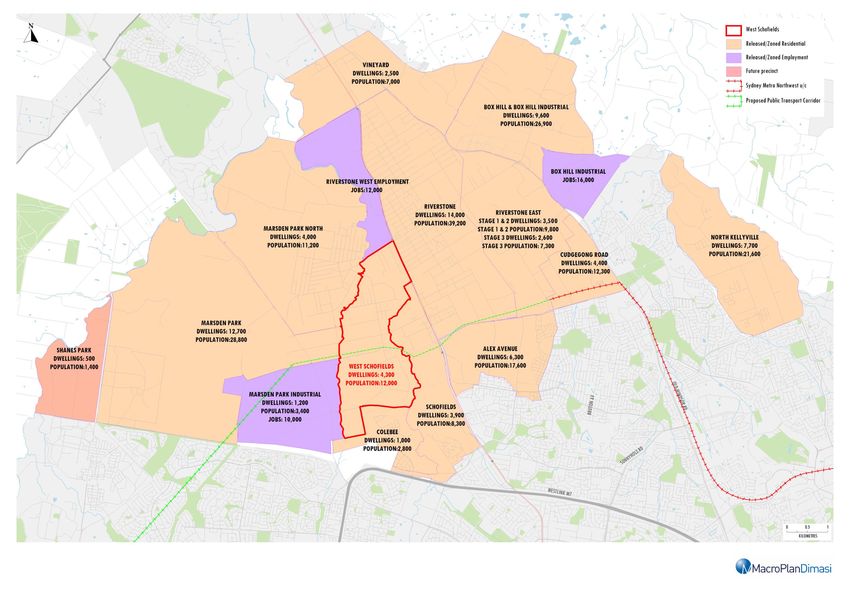
© MacroPlan Holdings Pty Ltd All Rights Reserved. No part of this document may be
reproduced, transmitted, stored in a retrieval system, or translated into any language in
any form by any means without the written permission of MacroPlan Holdings Pty Ltd. All
Rights Reserved. All methods, processes, commercial proposals and other contents
described in this document are the confidential intellectual property of MacroPlan Holdings
Pty Ltd and may not be used or disclosed to any party without the written permission of
MacroPlan Holdings Pty Ltd.

Prepared for: Calibre Consulting Pty Ltd and NSW Department of
Planning & Environment

Project number: 87040

Document status:

Version            Version no.      Author(s)         Date                Review
Draft report       29/11/2017       SP                29/11/2017          GY
Final draft        10/04/2018       TK                11/04/2018          GY
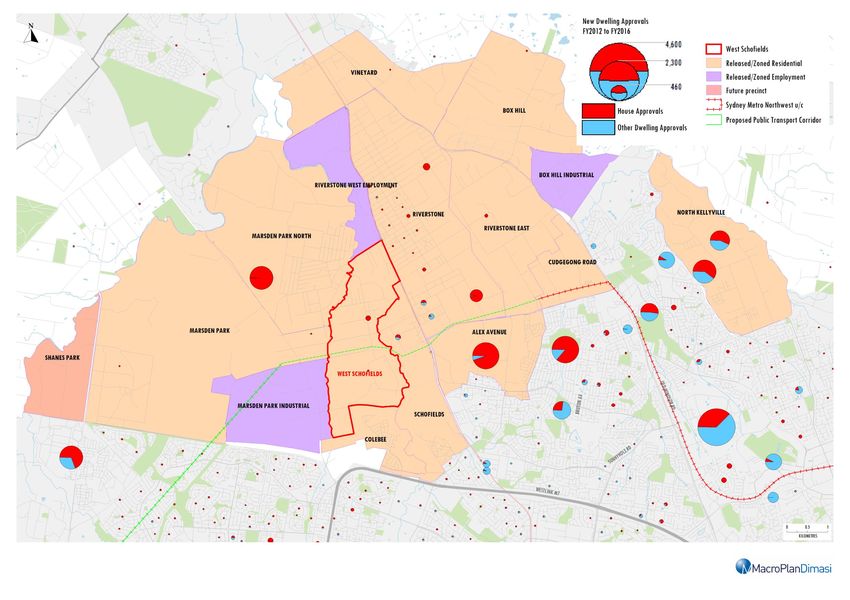
Table of contents

Ex ec ut i ve Su mm a r y ......................................................................... 1

I nt ro du ct io n ...................................................................................... 3

Se ct io n 1 : M a rk et Co nt ex t .............................................................. 5

Se ct io n 2 : St r at eg ic Se tt in g .......................................................... 8

               2.1      Greater Sydney Region Plan (2018)                                                8
               2.2      Central City District Plan (2018)                                                9
               2.3      North West Land Use and Infrastructure Implementation Plan
               (LUIIP) (2017)                                                                          10
               2.4      Growth Centres Development Code (2006)                                         13
               2.5      SEPP: Sydney Region Growth Centres (2006)                                      13
               2.6      Blacktown City Council Studies and Policies (2013)                             14
               2.7      Summary                                                                        15

Se ct io n 3 : M a rk et De m an d A n al y s is ........................................... 17

               3.1      Population Characteristics and Change                                          17
               3.2      Housing Market Overview                                                        21
               3.3      Key Findings                                                                   23

Se ct io n 4 : Re s id e n ti a l S u pp l y a n d M a rk et O v e rv i e w .............. 25

               4.1      Supply                                                                         25
               4.2      Sales Evidence                                                                 30
               4.3      Dwelling Mix                                                                   31
               4.4      Dwelling Approvals                                                             35
               4.5      Median Lot Price Growth                                                        37
               4.6      Median Dwelling Price Growth                                                   38
               4.7      Sales Evidence                                                                 40
               4.8      Key Take-Outs                                                                  41

Se ct io n 5 : G a p A s s es s me nt .......................................................... 43
5.1      Current Status                                                              43
              5.2      Supply in the Pipeline                                                      43
              5.3      Gap Assessment                                                              43

Se ct io n 6 : Im p ac t on Loc a l I nf r a st ru ctu r e ............................... 44

              6.1      Social Infrastructure Need                                                  44

Se ct io n 7 : De l iv e r y A n a l ys i s ........................................................ 45

              7.1      Development in the North West Growth Area                                   45

Se ct io n 8 : T i mi n g a nd Su b di v i si o n ............................................. 47

              8.1      Sale rates                                                                  47
              8.2      Price Points                                                                48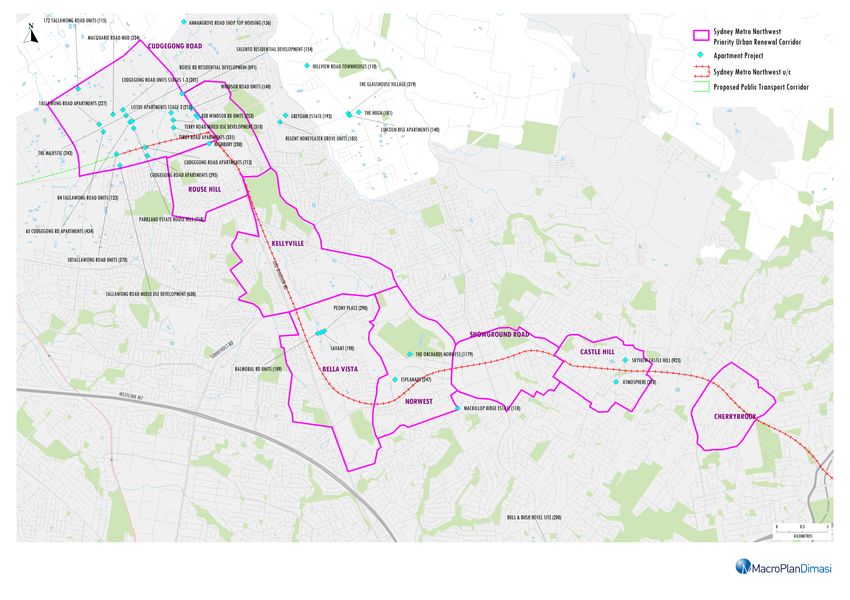
Executive Summary

MacroPlan Dimasi has been engaged by Calibre Consulting Pty Ltd and the NSW
Department of Planning & Environment (DPE)            to undertake a housing market
assessment of the West Schofields precinct in the North West Growth Area (NWGA). This
report provides an estimate of the size of the market and demand for particular housing
types based on consumption and demand data, and provides recommendations for
housing delivery within the precinct.

This report forms part of a suite of technical documents that are being prepared as part
of the master planning for the West Schofields precinct.

Our report is structured as follows:

    1. Strategic setting analysis
    2. Market demand analysis
    3. Historical residential supply trends and market size overview
    4. Housing recommendations
    5. Impacts on proposed developments
    6. Delivery analysis
    7. Timing and subdivision

Based on current take-up rates and market appetite, our report finds that there is
sufficient demand for up to 5,750 dwellings in West Schofields to be brought to market.
Over a ten year horizon, the production of 5,750 dwellings would account for almost
13% of total take-up for the NWGA.

Projected Housing Demand in the North West (2021 – 2031)

                                             Growth
  Dwelling Typology        West Schofields             Proportion
                                             Centre
Apartments                  865              8,000         10.8%
Up to 350m² (small)         1,725            13,750        12.5%
350-450m² (medium)          1,435            19,250         7.5%
450m² + (large)             1,725            22,000         7.8%
Total                       5,750            45,000        12.8%
Source: MacroPlan (2017)

                                                                                           1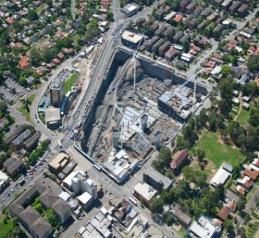
Other relevant findings include:
There were an average of 3,316 vacant lot sales, 10,054 house sales and 1,926
apartment sales in Blacktown and The Hills Shire between 2010 and 2017.
We anticipate annual dwelling growth in the NWGA to be in the order of 4,500 p.a.
over the next five years and expect this to flat-line to 3,800 dwellings from 2021-
2031.
The median price of a house in Schofields has increased from $317,000 in 2006 to
$840,000 in 2017 (including older dwellings). A new house in Schofields now sells for
$750,000 to $900,000 (depending on the number of bedrooms). A townhouse ranges
from $700,000 - $800,000 and apartments are currently on the market for $450,000
to $680,000.
We note that the sale of other dwelling stock (i.e. apartments and town houses) in the
catchment is gaining momentum. Notably, all one bedroom apartments at the
currently offered project at 279 Railway Terrace, Schofields have sold out.
We recommend the following housing mix for the West Schofields precinct:
Source: MacroPlan (2017)
Having regard for market competition in each size cohort, the subject precinct would be
able to achieve average annual sales of 575 lots1.
Smaller lots are expected to achieve the greatest sales rate at West Schofields. We also
envisage strong market appetite for apartments with increased downsizing activity and
favourability among young working couples.
1
Projection is based on historical dwelling approvals in proxy area
2
Introduction

This    report     has   been   prepared    in   accordance     with    instructions   received   from
Calibre Consulting, the lead consultants managing the PAP submission, as well as the
NSW Department of Planning and Environment (DP&E), which outlined and authorised
the scope of works for the housing assessment.

This report is presented in eight sections as follows:

1. Strategic Setting Analysis - our assessment will consider the range of key
       planning and land supply strategies that are expected to drive development in the
       region. We will provide a high level policy summation to inform future opportunities
       particularly in relation to the type and quantum of expected development and the
       nature and timing of competitor releases in the area.

2. Market Demand Analysis - Based on demographic and socio-economic indicators
       (e.g. ABS 2016 census data), MacroPlan Dimasi will identify current and future levels
       of land and housing demand for the area. This assessment will also identify a range
       of product demand opportunities by demographic sub-markets and examine inter-
       urban migration demand.

3. Historical residential supply trends and market size overview - Analysis of
       current   residential    land   supply    including   detailed   commentary      on   function;
       residential development context; dwelling approvals and recent sales history;
       median house price by dwelling type; and dwelling stock by type for each release
       area LGA.

4. Housing Recommendations - Based on the demand and supply analysis provide
       advice and recommendations in relation to the appropriate mix of dwelling types and
       densities, taking into consideration housing affordability and maximisation of
       commercial viability in the Part Precinct.

5. Impacts on proposed developments - Indicate whether the scale or staging of
       advised development is likely to impact on the quantum and timing of provision of
       any social infrastructure, including community facilities and open space, as well as
       traffic generation.

                                                                                                         3
6. Delivery Analysis - Examine the positioning of the proposed land releases within
   the context of future trends, other developments and surrounding centres; and the
   implications of such on the development feasibility of various residential densities
   and housing types.

7. Timing and subdivision - Based on the above analysis provide a detailed outlook
   in   regards   to   housing   type   within   the   Part   Precinct.   We   will   provide
   recommendations as to the likely rates of subdivision and dwelling construction in
   line with consultations with the infrastructure master planning services provider and
   identify potential stages/sequencing of development.

                                                                                                4
Section 1: Market Context

Greater Metropolitan’s Sydney population increased at an annual average rate of 1.6%
over the ten years to 2016. Over this period, population growth was principally
supported by net overseas migration, of which a significant proportion went to Sydney
and Melbourne.

Sydney’s housing markets reached peak levels during 2015, with a corresponding house
price surge across Sydney, which is still rippling out into Newcastle and Wollongong.
Concurrently, the rate of apartment construction is unprecedented.

The north-west region has enjoyed strong population growth in the past five years and is
expected to further accelerate. An extended upturn in jobs growth is overlapping with
extensive housing shortages to create an outlook of recovery in the residential building
activity. Population growth has been prominent but has not reached its full potential as
precinct planning has been a constraint on growth in recent years.

There are still a handful of precincts that are yet to be rezoned 2 within the NWGA that
once done will lead to accelerated growth in the short and medium term. Suburbs
earmarked for major residential development going forward include Box Hill, Marsden
Park, Riverstone and Schofields. Collectively, DP&E has planned for an additional
92,400 residents over the next 10 years (equating to 33,000 additional dwellings)
to 2031.

Along with major housing estates, the North West Rail Link (NWRL) corridor is set to
encompass 50,000 new dwellings by 2036 (DP&E), with major growth expected in Castle
Hill, Kellyville and Bella Vista. Utilising a conservative average household size of 2.83 (as
of 2016, the average household size in Blacktown and The Hills Shire was 3.2 for
detached house owners), 50,000 new dwellings will equate to an additional 140,000
residents along the rail corridor alone.

Across the north-west, the development of the NWRL has already accelerated housing
growth in proximity to future train stations. Our reconnaissance of development in the

2
  The following precincts are still unzoned: West Schofields, Marsden Park North, Shane's Park, Riverstone East
Stage 3, and Vineyard Stage 2
3
  i.e. the anticipated average household size for all typology (detached, semi-detached, and apartments).

                                                                                                                  5
pipeline has revealed 41 major apartment projects are in the early planning phase or
have been approved along the NWRL corridor.
Additionally, the major housing estate ‘The New Rouse Hill’ is set to encompass 1,750
new dwellings (5,000 persons), whilst multiple housing estates in Kellyville (i.e. Foxall
Road subdivision, The North Village and Bella Vista Waters) will add a significant number
of dwellings and residents to the region.
Dwelling construction and growth in the North West can be attributed to:
Pent-up demand for housing which will support sales over the next five years.
Price bands for new dwellings when compared against older houses and the
delivery of product to suit retiree demand. An ageing population will accelerate
downsizing activity.
Rental growth has exceeded price growth over the past decade, creating a
greater impetus being first home buyer demand, and also attracting interest from
investors.
The relative affordability of a house in the Rouse Hill catchment vs an apartment
in Parramatta.
Having regard for major apartment projects along the NWRL, approximately 9,000
dwellings, culminating in an additional 25,200 residents will eventuate in The Hills Shire
and parts of Blacktown over the next decade. Importantly, this growth is associated with
major apartment projects along the rail corridor alone and does not factor in other
residential growth (i.e. housing estates and sporadic development).
With significant development occurring in the Blacktown LGA (i.e. Elara Estate,
Clydesdale Estate and Skyland Estate), it is our belief that future development will be
dominated further north-west of Sydney, particularly in the following SA2 regions:
1. Riverstone – Marsden Park (location of West Schofields)
2. Parklea- Kellyville Ridge
3. Rouse Hill – Beaumont Hills
4. Baulkham Hills – Bella Vista
5. Carlingford
6. Castle Hill
6We anticipate that the north-west corridor is a more attractive proposition for retirees
and young families (relative to the Parramatta area), presenting a greater value for
money. A land and house package in the north-west is comparable to an apartment in
Parramatta and is more suited to families.
7Section 2: Strategic Setting
This section of the report considers the range of key planning and land supply strategies
that are expected to drive development in the region. We will provide a high level policy
summation to inform future opportunities particularly in relation to the type and
quantum of expected development and the nature and timing of competitor releases in
the area. Relevant policy documents that are considered include:
1. Greater Sydney Region Plan (2018)
2. Central City District Plan (2018)
3. North West Land Use & Infrastructure Implementation Plan (LUIIP) (2017)
4. State Environmental Planning Policy: Sydney Region Growth Centres (2006)
5. Growth Centres Development Code (2006)
6. Blacktown City 2031 Community Strategic Plan (2013)
2.1 Greater Sydney Region Plan (2018)
Released by the Greater Sydney Commission (GSC) in March 2018, The ‘Greater Sydney
Region Plan’ will be used as a cornerstone reference for land-use planning decisions
going into the future.
The purpose of the draft Plan is to:
Set a 40-year vision (up to 2056) and establish a 20-year plan to manage growth
and change for Greater Sydney in the context of economic, social and
environmental matters;
Inform district and local plans and the assessment of planning proposals;
Assist infrastructure agencies to plan and deliver for growth and change and to
align their infrastructure plans to place-based outcomes;
Inform the private sector of the vision for Greater Sydney and infrastructure
investments required to manage growth;
Inform and engage the wider community so the draft Plan can best reflect the
values and aspirations of all.
Essentially, the plan presents a strategy for accommodating Sydney’s future population
growth. It balances the need for more housing, but also cultivates the creation of strong
8and resilient communities within a highly-liveable city whilst protecting the natural
environment and biodiversity.
New housing will be located close to jobs, public transport, community facilities and
services. It acknowledges the need to offer choice in housing location, size and
typologies, to better suit our lifestyles and budgets. Most importantly, more intensive
housing development across the city will be matched with investment in infrastructure
and services, culture and the arts, a ‘green-grid’ of open spaces and renewed bushland
to support healthy lifestyles and community life.
With specific reference to the NWGA, the plan highlights the need to retain and manage
the growth area. As such, the plan suggests that all existing industrial and urban
services and land should be safeguarded from competing pressures, being retained for
economic activities required for Greater Sydney’s future growth and operation. In
achieving this, a mix of economic outcomes that support employment, the city and its
population would be desirable. The further management of these lands should
accommodate evolving business practices and changes in needs for urban services from
the surrounding community and businesses.
Furthermore, The NSW Government has identified demand for 725,000 homes to meet
growth over the next 20 years and the draft Plan sets out a process to deliver a steady
pipeline of supply to meet this forecast housing demand and to improve Greater
Sydney’s housing affordability. To this end, housing targets have been established to
support the creation of supply for delivery over the next ten years and to create capacity
for the longer term. Key actions include the preparation of housing strategies and the
development of housing targets across the greater metropolitan area for each of the
Districts and each local government area.
In the case of the subject precinct, which is located in the Central City District, the 0-5
year (2016-2021) housing supply target and the 20-year (2016-2036) strategic housing
target is 53,500 and 207,500 dwellings, respectively. This equates to an average annual
supply of 10,375 dwellings, or approximately one in four of all new homes in Greater
Sydney over the next 20 years, across the entire District.'
2.2 Central City District Plan (2018)
The Greater Sydney Commission (GSC) issued its first District Plan in March 2018. The
Plan looks to bridge regional and economic planning to allow for sustained economic,
social and environmental development within Greater Sydney.
9Under the Central City District Plan, the NGA is recognised as one of the largest growth
areas along with the South West and Wilton Growth Areas and the southern part of the
Greater Macarthur Growth Area.
The GSC envisages the Central City be the fastest growing District over the next 20
years, potentially accommodating up to 207,500 dwellings. There is no specific mention
of the dwelling targets/yield for the NWGA, nor West Schofields in the District Plan.
Marsden Park (Strategic Centre) is identified as the largest centre in the NWGA and
other ‘local centres’ are identified at Riverstone, Schofields. A train link/investigation
corridor is identified extending from Cudgegong Road through to Marsden Park.
2.3 North West Land Use and Infrastructure Implementation Plan
(LUIIP) (2017)
Since 2006, nearly two-thirds of the growth area have been rezoned (under the North
West Structure Plan 2006) with five precincts yet to be rezoned.
In May 2017, the LUIIP replaced the North West Structure Plan (2006) and sets the
overarching strategic plan for the NWGA five remaining precincts. In doing so, it guides
the Precinct Planning and rezoning process that confirms land uses, street patterns,
environmental and heritage protection, and detailed infrastructure requirements.
Under the LUIIP, the NWGA could ultimately provide up to an additional 20,000 dwellings
than was anticipated in the 2006 Structure Plan (90,000 dwellings in total). Furthermore,
the plan seeks to facilitate the supply of 18,000 new homes by 2021 and 33,000 new
homes by 2026.
West Schofields is one of the projects which will be rezoned under the guidelines of the
Implementation Plan. There are numerous assumptions that will be taken into
consideration with regards to rezoning, including:
Land use opportunities adjacent to the Outer Sydney Orbital
Local infrastructure requirements, such as school and open space
Local and regional connectivity with respect to bike paths, pedestrian paths and
the Green Grid.
10An Overview of the North West Growth Area (still under review by DP&E)
An Overview of the North West Growth Centre
Status Growth Precincts Suburb Dwellings Population Area (ha) Density Jobs Year Zoned
Alex Avenue Alex Avenue 6,300 17,600 420 42 - 2010
Box Hill Box Hill 13,200 37,000 96 385 2013
16,000
Box Hill Industrial Box Hill - - 7 - 2013
Colebee Colebee 1,000 2,800 191 15 - 2005
Cudgegong Road Station Rouse Hill 4,400 12,300 245 50 - 2011
Marsden Park (Industrial) Marsden Park 1,200 3,300 247 - 2010
Released or undergoing precinct planning 10,000
Marsden Park Marsden Park 12,700 35,500 1,800 20 2013
North Kellyville North Kellyville 7,700 21,600 707 31 - 2008
Riverstone* Riverstone 14,000 39,000 975 40 2010
Riverstone East (Stage 1 & 2) Riverstone 3,500 9,800 656 15 12,000 2016
Riverstone West Riverstone - - 285 - 2009
Schofields Schofields 3,900 11,000 465 24 - 2012
West Schofields West Schofields 4,300 12,000 - - - -
Marsden Park North Marsden Park 4,100 11,500 - - - -
In the process of being rezoned Vineyard (stage 1)* Vineyard 2,500 7,000 - - 3,000 -
Riverstone East (Stage 3) Riverstone East 2,600 7,300 - - - -
Shanes Park Shanes Park 500 1,400 - - - -
Total 81,900 229,100 - - - -
Source: DP&E (2017), MacroPlan (2017)
* Average Residential Density (persons/ha)
** These figures are from the superseded North West Structure Plan (2006). Dwelling projections are subject to change.
11Map 2.1: North West Growth Area North West Growth Area: Overview (2017)
2.4 Growth Centres Development Code (2006)
Developed in conjunction with the North West Structure Plan (2006) and the State
Environmental Planning Policy (Growth Centres) 2006 is the Growth Centres
Development Code. This Development Code was produced by the Growth Centres
Commission to guide the planning and urban design in the North West Growth Centre. It
provides the basis for planning and design of precincts and neighbourhoods and is
intended to provide a guide to best practice.
Objectives of the development code with regard to housing include:
Quality design of new communities
Investment in infrastructure that provides for the staging of development
A diversity in housing types that suits the community
Walking scale access to shops that serve the daily needs of residents
Accessible local centres
The right mix of land-uses that that provide for the community in relation to
employment, shopping, recreation and open space.
Notably, the code states that “the actual net residential density that an individual
neighbourhood will aim to achieve can be higher or lower than the target set out in the
Structure Plan, provided the aggregate net residential densities of neighbourhoods within
a precinct achieves the targets set by the Structure Plan” (P.g. A-5).
2.5 SEPP: Sydney Region Growth Centres (2006)
SEPP (Sydney Region Growth Centres) 2006 is the statutory planning framework that
governs new release areas within the Growth Centres. It provides broad planning
controls for development. Relevant objectives include:
Enable the establishment of vibrant, sustainable and liveable neighbourhoods that
provide for community well-being and high quality local amenity
Provide controls for the protection of land that has conservation value
Provide for the orderly and economic provision of infrastructure.
132.6 Blacktown City Council Studies and Policies (2013)
The Blacktown Community Strategic Plan his plan identifies the main priorities of our
community and aspirations for the City over the next 17 years and beyond. Strategic
directions of the plan are outlined below.
A Vibrant and Inclusive City
A Clean and Sustainable Environment
A Smart and Prosperous Economy
A Growing City Supported By Infrastructure
A Sporting and Active City
A Leading City
With regard for housing delivery, the strategy cites that
“New residential developments are well designed and display a strong sense of
identity. These communities offer quality design and innovation in housing as well as
in the public domain. Services such as transport, child care and community facilities
are provided for residents moving into new communities” (P.g. 35).
And …
“Housing needs are met in safe, liveable, affordable and sustainable neighbourhoods”
(P.g. 35)
To achieve these goals, Blacktown City Council has implemented eight focus areas.
Focus areas associated with housing delivery are as follows:
Incorporate the principles of quality design, sustainability and innovation in the
building of safe and liveable residential communities.
Pursue improved State Government housing stock and estates for social housing.
Pursue the provision of more affordable housing for the City.
14We have also considered policies and approaches from Councils in the SWGC and the
NWGC. References include:
Blacktown Draft Section 94 Contributions Plan No.21 – Marsden Park Industrial
Precinct
Box Hill Demographics and Social Infrastructure Assessment, Urbis, 2011
Community Facilities and Open Space Assessment, Marsden Park Industrial
Precinct, Elton 2009
Blacktown Section 94 Contributions Plan No.20 – Riverstone & Alex Avenue
Camden Contribution Plan 2011
Oran Park and Turner Road Section 94 Plan
Liverpool Contributions Plan 2008 Edmondson Park
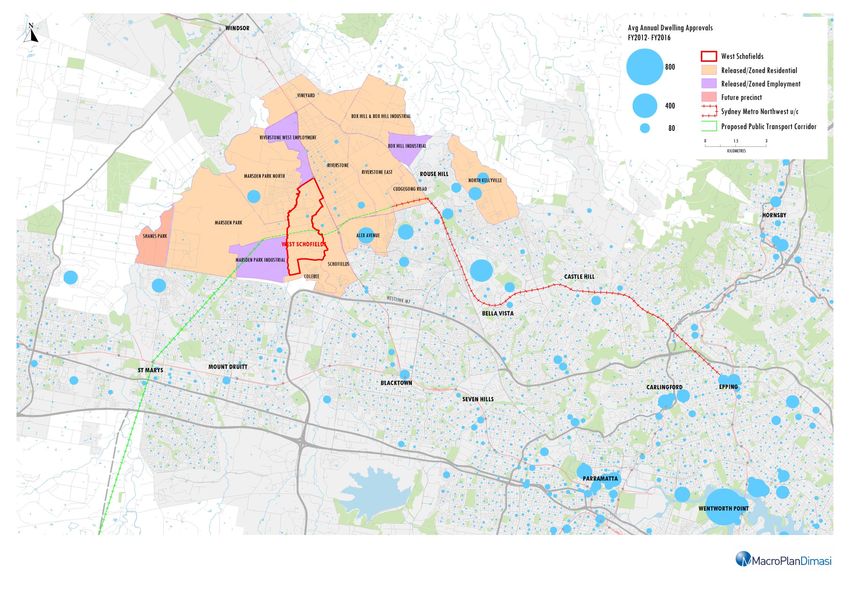
2.7 Summary
A focus on housing supply (including diversity in housing) has already manifested itself,
particularly in Kellyville, North Kellyville, Rouse Hill and the Alex Avenue precinct. ABS
dwelling approvals at a small area level (SA1 and SA2) show an increase in housing
approvals as well as an increased number of apartments and townhouses.
We illustrated average annual dwelling approvals over the three years to FY 2016, as
shown in Map 2.2 overleaf.
15Map 2.2: West Schofields Average Annual Dwelling Approvals 2012-17
Section 3: Market Demand Analysis
Based on demographic and socio-economic indicators (ABS 2016 Census), MacroPlan has
assessed current and future levels of land and housing demand for the area. This
assessment also identified a range of product demand opportunities by demographic
sub-markets and examines inter-urban migration demand.
The ABS 2016 Census has been released since June 2017, it is important to note that
the demographic structure of the north-west region is likely to have changed since 2011.
We use the following ABS defined SA2 regions to provide a more detailed indication of
demand (hereafter known as the North West Growth Centre):
Rouse Hill – Beaumont Hills
Riverstone – Marsden Park
Parklea – Kellyville Ridge
We also use a proxy area consisting of the areas around Stanhope Gardens, The Ponds
and Rouse Hill to understand the likely socio-demographic profile of West Schofields.
3.1 Population Characteristics and Change
As at 2016, the population of the North West Growth Centre was 74,897 persons.
Population Growth, North West Growth Centre (2005-2016)
Source: ABS Regional Population Growth (2016)
17According to the ABS, population growth in the region has been solid, expanding at an
average rate of 6.7% (35,600 persons) over the ten years to 2016 – significantly greater
than the Greater Sydney average of 1.5% per annum. In level terms, this equates to an
average increase of 3,560 residents per year.
Population by Age Cohort
Using available data, we see that, over the ten year period to 2016, population growth in
the NWGA has been dominated by young families. There has also been prominent
growth in the number of retirees (i.e. persons aged 60+).
Population Growth by Age Cohort, North West Growth Area (2006-2016)
Age Annual
2006 2016 CAGR (%)
Cohort Change
0-14 10,039 19,259 922 6.7%
15-19 2,550 4,993 244 7.0%
20-29 5,432 9,168 374 5.4%
30-39 7,922 13,608 569 5.6%
40-49 5,623 12,206 658 8.1%
50-59 3,988 7,432 344 6.4%
60+ 3,645 8,231 459 8.5%
Total 39,199 74,897 3,570 6.7%
Source: ABS Regional Population Growth (2016)
Using our proxy defined area we gain a more reliable understanding of the potential
population base of West Schofields in the future. As at 2016, almost 26% of the
population comprised of children aged 0-14.
This is followed by persons aged 30-39 (18%) and persons aged 40-49 (16%). Evidently
the north-west is an attractive proposition for young families.
18Age Composition – Proxy Area (2016)
Source: ABS Census (2016)
Net Migration
Over the five year period to 2016 there were 20,522 inward migrants to the North West
Growth Area and 10,546 outward migrants, resulting in net inward migration of 9,976
persons. This figure does not include inter migration between the three SA2 regions in
the NWGA. Whist inward migration provides an indication of likely demand; outward
migration does not reflect the local market as these residents were in the region before
significant change occurred in the north-west.
The largest source of net inward migration came from the following SA2 regions:
1. Quakers Hill - Acacia Gardens 7. Blacktown (North) – Marayong
(1,608 persons net) (510)
2. Kellyville (1,301 persons net) 8. Doonside – Woodcroft (488
3. Glenwood (1,142 persons net) persons net)
4. Blacktown (East) - Kings Park 9. Hassall Grove – Plumpton (444
(629 persons net) persons net)
5. Lalor Park - Kings Langley (547 10. Dural – Kenthurst – Wisemans
persons net) Ferry (424 persons net)
6. Baulkham Hill East (518 persons 11. Northmead (409 persons net)
net)
19Net outward migration occurred to the following regions:
1. Kellyville (721 persons net) 6. Windsor – Bligh Park (334
2. Pitt Town – McGraths Hill (681 persons net)
persons net) 7. Baulkham Hills (West) – Bella
3. Dural – Kenthurst – Wisemans Vista (203 persons net)
(518 persons net) 8. Glenwood (202 persons net)
4. Kurrajong Heights - Ebenezer 9. Richmond - Clarendon (194
(484 persons net) persons net)
5. Quakers Hill (420 persons net) 10. Castlereagh - Cranebrook (153
persons net)
Net Migration by Age Cohort
Net inward migration over the five years to 2016 has largely comprised of families and
young workers (consistent with our population growth by age cohort findings). Over the
period, 83% of net inward migration consisted of persons aged 0-49. In contrast, only
5% of net inward migration encompassed persons aged 65+.
Net Inward Migration by Age Cohort (2011-2016)
Indicator 0-19 20-34 35-49 50-64 65+
Inward 4,991 6,018 6,179 2,346 988
Outward 2,297 2,641 2,439 1,125 645
Net 2,694 3,377 3,740 1,221 343
Proportion 24% 29% 30% 11% 5%
Source: ABS Census (2011 & 2016)
Place of Birth
The proportion of local born residents in the proxy region is approximately equal to that
of Greater Sydney (59.9%). According to the Census (2016):
60.1% of the proxy region is born in Australia;
5.5% of the population is born in India or Sri Lanka;
4.8% of the population is born in The Philippines; and
3.1% of the population is born in the United Kingdom.
20Population Projections
According to the BTS (2016), the resident population of the North West Growth Area is
expected to reach approximately 222,500 by 2031, equating to an increase of 7,044
persons (6.9% growth per annum).
Consistent with historical findings, growth is expected to be prominent amongst young
families and persons aged 65+. We also see notable growth in the young working
population (i.e. 20-34).
Population Projections by Age Cohort – North West Growth Area (2016-2031)
Age Annual
2016 2021 2026 2031 CAGR (%)
Cohort Increase
0-19 26,154 39,946 53,722 67,423 2,063 6.5%
20-34 16,524 24,609 32,521 42,455 1,297 6.5%
35-49 20,274 30,103 38,872 46,381 1,305 5.7%
50-64 11,785 19,712 28,895 38,682 1,345 8.2%
65+ 6,822 12,431 19,171 27,508 1,034 9.7%
Total 81,559 126,800 173,180 222,449 7,044 6.9%
*BTS data is consistent with DP&E population projections at the LGA level
Source: BTS (2016)
The DP&E have also provided population projections for the growth centre in its entirety.
According to the growth centres website, the NWGA can accommodate around 250,000
residents.
3.2 Housing Market Overview
Household Composition
Traditional families (i.e. couples without children) are the most prevalent household type
in the proxy area, accounting for 63.3% of households, well above the Sydney average
of 48.2% of households. Compared with the Sydney average, the proxy area includes
low proportions of couples without children (13.2% vs 20.1%) and lone person
households (3.7% vs 9.0%).
Average Household Size
The average household size in the proxy area is 3.3 (Census 2016), well above the
Greater Sydney average of 2.8.
21Occupancy Rates
The occupancy rate of dwellings within the proxy regions is relatively high. On average,
95% of all private dwellings are occupied compared with an average of 93% in Greater
Sydney.
Household Income and Distribution
Household income distribution in the proxy area is skewed towards higher income
bracket. As at 2016, almost 70% of households earned more than $78,000 per annum in
the proxy area, compared with 63% in Greater Sydney.
Household Income – Proxy Area vs Greater Sydney (2016)
18%
16%
Proxy Area
14% Greater Sydney
Proportion of Households (%)
12%
10%
8%
6%
4%
2%
0%
Annual Household Income Bracket
Source: ABS Census (2016)
Housing Tenure
As at 2016, over 70.1% of dwellings in the proxy region were either owned outright
(29.2%) or were subject to a purchase mortgage (41.2%). Relative to Greater Sydney
(62.1%), home ownership in the proxy region is higher. Conversely, the proportion of
dwellings occupied by renting households is lower (27.3%) in the proxy area compared
to Greater Sydney (34.1%).
Housing Affordability
The proportion of income spent on mortgage repayments and rent is marginally less
than the Greater Sydney average. As at 2016, 28.2% and 23% of household income was
contributed toward mortgage repayments and rent, respectively, in the proxy area. By
comparison, 30.9% and 25.1% of income was attributed to mortgage repayments and
22rent in Greater Sydney. Evidently, the cost of housing is more affordable in the NWGA
and is an attractive proposition for higher income earners.
Housing Affordability Indicators - Proxy Area vs Greater Sydney (2016)
Proxy Area Greater Sydney
Indicators
Annual Average Proportion of Income (%) Annual Avergae Proportion of Income (%)
Mortgage Repayments $30,225 28% $28,137 30.1%
Rent $24,492 23% $22,880 25.1%
Household Income $105,768 100% $91,100 100%
Source: ABS Census (2016)
3.3 Key Findings
Key take-outs from the overview presented in this chapter are outlined below:
As at 2016, the NWGA estimated resident population was 74,897 persons.
The region’s population growth over the decade to 2016 (at 6.7%) was driven
primarily by young families and young workers. Average annual growth of 3,570
persons was achieved over the ten year period.
The north-west’s median annual household income is higher than that for Greater
Sydney. Around 70% of households earned more than $78,000 per annum in the
proxy area, compared with 64% in Greater Sydney.
Australian born residents account for 60.1% of the proxy area’s population, which
is generally in line with the Sydney average. However, the region includes a
higher than average proportion of Asian born residents (17.3%) and a lower
proportion of European born residents (6.8%) than the Sydney benchmark.
Traditional families (i.e. couples without children) are the most prevalent
household type in the proxy area, accounting for 63.6% of households, well
above the Sydney average of 48.2% of households.
The region’s resident population is expected to expand by 140,890 persons
between 2016 and 2031, reaching approximately 220,000 persons. We note that
average annual growth of almost 7,000 is anticipated, greater than that
registered over the ten years to 2015 (3,600).
About 63% of this growth will be taken up by families and young workers
(persons aged 0-34).
The home ownership level of the proxy population, at 70.1%, is significantly
higher than the Sydney average of 62.3%, with most homeowners in the process
of buying their homes (i.e. paying off a mortgage).
23Our view is that the north-west region has enjoyed strong population growth in the past
five years and growth is now starting to accelerate. An extended upturn in jobs growth
(civil activity across Sydney) is overlapping with extensive housing shortages to create
an outlook of recovery in the residential building activity. Population growth has been
prominent but has not reached its full potential as precinct planning has been a
constraint on growth in recent years.
There are still a handful of precincts that are yet to be rezoned 4 within the NWGA that
once done will lead to accelerated growth in the short and medium term. Suburbs
earmarked for major residential development going forward include Box Hill, Marsden
Park, Riverstone and Schofields. Collectively, DP&E has planned for an additional 92,400
residents over the next 10 years (equating to 33,000 additional dwellings) to 2031.
Dwelling growth going forward should have consideration for the following demographic
and housing indicators:
Pent-up demand for housing which will support sales over the next five years.
Price bands for new dwellings when compared against older houses and the
delivery of product to suit retiree demand. An ageing population will accelerate
downsizing activity.
Rental growth has exceeded price growth over the past decade, creating a
greater impetus behind first home buyer demand, and also attracting interest
from investors.
The relative affordability of a house in the north-west vs an apartment in
Parramatta.
It is our view that housing growth in the region should consider the needs of families
(detached dwellings) but also consider the need of downsizers and first home buyers
through the provision of more affordable medium and high density housing. Diversity in
housing stock will also enable families who cannot afford to buy a detached home to
instead buy a more affordable semi-detached dwelling with a backyard.
4
The following precincts are still unzoned: West Schofields, Marsden Park North, Shane's Park, Riverstone East
Stage 3, and Vineyard Stage 2
24Section 4: Residential Supply and Market Overview
This section of the report provides analysis of current residential land supply including
detailed commentary on the quantum of supply, mix including dwelling stock by type for
each release area, dwelling approvals, and median house price growth by dwelling type
and recent sales history.
4.1 Supply
Our desktop reconnaissance has revealed that there are significant quanta of housing
lots in the development pipeline in the NWGA. Overall, fifty-three major housing estate
projects have been identified, to be developed in stages over the next decade. Equating
to an additional 15,240 dwellings, the population is expected to increase by
approximately 50,000 persons from housing estate development alone (using an
average household size of 3.25)
A visual depiction of lot/dwelling sales over the short term is provided below. We have
determined that an average of almost 2,000 dwellings will be sold per annum over the
next six years from publically known housing estate development. Importantly, however,
this does not take into consideration development that is in the very early development
stage as well as mooted development. As such, this estimate is likely to be closer to
2,500 per annum.
Projected Lot Sales - North-West Growth Area (2016-2022)
Source: Cordell Connect (2017), MacroPlan (2017)
5
Blacktown Council advises flat rate of 3.2 people per dwelling for homeowners (i.e. detached housing).
25A comprehensive list of housing estate development in the pipeline is provided below.
Housing Estate Projects in Development Pipeline – Blacktown and The Hills
Expected
Development Dwellings Residents
Completions
THE GABLES 4000 12800 2019
THE NEW ROUSEHILL 1748 5594 2022
CLYDESDALE ESTATE 892 2854 2019
SKYLAND ESTATE 840 2688 2019
FAIRWATER ESTATE 751 2403 2022
WOORANG PARK 647 2070 2022
STONECUTTERS RIDGE - RESIDENTIAL SUBDIVISION 516 1651 2020
ALTROVE ESTATE 500 1600 2020
RICHMOND ROAD RESIDENTIAL SUBDIVISION PRECINCT 400 1280 2020
ELARA 309 989 2018
KALINA, THE PONDS 300 960 2018
RIVERSIDE OAKS 300 960 2022
ALDERTON DRIVE RESIDENTIAL SUBDIVISION 286 915 2018
MT CARMEL ESTATE 271 867 2020
WINTEN HILLS PRECINCT 5 RESIDENTIAL SUBDIVISION 266 851 2021
FOXALL ROAD SUBDIVISION 260 832 2020
BELLA VISTA WATERS 225 720 2020
TOWNSON ROAD RESIDENTIAL SUBDIVISION 213 682 2020
PARKLAND ESTATE 192 614 2019
MCCULLOCH STREET SUBDIVISION 178 570 2019
HAMBBLEDON ROAD SUBDIVISION 177 566 2019
SCHOFIELDS ESTATE 165 528 2018
TERRY ROADS RESIDENTIAL SUBDIVISION 155 496 2020
GARFIELD ROAD EAST SUBDIVISION 145 464 2018
RIVERSTONE SCHEDULED LANDS STAGE A2 135 432 2019
LE WINDSOR 106 339 2018
VINE ST & GRANGE AV SUBDIVISION 88 282 2019
BOUNDARY ROAD SUBDIVISION 80 256 2019
MEMORIAL AVENUE DWELLINGS 80 256 2019
BURDEKIN RD SUBDIVISION 79 253 2019
VINE STREET RESIDENTIAL SUBDIVISION 79 253 2018
MACKILLOP RIDGE ESTATE 77 246 2019
BLIGH STREET INTEGRATED HOUSING 69 221 2020
RIVERSTONE ROAD & BRIGHTON STREET DWELLINGS 69 221 2020
SIGNATURE ON EDMUND 65 208 2019
TERRY RD SUBDIVISION - KILLARNEY 63 202 2018
THE ORCHARD 60 192 2018
EDMUND ST SUBDIVISION 50 160 2019
TALLAWONG ROAD SUBDIVISION 47 150 2019
BELLE VUE ESTATE 46 147 2018
MASON ROAD RESIDENTIAL SITE 46 147 2019
WITHERS RD SUBDIVISION 45 144 2018
PITT TOWN ROAD SUBDIVISION 44 141 2018
CRITERION CR DWELLINGS 43 138 2019
SILVERSTONE STREET RESIDENTIAL 42 134 2019
RICHMOND RD & GRANGE AV SUBDIVISION 40 128 2018
CRANBOURNE STREET RESIDENTIAL SUBDIVISION 39 125 2018
CROWN ST RESIDENTIAL SUBDIVISION 38 122 2018
WRIGHTS RD SUBDIVISION 34 109 2022
WITHERS ROAD RESIDENTIAL SUBDIVISION 32 102 2019
CONRAD RD RESIDENTIAL DEVELOPMENT 31 99 2019
QUAKERS ROAD SUBDIVISION 31 99 2018
HEZLETT ROAD RESIDENTIAL SUBDIVISION 30 96 2019
Total 15,424 49,357 -
*Residents are derived using an average household size of 3.2
Source: Cordell Connect, Desktop Research, MacroPlan (2017)
26In addition to housing estate development, significant apartment development is in the
pipeline in the north-west, particularly along the NWRL corridor in The Hills Shire and
segments of the Blacktown LGA. Overall, 41 major apartment projects (greater than 100
dwellings) have been identified for development along the NWRL corridor alone. Equating
to 12,447 dwellings, this could potentially equate to an increase of 29,850 persons over
the next five to ten years (using an average household size of 2.46).
Although now somewhat outdated, the North West Rail Link Corridor Strategy (2013)
has outlined dwelling targets between 2012 and 2036. Overall, the Government would
like to see an additional 39,650 dwellings along the rail corridor (an average annual
increase 1,650). On-the-ground evidence suggests that these targets are being realised.
In fact, an annual average of approximately 2,000 dwellings are planned to be developed
over the next five years alone along the rail corridor.
Dwelling Targets and Dwellings in the Development Pipeline – NWRL Corridor
7,500
Annual Target
6,400
6,500 6,200
New Dwellings (2012-2036)
6,100
5,650
On the Ground
5,500 Realisation
4,350 4,300
4,500
3,700
3,500
2,950
2,500
1,500
Kellyville Bella Vista Castle Hill Norwest Showground Cherrybrook Cudgegong Rouse Hill
Road Road
NWRL Precinct
Source: Cordell Connect (2017), MacroPlan (2017), DP&E
Dwelling growth is expected to be most prominent in Kellyville, Bella Vista and Castle
Hill. Residential growth in these precincts is already prominent. Notably, Rouse Hill is
planned to have relatively subdued dwelling growth, however, development in the
pipeline suggests otherwise. A list of apartment projects in the planning and
development stage is provided overleaf. We also provide a visual representation of
dwelling targets and on-the-ground development along the rail corridor on Map 4.1.
6
MacroPlan anticipates that Apartment residents, especially in relation to homeowners, tend to be younger, of
smaller household size.
27Residential Development in the Pipeline along the Rail Corridor (100+ dwellings)
Project Title Project Address Project City Completion Date Status Units
SPURWAY DRIVE RESIDENTIAL DEVELOPMENT - THE ORCHARDS NORWEST 47 Spurway Dr BAULKHAM HILLS 27/11/2026 Possible 1179
MIXED USE DEVELOPMENT NORWEST LAKE - ESPLANADE 11-13 (Lot 5074) Solent Circuit (DP1003042) BAULKHAM HILLS 31/12/2020 Possible 247
WINDSOR & SEVEN HILLS RDS MIXED DEVELOPMENT - MODENA 346-350 Windsor Rd, 2 Seven Hills Rd & 27 Yattenden Cr BAULKHAM HILLS 16/02/2018 Firm 233
BULL & BUSH HOTEL SITE 360-378 Windsor Rd (Lots 1 & 2 DP783941) BAULKHAM HILLS 29/05/2022 Early 200
SPURWAY DRIVE UNITS - THE ORCHARDS NORWEST - IMPERIAL 47 Spurway Dr (Lots 32-33 DP247442, Lot 101 DP1176747) BAULKHAM HILLS 28/12/2018 Commenced 121
MACKILLOP DR RESIDENTIAL DEVELOPMENT - MACKILLOP RIDGE ESTATE 64 (Lot 2) Mackillop Dr (DP817696) BAULKHAM HILLS 21/02/2020 Early 118
OLD CASTLE HILL RD APARTMENTS - SKYVIEW CASTLE HILL 51-53 Old Castle Hill Rd CASTLE HILL 31/12/2020 Possible 923
CRANE ROAD PRECINCT - ATMOSPHERE 299-309 Old Northern Rd, cnr Crane Rd & Terminus St CASTLE HILL 26/01/2018 Commenced 378
THE GLASSHOUSE VILLAGE 2-4 Barry Rd KELLYVILLE 12/04/2021 Possible 319
BALMORAL RD UNITS - PEONY PLACE 17 (Lot 38) Balmoral Rd (DP10702) KELLYVILLE 31/10/2019 Commenced 290
BALMORAL RD APARTMENTS - SAVANT 19 (Lot 39) Balmoral Rd (DP10702) KELLYVILLE 27/03/2020 Possible 198
SWIFT PARROT CLOSE UNITS - GREYGUM ESTATE Lots 42-45 Swift Parrot Cl (DP1171547) KELLYVILLE 23/08/2019 Possible 193
HEZLETT RD UNITS - THE HUGH 182-186 (Lot 2) Hezlett Rd (DP1180345) KELLYVILLE 18/10/2019 Firm 181
HEZLETT RD UNITS 227-241 Hezlett Rd & Lords Bvd KELLYVILLE 6/03/2020 Possible 150
WITHERS RD UNITS - LINCOLN RISE APARTMENTS 16-20 Withers Rd KELLYVILLE 29/11/2019 Firm 140
HILLVIEW ROAD TOWNHOUSES 1 Hillview Rd (Lot 101 DP1199554) KELLYVILLE 30/06/2020 Possible 110
BALMORAL RD UNITS 21 Balmoral Rd KELLYVILLE 30/09/2019 Possible 109
REGENT HONEYEATER GROVE UNITS - GREYGUM ESTATE - THE GROVE 23 (Lot 39-41) Regent Honeyeater Gr (DP1171547) KELLYVILLE 23/02/2018 Commenced 105
PARKLAND ESTATE ROUSE HILL - 0VERALL CONCEPT PLAN 60 Cudgegong Rd, 99 & 107 Rouse Rd ROUSE HILL 2/02/2018 Early 718
CUDGEGONG ROAD APARTMENTS 44-56 Cudgegong Rd (Lots 117-118 DP208203) ROUSE HILL 30/12/2022 Possible 713
ROUSE RD RESIDENTIAL DEVELOPMENT - MASTERPLAN 96 Cudgegong Rd & 88-104 Rouse Rd ROUSE HILL 27/09/2019 Possible 691
TALLAWONG ROAD MIXED USE DEVELOPMENT 34-42 Tallawong Rd (Lots 68 & 69 DP30186) ROUSE HILL 13/09/2022 Possible 630
CUDGEGONG RD APARTMENTS 65 (Lot 75) Cudgegong Rd (DP208203) ROUSE HILL 30/11/2019 Possible 434
TALLAWONG ROAD UNITS 50 Tallawong Rd (Lot 67 DP30186) ROUSE HILL 30/12/2022 Possible 370
MACQUARIE ROAD MIXED USE DEVELOPMENT 25 Macquarie Rd (Lot 61 DP30186) ROUSE HILL 28/02/2022 Possible 334
TERRY ROAD APARTMENTS 41 Terry Rd (Lot 211 DP208203) ROUSE HILL 28/02/2020 Possible 331
TERRY ROAD MIXED USE DEVELOPMENT 25 Terry Rd (Lot 210 DP208203) ROUSE HILL 31/12/2021 Possible 310
CUDGEGONG ROAD APARTMENTS 38 Cudgegong Rd (Lot 119 DP208203) ROUSE HILL 25/12/2020 Possible 295
TERRY RD UNITS - EVERGRAND 9 (Lot 209) Terry Rd (DP208203) ROUSE HILL 18/09/2020 Firm 256
WINDSOR RD UNITS 828 (Lot 4) Windsor Rd (DP135883) ROUSE HILL 26/10/2018 Commenced 253
ROUSE ROAD RESIDENTIAL DEVELOPMENT - THE MAJESTIC 96 Cudgegong Rd & 88-104 Rouse Rd ROUSE HILL 30/06/2021 Possible 243
TALLAWONG ROAD APARTMENTS 95 Tallawong Rd (Lot 34 DP30186) ROUSE HILL 23/06/2021 Possible 227
LOTUS APARTMENTS STAGE 3 90 & 107 Rouse Rd & 60 Cudgegong Rd (Lots 116, 121-122 DP208203) ROUSE HILL 29/03/2021 Possible 215
SCHOFIELDS RD UNITS - HIGHBURY 103 (Lot 8) Schofields Rd (DP1190434) ROUSE HILL 30/10/2020 Possible 208
CUDGEGONG ROAD UNITS STAGES 1-3 105 Cudgegong Rd (Lot 80 DP208203) ROUSE HILL 27/06/2022 Possible 201
EVERGREEN APARTMENTS 822 Windsor Rd (Lot 205 DP660230) ROUSE HILL 28/02/2020 Possible 156
SALENTO RESIDENTIAL DEVELOPMENT 876 Windsor Rd (Lot 3 DP135890) ROUSE HILL 9/06/2021 Possible 154
WINDSOR ROAD UNITS 848 Windsor Rd (Lot 100 DP1049793) ROUSE HILL 19/06/2020 Possible 140
ANNANGROVE ROAD SHOP TOP HOUSING 332-334 Annangrove Rd (Lot 13 DP833069) ROUSE HILL 31/05/2019 Possible 136
TALLAWONG ROAD UNITS 84 Tallawong Rd (Lot 63 DP30186) ROUSE HILL 9/10/2021 Possible 123
TALLAWONG ROAD UNITS 172 Tallawong Rd (Lot 53 DP30186) ROUSE HILL 18/12/2020 Possible 115
Total 12,447
Source: Cordell Connect (2017) *Excludes deferred and abandoned projects
Note – these projects are in the early planning phase and dwelling estimates are subject to change.
28Map 4.1: Sydney Metro NW Rail Corridor *U/C – Under Construction Dwelling Targets & Current Developments
Having regard for the before-mentioned indicators we anticipate annual dwelling growth
in the order of 4,500 per annum over the next five years which is expected to flat line to
3,800 dwellings in the years following (2021-2031).
Dwelling Growth – North West Growth Area (2017-2031)
Source: Cordell Connect (2017), MacroPlan (2017)
4.2 Sales Evidence
The following historical data over the five years to 2017 provides an indication of take-
up, supporting the prospect for residential development at West Schofields. Overall there
has been an average of:
878 and 2,438 vacant lot sales in The Hills Shire and Blacktown LGAs,
respectively.
4,367 and 5,687 detached house sales in The Hills Shire and Blacktown LGAs,
respectively.
787 and 1,139 apartment sales in The Hills Shire and Blacktown LGAs,
respectively.
Although the geographic spread of The Hills Shire and Blacktown includes areas outside
of the defined North-West Growth Area boundary, the data helps to mount a strong
argument that take-up will in-fact be strong in West Schofields.
30Historic Lot and Dwelling Sales – The Hills Shire and Blacktown (2010-2017)
Annual
Type LGA 2010 2011 2012 2013 2014 2015 2016 2017
Average
The Hills Shire 659 711 749 1,182 1,028 845 868 982 878
Vacant Lots Blacktown 2,695 2,231 2,622 3,178 4,375 1,329 1,245 1,832 2,438
Total 3,354 2,942 3,371 4,360 5,403 2,174 2,113 2,814 3,316
The Hills Shire 4,328 4,114 4,260 5,058 5,003 4,181 3,892 4,101 4,367
House
Blacktown 4,943 5,628 5,172 6,571 6,947 5,774 5,324 5,134 5,687
Sales
Total 9,271 9,742 9,432 11,629 11,950 9,955 9,216 9,235 10,054
The Hills Shire 834 808 904 902 810 680 720 638 787
Apartment
Blacktown 1,061 1,089 1,019 1,433 1,370 1,003 1,131 1,003 1,139
Sales
Total 1,895 1,897 1,923 2,335 2,180 1,683 1,851 1,641 1,926
Source: RP Data (2017), MacroPlan (2017)
4.3 Dwelling Mix
The majority of existing housing estate development comprises of medium to large sized
dwelling lots. As a reference point, a list of indicative lot sizes by housing type (published
in the Growth Centres Development Code 2006) is provided below.
Indicative Lot Size
Housing Type Indicative Lot Size
Apartments n.a.
Townhouses, semi-detached
Up to 350m²
and detached small dwellings
Detached medium dwellings 350-450m²
Detached large dwellings 450m² +
Source: Growth Centres Development Code (2006)
Notably, a shift to smaller sized dwellings is occurring in the region. In FY12, 10% of lots
were sized below 350m² (i.e. town houses or small detached dwellings). In FY14 this had
grown to 17% and FY17 saw this rate increase to 36% of all land sales. Although not as
large, medium sized lots have also increased in popularity. In 2012 21% of all sales were
medium sizes, expanding to 40% in 2017.
The growth in small and medium sized lots is gaining momentum at the expense of large
lots; particularly as large lot affordability continues to deteriorate. A small and medium
sized lot is favourable as it provides an affordable, suitable living option for families,
particularly compared with the proposition of an apartment. Although smaller in total
area, townhouses generally have three to four bedrooms (the equivalent of a detached
dwelling).
31Land Sales by Lot Size – North West Land Market (FY12 – FY17)
*Comprising of suburbs (Schofields, Rouse Hill, Kellyville, Marsden Park, Colebee, Riverstone, The Ponds)
Source: RP Data, MacroPlan (2017)
Notably, the popularity of small and medium sized lots is more pronounced in The Hills
Shire relative to the Blacktown LGA. This reflects the relative affordability of lots in
respective LGAs.
A major project in the pipeline comprising wholly of small lots and apartments is Skyland
Estate in Schofields. The development encompasses a total of 840 dwellings with 280
small lots and 560 apartments.
There is also, a greater quantum of mixed use and apartment development coming on to
the market. Whilst still in the early planning phase, Clydesdale Estate in Marsden Park is
planned to encompass 650 apartments and 242 small residential lots. Significant
apartment development is occurring at the Cudgegong Road precinct and in Rouse Hill
including the following projects:
Evergrand
Phoenix Apartments
Rouse Hill Town Centre developments
32A visual representation of dwelling approvals between 2012 and 2017 by dwelling type is
provided overleaf on Map 4.2. Major approvals have occurred in the following precincts:
Alex Avenue
Balmoral Road (consisting primarily of apartments and townhouses)
North Kellyville (major apartment and townhouse development)
Rouse Hill (apartment development)
33Map 4.2: North West Sydney Land Market Dwelling Approvals 2012-17
4.4      Dwelling Approvals

Graphs outlining dwelling approvals over the twelve years to FY 2017 in Riverstone –
Marsden Park, Kellyville and Rouse Hill – Beaumont Hills are provided below.

Interestingly, the number of dwellings approvals in the Riverstone – Marsden Park SA2
region has increased markedly (location of West Schofields); however, the type of
dwellings has consisted mainly of detached dwellings. This reflects distance to the North
West Rail Line (NWRL), government policy, housing affordability (relative to an
apartment) and market appetite. Current State Government policy has a focus on higher
residential densities around public transport nodes.

However, it is our view that apartments and medium density dwellings will gain
momentum in the short to medium term; already reflected in the growing number of
townhouse and apartment approvals in the SA2 region. As housing becomes more
unattainable and unaffordable; families, first home buyers and downsizers will seek more
affordable, suitable dwelling typologies.

New Dwelling Approvals – Riverstone/Marsden Park SA2 Region (2005-2017)

*Includes Alex Avenue, Schofields West, Schofields and Marsden Park

Source: ABS Dwelling Approvals (2017)

As a point of comparison, the Kellyville and Rouse Hill SA2 regions which are situated
along the NWRL have had a significant increase in the number of medium and high
density dwelling approvals (particularly apartments). This proposition along the rail

                                                                                            35
network (to be complete by 2024) is particularly attractive to first home buyers,
downsizers and families that seek a more affordable way to stay in The Hills Shire LGA.
New Dwelling Approvals – Kellyville SA2 Region (2005-2017)
*Includes Kellyville
Source: ABS Dwelling Approvals (2017)
New Dwelling Approvals – Rouse Hill/Beaumont Hills SA2 Region (2005-2017)
*Includes North Kellyville
Source: ABS Dwelling Approvals (2017)
364.5 Median Lot Price Growth
A comprehensive list of prices associated with small, medium and large lots in the north-
west region is provided below. Median prices are higher in suburbs of The Hills Shire
relative to the Blacktown LGA. Lot values in Beaumont Hills are the highest, followed by
The Ponds and Rouse Hill. Marsden Park is the most affordable suburb, followed by
Riverstone.
Median Lot Price by Size (2016-2017)
Small Medium Large
Suburb
Price Price/m² Price Price/m² Price Price/m²
Beaumont Hills N/A N/A N/A N/A $710,000 $1,574
Kellyville $430,000 $1,470 $585,183 $1,468 $560,000 $1,244
Rouse Hill $475,934 $2,018 $547,000 $1,391 $612,000 $1,299
Colebee $440,000 $1,290 $499,000 $1,277 $565,000 $1,125
Marsden Park $354,563 $1,250 $442,000 $1,143 $478,000 $1,044
Riverstone $398,462 $1,258 $464,000 $1,186 $499,000 $1,017
Ropes Crossing N/A N/A N/A N/A N/A N/A
Schofields $398,800 $1,382 $515,688 $1,300 $580,136 $1,196
The Ponds $512,000 $1,555 $525,780 $1,373 $672,500 $1,110
Source: RP Data (2017)
We also provide price points in 2013/14 to determine changes in value ($/m²). It
appears that small lots have increased by the largest amount of all lot types (50%
overall). Large lots have also increase substantially (48.3%) in all select suburbs. In
contrast, medium sized dwelling have increased by a more subdued rate of 36%. Price
variances reflect market appetite for certain product.
37Median Lot Price by Size (2012-2013)
Small Medium Large
Suburb
Price Price/m² Price Price/m² Price Price/m²
Beaumont Hills 377,000 1,047 390,000 944 413,750 745
Kellyville 360,000 1,259 395,000 955 475,000 779
Rouse Hill 335,000 946 365,000 936 611,500 683
Colebee 300,000 909 342,000 842 386,000 759
Marsden Park 295,000 843 374,500 880 390,000 523
Riverstone 288,500 824 291,500 756 299,000 593
Ropes Crossing 211,000 748 248,000 611 269,625 525
Schofields 306,900 968 324,450 831 368,900 752
The Ponds 211,667 748 370,000 957 400,000 776
Source: RP Data (2017)
Price Growth (2012/13 – 2016/17)
Small Medium Large
Suburb
Price Price/m² Price Price/m² Price Price/m²
Beaumont Hills 71.6% 111.2%
Kellyville 19.4% 16.8% 48.1% 53.8% 17.9% 59.7%
Rouse Hill 42.1% 113.2% 49.9% 48.7% 0.1% 90.3%
Colebee 46.7% 41.9% 45.9% 51.7% 46.4% 48.3%
Marsden Park 20.2% 48.3% 18.0% 29.9% 22.6% 99.8%
Riverstone 38.1% 52.6% 59.2% 56.8% 66.9% 71.6%
Ropes Crossing
Schofields 29.9% 42.7% 58.9% 56.5% 57.3% 58.9%
The Ponds 141.9% 107.9% 42.1% 43.4% 68.1% 43.1%
Source: RP Data (2017)
4.6 Median Dwelling Price Growth
Median detached dwelling price growth over the eleven years to 2017 has been most
prominent in Colebee – growth of 13.2% per annum. This is followed by The Ponds
(12.4%) and Ropes Crossing (10.1%).
Subdued growth was experienced in Beaumont Hills (7%), Schofields (Kellyville 7.1%)
and Rouse Hill (7%). Slow growth can be attributed to the notion that these suburbs
already had a relatively high median sale price in 2006.
38You can also read