Indiana Interpretive Guide for Statewide Assessments - 2020-2021 Indiana Department of Education
←
→
Page content transcription
If your browser does not render page correctly, please read the page content below
Indiana
Interpretive Guide for Statewide
          Assessments

          2020–2021

          Indiana Department of Education

                         i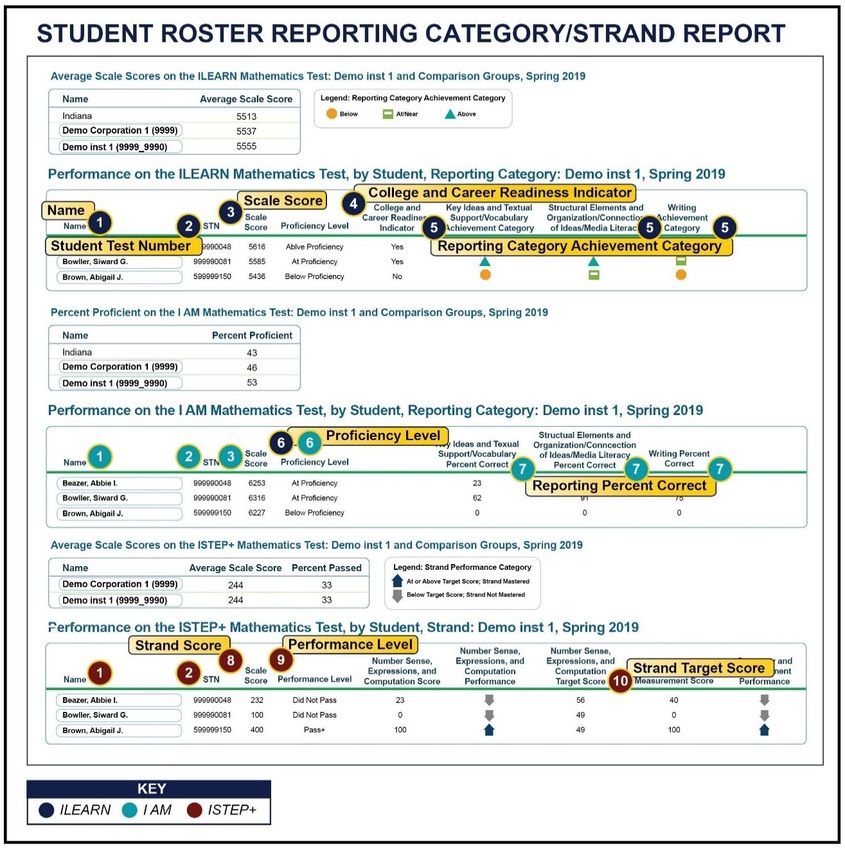
Table of Contents
Introduction ................................................................................................................................... 1
   Overview of Interpretive Guide .................................................................................................. 1
   Overview of Indiana Assessments ............................................................................................ 1
   Test Design Principles ............................................................................................................... 2
Principles of Reporting, Interpretation, and Use ........................................................................... 9
   Overall Scale Scores ................................................................................................................. 9
   Standard Error of Measurement .............................................................................................. 10
   Proficiency Levels ................................................................................................................... 11
   Sample Reports ....................................................................................................................... 15
   Individual Score Reports ......................................................................................................... 16
   Interpretation of Aggregate Scores ......................................................................................... 34
   Interpretation of Aggregate-Level ORS Reports ..................................................................... 34
   Preliminary Results ................................................................................................................. 45
Glossary ...................................................................................................................................... 47
References.................................................................................................................................. 49

                                                                        i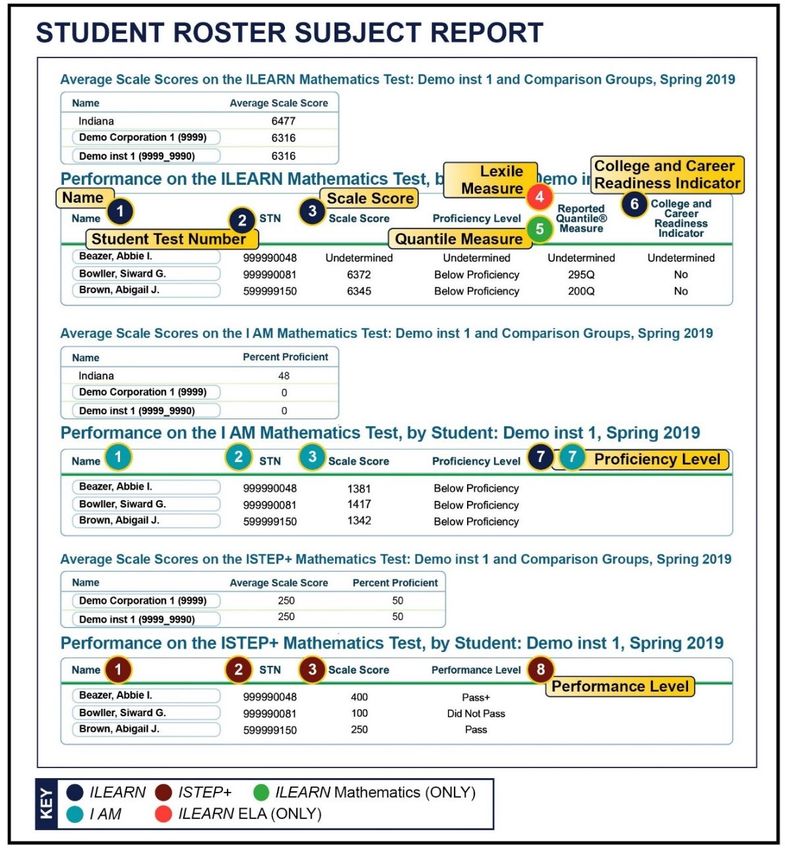
List of Tables
Table 1: Blueprint and Item Specification Location by Assessment Program ............................... 4
Table 2: Location of ILEARN PLDs ............................................................................................... 7
Table 3: Location of I AM PLDs .................................................................................................... 7
Table 4: Location of ISTEP+ PLDs ............................................................................................... 8
Table 5: Location of IREAD-3 PLDs ............................................................................................. 8
Table 6: ILEARN Proficiency Levels ........................................................................................... 12
Table 7: I AM Proficiency Levels ................................................................................................. 13
Table 8: ISTEP+ Proficiency Levels............................................................................................ 14
Table 9: IREAD-3 Proficiency Levels .......................................................................................... 15
Table 10: Reports Available to Parents/Guardians and Educators ............................................. 16
Table 11: ILEARN Scale Score Ranges ..................................................................................... 19
Table 12: I AM Scale Score Ranges ........................................................................................... 20
Table 13: IREAD-3 Scale Score Ranges .................................................................................... 20
Table 14: ISTEP+ Scale Score Ranges ...................................................................................... 21
Table 15: Reporting Category Score .......................................................................................... 21
Table 16: Example of Reporting Category and Next Steps ........................................................ 22
Table 17: ILEARN Condition Codes ........................................................................................... 24
Table 18: ISTEP+ Condition Codes ............................................................................................ 25
Table 19: ILEARN Narrative Writing Rubric ................................................................................ 25
Table 20: ILEARN Informative Writing Rubric ............................................................................. 26
Table 21: ILEARN Persuasive Writing Rubric ............................................................................. 27
Table 22: ILEARN Explanatory Writing Rubric ........................................................................... 28
Table 23: ILEARN Argumentative Writing Rubric ....................................................................... 29
Table 24: ISTEP+ ELA 2-Point Constructed-Response Rubric .................................................. 31
Table 25: ISTEP+ Writing Rubric Grades 5–12 .......................................................................... 31
Table 26: ISTEP+ Grammar and Usage Rubric Grades 9–12 .................................................... 32

List of Figures
Figure 1: Evidence-Centered Design ............................................................................................ 3
Figure 2: Annotated ILEARN Mathematics Grade 3 Blueprint ...................................................... 5
Figure 3: Precision in Measurement ........................................................................................... 11
Figure 4: Individual Score Report Details ................................................................................... 17
Figure 5: Aggregate-Level Subject Detail Report ....................................................................... 35
Figure 6: Aggregate-Level Reporting Category Detail Report .................................................... 37
Figure 7: Aggregate-Level Standard Detail Report ..................................................................... 39
Figure 8: Student Roster Subject Report .................................................................................... 41
Figure 9: Student Roster Reporting Category/Strand Report ..................................................... 43
Figure 10: Preliminary Results Timeline ..................................................................................... 46

                                                                 ii
Introduction
Overview of Interpretive Guide
The Indiana Interpretive Guide for Statewide Assessments is designed to help
educators, parents, students, and other stakeholders understand and interpret the
results of Indiana’s four assessments. These four assessments include the Indiana
Learning Evaluation Assessment Readiness Network (ILEARN); Indiana’s Alternate
Measure (I AM); the Indiana Statewide Testing for Educational Progress-Plus (ISTEP+);
and the Indiana Reading Evaluation and Determination, Grade 3 (IREAD-3)
assessments. This guide provides information on how to appropriately interpret data in
Individual Student Reports (ISRs) and other reports available to educators through the
Online Reporting System (ORS).

Overview of Indiana Assessments
Indiana’s assessments support instruction and student learning by providing feedback
to educators and parents. Educators and parents can use this feedback to inform
instructional strategies and content that help guide student learning. All Indiana
assessment programs discussed in this guide are criterion-referenced and summative.
Criterion-referenced assessments measure students’ knowledge and ability based on
specific standards, such as the Indiana Academic Standards (IAS). Summative
assessments provide useful data for measuring growth, proficiency, and/or learning
gaps between different groups of students at a specific point in time. Summative
assessments are frequently considered high-stakes evaluations. Results of high-stakes
evaluations may inform accountability measures for a school or determine a student’s
promotion to the next grade level. Corporations, schools, educators, and parents use
summative assessment data to evaluate student learning at the end of an instructional
unit, such as at the end of a school year, by comparing assessment results against a
standard or benchmark. Educators and parents can compare performance across
students, classes, schools, and corporations.
The 2020–2021 Indiana Assessments Overview Chart on the Indiana Department of
Education’s (IDOE’s) website provides an overview of the key aspects of each program
(ILEARN, I AM, IREAD-3, and ISTEP+) discussed in this guide.
The Released Items Repository (RIR) for each program, accessible from the Indiana
Assessment Portal, allows parents, educators, and students to view sample
assessments for each grade and content area. The RIR helps parents, educators, and
students prepare for testing by allowing users to practice taking or administering
assessments before the official test administration. Users can view the layout of each

                                           1
test, interact with test content and features, and learn about accommodations available
for each assessment.

Test Design Principles
This section of the interpretative guide provides an overview of the test design principles
used in the development of all Indiana assessments. These principles ensure the
assessments are grounded in research and allow for specific claims about student
knowledge and understanding. Outlined below are definitions of key terms and ideas.
While this section provides useful background information about the assessments, a
thorough understanding of these ideas is not necessary to interpret the reports.

Test validity is the extent to which an assessment measures what it is supposed to
measure. An assessment is created to measure what a specific group of students
knows about a topic or topics under specific conditions (AERA, APA, and NCME, 2014;
NRC, 2007). The results of an assessment will only be valid if it is taken by the intended
group under the standardized conditions. The test content is intended to align with the
instruction occurring at a given grade level and content area. For example in Indiana,
ILEARN assesses the grade four Indiana Academic Standards for grade four students
and this is considered a valid assessment.

Reliability refers to the consistency of a measurement over time. For example, the score
should remain relatively consistent, or reliable, if the same student takes the same
assessment on different occasions. When used as designed, test data can provide
useful information.

Evidence-Centered Design
Each Indiana assessment was developed in collaboration with Indiana educators using
evidence-centered design. Assessments are designed using this process by gathering
reliable evidence to support claims about student learning and knowledge. Evidence-
centered design uses test blueprints and item specifications to ensure the validity and
reliability of the assessment results. Test blueprints pinpoint the content to be assessed.
Item specifications show how each standard should be assessed.
Assessment design begins with a clear outline of the desired content claims in relation
to student learning. Content claims are statements that can be made about student
learning based on student performance on an assessment. For example, the primary
content claim made about Indiana students who participate in ILEARN assessments is
whether they are college- and career-ready. Test design principles consider the
evidence that is collected at each step to ensure that reporting can represent the claim
being made about students.

                                             2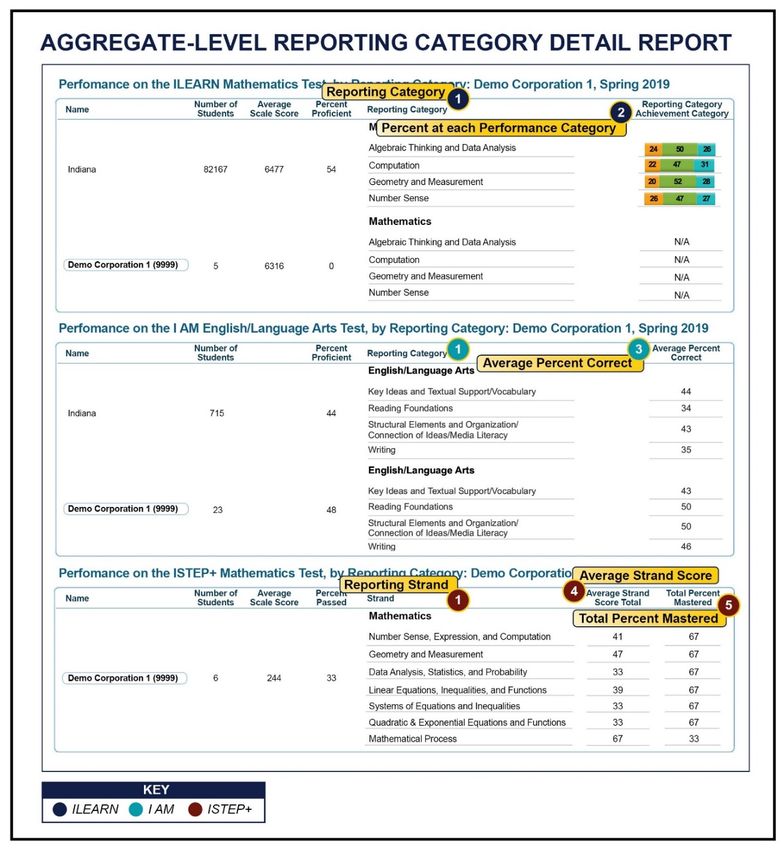
Figure 1: Evidence-Centered Design

A student’s ability is estimated based on the evidence gathered from each item (i.e., a
student’s responses to an item). For example, the ILEARN test results, or how a student
performed on the test, will indicate whether a student has achieved the content claim
and is on track to college- and career-readiness as expected.
The standards were designed to ensure that students participating in ILEARN receive
the instruction they need to be college- and career-ready by graduation and that
students participating in I AM receive the instruction they need to be on track for
postsecondary education or competitive integrated employment. The IAS were
approved by the Indiana State Board of Education in April 2014 for English/Language
Arts (ELA) and Mathematics and March 2015 for Social Studies. The IAS for Science
were updated in 2016 to reflect changes in Science content. Indiana’s Alternate
Academic Standards, or Content Connectors, were approved by the Indiana State
Board of Education in June of 2018. More information about the IAS and Content
Connectors can be found on IDOE’s website: https://www.doe.in.gov/standards.
Blueprints define the essential content that an assessment will measure by determining
which standards are the most important to assess. Standards are prioritized based on
the knowledge, skills, and abilities Indiana educators believe students need to know to
be ready for college and careers, post-secondary education, or integrated employment.
Indiana educator committees created the blueprints for all Indiana assessments. Test
blueprints do not change once they have been set for an assessment program unless
standards or policy changes require edits. The standards on the blueprint are measured
with test items.
Item specifications define how each standard will be measured and include the
cognitive complexity of the standard (i.e., difficulty level of that standard), evidence

                                              3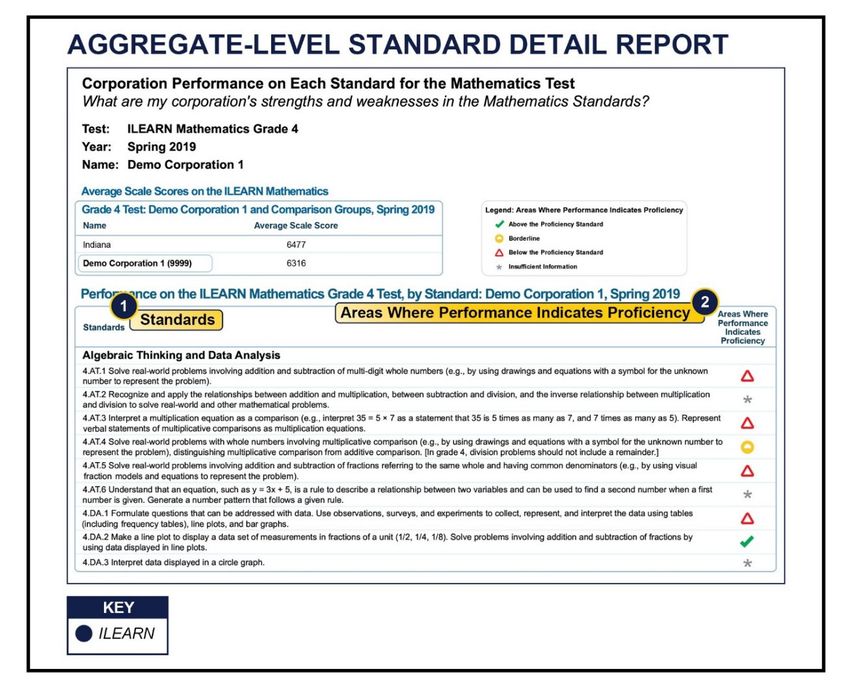
required to show a student has mastered the standard, and possible item types for the
assessment. An item specification exists for every standard measured on each of the
Indiana assessments. Item writers use item specifications to carefully develop items.
Item specifications are also a resource for educators. Links to blueprints and item
specifications for all grades and subjects can be found in Table 1.
Evidence-centered design culminates in the delivery of the tests to the student.
Successful student performance can show mastery of IAS or Content Connectors.
Proficiency levels on ISRs demonstrate a student's performance.

Test Blueprints
Test blueprints reflect reporting categories. Reporting categories are groups of similar
standards that are assessed within each grade and subject. These sets of standards
can be used to identify each student’s relative strengths or weaknesses for different
subdomains of a content area. For example, in Mathematics, some reporting categories
are Algebraic Thinking and Data Analysis, Computation, and Number Sense. Student
performance within a reporting category indicates how proficient a student is with that
subdomain of content.
IDOE worked closely with Indiana educators to create blueprints that guide the item
development process for all grades and subjects. Educators discussed during in-person
workshops what potential reporting categories and reporting frameworks would best
support instruction in Indiana. Educators and IDOE used the results to create blueprints.
ILEARN blueprints represent educator feedback on how the grades 3-8 standards need
to be assessed to show that students are on track to be college- and career-ready.
Educators followed the same process to develop the I AM blueprints. Educators
considered the ILEARN priorities, the I AM Content Connectors, and the expectations
that students are on track for post-secondary education or integrated employment.
ISTEP+ was established as a reflection of student’s college- and career-readiness as
the final high school assessment mandated by the state for accountability and
graduation requirements. IREAD-3 blueprints were defined to represent the priority of
standards for reading foundations by the end of grade 3.
Table 1 gives the blueprint and item specification location for each assessment
program.

Table 1: Blueprint and Item Specification Location by Assessment Program
               Blueprint and Item Specification Location
                                        ILEARN
                                          I AM
                                        ISTEP+
                                        IREAD-3

                                            4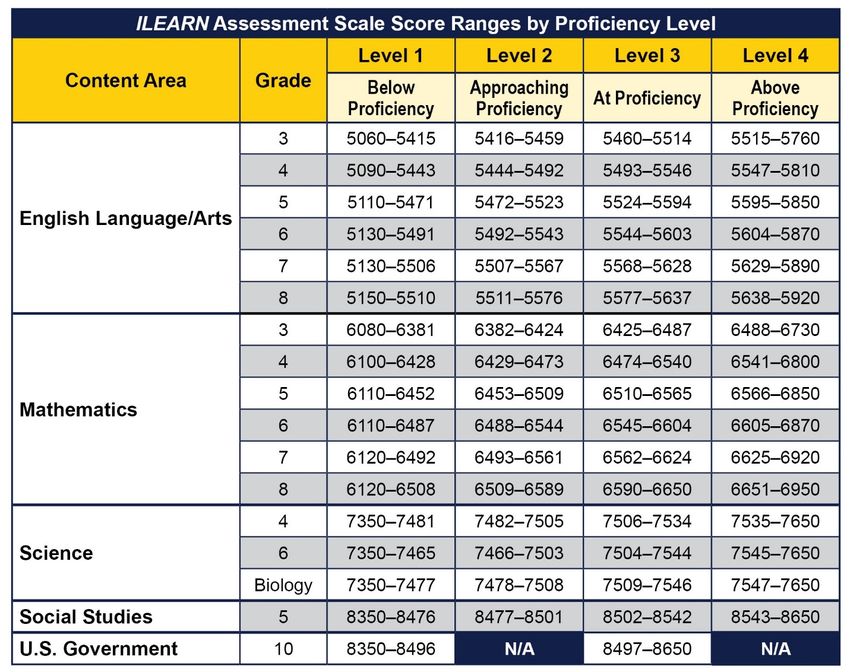
Figure 2 displays an annotated ILEARN Mathematics grade 3 blueprint.
Figure 2: Annotated ILEARN Mathematics Grade 3 Blueprint

                                         5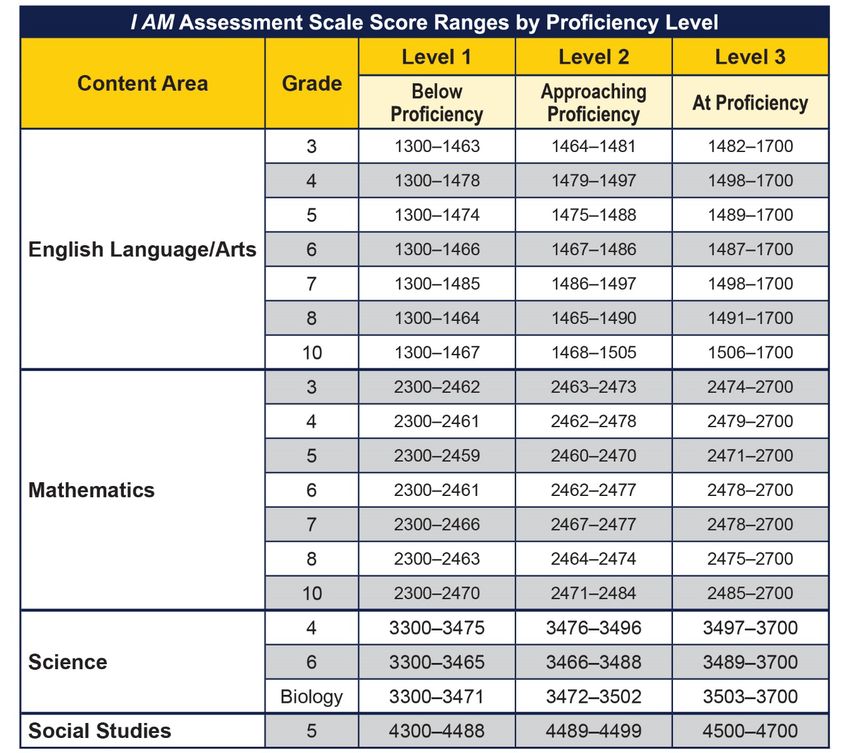
The line at the bottom of the blueprint indicates the total number of operational items
used in calculating student scores. The ILEARN grade 3 Mathematics assessment has
between 46 and 48 operational items. The Reporting Category column indicates the
overall percentage of the assessment characterized by each specific reporting category.
The last column indicates the overall item range for each specific reporting category. In
this example, the first reporting category is Algebraic Thinking and Data Analysis. Each
grade 3 Mathematics assessment has 9–11 Algebraic Thinking and Data Analysis items
that cover 19–24 percent of the overall test length.
The Standard column lists all standards assessed for the given grade and subject by
reporting category. The Standard Item Range and Standard % of Test columns indicate
the minimum and maximum number of items per standard on each assessment, as well
as how much of the assessment is about each standard. For example, each grade 3
Mathematics assessment has a minimum of one and a maximum of three items from
Standard 3.AT.1. These items cover 2–7 percent of the overall test length. There is a
minimum of 0 and a maximum of 2 items from Standard 3.AT.2, covering 0–4 percent of
the overall test length. The different values for minimum and maximum item counts
were determined by the standard weights applied by educators during blueprint
construction. Educators determined that Standard 3.AT.1 was a higher priority and has
a higher minimum and maximum. Educators determined that Standard 3.AT.2 was a
lower priority and has a lower minimum and maximum.
Educators identified some standards as important for inclusion on the assessment but
did not prioritize them highly enough to be reported as a separate reporting category.
Process Standards for all ILEARN Mathematics assessments includes this type of
standard.
Educators and parents can review a student’s reporting category performances on his
or her ISR. The ISR indicates reporting category performance as Below, At/Near, or
Above the At Proficiency performance expectation for the given reporting category.
Students characterized as Below Proficiency are below the At Proficiency performance
expectation and need additional support and instruction to master the standards
represented by the reporting category. Students characterized as Above Proficiency are
above the At Proficiency performance expectation and almost always successfully
answer questions related to the standards represented by the reporting category.
Students characterized as At/Near the performance expectation perform close to the At
Proficiency level, but there is not enough information to fully determine whether they are
above or below the performance expectation. Educators and parents may ask for
additional information about the student’s proficiency to better target remediation and
support.

Performance-Level Descriptors
A Performance-Level Descriptor (PLD) outlines the knowledge and skills that students
performing at a given level demonstrate in each content area and at each grade level

                                            6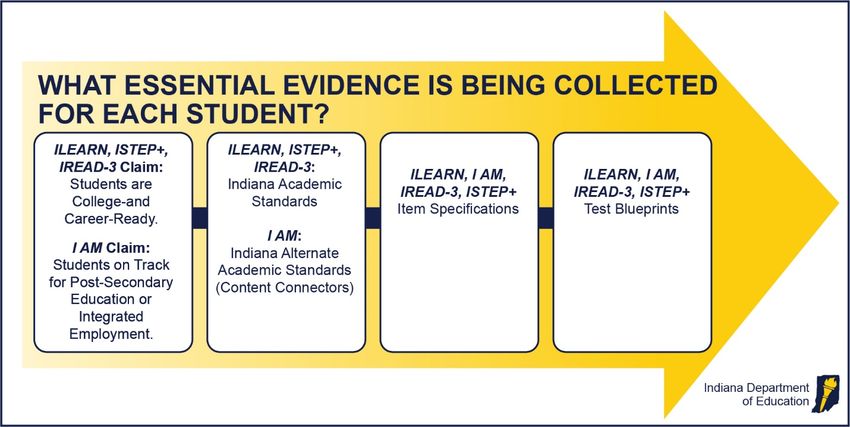
for each standard assessed. For example, in Mathematics, IAS 3.AT.1 states that
students should be able to solve real-world problems involving addition and subtraction
of whole numbers within 1000 (e.g., by using drawings and equations with a symbol for
the unknown number to represent the problem). The PLD for a student demonstrating
knowledge and skills at the Below Proficiency level for this standard is: “Identifies real-
world problems as addition or subtraction.” The knowledge and skills required for this
PLD are less complex than the knowledge and skills required for the At Proficiency
PLD: “Solves real-world problems involving addition and subtraction of whole numbers
within 1000.”
IDOE involved Indiana educators in the development of the PLDs for all Indiana
summative assessments. Table 2, Table 3, Table 4, and Table 5 include the hyperlinks
to access the PLDs for each assessment.

Table 2: Location of ILEARN PLDs
                          ILEARN Range PLDs
    Mathematics                ELA                  Science        Social Studies
       Grade 3                Grade 3
       Grade 4                Grade 4               Grade 4
       Grade 5                Grade 5                                  Grade 5
       Grade 6                Grade 6               Grade 6
       Grade 7                Grade 7
       Grade 8                Grade 8
                                                     Biology       U.S. Government

Table 3: Location of I AM PLDs
                                 I AM Range PLDs
    Mathematics                ELA                  Science        Social Studies
       Grade 3                Grade 3
       Grade 4                Grade 4               Grade 4
       Grade 5                Grade 5                                  Grade 5
       Grade 6                Grade 6               Grade 6
       Grade 7                Grade 7
       Grade 8                Grade 8
       Grade 10              Grade 10
                                                    Biology

                                             7
Table 4: Location of ISTEP+ PLDs
ISTEP+ PLDs
Mathematics Grade 10
ELA Grade 10
Table 5: Location of IREAD-3 PLDs
IREAD-3 PLDs
Grade 3
8Principles of Reporting, Interpretation, and
Use
Scores reflect student achievement on the IAS for ILEARN, IREAD-3, and ISTEP+ and
on the Content Connectors for I AM. Indiana’s assessments support instruction and
student learning by providing feedback to students, educators, and parents. Parents
and educators may monitor student achievement at the student or school level using a
variety of reporting metrics.
Parents and educators should interpret all assessment reports and scores with caution.
Consider the following when reviewing reports and scores:
• Scale scores are estimates of true scores and have some level of error
associated with them. See the Standard Error of Measurement (SEM) for more
details about the level of error and interpretation.
• Aggregated score reports represent group characteristics. Users must consider
the number of students in each group when performance is compared across
groups. The sections below outline additional details to consider when viewing
aggregate reports.
• Summative assessment results should not be the only piece of information
considered when reviewing student performance. Summative assessment results
provide limited information. Other sources of data, such as classroom
assessments and teacher evaluations, should be considered when making
decisions regarding student learning. Assessment scores reflect a student’s
performance on a single day and may vary depending on several factors.
Overall Scale Scores
For all Indiana assessments, students receive an overall subject area score called a
scale score. Scale scores are standardized scores that are comparable across years
and test forms. Items on assessments range in difficulty from easy to hard. Two
students that correctly answered the same number of items might receive different scale
scores. Scale scores are a consistent measure across test forms whether a student
takes a fixed-form or computer adaptive test.
Attemptedness
There may be times when a student starts, but does not finish, an assessment. Each
assessment has rules that determine when a student has “attempted” an assessment
and will receive a score, and how an incomplete assessment will be scored.
A student must answer a minimum number of items on the assessment to receive a
useful and trustworthy score. The same is true for reporting category scores. Most
students complete their assessment and receive both overall and reporting category
9scores across all grades, subjects, and assessments. In some cases, a student may
receive an overall score but no reporting category scores. For ISTEP+, it is possible to
receive one or more reporting category scores but not an overall score.
For all assessments, if a student started an assessment but did not answer enough
items to demonstrate their knowledge and skills, their score report will show as
Undetermined (UND). Students may have a UND for overall and reporting category
scores or a UND for only reporting category scores depending on the number of items
the student answered. For ISTEP+, students could receive a UND for overall score but
receive scores for one or more reporting categories. For the I AM assessment, if a
student demonstrates he or she is not engaged with the assessment by continuously
not responding to items, their score report may show No Mode of Communication
(NMC).
If parents, teachers, principals, or other school personnel believe their student(s) should
have received reported scores, they should contact the Indiana Assessment Help Desk.
Standard Error of Measurement
All students have a given level of knowledge and skills. Assessments are designed to
measure what students know and can do, and that process can be complex. Student
performance on an assessment may vary due to a variety of reasons (e.g., they are not
feeling well, or they are not feeling motivated). Student knowledge and skills cannot be
measured precisely in the way an object’s weight can. Student performance will vary
depending on the circumstances in which the assessment is taken. An object’s weight
will always remain the same. Figure 3 illustrates this idea.
The Standard Error of Measurement (SEM) is the range in which a student’s “true
score” is expected to fall. A student’s “true score” is what he or she knows and can do.
SEM incorporates the factors that affect a student’s performance and is useful to
students, parents, and teachers. It acknowledges the difficulty of measuring a true score
by providing a likely range of the student’s knowledge and skills.
10Figure 3: Precision in Measurement
SEM allows users to estimate a score range that a student would likely fall within if the
same assessment was given to the student multiple times. For example, a scale score
of 2535 with an SEM of 22 indicates that if the student completed the same test multiple
times, the score would likely fall between 2513 and 2557. Scale scores and SEMs will
vary based on the test and student. All test scores, including scores on assessments
and quizzes designed and administered by classroom teachers, are subject to some
degree of measurement error.
Proficiency Levels
The Every Student Succeeds Act (ESSA) is federal legislation that requires student
achievement to be reported in terms of at least three proficiency levels. Proficiency
levels are ranges on a student achievement scale that classify students by how many of
the content standards they know. One of these proficiency levels must be designated as
the proficient level. Each state must determine the number of proficiency levels to use
and the meanings associated with those levels. Educators and parents can use
proficiency level information to help plan individual instructional goals for the student.
ILEARN, I AM, ISTEP+, and IREAD-3 assessments each have a slightly different
purpose, so the proficiency levels for each assessment vary.
ILEARN
IDOE convened a committee of Indiana stakeholders in May 2018 to determine the
proficiency levels for ILEARN. Stakeholders determined that four proficiency levels were
appropriate for the ILEARN grade-level assessments and Biology End-of-Course
Assessment (ECA). These four proficiency levels demonstrate the varying levels of
proficiency a student can achieve and indicate whether a student is on track for college-
and career-readiness. The committee agreed to have two proficiency levels (Below
Proficiency and Approaching Proficiency) to describe students who were not yet
11proficient. These levels illustrate both a student’s current knowledge and the
instructional support that a student needs to demonstrate proficiency. The committee
also determined two proficiency levels (At Proficiency and Above Proficiency) to
describe proficient students. Students who are At Proficiency have mastered grade-
level standards and are on track to be college- and career-ready. Students who are
Above Proficiency have a more complex understanding of knowledge and skills and are
also on track for college- and career-readiness.
In February 2019, a group of Indiana stakeholders convened to determine the
proficiency levels for the ILEARN U.S. Government ECA. The ILEARN U.S.
Government ECA is an optional assessment. Students achieve an At Proficiency or
Below Proficiency level of performance. The description of each ILEARN proficiency
level is included in Table 6 below and on IDOE's website.
Table 6: ILEARN Proficiency Levels
ILEARN Proficiency Levels
Proficiency Level Description
Indiana students below proficiency have not met current grade level
Level 1:
standards. Students may require significant support to develop the
Below
knowledge, application, and analytical skills needed to be on track for
Proficiency
college and career readiness.
Indiana students approaching proficiency have nearly met current grade
Level 2:
level standards by demonstrating some basic knowledge, application,
Approaching
and limited analytical skills. Students may require support to be on track
Proficiency
for college and career readiness.
Indiana students at proficiency have met current grade level standards
Level 3:
by demonstrating essential knowledge, application, and analytical skills
At Proficiency
to be on track for college and career readiness.
Level 4: Indiana students above proficiency have mastered current grade level
Above standards by demonstrating more complex knowledge, application, and
Proficiency analytical skills to be on track for college and career readiness.
I AM
IDOE convened a committee of Indiana stakeholders in August 2018 to determine the
proficiency levels for I AM. The stakeholders determined that the number of proficiency
levels for I AM would be different from the number for ILEARN. The goal of proficiency
in ILEARN is college- and career-readiness, while the goal of proficiency in I AM is to be
on track for post-secondary education or competitive integrated employment. The
stakeholders recommended three proficiency levels for I AM – Below Proficiency,
Approaching Proficiency, and At Proficiency. They determined that only one proficiency
level was required to describe whether the student was proficient. They also determined
that two proficiency levels below proficiency would allow parents and educators to gain
more specific information about students who are not meeting proficiency levels. Table
7 and IDOE's website include information on how these levels are defined.
12Table 7: I AM Proficiency Levels
I AM Proficiency Levels
Proficiency Level Description
Indiana students below proficiency have not met current grade level
Level 1:
Content Connectors. Students may require significant support to develop
Below
the knowledge, application, and skills to be on track for post-secondary
Proficiency
education or competitive integrated employment.
Indiana students approaching proficiency have nearly met current grade
Level 2:
level Content Connectors by demonstrating some basic knowledge,
Approaching
application, and skills. Students may require support to be on track for
Proficiency
post-secondary education or competitive integrated employment.
Indiana students at proficiency have met current grade level Content
Level 3: Connectors by demonstrating essential knowledge, application, and skills
At Proficiency to be on track for post-secondary education or competitive integrated
employment.
ISTEP+
ISTEP+ proficiency levels are also connected to the test’s purpose. ISTEP+ is a
Graduation Qualifying Examination (GQE). Parents can find information on Indiana high
school graduation requirements on IDOE's website. Students in cohorts 2019 through
2022 are required to pass this assessment to fulfill their high school graduation
requirements. Students who achieve Pass or Pass+ meet the graduation requirement.
Students who achieve Did Not Pass should receive extra support and remediation from
their school and may participate in retest opportunities as needed. Table 8 and IDOE’s
website includes information on Did Not Pass, Pass, and Pass + proficiency levels for
ELA and Mathematics.
13Table 8: ISTEP+ Proficiency Levels
ISTEP+ Proficiency Levels
Proficiency Level Subject Area Description
Tenth grade students performing at the Did Not Pass level
demonstrate limited understanding when reading,
comparing, and responding to a range of grade-level
ELA appropriate texts, including literature and nonfiction.
Students display limited writing skills using basic,
appropriate Standard English conventions when producing
different writing forms.
Did Not Pass students demonstrate limited mathematical
and problem-solving skills. Students may have difficulty
Did Not Pass when solving problems with linear and compound
inequalities, quadratics, and systems of equations, and the
complexity of algebra may be an obstacle for Did Not Pass
students. Also, math topics including geometry,
Mathematics measurement, data analysis, and statistics can be
stumbling blocks for students. Did Not Pass students may
have difficulty making decisions about how to approach
problem-solving situations, how to communicate their
ideas, and how to apply mathematical knowledge to other
situations.
Tenth grade students performing at the Pass level
demonstrate proficient understanding when reading,
comparing, and responding to a range of grade-level
ELA appropriate texts, including literature and nonfiction.
Students display proficient writing skills using mostly
appropriate Standard English conventions when producing
different writing forms.
Pass students demonstrate proficient mathematical and
problem-solving skills. Students are capable of solving
Pass
problems with linear and compound inequalities,
quadratics, and systems of equations, and they are
competent in the areas of geometry, measurement, data
Mathematics analysis, and statistics. Pass students are skilled with
algebra concepts, such as writing and solving linear,
exponential and quadratic equations. Pass students
experience success when solving problems,
communicating ideas, and applying mathematical
knowledge to a variety of situations.
14ISTEP+ Grade 10 Proficiency Levels
Proficiency Level Subject Area Description
Tenth grade students performing at the Pass+ level
demonstrate advanced understanding when reading,
comparing, and responding to a range of grade-level
ELA appropriate texts, including literature and nonfiction.
Students display advanced writing skills using appropriate
Standard English conventions when producing different
writing forms.
Pass+ students demonstrate advanced mathematical and
problem-solving skills. Students solve multi-step problems
Pass+
with rational and irrational numbers, exponents, and
square roots and demonstrate knowledge in the areas of
geometry, measurement, data analysis, statistics, and
Mathematics probability. Pass+ students display highly developed skills
with algebra concepts and functions, including writing and
solving linear and compound inequalities, quadratics, and
systems of linear equations. Pass+ students solve
sophisticated problems, support their solutions, and
generalize the results to other situations.
IREAD-3
The purpose of IREAD-3 is to determine whether a student is proficient in foundational
reading standards through grade 3. IREAD-3 has two proficiency levels: Pass and Did
Not Pass. Table 9 includes information on how these proficiency levels are defined.
IDOE issued guidance regarding the retention of a student that does not pass IREAD-3
prior to a student’s projected grade 4 year for parents and educators.
Table 9: IREAD-3 Proficiency Levels
IREAD-3 Proficiency Levels
Proficiency Level Description
Students demonstrate limited understanding when reading and
responding to grade-level literary and informational texts. Students have
Did Not Pass
difficulty identifying and comprehend new variations of word meaning
and new text-based vocabulary.
Students demonstrate proficient understanding when reading and
responding to grade-level literary and informational texts. Students
Pass
identify and comprehend most new variations of word meaning and new
text-based vocabulary.
Sample Reports
Table 10 shows the various reports that are available to parents and educators by
program. Schools distribute ISRs to families in a secure manner. Educators may access
ISRs, the Aggregate-Level Reporting Category Detail Report, the Aggregate-Level
15Subject Detail Report, the Aggregate-Level Standard Detail Report, the Student Roster
Subject Report, and the Student Roster Reporting Category/Strand Report.
Table 10: Reports Available to Parents/Guardians and Educators
ILEARN I AM ISTEP+ IREAD-3
Individual Score Reports
Aggregate-Level Reporting
Category/Strand Detail Report
Aggregate-Level Subject
Detail Report
Aggregate-Level Standard
Detail Report
Student Roster Subject Report
Student Roster Reporting
Category/Strand Report
The sections below provide an explanation of the various components included in the
ISRs and the other reports available in ORS.
Individual Score Reports
Interpretation of Individual Score Reports
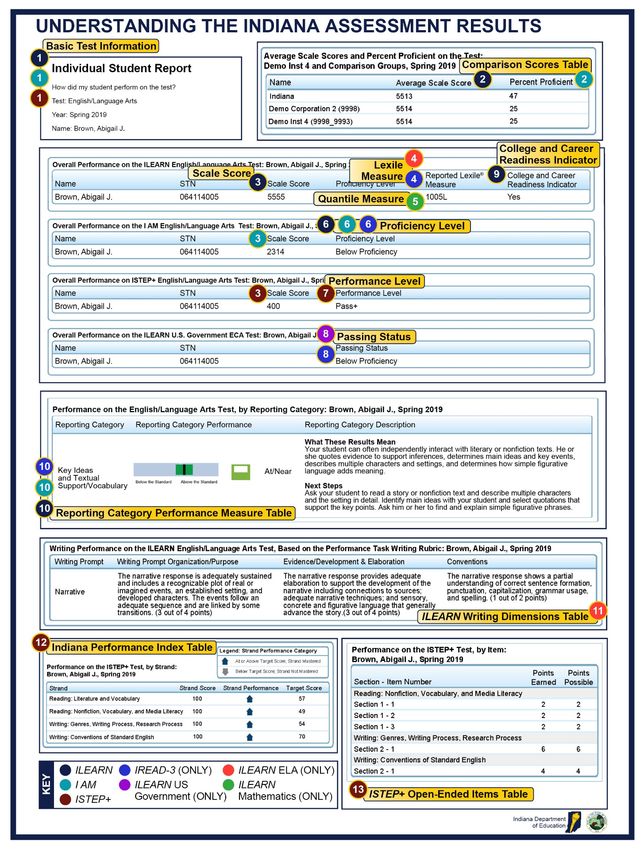
ISRs provide details about a student’s performance on an assessment. The information
included in a student’s ISR will vary based on the assessment and subject. Figure 4
includes the different sections of the ISR for each assessment.
16Figure 4: Individual Score Report Details
17Common Elements Across All Assessments
ILEARN, I AM, ISTEP+, and IREAD-3 ISRs include the following components that are
common across all assessments.
Basic Test Information
All Indiana ISRs include Basic Test Information. Basic Test Information includes the
student’s name, the student’s Student Testing Number (STN), the name of the
assessment, and the school year. Basic Test Information is indicated by numeral 1 in
Figure 4.
Proficiency Levels
All Indiana ISRs include the proficiency level related to the student’s score on the
assessments. Numerals 6, 7, and 8 in Figure 4 provide examples of how this
information appears on each assessment’s ISR. The Proficiency Levels section on page
11 provides more information on the proficiency levels for each assessment. The
proficiency level for ILEARN 3–8, ILEARN Biology ECA, and I AM assessments is
indicated by the heading, Proficiency Level. The proficiency level for ISTEP+ is
indicated by the heading, Performance Level. Performance Levels are discussed on
page 22. The proficiency level for IREAD-3 and ILEARN U.S. Government ECA is
indicated by the heading, Passing Status. This is discussed in the Passing Status
section on page 22.
Scale Scores
Each ISR includes a scale score. The scale score is indicated by numeral 3 in Figure 4.
Table 11, Table 12, Table 13, and Table 14 provide information on which proficiency
level is associated with which scale score range for ILEARN, I AM, ISTEP+, and
IREAD-3, respectively. Except for the ILEARN U.S Government ECA, ISRs for each
assessment include a scale score that is associated with the student’s proficiency level.
18ISRs for ILEARN 3–8, ILEARN Biology ECA, I AM, ISTEP+, and IREAD-3 also include a
bar graph that visually depicts the student’s scale score and proficiency level.
Table 11: ILEARN Scale Score Ranges
19Table 12: I AM Scale Score Ranges
Table 13: IREAD-3 Scale Score Ranges
20Table 14: ISTEP+ Scale Score Ranges
Reporting Category Performance Measure Table
ISRs provide detailed information about student performance within reporting
categories. Reporting categories represent groups of similar standards that are
assessed within each grade and subject. Test blueprints for each grade and subject lists
these reporting categories. Table 1 includes the location of the test blueprints for each
program.
There are a variety of ways to report reporting category scores as outlined in Table 15.
ILEARN uses a reporting category scale and SEM to determine a student's reporting
category performance level (e.g., Above, At/Near, Below). I AM and IREAD-3
assessments report percentage correct. Refer to numeral 10 in Figure 4. ISTEP+
assessments use the Indiana Performance Index (IPI) and an indication of Mastery.
Refer to numeral 12 in Figure 4. IPI is further discussed in the Indiana Performance
Index section on page 33.
Table 15: Reporting Category Score
Assessment Reporting Category Score
Reporting Category
ILEARN
Performance
I AM Percent Correct
IREAD-3 Percent Correct
ISTEP+ IPI and Indication of Mastery
There is a feature in ORS for students who take the ILEARN and I AM assessments
called Next Steps. Educators and parents may use the Next Steps feature to better
understand student test results and help further support their student. The Next Steps
information suggests activities educators and parents/guardians may do with their
student to help improve their student’s knowledge and performance on future
assessments.
ILEARN displays Next Steps information at the reporting category level. I AM displays
Next Steps information at the overall subject proficiency level. An example of an
ILEARN ELA Grade 6 Reporting Category and Next Steps is listed in Table 16.
21Table 16: Example of Reporting Category and Next Steps
Reporting Category Next Steps
Ask your student to read a story or
nonfiction text and explain how the
author develops central ideas, events,
Key Ideas and Textual
and characters. Ask your student to
Support/Vocabulary
determine the meaning of unfamiliar
words and discuss how specific words
and phrases shape the text.
Other Considerations
There are additional elements on some student ISRs that apply only to certain
assessments. Additional information is available below.
Passing Status
ISRs for ILEARN U.S. Government ECA and IREAD-3 indicate a student’s passing
status. Numeral 8 in Figure 4 provides an example on how Passing Status appears on
an ISR. A single cut score will determine if the student passed or did not pass. A cut
score is the lowest possible score on a standardized test that a student must earn to
either pass or be considered proficient.
For ILEARN U.S Government ECA, a student will be designated as either Below
Proficiency or At Proficiency. ILEARN U.S. Government ECA is an optional assessment
that students can take after completing their U.S. Government course. Some schools
use student assessment results to determine a student’s final course grade.
For IREAD-3, a student will be designated as either Pass or Did Not Pass. All grade 3
students enrolled in accredited public and non-public schools are required to pass
IREAD-3 per Indiana state legislation. Students can retake the assessment in grades 4
or 5 if they do not pass in grade 3.
Performance Level
There are three PLDs for ISTEP+ that indicate how a student performed on the
assessment: Pass+, Pass, and Did Not Pass. The performance level indicates where
the student is categorized based on the student overall scale score. Refer to numeral 7
in Figure 4 for an example on how performance level appears on an ISR. The cut score
for the Pass performance level represents the point on the scale that a student is
considered proficient. Students have met proficiency if they are categorized as Pass+ or
Pass. Additional information about PLDs and examples at each level can found on
IDOE's website.
Lexile® Measure
ILEARN ELA student ISRs include information on student Lexile® measures. Numeral 4
in Figure 4 provides an example on how the Lexile® measure appears on an ISR.
22A Lexile® measure is a single score followed by the letter L. For example, a grade 4
student will receive a Lexile® measure in the range of BR140L–1300L. This score
reflects a student’s reading ability and the text complexity of different reading materials.
Educators may use this score to match students with appropriate texts to ensure
academic growth and success. This score can also help educators identify areas where
a student might be struggling and need additional support. Educators and parents can
track a student’s Lexile® score from grade 3 through ILEARN grade 8 to ensure that the
student is growing academically and on a path for college- and career-readiness.
Lexiles® are also used for Spring and Summer IREAD-3 reporting for students with the
proficiency level, Did Not Pass. Lexiles® are not available for Fall IREAD-3.
Quantile® Measure
ILEARN Mathematics student ISRs include Quantile® measures. Numeral 5 in Figure 4
provides an example of how the Quantile® measure appears on the ISR. A Quantile®
measure is a single score indicated by a number followed by the letter Q. For example,
a grade 8 student will receive a Quantile® measure in the range of 55Q–1450Q.
Quantile measures span from kindergarten to high school and are available for ILEARN
Mathematics assessments only.
A Quantile® score reflects a student’s mathematical achievement. This score can help
educators determine which skills and concepts a student is ready to learn. It can also
assist educators in determining the level of success the student is expected to have with
an upcoming mathematical skill. This score can also identify any educational or learning
gaps in a student’s learning to ensure instruction can be provided to support student
growth. It will also reflect how the student is growing in mathematical knowledge on a
single scale across grade levels.
Comparison Scores Table
ILEARN and I AM student ISRs include a comparison table. Numeral 2 in Figure 4
provides an example on how the comparison scores table appears on an ISR. The
comparison scores table shows average scale scores at the school, corporation, and
state levels for all ILEARN assessments, except U.S. Government ECA. For ILEARN
U.S. Government ECA, the comparison scores table shows the number of students that
participated in the assessment at the school, corporation, and state levels. For I AM, the
table shows the percentage of students who are performing At Proficiency at the school,
corporation, and state levels. Educators and parents can use this data to compare their
students’ results to other students in their school, corporation, or state once final.
Hand-scored Open-ended Items and Condition Codes
ILEARN and ISTEP+ assessments contain test items that have open-ended responses.
These items allow a student to provide a short answer containing several lines of text,
or an essay answer containing several paragraphs of text. These items are hand-scored
by human scorers prior to score reporting.
23Hand-scorers use a combination of scoring tools and resources to ensure they assign
correct and consistent scores during the hand-scoring process. These resources
include item anchor sets, practice sets, and qualification sets.
Anchor sets are examples of previously scored student responses. The scored
responses are accompanied by notes from the hand-scoring leaders that explain the
reasoning behind the given score. Hand-scorers use these examples during training
and while scoring student responses. Anchor sets show hand-scorers why a student
response received the score it did and aid them in making decisions about other student
responses they will score.
After the hand-scorers have reviewed the anchor sets, they review the practice sets. A
practice set is a set of student responses that help the hand-scorers apply the scoring
rules illustrated in the anchor sets. Hand-scorers practice scoring on these student
responses to confirm their understanding of the scoring rules. After the hand-scorers
determine scores for each item in the practice set, they are provided with the correct
score for each response and the reasoning for the score.
Finally, hand-scorers complete a qualification set which will ‘qualify’ each of them to be
a hand-scorer. Like a practice set, a qualification set consists of a set of student
responses. A qualification set is used to assess the hand-scorers’ understanding of the
scoring rules before they can begin live-scoring student responses. After hand-scorers
have reviewed and discussed the practice set, they take two qualification sets to ensure
they understand the scoring rubric.
In most instances, a student will receive a numeric score on an assessment item.
However, there are some instances in which a student might receive a condition code
instead of a numeric score on a hand-scored item. These codes are assigned to
responses that do not meet the scoring rules or criteria for a numeric score. For
example, a student response that is blank would receive a specific condition code for
blank responses. Table 17 and Table 18 provide information on the condition codes for
both ILEARN and ISTEP+.
Table 17: ILEARN Condition Codes
ILEARN Condition Codes
Value Description
B Blank Essay, Not Tested (e.g., no response, erased,
refusal)
I Insufficient / Copied from text
L Non-scorable language
T Off topic (essay only)
M Off purpose (essay only)
X Illegible
24Table 18: ISTEP+ Condition Codes
ISTEP+ Condition Codes
Value Description
A Blank/No Response/Refusal
B Illegible
C Written predominately in language other than English
D Insufficient Response/Copied from text
E Response not related to test questions or scoring rules
ILEARN Writing Dimensions
The writing component of the ILEARN ELA assessment is scored based on the
Performance Task (PT) writing rubric for each criterion. Numeral 11 in Figure 4 provides
an example on how writing dimension scores appear on the ISR. Each student
completes one writing prompt as the final question in a PT. Students will engage in one
of the following writing types: Narrative Writing (grades 3–8), Informative Writing
(grades 3–5), Persuasive Writing (grades 3–5), Explanatory Writing (grades 6–8), or
Argumentative Writing (grades 6–8). Each writing type is scored using a writing rubric
specific to the writing type, as illustrated in the tables below. For more information on
each rubric, please visit IDOE's website.
Table 19: ILEARN Narrative Writing Rubric
ILEARN Narrative PT Writing Rubric (Grades 3–8)
Organization/Purpose
The organization of the narrative, real or imagined, is fully sustained and the focus is clear
4 points and maintained throughout.
The organization of the narrative, real or imagined, is adequately sustained, and the focus
3 points is adequate and generally maintained.
The organization of the narrative, real or imagined, is somewhat sustained and may have
2 points an uneven focus.
The organization of the narrative, real or imagined, may be maintained but may provide little
1 point or no focus.
• Insufficient (includes copied text)
• In a language other than English
NS
• Off-topic
• Off-purpose
Development/Elaboration
The narrative, real or imagined, provides thorough, effective elaboration using relevant
4 points details, dialogue, and/or description.
The narrative, real or imagined, provides adequate elaboration using details, dialogue, and/or
3 points description.
The narrative, real or imagined, provides uneven, cursory elaboration using partial and
2 points uneven details, dialogue, and/or description.
25ILEARN Narrative PT Writing Rubric (Grades 3–8)
Organization/Purpose
The narrative, real or imagined, provides minimal elaboration using few or no details,
1 point dialogue, and/or description.
• Insufficient (includes copied text)
• In a language other than English
NS
• Off-topic
• Off-purpose
Conventions
2 points The response demonstrates an adequate command of conventions.
1 point The response demonstrates a partial command of conventions.
0 points The response demonstrates little or no command of conventions.
• Insufficient (includes copied text)
• In a language other than English
NS
• Off-topic
• Off-purpose
Table 20: ILEARN Informative Writing Rubric
ILEARN Informative PT Writing Rubric (Grades 3–5)
Organization/Purpose
The response has a clear and effective organizational structure, creating a sense of unity
4 points and completeness. The organization is sustained between and within paragraphs. The
response is consistently and purposefully focused.
The response has an evident organizational structure and a sense of completeness.
Though there may be minor flaws, they do not interfere with the overall coherence. The
3 points organization is adequately sustained between and within paragraphs. The response is
generally focused.
The response has an inconsistent organizational structure. Some flaws are evident, and
2 points some ideas may be loosely connected. The organization is somewhat sustained between
and within paragraphs. The response may have a minor drift in focus.
The response has little or no discernible organizational structure. The response may be
1 point related to the topic but may provide little or no focus.
• Insufficient (includes copied text)
• In a language other than English
NS
• Off-topic
• Off-purpose
Evidence/Elaboration
The response provides thorough elaboration of the support/evidence for the controlling/main
4 points idea that includes the effective use of source material. The response clearly and effectively
develops ideas, using precise language.
The response provides adequate elaboration of the support/evidence for the controlling/main
3 points idea that includes the use of source material. The response adequately develops ideas,
employing a mix of precise and more general language.
The response provides uneven, cursory elaboration of the support/evidence for the
2 points controlling/main idea that includes uneven or limited use of source material. The response
develops ideas unevenly, using simplistic language.
26ILEARN Informative PT Writing Rubric (Grades 3–5)
Evidence/Elaboration
The response provides minimal elaboration of the support/evidence for the controlling/main
1 point idea that includes little or no use of source material. The response is vague, lacks clarity, or
is confusing.
• Insufficient (includes copied text)
• In a language other than English
NS
• Off-topic
• Off-purpose
Conventions
2 points The response demonstrates an adequate command of conventions.
1 point The response demonstrates a partial command of conventions.
0 points The response demonstrates little or no command of conventions.
• Insufficient (includes copied text)
• In a language other than English
NS
• Off-topic
• Off-purpose
Table 21: ILEARN Persuasive Writing Rubric
ILEARN Persuasive PT Writing Rubric (Grades 3–5)
Organization/Purpose
The response has a clear and effective organizational structure, creating a sense of unity
4 points and completeness. The organization is sustained between and within paragraphs. The
response is consistently and purposefully focused.
The response has an evident organizational structure and a sense of completeness.
Though there may be minor flaws, they do not interfere with the overall coherence. The
3 points organization is adequately sustained between and within paragraphs. The response is
generally focused.
The response has an inconsistent organizational structure. Some flaws are evident, and
2 points some ideas may be loosely connected. The organization is somewhat sustained between
and within paragraphs. The response may have a minor drift in focus.
The response has little or no discernible organizational structure. The response may be
1 point related to the opinion but may provide little or no focus.
• Insufficient (includes copied text)
• In a language other than English
NS
• Off-topic
• Off-purpose
Evidence/Elaboration
The response provides thorough and convincing elaboration of the support/evidence for
4 points the opinion and supporting idea(s) that includes the effective use of source material. The
response clearly and effectively develops ideas, using precise language.
The response provides adequate elaboration of the support/evidence for the opinion and
3 points supporting idea(s) that includes the use of source material. The response adequately
develops ideas, employing a mix of precise with more general language.
The response provides uneven, cursory elaboration of the support/evidence for the opinion
2 points and supporting idea(s) that includes partial or uneven use of source material. The response
develops ideas unevenly, using simplistic language.
27You can also read